")
Back to Journals » Diabetes, Metabolic Syndrome and Obesity » Volume 16
Associations Between Serum Folate Level and HOMA-IR in Chinese Patients with Type 2 Diabetes Mellitus
Authors Yang X, Hu R , Wang Z, Hou Y , Song G
Received 13 March 2023
Accepted for publication 2 May 2023
Published 19 May 2023 Volume 2023:16 Pages 1481—1491
DOI https://doi.org/10.2147/DMSO.S409291
Checked for plagiarism Yes
Review by Single anonymous peer review
Peer reviewer comments 2
Editor who approved publication: Prof. Dr. Antonio Brunetti
Xiaoyue Yang,1 Rui Hu,1 Zhen Wang,1 Yilin Hou,1 Guangyao Song1,2
1Department of Internal Medicine, Hebei Medical University, Shijiazhuang, Hebei, 050017, People’s Republic of China; 2Endocrinology Department, Hebei General Hospital, Shijiazhuang, Hebei, 050051, People’s Republic of China
Correspondence: Guangyao Song, Endocrinology Department, Hebei General Hospital, 361 Zhongshan East Road, Shijiazhuang, People’s Republic of China, Tel +86 13930119808, Email [email protected]
Background: Adequate intake of folic acid (FA) has been proven essential for metabolism, cellular homeostasis, and antioxidant effects in diabetic patients. Our aim was to evaluate the association between serum folate levels and the risk of insulin resistance in patients with type 2 diabetes mellitus (T2DM) and to provide new ideas and approaches for reducing the risk of T2DM.
Methods: This was a case–control study involving 412 participants (206 with T2DM). Anthropometric parameters, islet function, biochemical parameters and body composition of T2DM group and control group were determined. Correlation analysis and logistic regression were used to evaluate the risk factors associated with the onset of insulin resistance in T2DM.
Results: The folate levels in type 2 diabetic patients with insulin resistance were significantly lower than those in patients without insulin resistance. Logistic regression showed that FA and high-density lipoprotein were independent influencing factors for insulin resistance in diabetic patients (P < 0.05). After adjusting for confounding factors, the degree of insulin resistance in diabetic patients was in a significant inverse relationship with folate levels (P< 0.05). We also found that below the serum FA threshold of 7.09 ng/mL insulin resistance was significantly more elevated.
Conclusion: Our findings suggest that the risk of insulin resistance increases with the decrease in serum FA levels in T2DM patients. Monitoring folate levels in these patients and FA supplementation are warranted preventive measures.
Keywords: folic acid, type 2 diabetes mellitus, insulin resistance, Chinese
Plain Language Summary
Folic acid, as an important nutrient, plays an important role in human health. This paper explains the mechanism and role of folic acid in insulin resistance in type 2 diabetes, which is mainly caused by oxidative stress induced by high homocysteine induced by FA deficiency. This paper highlights the correlation between serum folic acid levels and the risk of insulin resistance in Chinese type 2 diabetic patients and explores the factors influencing the development of insulin resistance. This study further describe the correlation between folate levels and the tendency to develop insulin resistance in patients with T2DM, insulin resistance was significantly elevated below the serum FA threshold of 7.09 ng/mL. Therefore, our results suggest that monitoring folate levels and supplementation of FA in type 2 diabetic patients is warranted.
Introduction
A recent epidemiological study1 shows that approximately 10% of the adults worldwide have diabetes, of whom 90% have type 2 diabetes mellitus (T2DM), and Asia is an important locus of the so-called T2DM epidemic. Risk factors driving the prevalence of T2DM mainly include obesity, smoking, sedentary lifestyle2 and unhealthy dietary patterns such as long-term consumption of high-calorie foods.3 Folic acid (FA), an essential nutrient, has been linked to the risk of type 2 diabetes in several previous studies.4 At present, the proven pathogenesis of T2DM mainly includes insulin deficiency and insulin resistance caused by islet β-cell defects.5 Insulin resistance, commonly defined as reduced sensitivity and responsiveness of islet β-cell-mediated glucose metabolism, inhibits hepatic glucose conversion to proglucagon and plays an important pathophysiological role in the pathogenesis of T2DM.6 It is commonly associated with visceral fat content, glucose intolerance, chronic blood pressure, dyslipidemia, endothelial dysfunction, and certain inflammatory markers. Insulin resistance seriously affects the normal ability of the body to absorb and store glucose and triglycerides, resulting in long-term high levels of glucose and triglycerides in the blood circulation,7,8 which significantly increases the incidence of macrovascular and microvascular lesions in diabetic patients. In addition, the loss of muscle strength caused by long-term insulin resistance is also an important factor in the physical limitation and disability of diabetic patients.9,10 A meta-analysis by Schellenberg11 suggested that management strategies for T2DM, such as a healthy lifestyle and moderate folate supplementation, significantly reduced the incidence of diabetes complications. Therefore, it is necessary to further explore the role of folate in the risk of insulin resistance in T2DM.
Vitamin B9, also known as folic acid (FA), is widely found in green vegetables, beans, nuts and animal tissues, and its deficiency has been linked to conditions such as megaloblastemia, neural tube defects, cardiovascular disease, cancer and Alzheimer’s. The 2017 Food Fortification Initiative report lists 86 countries that mandate FA fortification.12 As a coenzyme of the one-carbon unit transferase system in biochemical reactions in vivo, FA plays the role of one-carbon unit transmitter, participates in amino acid metabolism, and is an important cofactor for the conversion of homocysteine (Hcy) to methionine.13 Several previous studies have demonstrated that elevated levels of Hcy also lead to significantly increased risks of cardiovascular disease, nephropathy and retinopathy associated with diabetes mellitus,14,15 which is mainly related to the adverse effects of Hcy on endothelial cells through oxidative stress-mediated inflammatory mechanisms.16 Deficiency of folate levels in humans may therefore increase the risk of T2DM and its microvascular complications. Omid and Lind meta-analyses17,18 both showed that moderate FA supplementation improved glycemic control and insulin resistance by reducing homocysteinemia in type 2 diabetic patients. In addition, an experimental animal study showed that moderate FA supplementation improved insulin resistance in high-fat diet-fed mice by altering the deoxyribonucleic acid (DNA) methylation profile.19 Therefore, FA supplementation may be a feasible and cost-effective intervention for the prevention and treatment of diabetes. This study evaluated the association between serum folate levels and the risk of insulin resistance in T2DM, and provided new ideas and approaches for reducing the risk of T2DM.
Methods
Selection and Recruitment of Participants
A total of 206 diabetic patients who were hospitalized in the Department of Endocrinology of Hebei Provincial People’s Hospital from 2020 to 2022 were recruited as the T2DM group, and a total of 206 patients without T2DM who were admitted to the Physical Examination Center of Hebei Provincial People’s Hospital during the same period were selected as the control group. Ethical approval was obtained from the Ethics Committee of Hebei Provincial People’s Hospital and all participants signed written informed consent (Ethics registration number: 2023020). Diabetic patients were eligible to meet the the 1999 WHO diagnostic criteria20 for diabetes: Typical diabetes symptoms plus random blood glucose ≥11.1mmol/L, or typical diabetes symptoms plus fasting blood glucose (FBG) ≥7.0mmol/L, or typical diabetes symptoms plus oral glucose tolerance test (OGTT) 2-hour blood glucose ≥ 11.1mmol/L, or classic glucuria symptoms plus glycosylated hemoglobin (HbA1c) ≥6.5%. If there are no classic symptoms of diabetes, the above tests should be repeated to confirm the diagnosis of diabetes. We used the previous medical records of the participants to eliminate people who did not meet the criteria. Exclusion criteria were as follows: 1) Other types of diabetes excluding type 2 diabetes, such as type 1 diabetes, special type diabetes, gestational diabetes; 2) Patients with acute complications of diabetes: such as diabetic ketoacidosis, hyperosmolar hyperglycemic coma or hypoglycemic coma; 3) Patients with severe heart, liver and kidney function impairment; 4) Patients with malignant tumor diseases; 5) Patients with severe neurological diseases or mental disorders; 6) Patients with folate, vitamin B and related vitamin B derivatives and compound preparations.
Data Collection
We used a questionnaire to ask patients about their basic information, including gender, age, duration of diabetes, past history, smoking history, and alcohol consumption were asked at the time of presentation. Weight, height, abdominal circumference (WC), systolic blood pressure (SBP) and diastolic blood pressure (DBP) were measured at the time of appointment and fasting.
Biochemical Analysis
All subjects included in this experiment were fasted for 8–12 hours, and venous blood was taken in the morning. Blood samples were stored in refrigerated containers, centrifuged within 1 hour after collection, and determined by HitWChi 7600 automatic biochemical analyzer from Hitachi. The detection indicators include FBG, fasting insulin (FINS), HbA1c, glualanine transaminase (ALT), glutenase transaminase (AST), total cholirubin (TBIL), direct bilirubin (DBIL), indirect bilirubin (IBIL), glomerular filtration rate (GFR), serum creatinine (Scr), serum uric acid (SUA), blood urea nitrogen (BUN), serum total protein (TP), serum albumin (ALB), hemoglobin (HB), total cholesterol (TC), triglyceride (TG), high-density lipoprotein cholesterol (HDL-C), low-density lipoprotein cholesterol (LDL-C), apolipoprotein B (ApoB), serum potassium (K), serum sodium (Na), serum calcium (Ca). Human serum folate blood samples were collected and stored in a refrigerator at −80°C until assay time, and were determined by liquid chromatography tandem mass spectrometry (LC-MS).
Define
We used the homeostasis Model Assessment of Insulin resistance (HOMA-IR index): HOMA-IR index = FBG ×FINS/22.5. The cut-off point of HOMA-IR value for defining insulin resistance was suggested to be 2.69, owing to a previous large Chinese study showed that the cut-off point of HOMA-IR value was more consistent with the diagnostic criteria of insulin resistance in Chinese patients with T2DM.21 Therefore, those with HOMA-IR score greater than 2.69 were defined as IR group, and those with HOMA-IR value less than 2.69 were defined as Non-IR group.
Data Analysis
We used SPSS 26.0 software for data analysis. The measurement data with normal distribution and approximate normal distribution were expressed as Mean± standard deviation (Mean±SD), and two independent sample t-test was used for comparison between the two groups. Skewed distribution data were represented by median and interquartile interval Median (P25, P75). Paired sample t-test was used for differences consistent with normal distribution, and Wilcoxon signed-rank sum test was used for inter-group analysis for differences not consistent with normal distribution. Enumeration data were expressed as percentages and analyzed by chi-square test. To further understand the relationship between serum folate and other indexes, Spearman correlation analysis was used to further evaluate the correlation between serum folate and other indexes.
Multiple logistic regression models were used to estimate the odds ratio (OR) and 95% confidence intervals (95% CI) of the relationship between insulin resistance and other indicators. Multiple logistic regression analysis was used to detect the related influencing factors of insulin resistance. When P < 0.05, it indicated that this index was an independent influencing factor of insulin resistance in type 2 diabetic patients. In addition, in order to better understand the risk of insulin resistance in diabetic patients under different serum folate concentrations, we divided the subjects into four groups according to the quartile of serum folate. The trend test was conducted with whether the diabetic patients had insulin resistance as the dependent variable and serum folate concentration as the independent variable. To visualize the relationship between serum folate concentration and glucose metabolism in diabetic patients. Using HOMA-IR, FBG and FINS as dependent variables respectively and serum folate concentration as independent variables, we fitted restricted cubic splines to test the nonlinear association between serum folate level and each index.
According to previous studies, folate levels in diabetic patients are influenced by a variety of factors. To investigate the complex interaction between serum FA levels and the risk of insulin resistance in T2DM, we performed regression analyses on three different models while adjusting for possible confounders to make the results more reliable. In the original model, we only included indicators with P < 0.1 in the basic factors into the multiple logistic regression model. In Model 1, age, gender, smoking history, drinking history and diabetes history were added on the basis of the original model to obtain further data results in the multiple logistic regression model. On the basis of Model 2, the effects of confounding factors such as TC, ApoB, ALB, HB and GFR were further corrected in model 3, which made the results more referable.
Results
A total of 412 patients were enrolled in this study, with an average age of 50.60±12.09. There were 202 females and 210 males, all of whom were Chinese. The results of data comparison between healthy control group and diabetic group showed that serum folate level in diabetic group was significantly lower than that in normal control group (7.07 (5.20, 10.64) vs 10.10 (6.70, 14.26), P < 0.001), this can be seen in Table 1. The serum folate level of IR group was significantly lower than that of Non-IR group, (5.92, 4.09, 9.02) vs 8.16 (6.33, 13.76), P < 0.001) and HDL (0.97 (0.87, 1.17) vs 1.11 (0.98, 1.30), P< 0.001), HbA1c (9.20 (7.50, 10.90) vs 10.30 (8.40, 11.60), P= 0.005). Fasting blood glucose in IR group was significantly higher than that in Non-IR group (6.47 (5.56, 7.66) vs 5.51 (4.74, 6.14), P<0.001) and FINS (9.88 (7.84, 16.51) vs 3.84 (2.04, 5.18), P<0.001), BMI (27.55 (24.77, 30.08) vs 25.53 (23.26, 27.61), P<0.001), WC (94.00 (86.80, 102.00) vs 91.00 (84.00, 99.00), P=0.034), TG (1.80 (1.21, 2.89) vs 1.47 (1.03, 2.39), P=0.011). (The results are shown in Table 2).
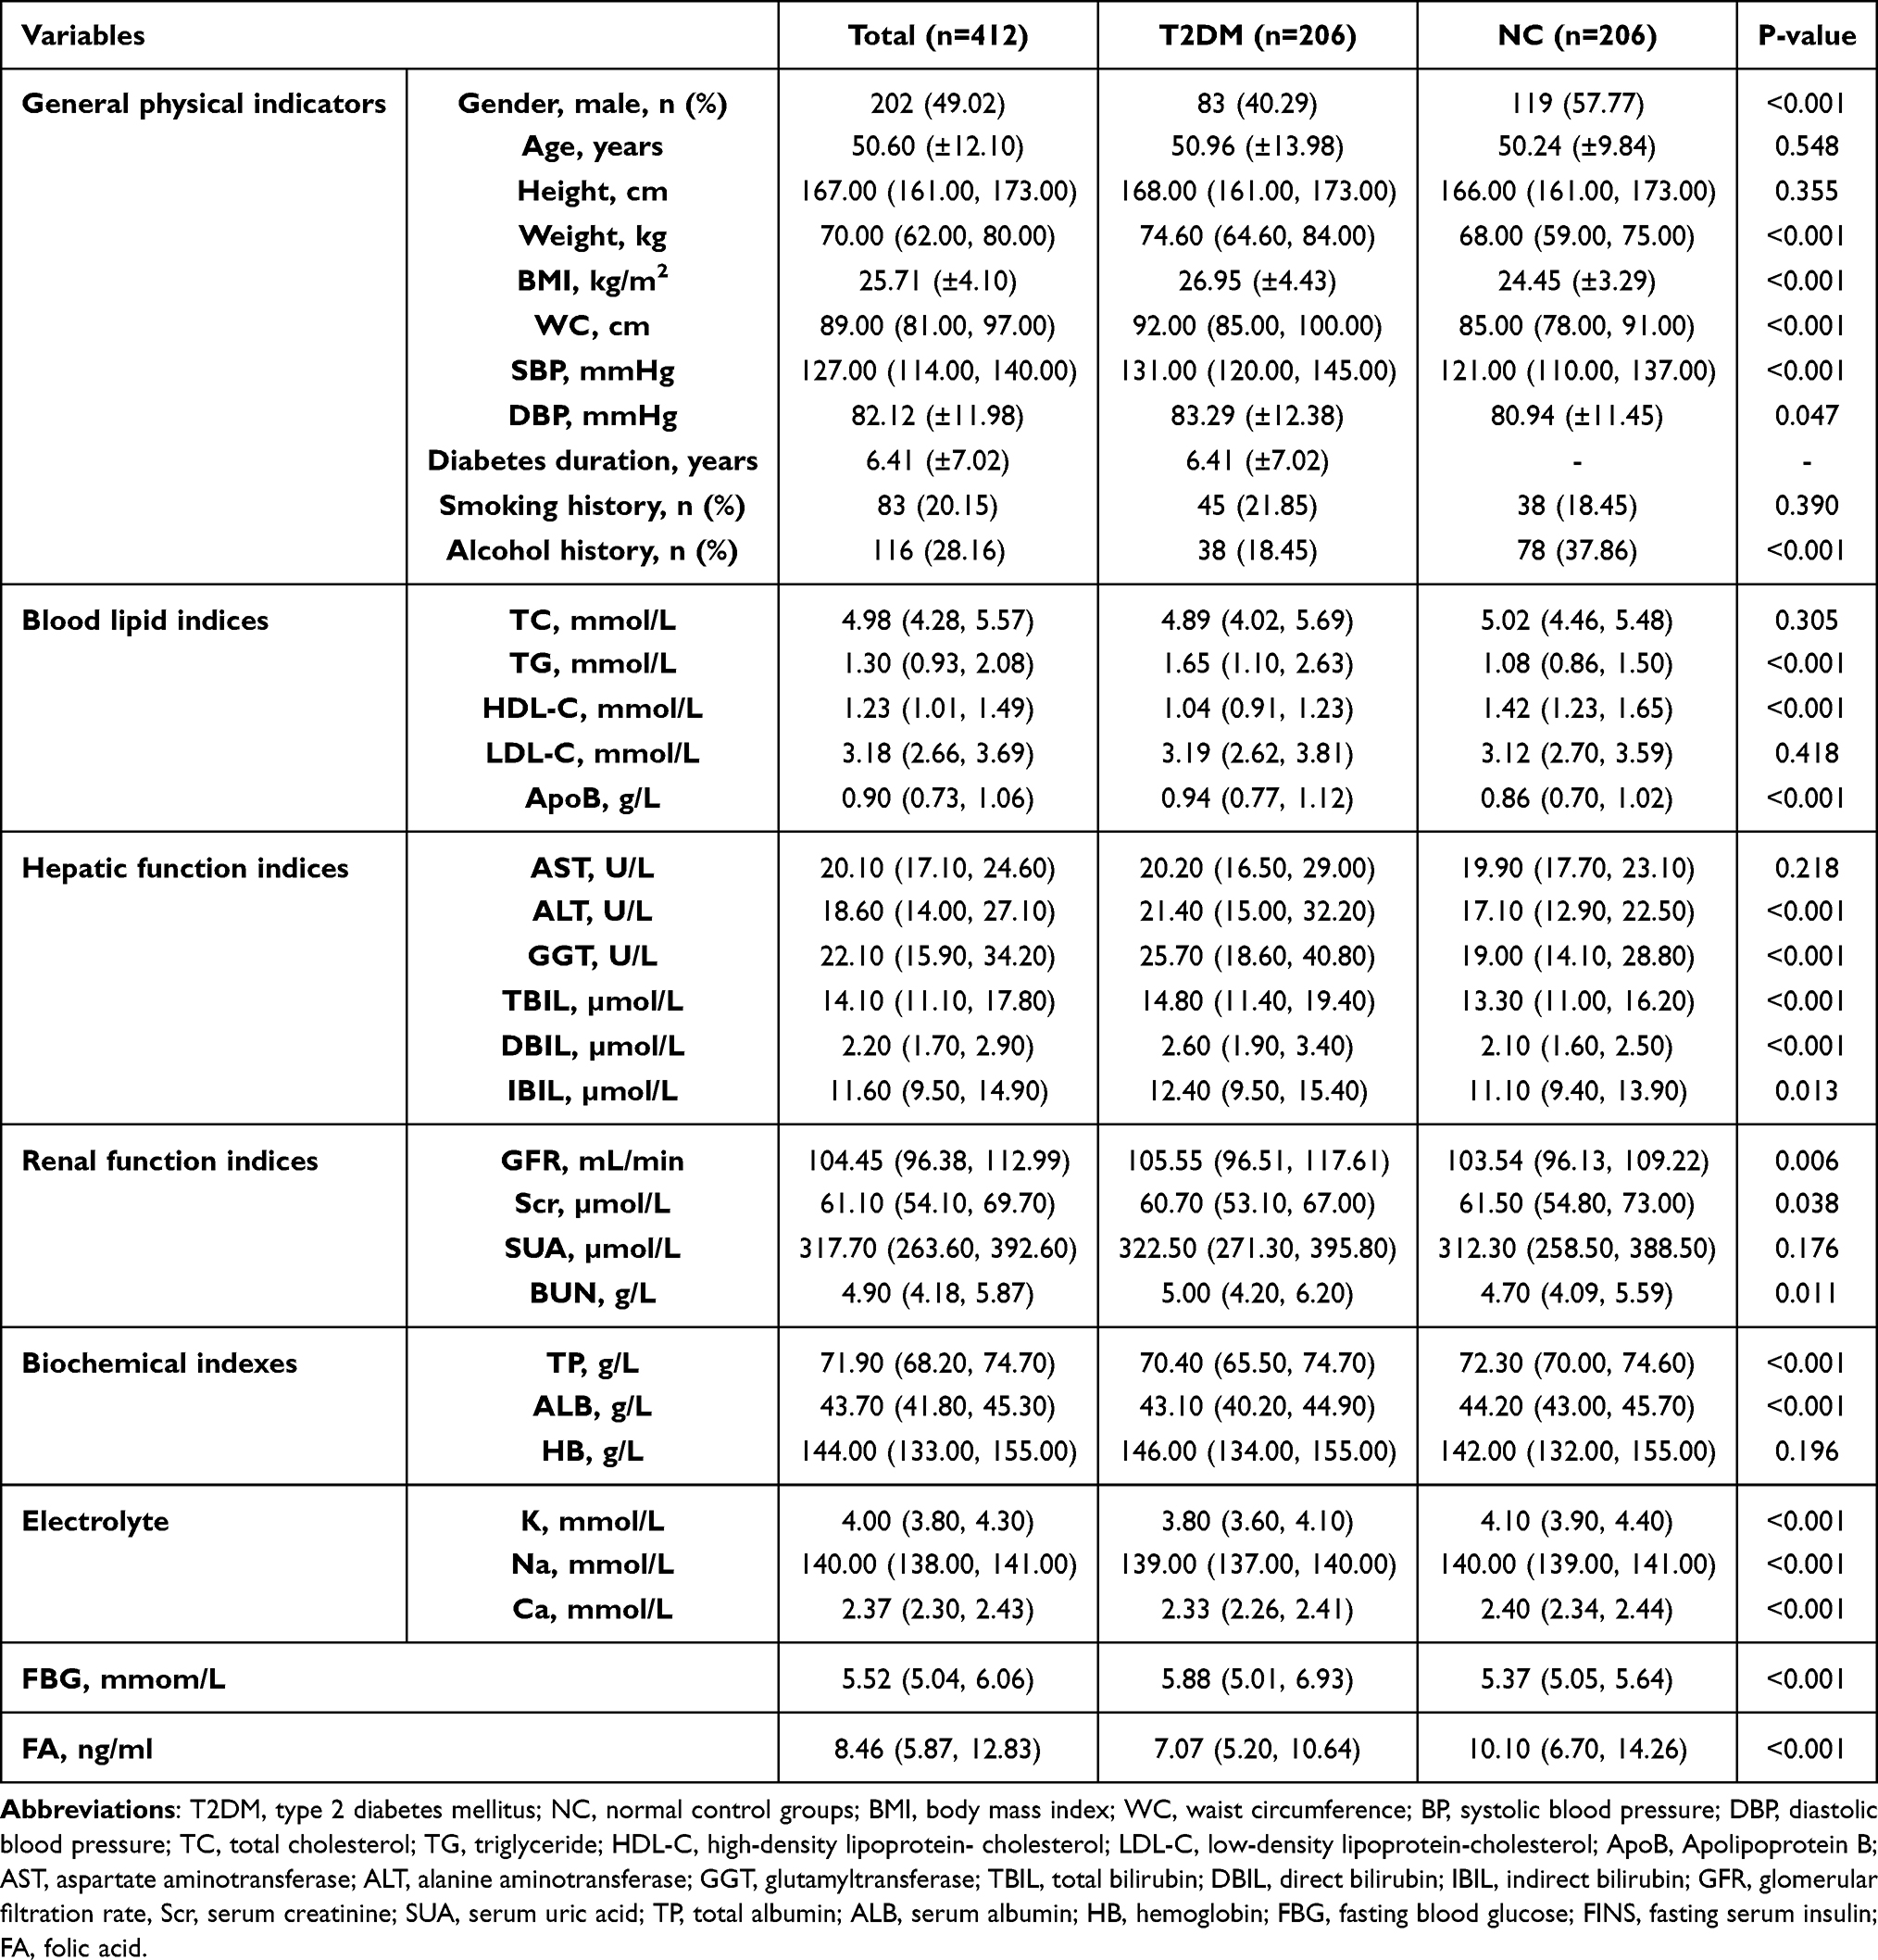 |
Table 1 Comparison of Baseline Data Between T2DM Group and NC Group |
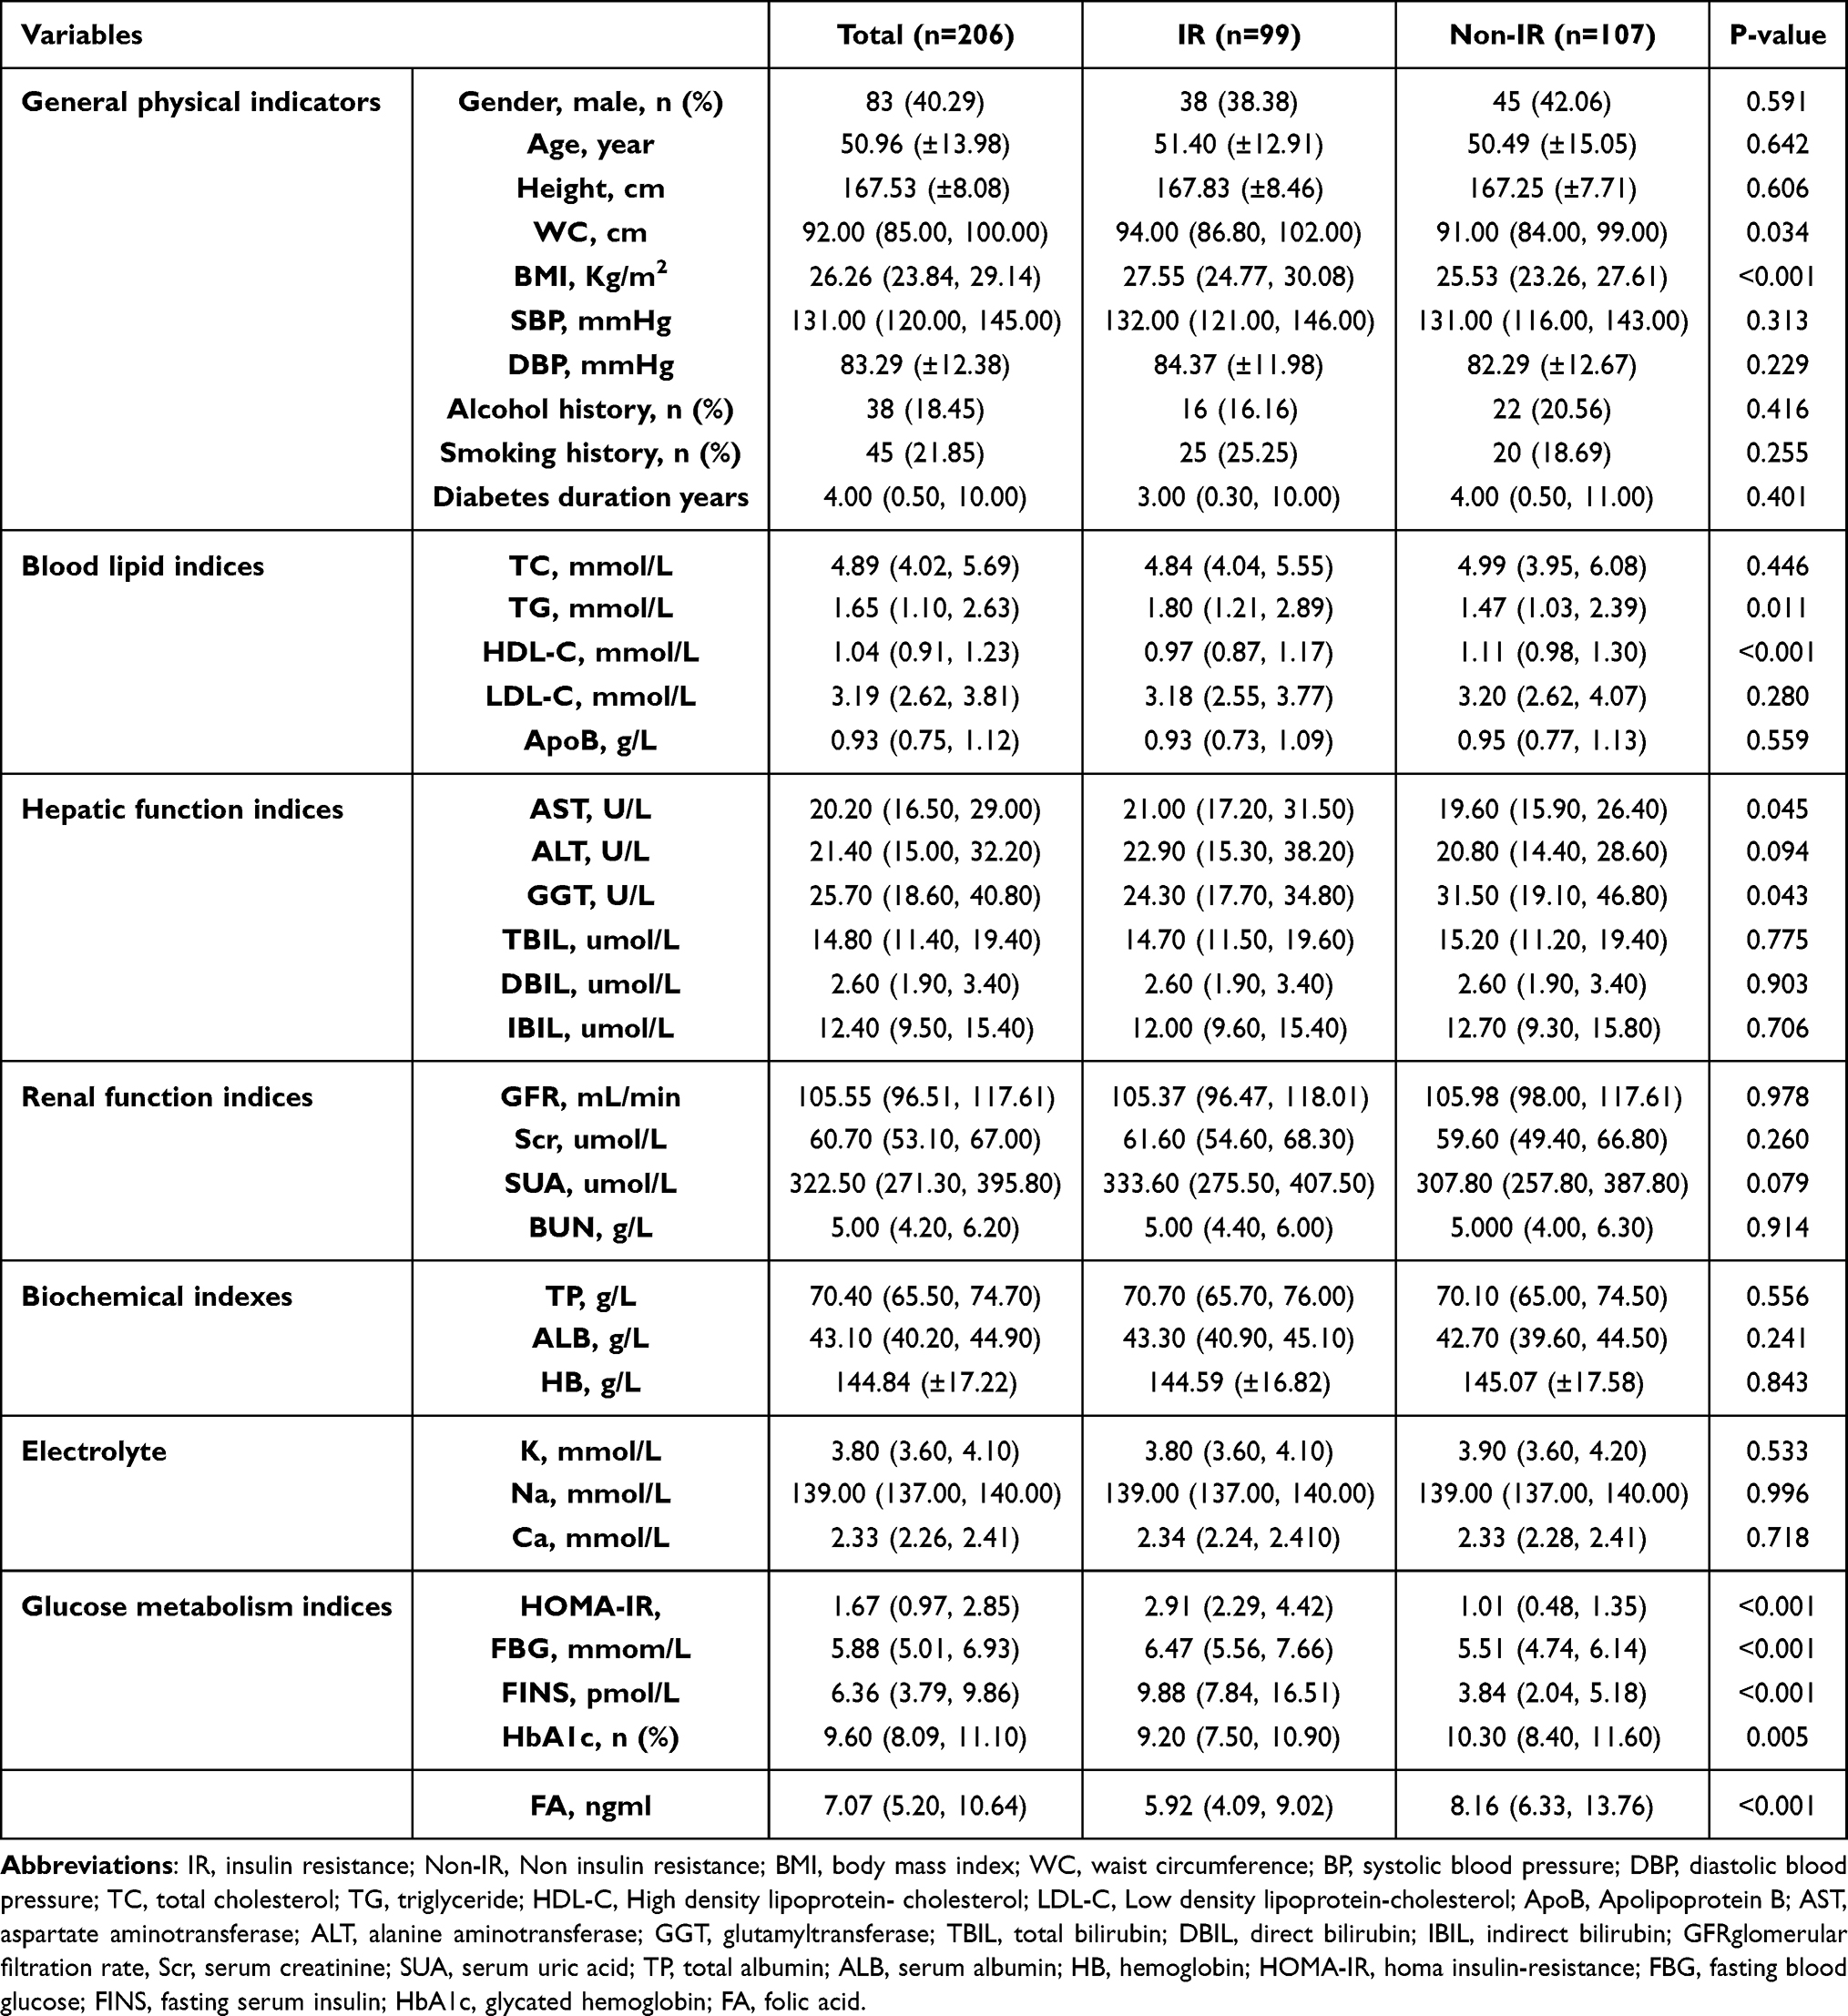 |
Table 2 Baseline Data of Patients with Type 2 Diabetes Mellitus in IR Group and Non-IR Group |
Spearman correlation coefficient was used to study the correlation between serum FA levels and other indicators. The results showed that serum folate was positively correlated with HDL-C, K and Ca (r = 0.176, 0.249, 0.171, respectively). P values were 0.011, <0.001, 0.014); It was negatively correlated with WC, BMI, smoking history, drinking history, TG, HB, Scr, SUA, FINS and HOMA-IR (r= −0.143, −0.233, −0.168, −0.158, −0.139, −0.143, −0.189, −0.198, −0.253, −0.249, respectively. P values were 0.040, < 0.001, 0.016, 0.023, 0.046, 0.041, 0.007, 0.004, < 0.001, < 0.001), and other indicators had no significant correlation. (The results are shown in Table 3).
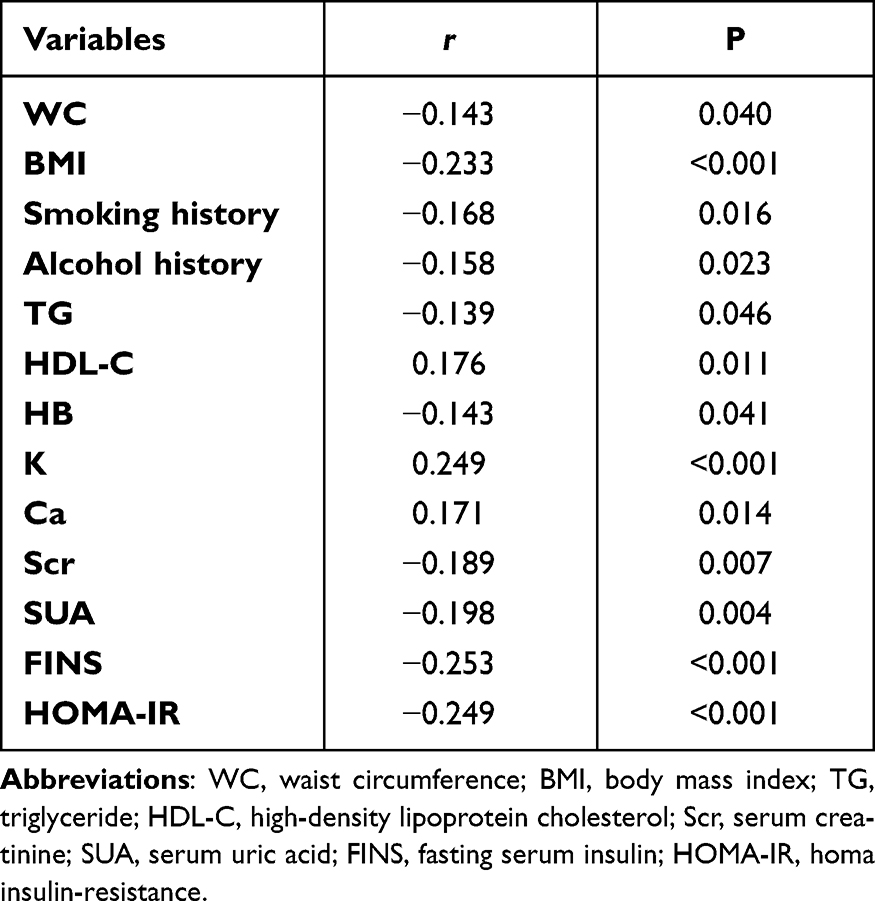 |
Table 3 Correlation Analysis Between Folic Acid and Other Indexes |
The results of multiple logistic regression showed that the original model took insulin resistance as the dependent variable, and the index with P < 0.1 in the basic data was used as the independent variable in the regression analysis. The results showed that serum FA levels were independent influencing factor of insulin resistance. Serum folate level was negatively correlated with insulin resistance (OR: 0.86 (0.76, 0.97), P=0.017). Multiple logistic results of Model 1 are shown that serum folate levels and HDL-C were independent influencing factors for insulin resistance. The levels of FA and HDL-C were negatively correlated with insulin resistance (FA: OR: 0.82 (0.72, 0.94), P=0.005; HDL-C: 0.08 (0.01, 0.71), P=0.024). Multiple logistic results of Model 2 showed that FA and HDL-C were still independent influencing factors of insulin resistance. FA and HDL-C were negatively correlated with insulin resistance (FA: OR: 0.81 (0.70, 0.93), P=0.003; HDL: OR: 0.02 (0.00, 0.39), P=0.010), the results were shown in Table 4.
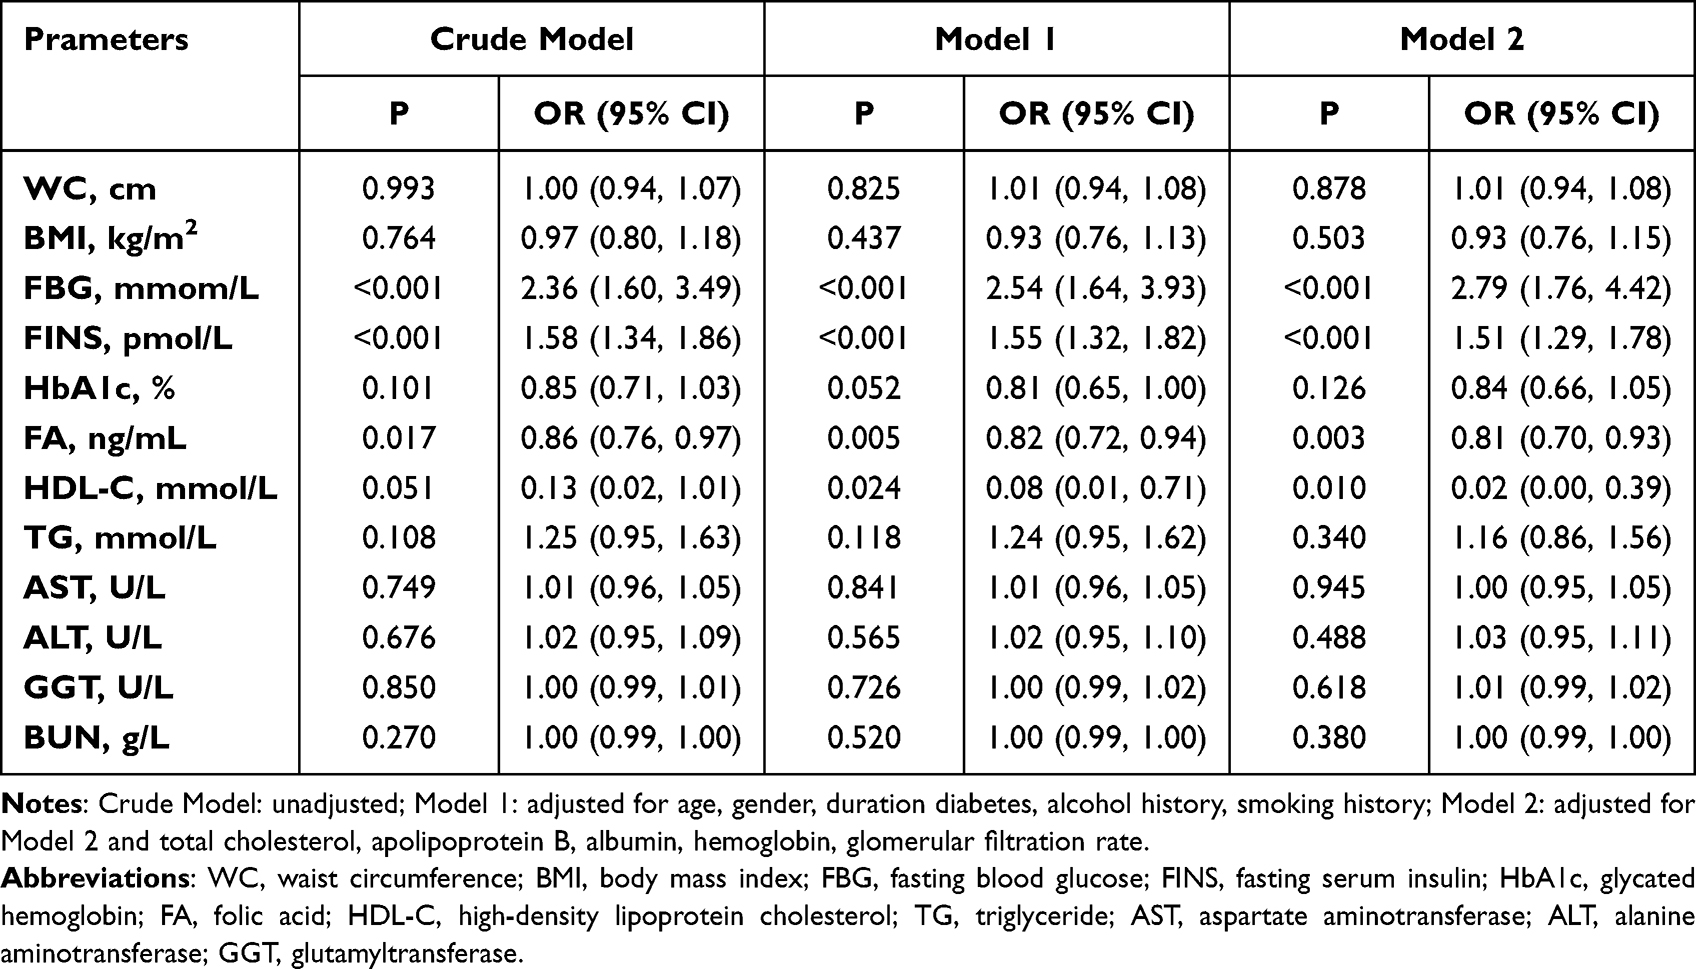 |
Table 4 Multivariate Logistic Regression Analysis of Insulin Resistance in Type 2 Diabetic Patients |
A trend test was performed to measure the risk of insulin resistance in T2DM at different serum folate concentrations by grouping the quartiles of serum folate levels. The results showed that compared with group Q1, the OR values of Q2, Q3 and Q4 were 2.43, 2.31 and 6.17, respectively. The results showed that there was no statistical difference in this trend. After adjusting for confounding factors such as age, sex, smoking history, drinking history and duration of diabetes in Model 1, the results showed that compared with group Q1, the OR values of Q2, Q3 and Q4 were 2.73, 3.62 and 8.93, respectively, and this trend was not statistically different. In Model 2, after correcting for confounding factors such as TC, ApoB, ALB, HB and GFR, the results showed that compared with group Q1, the OR values of Q2, Q3 and Q4 were: 3.08, 3.56, 11.88, this trend was statistically different (P trend=0.041), these results are visible in Table 5, so we believe that with the decrease in folate level, the risk of insulin resistance in T2DM may gradually increase.
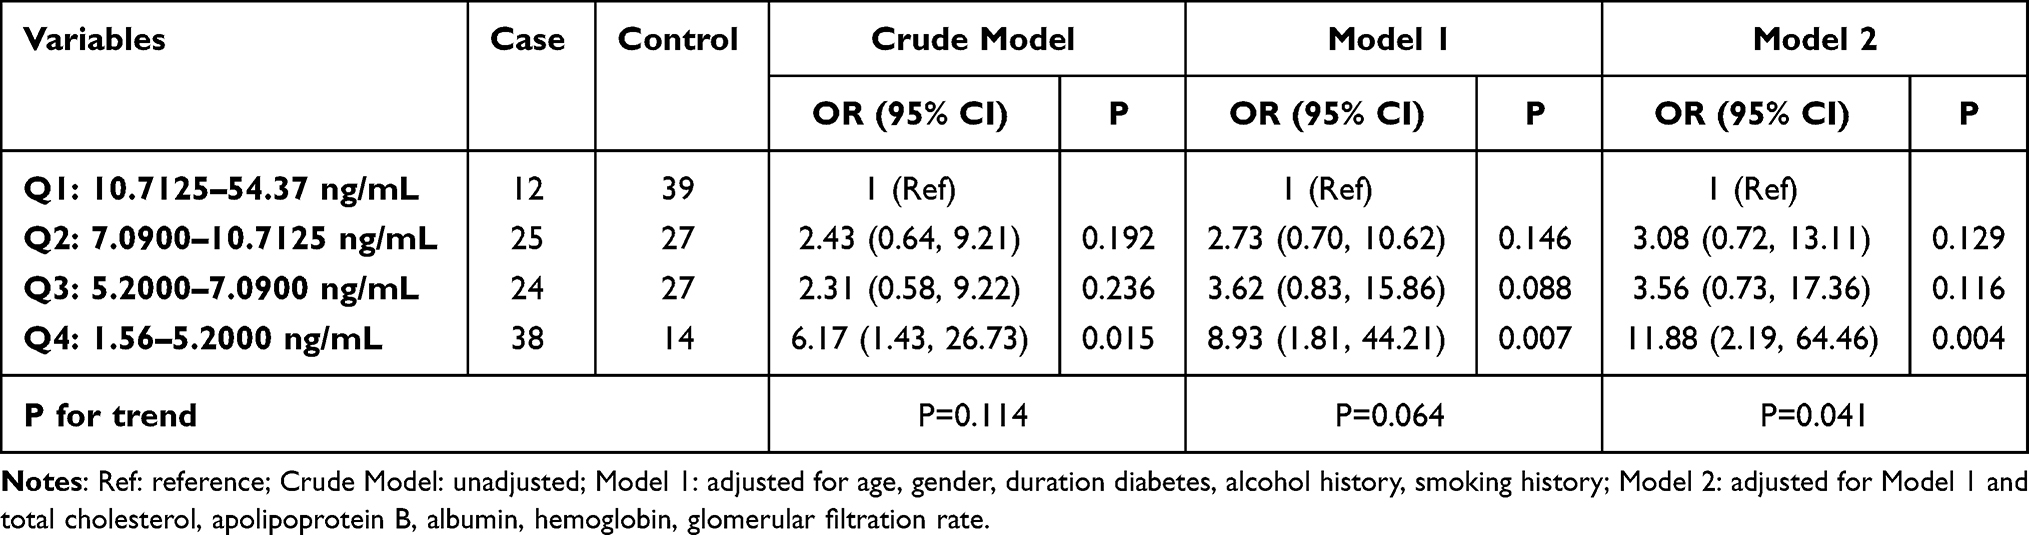 |
Table 5 Trend Test of Serum Folate Level for Risk of Insulin Resistance in Patients with Type 2 Diabetes Mellitus |
In order to reflect the causal association between HOMA-IR value and serum folate more visually, the results of restricted cubic spline curve between serum folate level and HOMA-IR index showed that HOMA-IR index had a nonlinear relationship with serum folate concentration (P-Nonlinear =0.003). When HR/OR=1, The serum folate concentration was 7.09ng/mL (Figure 1). In addition, restricted cubic splines showed that fasting glucose and fasting insulin levels were gradually increased in type 2 diabetes patients as serum folic acid levels decreased.
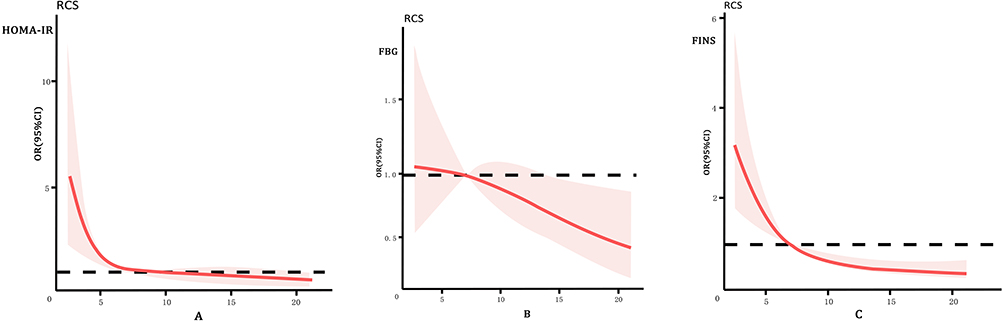 |
Figure 1 (A–C) Cubic spline regression analysis of the relationship of serum folate levels and HOMA-IR, FBG, FINS in T2DM. The relationship between folate and (A) HOMA-IR, (B) FBG and (C) FINS using the cubic spline regression analyses. The regression curve is shown in red line and the shaded area represents the 95% confidence band. Age, sex, smoking history, drinking history and diabetes history were adjusted. Abbreviations: HOMA-IR, insulin resistance was detected by the homeostasis model assessment method; FBG, fasting blood glucose; FINS, fasting insulin; T2DM, type 2 diabetes mellitus. |
Discussion
T2DM is a chronic metabolic disease characterized by absolute lack of insulin secretion due to islet β-cell dysfunction or relative lack of insulin caused by insulin resistance,22 so it is extremely important to explore the risk factors associated with insulin resistance. IR usually occurs by the following mechanisms: 1) Insulin gene mutations cause structural abnormalities of insulin secreted by islet β-cells, resulting in decreased bioactivity23; 2) The formation of insulin antibodies leads to the inability of insulin to effectively bind to its receptor; 3) Abnormal structure and function of insulin receptor; 4) Abnormal signal transduction pathway of insulin and receptor binding; 5) Endothelial dysfunction caused by inflammatory factors and oxidative stress interferes with insulin signal transduction24; 6) Other factors: leptin resistance, nutrient deficiency, smoking, etc.25 Previous studies have shown that reasonable dietary structure, appropriate vitamin complex supplementation, and healthy exercise patterns can effectively improve insulin resistance in type 2 diabetic patients.26,27
FA as a common nutrient and an indispensable element in dietary structure has been a research hotspot. Current mechanistic studies of serum folate levels and insulin resistance have shown that folate plays a role in the development of insulin resistance mainly by reducing serum Hcy levels and acts as an antioxidant vitamin that reduces oxidative stress and systemic inflammation.28 Increased homocysteine and impaired endothelial dysfunction have been shown to reduce insulin delivery to peripheral tissues,29 thereby impairs glucose uptake and plays an important role in lipid metabolism and DNA methylation. A study by Lazalde-Ramos showed that the use of antioxidants such as FA in the treatment of T2DM delayed complications of oxidative stress and DNA damage caused by T2DM.30 Although the mechanism of FA reduction in diabetic patients is not fully understood, a large meta-analysis by Lind,18 involving 22,250 participants, suggested that FA supplementation could significantly reduce fasting blood glucose and HOMA-IR values in type 2 diabetic patients and thus improve insulin resistance in diabetic patients. Therefore, its mechanism deserves further study.
The statistical results showed that the WC, BMI and TG of the IR group were higher than those of the Non-IR group, and the differences were statistically significant (P < 0.05). In addition, it was concluded in Model 1 and Model 2 that high-density lipoprotein was still an independent risk factor for HOMA-IR, so lipid metabolism may play an important role in the pathogenesis of insulin resistance. Consistent with previous studies, insulin resistance was significantly correlated with obesity31 and lipid profile. The TG and glucose index (TyG index) is a good predictor of the insulin resistance32 and triglycerides can interfere with islet beta cells and insulin-producing islet cells in the normal signal transmission, so as to form in human insulin resistance.33 HDL-C plays an important role in cholesterol homeostasis in the blood circulation by inhibiting the ability of inducible fatty acid synthase and nitric oxide synthase to reduce fat accumulation in the body and thereby increase islet sensitivity.34 The role of LDL-C and TC in the mechanism of insulin resistance remains unclear, but it has been suggested that they can affect the function of islet β-cells and affect the normal secretion of insulin.35
This study was involving 412 participants (206 with T2DM). To further investigate the correlation between serum folate level and insulin resistance mechanism in T2DM patients, we divided T2DM patients into IR group and Non-IR group. The results showed that the level of folate in IR group was significantly lower than that in Non-IR group. Logistic regression showed that serum folate was an independent risk factor for insulin resistance. According to the serum folate level, the subjects were divided into Q1, Q2, Q3 and Q4 groups from high to low. Trends in serum folate levels and risk of insulin resistance were examined in diabetic patients. We found no statistically significant difference in the trend test between the original Model and Model 1 as folate level decreased, but in Model 2, we found a statistically significant difference in the risk of insulin resistance in T2DM as folate level decreased (Ptrend=0.041). Compared with group Q1, the risk of Q2 was 3.08 times higher, the risk of Q3 was 3.56 times higher, and the risk of Q4 was 11.88 times higher. Previous studies have shown that age, sex, blood lipids, kidney function, smoking, alcohol consumption, and diabetes history all indicate a causal relationship between insulin resistance in type 2 diabetes.36,37 Therefore, we corrected for these confounding factors in Model 2. We found that the risk of insulin resistance gradually increased with the decrease in serum FA level and this trend test was statistically significant, so we believe that this trend test is warranted. However, the number of studies included was limited and further confirmation is needed in the future.
An experiment by Rudy38 showed that plasma Hcy levels were significantly elevated and folate deficiency was prevalent in diabetic patients compared with healthy patients. Numerous previous studies have shown that FA supplementation improves fasting blood glucose levels and insulin sensitivity in diabetic patients. FA effect on another important mechanism of insulin resistance may be done by reduce the Hcy levels in the blood circulation, is common among patients with FA deficiency high homocysteine levels, homocysteine levels increase through the effect on the activity of protein tyrosine phosphatase that inhibits insulin beta receptor phosphorylation, play a role of negative regulation in the insulin signaling pathway. This results in reduced glucose uptake by hepatocytes and insulin resistance.39 The active form of Hcy, homocysteine thiolide, also inhibits tyrosine phosphorylation of the β-subunit of the insulin receptor and may reduce phosphatidylinositol 3-kinase (PI3-K) activity,40 leading to a significantly increased risk of insulin resistance.
In Figure 1A–C, the non-linear association between serum folic acid and HOMA-IR index indicates that in our included population, when serum folic acid concentration was below 7.09 ng/mL, patients with type 2 diabetes had a significantly increased risk of insulin resistance, and fasting glucose and fasting insulin levels were also significantly reduced. These results suggest that folic acid plays an important role in the mechanism of glucose metabolism in T2DM.41 A study42 showed that patients with type 2 diabetes are thought to have higher or equivalent levels of inflammatory biomarkers, and folic acid supplementation may benefit blood glucose control by reducing levels of inflammatory cytokines in the body through a variety of mechanisms. As a result, monitoring serum folate levels and appropriate folate intake are essential for glycemic control in type 2 diabetic patients.
Conclusion
In conclusion, low serum folate is associated with the risk of higher insulin resistance in diabetic patients. With the decrease in serum folate levels, the risk of insulin resistance increasesin diabetic patients.
Study Limitations
There are still some limitations in this study. Insulin clamp technique is considered as a classical method to measure insulin resistance, but the complicated measurement procedure and high economic cost are not applicable in epidemiological surveys. Therefore, HOMA-IR value was used in this study. However, HOMA-IR value is causally associated with gender, age, lifestyle and other factors,43 insulin resistance confirmed based on HOMA-IR was defined differently in different studies. HOMA-IR cut-off points were previously used based on the 50th percentile, 75th percentile and 90th percentile, etc. In this study, IR was defined as (HOMA-IR cut-off point ≥2.69). Although the cut-off point of definition is arbitrary, this value is more consistent with the determination of insulin resistance in the Chinese population. In 2018, the Expert Guidance on the Assessment method and Application of insulin Resistance by the Insulin Resistance Group of the Diabetes Society of Chinese Medical Association suggested that the cut-off point of HOMA-IR value for defining insulin resistance was 2.69, because the previous 75th HOMA-IR value of 10,147 Chinese non-diabetic patients aged 25–74 years was 2.69.21 In addition, this study is a cross-sectional controlled study, and the results may be biased. Future prospective studies with large samples are needed to confirm this conclusion.
In conclusion, serum folate is associated with the risk of insulin resistance in diabetic patients. With the decrease in serum folate level, the risk of insulin resistance in diabetic patients gradually increases. Monitoring folate levels in type 2 diabetic patients and supplementing FA in type 2 diabetic patients are necessary. However, the mechanism of FA and insulin resistance is still unclear, and future prospective studies are needed to further prove it.
Abbreviations
ALB, serum albumin; HbA1c, glycosylated hemoglobin; ALT, alanine transaminase; Hcy, homocysteine; AMPK, adenosine monophosphate activated protein kinase; IBIL, indirect bilirubin; ApoB, apolipoprotein B; LC-MS, liquid chromatography tandem mass spectrometry; AST, aspartate transaminase; PI3-K, phosphatidylinositol 3-kinase; BMI, body mass index; SBP, systolic blood pressure; BUN, blood urea nitrogen; Scr, serum creatinine; CVD, cardiovascular disease; SUA, serum uric acid; DBIL, direct bilirubin; TBIL, total cholirubin; DBP, diastolic blood pressure; TC, total cholesterol; DNA, deoxyribonucleic acid; TG, triglyceride; FA, folic acid; TP, serum total protein; FBG, fasting blood glucose; TyG index, triglycerides and glucose index; FINS, fasting insulin; T2DM, type 2 diabetes mellitus; GFR, glomerular filtration rate; WC, waist circumference; HB, hemoglobin.
Data Sharing Statement
The datasets generated and/or analysed during the current study are not publicly available due to personal data protection legislation but are available from the corresponding author on reasonable request.
Ethics Approval and Consent to Participate
This study was approved by the Ethics Committee of Hebei Provincial People’s Hospital. Informed consent was obtained from all subjects and/or their legal guardians for this study, all participants signed the informed consent and all methods were carried out according to the 1995 Declaration of Helsinki (as revised in Fortaleza, Brazil, October 2013).
Acknowledgments
We are grateful to the platforms that provide scientific support for this study, especially the Jizhi Analysis platform for data collation and analysis support. We thank all the patients who gave permission for their identifying information to be used. In addition, we would like to thank all the professors and students who participated in the study for their support of the research ideas when faced with the research questions.
Disclosure
The authors report no conflicts of interest in this work.
References
1. Zheng Y, Ley SH, Hu FB. Global aetiology and epidemiology of type 2 diabetes mellitus and its complications. Nat Rev Endocrinol. 2018;14(2):88–98. doi:10.1038/nrendo.2017.151
2. Rockette-Wagner B, Edelstein S, Venditti EM, et al. The impact of lifestyle intervention on sedentary time in individuals at high risk of diabetes. Diabetologia. 2015;58(6):1198–1202. doi:10.1007/s00125-015-3565-0
3. Chatterjee S, Khunti K, Davies MJ. Type 2 diabetes. Lancet. 2017;389(10085):2239–2251. doi:10.1016/S0140-6736(17)30058-2
4. Zhu J, Chen C, Lu L, Yang K, Reis J, He K. Intakes of folate, vitamin B(6), and vitamin B(12) in relation to diabetes incidence among American young adults: a 30-year follow-up study. Diabetes Care. 2020;43(10):2426–2434. doi:10.2337/dc20-0828
5. Reaven GM. Banting lecture 1988. Role of insulin resistance in human disease. Diabetes. 1988;37(12):1595–1607. doi:10.2337/diab.37.12.1595
6. Shanik MH, Xu Y, Skrha J, Dankner R, Zick Y, Roth J. Insulin resistance and hyperinsulinemia: is hyperinsulinemia the cart or the horse? Diabetes Care. 2008;31(Suppl 2):S262–S268. doi:10.2337/dc08-s264
7. Siddle K. Signalling by insulin and IGF receptors: supporting acts and new players. J Mol Endocrinol. 2011;47(1):R1–R10. doi:10.1530/JME-11-0022
8. Dimitriadis G, Mitrou P, Lambadiari V, Maratou E, Raptis SA. Insulin effects in muscle and adipose tissue. Diabetes Res Clin Pract. 2011;93(Suppl 1):S52–S59. doi:10.1016/S0168-8227(11)70014-6
9. Jaiswal N, Maurya CK, Pandey J, Rai AK, Tamrakar AK. Fructose-induced ROS generation impairs glucose utilization in L6 skeletal muscle cells. Free Radic Res. 2015;49(9):1055–1068. doi:10.3109/10715762.2015.1031662
10. Hou L, Liu Y, Li X, et al. Changes and risk factors of skeletal muscle mass and strength in patients with type 2 diabetes over 60 years old: a cross-sectional study from China. J Diabetes Res. 2020;2020:9815485. doi:10.1155/2020/9815485
11. Schellenberg ES, Dryden DM, Vandermeer B, Ha C, Korownyk C. Lifestyle interventions for patients with and at risk for type 2 diabetes: a systematic review and meta-analysis. Ann Intern Med. 2013;159(8):543–551. doi:10.7326/0003-4819-159-8-201310150-00007
12. Field MS, Stover PJ. Safety of folic acid. Ann N Y Acad Sci. 2018;1414(1):59–71. doi:10.1111/nyas.13499
13. Morris MS, Selhub J, Jacques PF. Vitamin B-12 and folate status in relation to decline in scores on the mini-mental state examination in the Framingham Heart Study. J Am Geriatr Soc. 2012;60(8):1457–1464. doi:10.1111/j.1532-5415.2012.04076.x
14. Muzurović E, Kraljević I, Solak M, Dragnić S, Mikhailidis DP. Homocysteine and diabetes: role in macrovascular and microvascular complications. J Diabetes Complications. 2021;35(3):107834. doi:10.1016/j.jdiacomp.2020.107834
15. Luo WM, Zhang ZP, Zhang W, et al. The association of homocysteine and diabetic retinopathy in homocysteine cycle in Chinese patients with type 2 diabetes. Front Endocrinol. 2022;13:883845. doi:10.3389/fendo.2022.883845
16. Mishra PK, Tyagi N, Sen U, Joshua IG, Tyagi SC. Synergism in hyperhomocysteinemia and diabetes: role of PPAR gamma and tempol. Cardiovasc Diabetol. 2010;9:49. doi:10.1186/1475-2840-9-49
17. Asbaghi O, Ashtary-Larky D, Bagheri R, et al. Folic acid supplementation improves glycemic control for diabetes prevention and management: a systematic review and dose-response meta-analysis of randomized controlled trials. Nutrients. 2021;13(7):2355.
18. Lind MV, Lauritzen L, Kristensen M, Ross AB, Eriksen JN. Effect of folate supplementation on insulin sensitivity and type 2 diabetes: a meta-analysis of randomized controlled trials. Am J Clin Nutr. 2019;109(1):29–42. doi:10.1093/ajcn/nqy234
19. Cuthbert CE, Foster JE, Ramdath DD. A maternal high-fat, high-sucrose diet alters insulin sensitivity and expression of insulin signalling and lipid metabolism genes and proteins in male rat offspring: effect of folic acid supplementation. Br J Nutr. 2017;118(8):580–588. doi:10.1017/S0007114517002501
20. World Health Organization.Definition, diagnosis and classification of diabetes mellitus and its complications: report of a WHO consultation. Part 1, Diagnosis and classification of diabetes mellitus. 1999.
21. Galicia-Garcia U, Benito-Vicente A, Jebari S, et al. Pathophysiology of type 2 diabetes mellitus. Int J Mol Sci. 2020;21:17. doi:10.3390/ijms21176275
22. Muoio DM, Newgard CB. Mechanisms of disease: molecular and metabolic mechanisms of insulin resistance and beta-cell failure in type 2 diabetes. Nat Rev Mol Cell Biol. 2008;9(3):193–205. doi:10.1038/nrm2327
23. Leahy JL. Pathogenesis of type 2 diabetes mellitus. Arch Med Res. 2005;36(3):197–209. doi:10.1016/j.arcmed.2005.01.003
24. Grimaldi A, Heurtier A. Insulin Resistance Group, Diabetes Society of Chinese Medical Association. Expert guidance on evaluation methods and application of insulin resistance. Chin J Diabetes. 2018;10(6):377–385. Chinese.
25. Gastaldelli A. Role of beta-cell dysfunction, ectopic fat accumulation and insulin resistance in the pathogenesis of type 2 diabetes mellitus. Diabetes Res Clin Pract. 2011;93(Suppl 1):S60–S65. doi:10.1016/S0168-8227(11)70015-8
26. Magkos F, Hjorth MF, Astrup A. Diet and exercise in the prevention and treatment of type 2 diabetes mellitus. Nat Rev Endocrinol. 2020;16(10):545–555. doi:10.1038/s41574-020-0381-5
27. Wang LL, Wang Q, Hong Y, et al. The effect of low-carbohydrate diet on glycemic control in patients with type 2 diabetes mellitus. Nutrients. 2018;10(6):661. doi:10.3390/nu10060661
28. El-Khodary NM, Dabees H, Werida RH. Folic acid effect on homocysteine, sortilin levels and glycemic control in type 2 diabetes mellitus patients. Nutr Diabetes. 2022;12(1):33. doi:10.1038/s41387-022-00210-6
29. Karabag T, Kaya A, Temizhan A, Koç F, Yavuz S, Cam S. The influence of homocysteine levels on endothelial function and their relation with microvascular complications in T2DM patients without macrovascular disease. Acta Diabetol. 2007;44(2):69–75. doi:10.1007/s00592-007-0245-7
30. Lazalde-Ramos BP, Zamora-Perez AL, Sosa-Macías M, Guerrero-Velázquez C, Zúñiga-González GM. DNA and oxidative damages decrease after ingestion of folic acid in patients with type 2 diabetes. Arch Med Res. 2012;43(6):476–481. doi:10.1016/j.arcmed.2012.08.013
31. Bari MR, Ostgren CJ, Råstam L, Lindblad U. Abdominal obesity and insulin resistance in patients with type 2 diabetes in a Swedish community. Skaraborg hypertension and diabetes project. Scand J Prim Health Care. 2006;24(4):211–217. doi:10.1080/02813430601035290
32. Selvi NMK, Nandhini S, Sakthivadivel V, Lokesh S, Srinivasan AR, Sumathi S. Association of Triglyceride-Glucose Index (TyG index) with HbA1c and insulin resistance in type 2 diabetes mellitus. Maedica. 2021;16(3):375–381. doi:10.26574/maedica.2021.16.3.375
33. Reaven GM. Compensatory hyperinsulinemia and the development of an atherogenic lipoprotein profile: the price paid to maintain glucose homeostasis in insulin-resistant individuals. Endocrinol Metab Clin North Am. 2005;34(1):49–62. doi:10.1016/j.ecl.2004.12.001
34. Maeda S, Nakanishi S, Yoneda M, et al. Associations between small dense LDL, HDL subfractions (HDL2, HDL3) and risk of atherosclerosis in Japanese-Americans. J Atheroscler Thromb. 2012;19(5):444–452. doi:10.5551/jat.11445
35. Berneis KK, Krauss RM. Metabolic origins and clinical significance of LDL heterogeneity. J Lipid Res. 2002;43(9):1363–1379. doi:10.1194/jlr.R200004-JLR200
36. Steluti J, Reginaldo C, Selhub J, Paul L, Fisberg RM, Marchioni DM. Presence of circulating folic acid in plasma and its relation with dietary intake, vitamin B complex concentrations and genetic variants. Eur J Nutr. 2019;58(8):3069–3077. doi:10.1007/s00394-018-1852-5
37. De Cosmo S, Menzaghi C, Prudente S, Trischitta V. Role of insulin resistance in kidney dysfunction: insights into the mechanism and epidemiological evidence. Nephrol Dial Transplant. 2013;28(1):29–36. doi:10.1093/ndt/gfs290
38. Rudy A, Kowalska I, Straczkowski M, Kinalska I. Homocysteine concentrations and vascular complications in patients with type 2 diabetes. Diabetes Metab. 2005;31(2):112–117. doi:10.1016/S1262-3636(07)70176-3
39. Liu P, Huang J, Zhong L. Role and mechanism of homocysteine in affecting hepatic protein-tyrosine phosphatase 1B. Biochim Biophys Acta Gen Subj. 2019;1863(5):941–949. doi:10.1016/j.bbagen.2019.03.007
40. Zhang X, Qu YY, Liu L, et al. Homocysteine inhibits pro-insulin receptor cleavage and causes insulin resistance via protein cysteine-homocysteinylation. Cell Rep. 2021;37(2):109821. doi:10.1016/j.celrep.2021.109821
41. Fatahi S, Pezeshki M, Mousavi SM, et al. Effects of folic acid supplementation on C-reactive protein: a systematic review and meta-analysis of randomized controlled trials. Nutr Metab Cardiovasc Dis. 2019;29(5):432–439. doi:10.1016/j.numecd.2018.11.006
42. Zhao G, Ford ES, Li C. Associations of serum concentrations of 25-hydroxyvitamin D and parathyroid hormone with surrogate markers of insulin resistance among U.S. adults without physician-diagnosed diabetes: NHANES, 2003–2006. Diabetes Care. 2010;33(2):344–347. doi:10.2337/dc09-0924
43. Gayoso-Diz P, Otero-Gonzalez A, Rodriguez-Alvarez MX, et al. Insulin resistance index (HOMA-IR) levels in a general adult population: curves percentile by gender and age. The EPIRCE study. Diabetes Res Clin Pract. 2011;94(1):146–155. doi:10.1016/j.diabres.2011.07.015
 © 2023 The Author(s). This work is published and licensed by Dove Medical Press Limited. The full terms of this license are available at https://www.dovepress.com/terms.php and incorporate the Creative Commons Attribution - Non Commercial (unported, v3.0) License.
By accessing the work you hereby accept the Terms. Non-commercial uses of the work are permitted without any further permission from Dove Medical Press Limited, provided the work is properly attributed. For permission for commercial use of this work, please see paragraphs 4.2 and 5 of our Terms.
© 2023 The Author(s). This work is published and licensed by Dove Medical Press Limited. The full terms of this license are available at https://www.dovepress.com/terms.php and incorporate the Creative Commons Attribution - Non Commercial (unported, v3.0) License.
By accessing the work you hereby accept the Terms. Non-commercial uses of the work are permitted without any further permission from Dove Medical Press Limited, provided the work is properly attributed. For permission for commercial use of this work, please see paragraphs 4.2 and 5 of our Terms.