Back to Journals » Journal of Multidisciplinary Healthcare » Volume 15
Associations Between Obesity, Physical Inactivity, Healthcare Capacity, and the Built Environment: Geographic Information System Analysis
Authors Aljabri D ![]()
Received 5 November 2021
Accepted for publication 21 February 2022
Published 2 April 2022 Volume 2022:15 Pages 689—704
DOI https://doi.org/10.2147/JMDH.S345458
Checked for plagiarism Yes
Review by Single anonymous peer review
Peer reviewer comments 3
Editor who approved publication: Dr Scott Fraser
Duaa Aljabri
Health Information Management and Technology Department, College of Public Health, Imam Abdulrahman Bin Faisal University, Dammam, Saudi Arabia
Correspondence: Duaa Aljabri, Email [email protected]
Background: Obesity is one of the major critical health conditions affecting many people across the world. One of the major causes of obesity is identified to be sedentary lifestyles and physical inactivity, which may be associated with environmental factors.
Objective: The study analyzes variations in obesity and physical inactivity in the State of South Carolina, US, and their association with healthcare capacity and the built environment.
Methods: Data were obtained from different secondary sources and surveys, 2012, and then linked on the county-level using ArcGIS. Global Moran’s I was used to examine the spatial distribution at the state level, and Anselin’s local Moran’s I was used to detect any significant clusters at the county level. Ordinary least squares regression models were calculated for obesity and physical inactivity separately.
Results: More than 70% of SC counties had high levels of obesity and physical inactivity. Spatial analysis showed statistical clusters of high obesity, high physical inactivity, and low access to exercise opportunities in rural areas compared to urban areas. Conversely, clusters of high density of health-care facilities appeared in urban areas. Through the regression models, the density of primary care physicians (p = 0.025) and access to exercise opportunities (p = 0.075) were negatively associated with obesity, while the low perception of own health (p = 0.001) and obesity rate (0.011) were positively associated with physical inactivity.
Conclusion: GIS was useful to illustrate and identify significant geographic variations and high clusters of obesity and physical inactivity in rural areas, compared with high clusters of access to exercise opportunities and health-care facilities in urban areas. The international health community is encouraged to utilize spatial information systems to examine variations and recommend evidence-based recommendations to redistribute equitable public health efforts. The development of strategies and initiatives toward reducing variation in health and sustainable development is key to promote the population wellbeing.
Keywords: obesity, physical inactivity, healthcare capacity, built environment, healthcare management, Geographic Information System
Introduction
Sustainable Development Goals (SDGs) outlined in the United Nations 2030 agenda is a transformative vision for global development.1 It focuses on achieving sustainability in economic, social, and environmental aspects, all of which are interrelated and can significantly influence health and well-being.2 For instance, rising pollution levels (environmental factor), or gender inequalities or discrimination or physical abuse (social factor), and low wages (economic factor) may influence population health. Hence, sustainable development may not be fully achieved with high prevalence of chronic diseases or poor health conditions of the community.3 Therefore, it is essential to develop inter-sectoral policies and strategies using integrated approaches that align health and sustainability goals.4 With the development of knowledge relating to the sustainability and health, there is a shift in the paradigm of understanding health as an absence of disease to understanding health as a factor in relation with socio-environmental, and ecological factors that support health and well-being.5
As a healthy population is essential for sustainable development, reducing the burden of noncommunicable diseases (NCDs) such as overweight and obesity become important. According to the World Health Organization (WHO) estimates, the global prevalence of obesity has tripled in the last four decades (1975–2016), where around 2 billion adults were overweight. Of those, 650 million adults were obese.6 In 2016, the USA ranked first in the prevalence of overweight (36.5%), followed by the European Union with a prevalence of 15.9%.7 In addition, obesity among the children has been increasing in the past few decades, which can have significant long-term effects, as they are likely to continue their status into the adulthood, which increases the risk of developing chronic diseases and in turn has effects on mortality and morbidity.8,9
There are various contributing factors of obesity, which mainly include social and physical environment, genetics, medical history and behaviors such as poor diet and physical inactivity.10 However, studies11,12 have identified that the changing lifestyles reflecting sedentary lifestyles and lack of physical activity are main factors leading to the increase in the prevalence of obesity across the world. Furthermore, the health-care costs associated with obesity are overwhelming and increasing. The global, medical costs of obesity reached $7.4 billion in 2020 similar to the projections in the work by Andreyeva et al;13 while its indirect costs have been far higher. For instance, health-care costs of managing diabetes, which is one of the risk factors of obesity was identified to be $760 billion in 2020.6
As the participation of human resources is an important factor in economic development, obesity may lead to severe health complications, which may indirectly affect the sustainable development by reducing productivity.1 Furthermore, poor sustainable development practices can also influence disability and obesity management, as its effects such as climate changes, lack of focus on health development may lead to rise in obesity.7 Considering these factors, a shift towards understanding the development of obesity from a broader perspective: the environment was observed.14 In particular, the parallel occurrence of events such as increasing environmental deterioration and the rising number of chronic diseases may be associated with the poor integration of health and sustainability goals. The development of strategies and initiatives toward reducing variation in health and sustainable development is key to promote the population wellbeing. To address this gap in research, in this study, we used examples from healthcare and the environment to illustrate that health and sustainability are mutually associated. However, few studies have tested spatial relationships between the prevalence of physical inactivity and obesity with multiple explanatory variables related to healthcare capacity and the built environment to identify potential sources of inequalities at the community level of analysis. Accordingly, this study considered the use of various secondary data sources for identifying the contributing factors of physical inactivity and obesity; and examine how these factors affect spatial inequalities using the spatial regression models to predict factors associated with obesity and physical inactivity among South Carolina’s residents. Analyzing the data from an environmental or spatial perspective can help the policy makers in determining the health and lifestyles of the population in different regions based on which effective health interventions can be introduced in order to address the issue of obesity.
In this context, Geographic Information Systems (GIS) are used to analyze population features in relation to their location and health outcomes. Many recent researchers are utilizing GIS to illustrate the distribution and identify spatial clusters of chronic diseases in various geographic areas.14–16 The aim of this study was to: 1) examine geographic variation of obesity and physical inactivity prevalence in SC counties; 2) examine the spatial clustering of healthcare capacity (health-care facilities and primary care physicians (PCPs); and 3) model the relationship between rates of obesity, physical inactivity, and contextual risk factors. Understanding county variations may support policy-makers in addressing county-level needs in the process of designing and developing interventions.
Materials and Methods
In this ecological population-based study, we examined the prevalence of obesity and physical inactivity in South Carolina counties. South Carolina is located in the Southeast of the United States, covering 30,060 mi2, and consisting of 46 counties. The total population (as of 2012) was 4,723,723, with the highest population residing in Greenville (n = 467,605), and lowest in McCormick (n = 9943).17 Multiple secondary data sources were used including the US Census Topologically Integrated Geographic Encoding and Referencing (TIGER)/Line Files for the 2012 census,18 Area Health Resource File (AHRF),19 Behavioral Risk Factor Surveillance System (BRFSS),20 and County Health rankings21 were utilized in this study. All data were obtained from readily and publicly available secondary data sources that were combined and reported on the county-level, and did not include any identifiable personal information. In addition, the study was ethically approved by the Institutional Review Board at Imam Abdulrahman Bin Faisal University (IRB-2022-03-083).
Figure 1 shows the components of the study framework as discussed in the following sections:
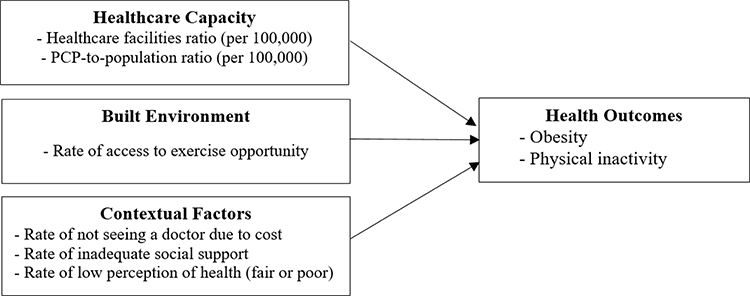 |
Figure 1 Study framework. |
Framework Components
Obesity and Physical Inactivity
Obesity was assessed by the percentage of adults who reported a body mass index (BMI) more or equal to 30 kg/m2 (weight in kilograms divided by height in meters squared). BMI was calculated based on self-report of height and weight from the following two questions: “About how much do you weigh without shoes?” and “about how tall are you without shoes?” BMI was measured from self-report height and weight obtained from 2012 BRFSS data.20 These measurements have been previously validated with a sensitivity of 0.74–0.77 and a specificity of 0.99 for obesity.22,23 Physical inactivity was assessed based on the question: During the past month, other than your regular job, did you participate in any physical activities or exercises such as running, calisthenics, golf, gardening, or walking for exercise?
Both measures are based on the age-adjusted county-level estimates in the 2012 BRFSS random digit telephone interview survey.20 After 2011, BRFSS methodology was refined to expand the sample by including data received from cell phone users and the statistical method was modified to adjust for age, race and ethnicity, and gender. The new weighting method is post stratification, and allowed multi-year estimates and county-specific estimates for those with more than 50 respondents in a county.24
Healthcare Capacity
Healthcare capacity was measured by health-care facility density (per 100,000) and primary care physician density (per 100,000) to the adult population (aged 18 years and above), which were also referred to as supply ratios.25,26 A higher healthcare capacity rate means the availability of more facilities and PCP servicing the population. Data to create these density variables was obtained from the Health Resource and Services Administration (HRSA, 2011) Area Resource File.19 Location of health-care facilities were acquired spatially from SC GIS Data Clearinghouse, SC Department of Health and Environmental Control (DHEC)-licensed hospitals and primary care clinics.27
Built Environment
We focused our assessment of built environment on access to exercise opportunities, which measured the availability of parks and recreational facilities that enable individuals to exercise at the county level. Data were obtained from the County Health Rankings that was developed from the Environmental Systems Research Institute (ESRI), OneSource Global Business Browser, and Delorme map data.19 The access to exercise opportunities measure was identified by the percentage of individuals in a county who live in an approximate location for exercise, specifically: Individuals who reside in a census block within one-half mile of a park, 1 mile of a recreational facility in urban areas, or 3 miles of a recreational facility in rural areas were considered to have access to exercise opportunities.
Contextual Factors
There are various types of contextual factors that can be related to the various health outcomes. For instance, lack of social support or motivation for quitting smoking can be one of the factors for increase in chronic lung-related diseases. Accordingly, in the context of this study, three factors, including rate of not seeing a doctor due to cost barriers,28 rate of inadequate social support,29 and rate of low perceptions of health among the people30 are considered in this study.
Statistical Analysis
Descriptive statistics were calculated using the Statistical Package for the Social Sciences (SPSS) software Version 16 to summarize county characteristics in percentages, means, and standard deviations. Pearson’s correlation coefficients were computed to detect relationships between obesity and physical inactivity, separately, with healthcare capacity and built environment factors. P-value of <0.05 was considered significant.
A number of demographic and socioeconomic variables were examined as covariates (see Table 1). After testing collinearity statistics (as tolerance and Variance Inflation Factor VIF >5), some variables with high collinearity were excluded. Non-spatial, ordinary least square (OLS) regression was calculated to examine if any of the remaining factors was associated with obesity or physical inactivity.
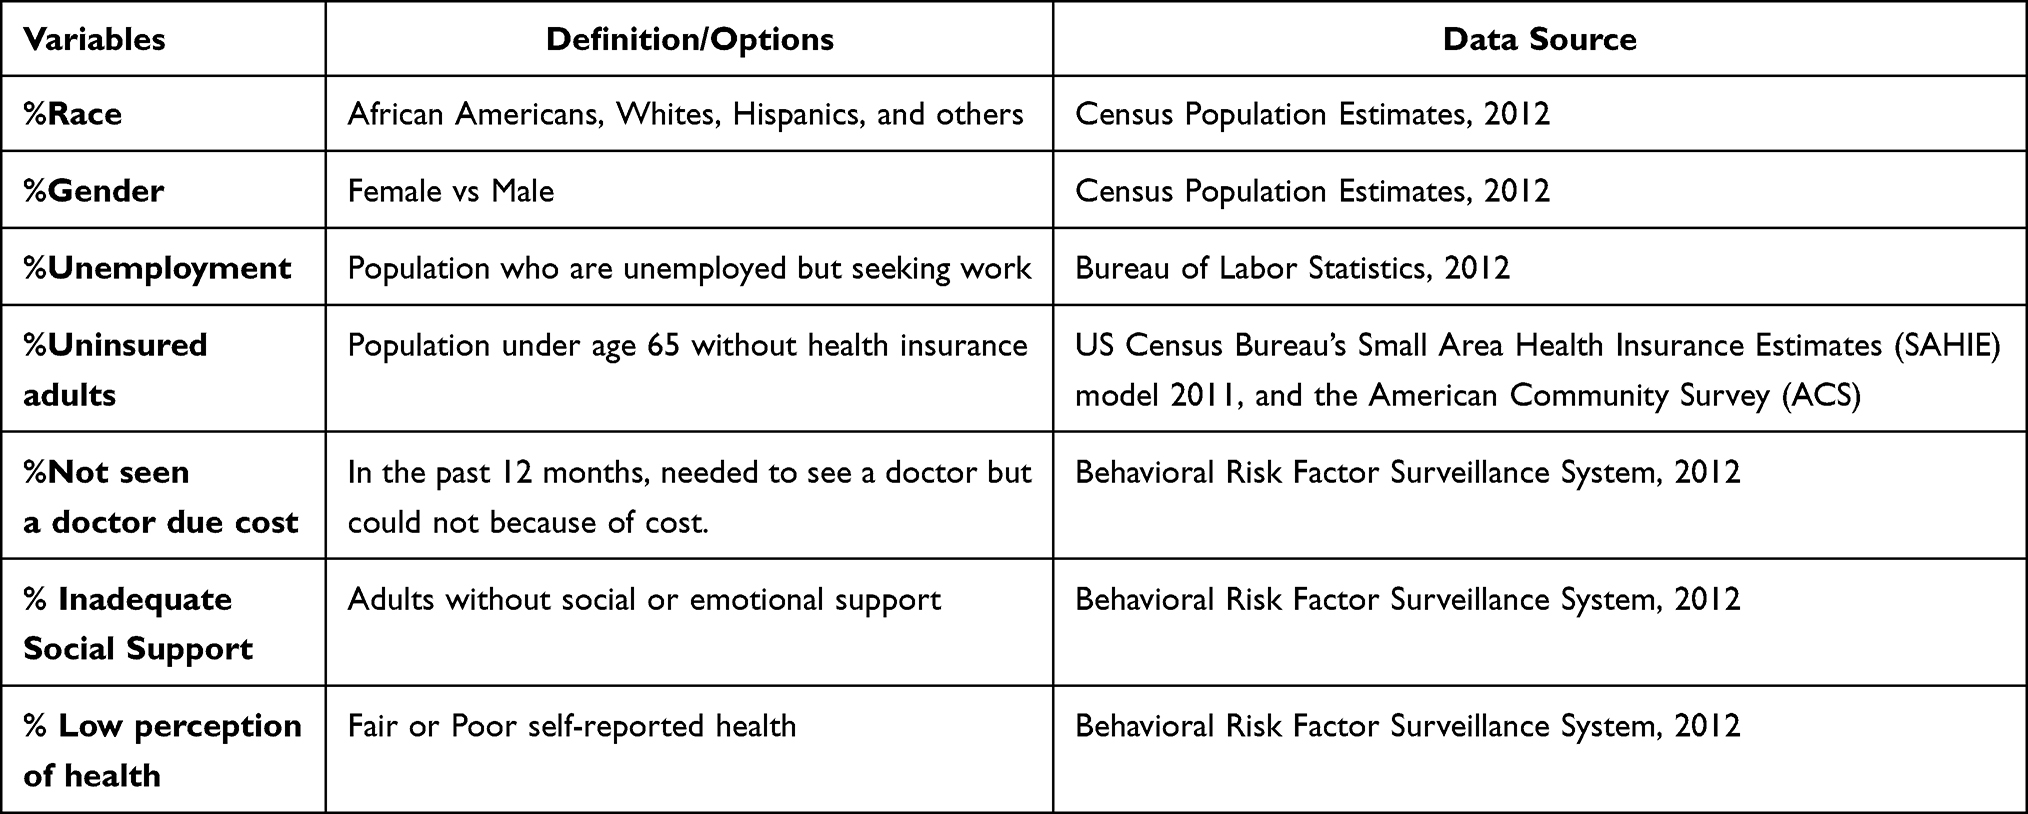 |
Table 1 Variables Definition and Data Source |
The regression equations were:
1) Obesity (y)= β1 (physical inactivity) + β2 (healthcare facility density) + β3 (PCP-to-population ratio) + β4 (access to exercise opportunities) + β5 (lack access to a doctor due to cost) + β6 (inadequate social support) + β7 (low perception of health) +error
2) Physical Inactivity (y)= β1 (obesity) + β2 (healthcare facility density) + β3 (PCP-to-population ratio) + β4 (access to exercise opportunities) + β5 (lack access to a doctor due to cost) + β6 (inadequate social support) + β7 (low perception of health) + error
ArcGIS Desktop Version 10.2.2 (ESRI, Redland, CA, USA) was used to join data from multiple sources to the TIGER/SC county map using the Spatial Join tool. Then, layers of county rates on obesity, physical inactivity, and access to exercise opportunities were overlaid and displayed in thematic maps. Cutoffs points for each variable were presented according to the Healthy People 2020 objective of 30.6% adult obesity and 32.6% physical inactivity rates.31
Global Moran’s I was used to examine the spatial distribution of health-care facility density and PCP density at the state level, and Anselin’s local Moran’s I was used to detect any significant clusters at the county level. Based on the Centers for Disease Control definition, a cluster is “an unusual aggregation, real or perceived, of health events that are grouped together in time and space and that are reported to a health agency”.32 In this study, Anselin’s local Moran’s I was also used to detect any significant clusters of obesity and physical inactivity.
Results
County Characteristics
Table 2 summarizes the findings for demographic and socioeconomic rates in South Carolina counties.
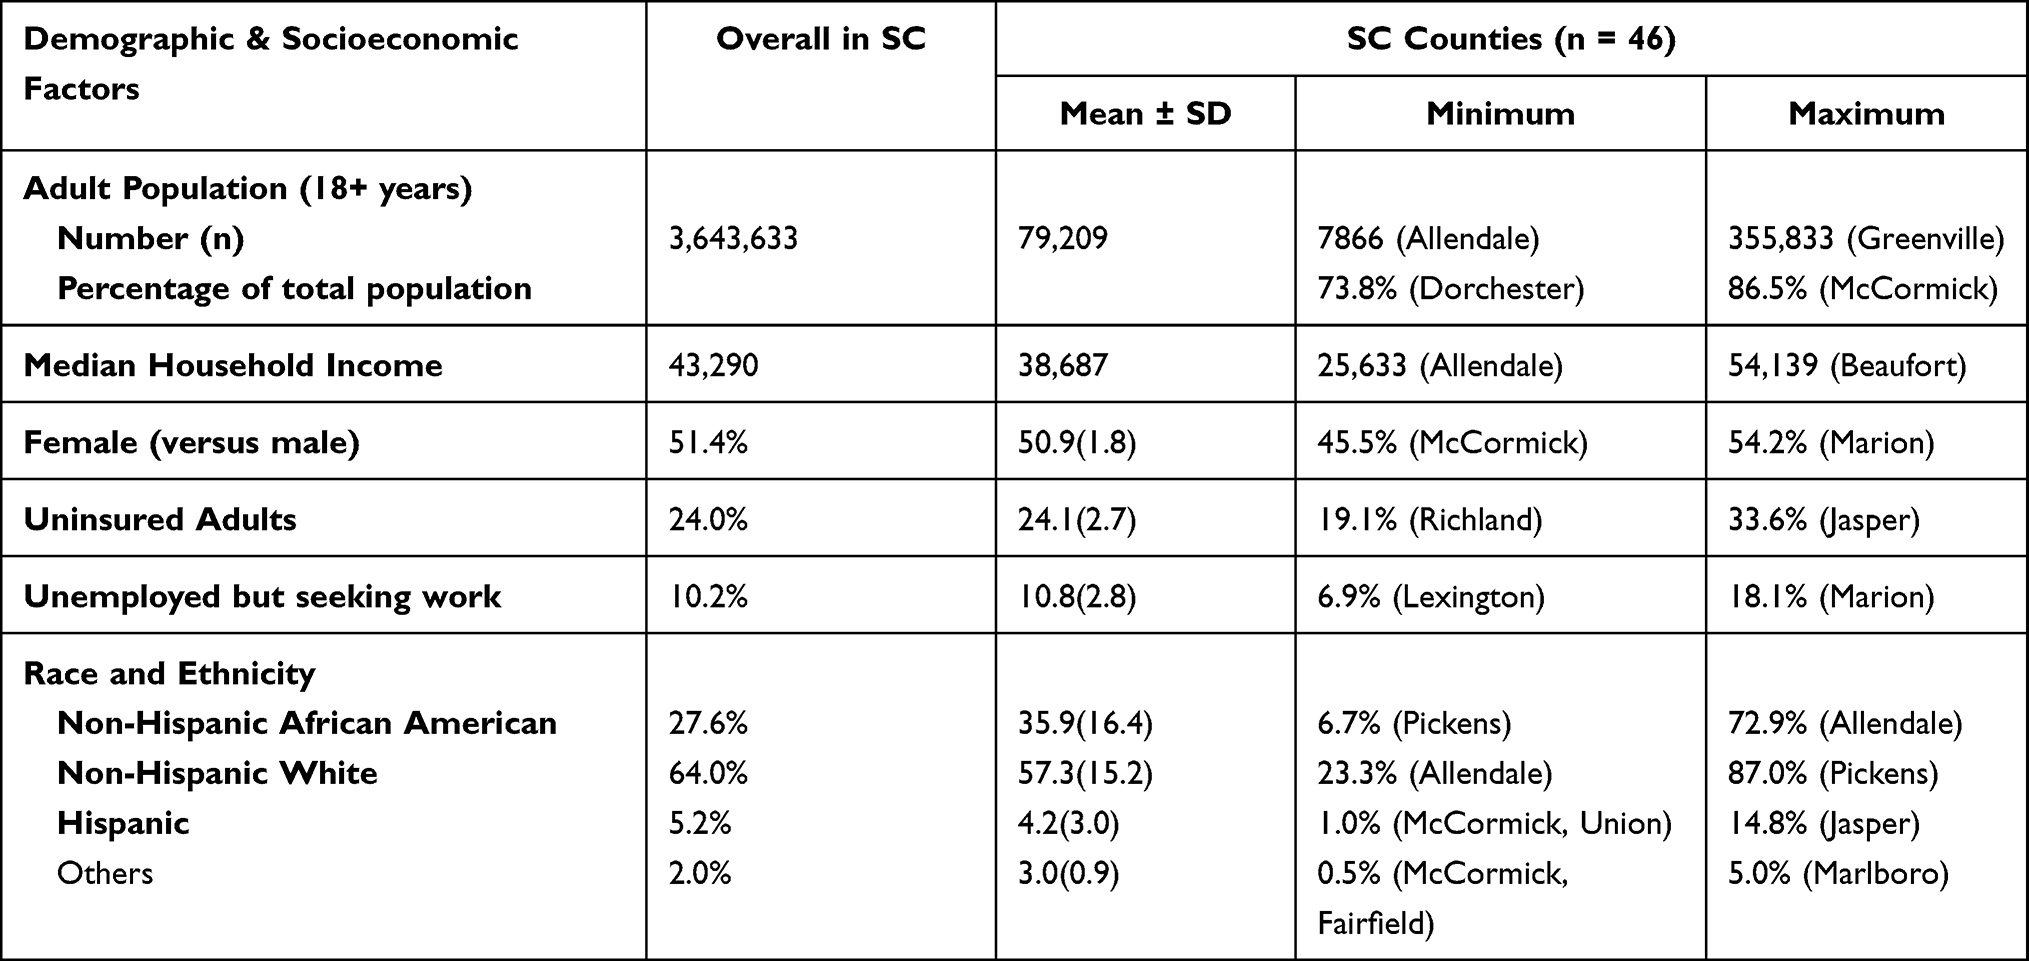 |
Table 2 Demographic and Socioeconomic Profile of South Carolina Counties, 2012 |
Adult population (aged 18 and above) was the highest in McCormick (86.5%) and lowest in Dorchester (73.8%). The median household income was the highest in Beaufort ($54,139) and lowest in Allendale ($25,633). Marion had the most females (54.2%), while McCormick had the lowest (45.5%). Uninsured adults were the highest in Jasper (33.6%) and lowest in Richland (19.1%). Unemployment was the highest in Marion (18.1%) and lowest in Lexington (6.9%). Allendale had the highest rate of African Americans (72.9%), Pickens had the largest proportion of White residents (87.0%), while Jasper had the largest proportion of Hispanics (14.8%), and Marlboro had more of other races (5.0%).
Table 3 summarizes the study outcomes and contextual factors. Obesity rate was the highest in Lee (43.9%), and physical inactivity was the highest in Dillon (35.2%). Beaufort had the lowest obesity (22.5%) and physical inactivity rates (15.2%), and its residents were the lowest to report their health status as fair or poor (10.1%). Charleston had the highest ratio of health facilities (116.25 per 100,000) and highest PCP-to-population ratio (155 per 100,000). Inadequate social and emotional support were highest in Allendale (39.5%) and lowest in Lexington (16.7%).
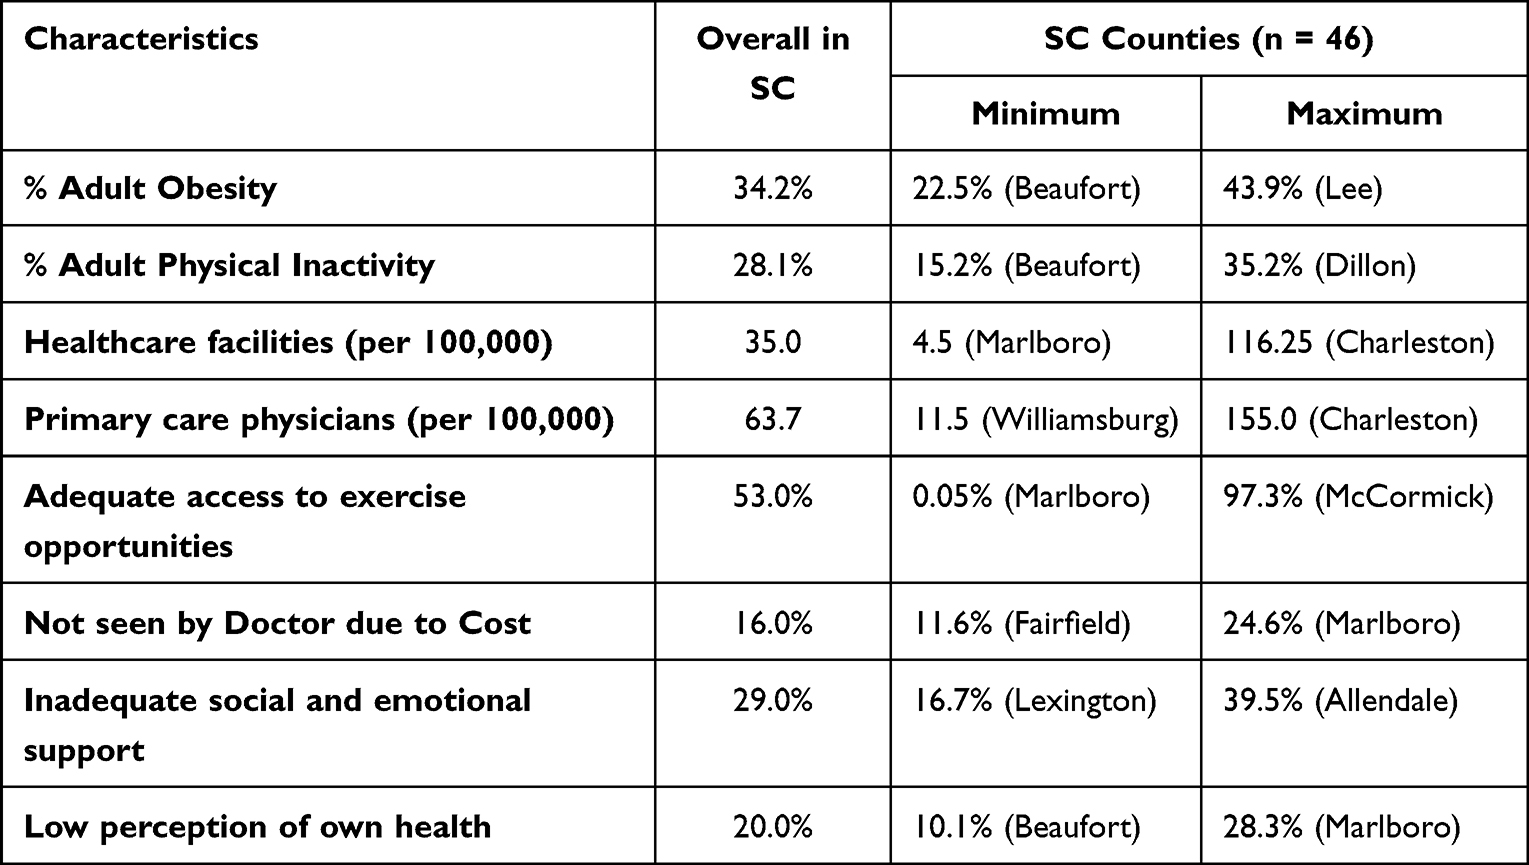 |
Table 3 Summary of Study Outcomes and Contextual Factors in South Carolina's Counties, 2012 |
Marlboro had the highest proportion of the residents’ who have not seen a doctor due to cost (24.6%), the highest to report their health status as fair or poor (28.3%), and the lowest ratio of health facilities (4.5 per 100,000).
Obesity and Physical Inactivity
Geographic Variations
Figure 2 demonstrates the geographic variation in obesity and physical inactivity in SC. Sixteen percent of SC counties (n = 8) met the Healthy People 2020 objective of having their population with less than 30.6% obesity rate. However, 73% (n = 34) of SC counties had rates between 30.6% and 35.6%, indicating potential areas for improvement on obesity prevention; and 1% of SC counties (n = 4) had higher than 35.6% obesity rates, needing some urgent interventions for obesity control.
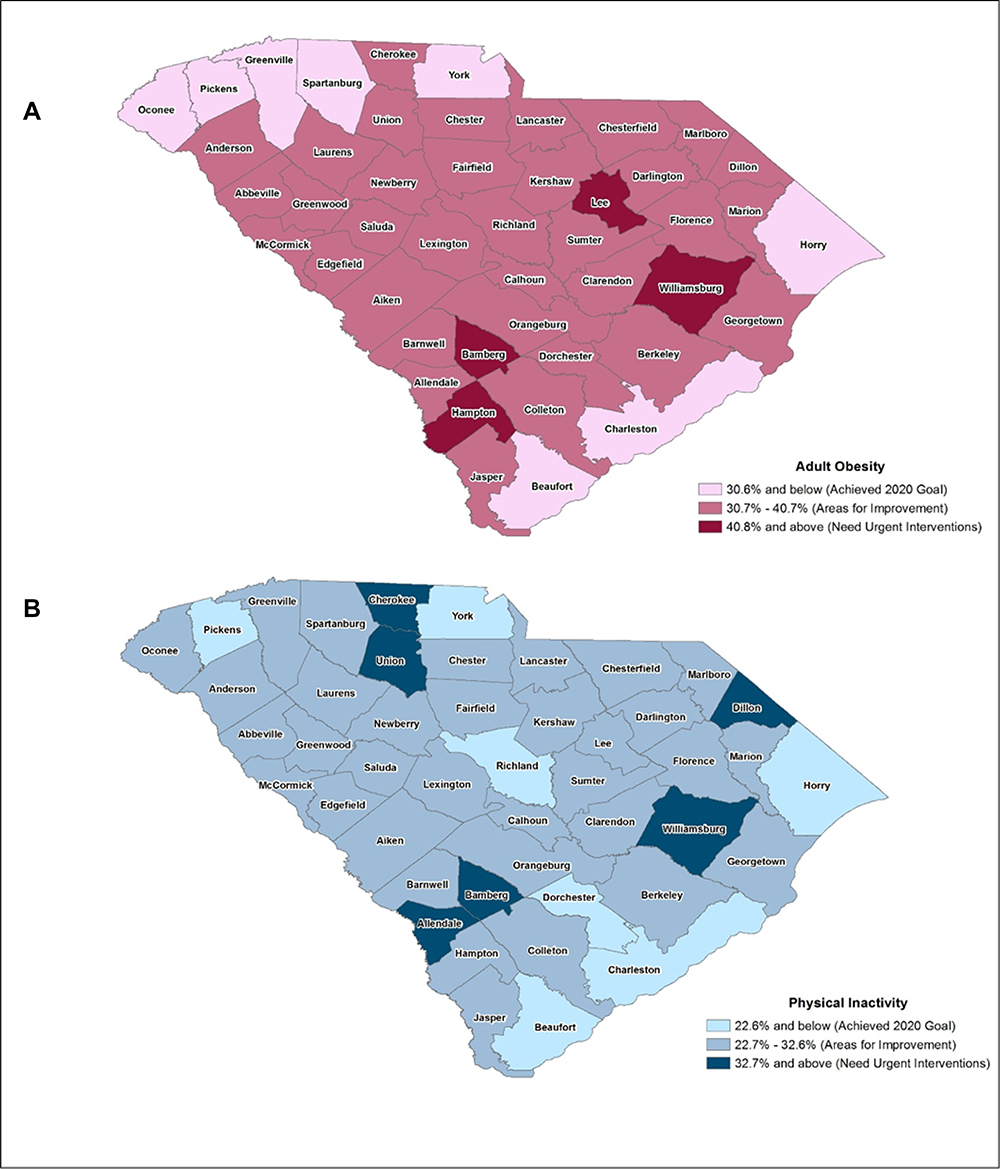 |
Figure 2 Geographic variation in (A) Obesity and (B) Physical Inactivity, in South Carolina's counties, 2012. Notes: Data from Behavioral Risk Factor Surveillance System (BRFSS).20 |
As for physical inactivity, 15% of SC counties (n = 7) met the objective of Healthy People 2020 goals of reducing physical inactivity to 32.6%. However, more than 71% (n = 33) counties had rates between 32.6% and 37.6%, signifying areas for improvement; and 1.5% (n = 6) of the counties had more than 37.6% physical inactivity rate.
Correlation Analysis
Pearson correlation coefficients in Table 4 shows that obesity had a strong positive linear correlation with physical inactivity, as expected (r = 0.784, p < 0.0001). The density of health-care facilities had a moderate correlation with obesity (r = 0.408, p = 0.005), and weak positive correlation physical inactivity (r = 0.272, p = 0.067).
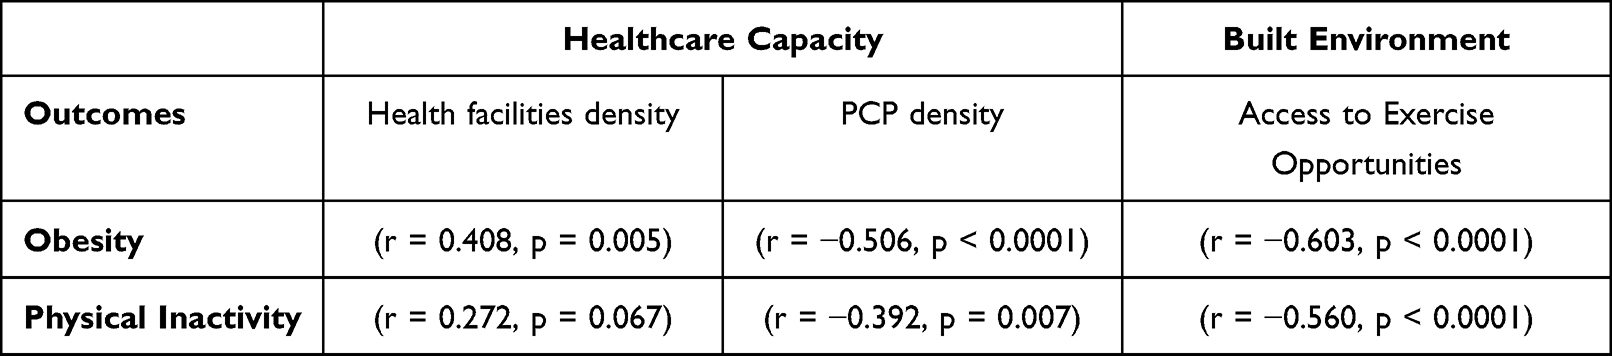 |
Table 4 Results of Correlation Coefficient Analysis |
On the other hand, PCP density had strong negative correlation with obesity (r = −0.506, p < 0.0001), but a weak negative correlation with physical inactivity (r=−.392, p = 0.007). Similarly, access to exercise opportunities had a negative correlation that was stronger in obesity (r = −0.603, p < 0.0001), compared to physical inactivity (r = −0.560, p < 0.0001); indicating that as access to exercise increase, rates of obesity and physical inactivity are more likely to decrease.
Spatial Analysis
Figures 3 and 4 illustrate the spatial autocorrelation of obesity and physical inactivity analyzed by Local Moran’s I in ArcGIS.
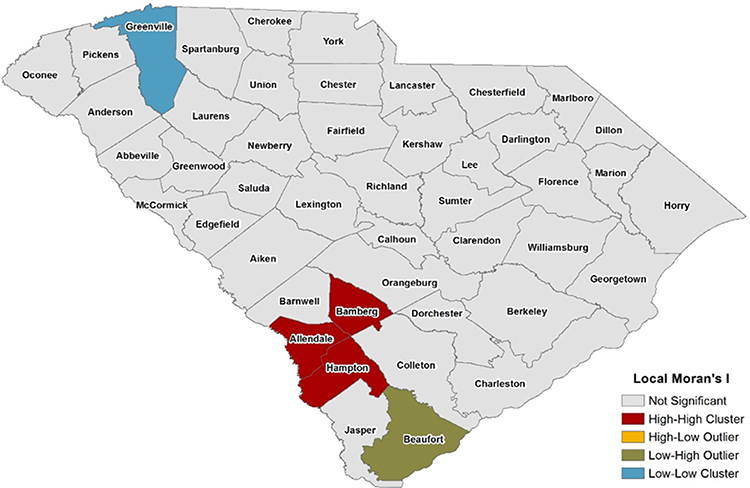 |
Figure 3 Spatial autocorrelation of obesity in South Carolina. Notes: Data from Behavioral Risk Factor Surveillance System (BRFSS).20 |
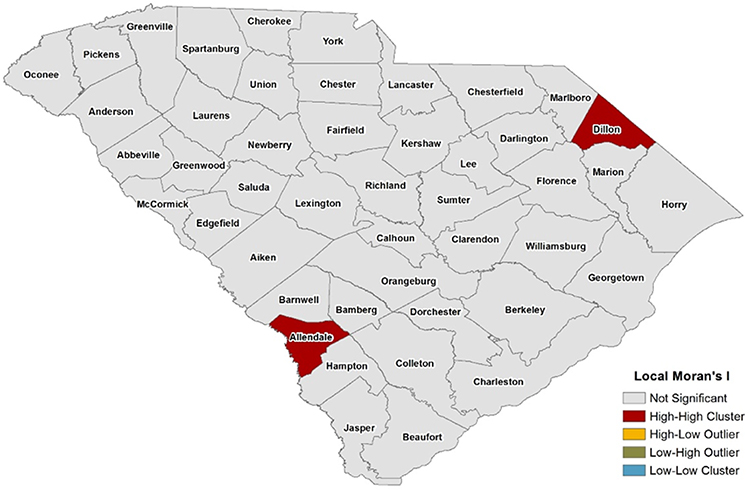 |
Figure 4 Spatial autocorrelation of physical inactivity in South Carolina. Notes: Data from Behavioral Risk Factor Surveillance System (BRFSS).20 |
Table 5 shows that some counties had significantly similar or dissimilar clusters, and there was enough evidence to reject the null hypothesis (p < 0.05). A positive z-score indicates that a county neighbors’ other counties with similarly high or low rates, and the county is part of a cluster. Greenville (Low-Low) had a cluster of low obesity rates and was surrounded by neighbors with similarly low rates. Bamberg, Allendale, and Hampton (High-High) had high obesity rates and were also surrounded by high rates. Allendale (High-High) and Dillon (High-High) had high physical inactivity rates and were also surrounded by similar high inactivity rates. Conversely, a negative z-score indicates that a county neighbor with other counties with dissimilar rates, and the county is an outlier. Therefore, Beaufort (Low-High) is an outlier as it had low rates of obesity and was surrounded with high obesity rates.
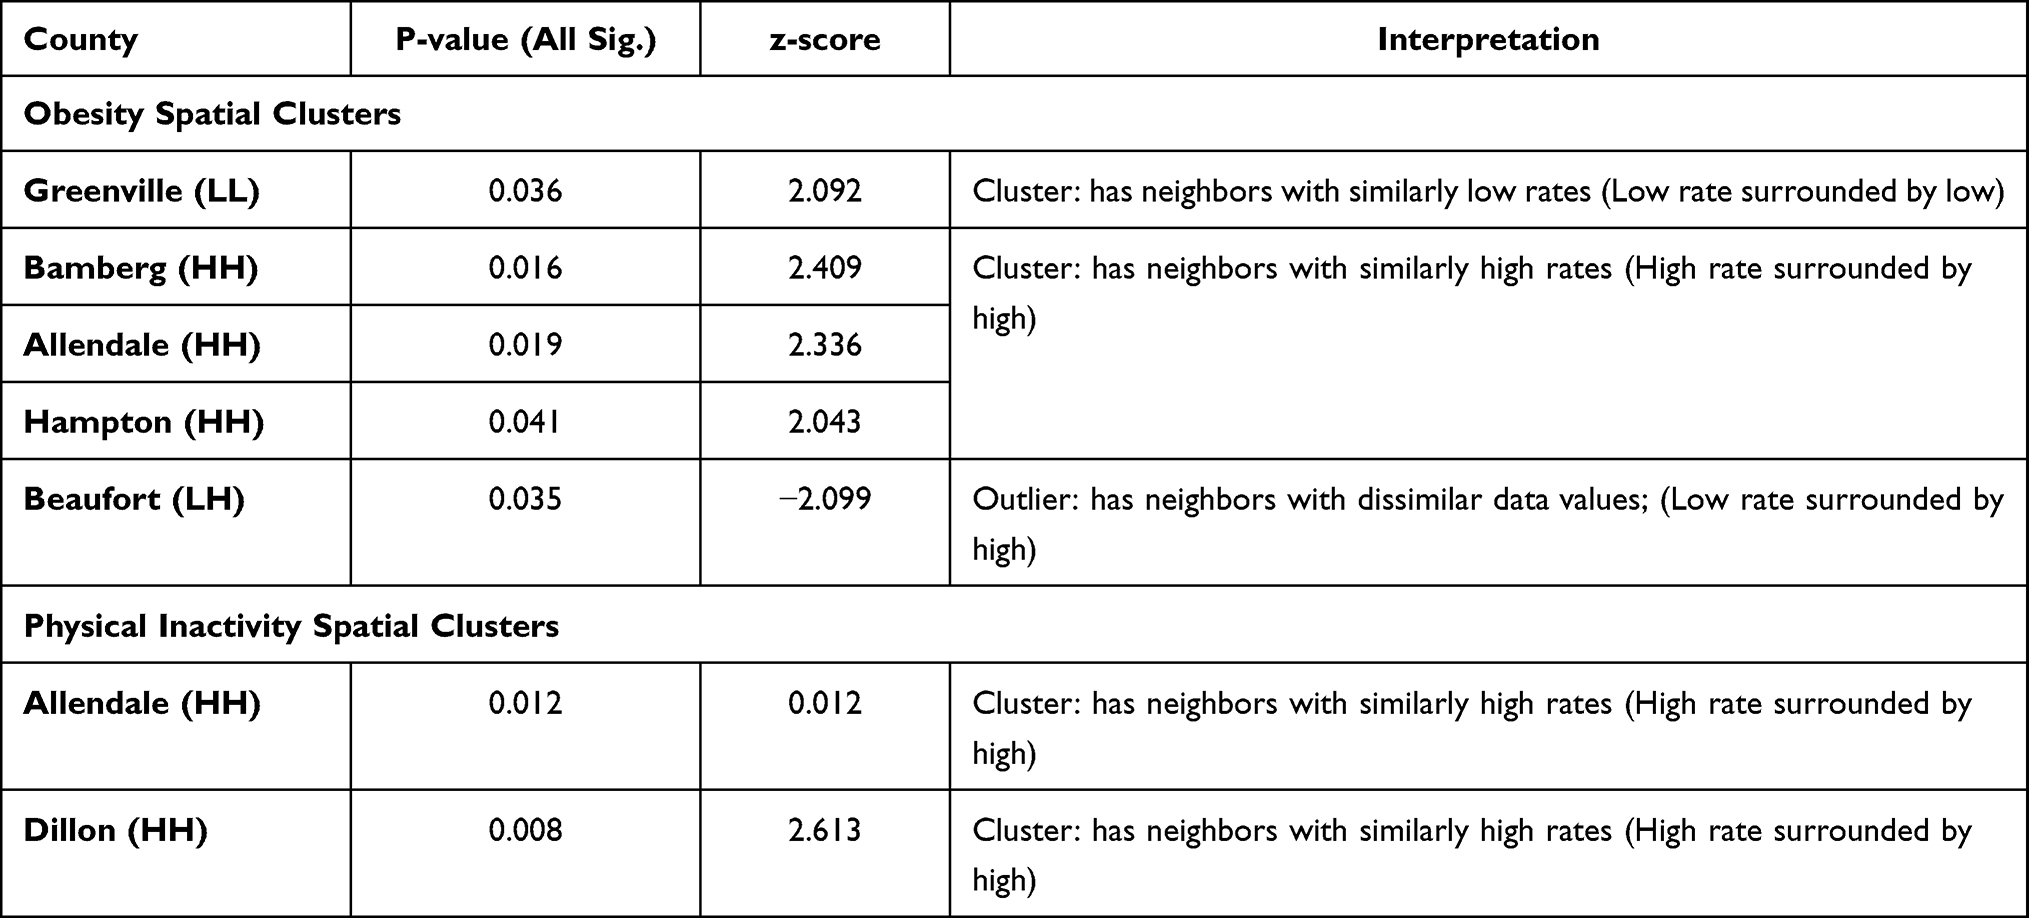 |
Table 5 Local Moran’s I Analysis for Spatial Autocorrelation |
Clusters of Healthcare Facilities and Access to Exercise Opportunities
Figure 5 illustrates the spatial distribution of health-care facilities in SC counties. At the state level, Global Moran’s I result showed a non-significant p-value (p = 0.978), which means that we fail to reject the null hypothesis, and therefore, conclude that the spatial distribution is random. At the county level however, Local Moran’s I result showed that there was enough evidence to reject null hypothesis, as statistical spatial clustering was detected in Greenville (High-High Cluster, p = 0.006, z = 2.718) and Charleston (High-Low Outlier, p = 0.013, z=−2.466). This indicated that Greenville had high density of healthcare facilities, and was surrounded by counties with high density too. On the other hand, Charleston had high density of health-care facilities, but was surrounded with counties with low density. Interestingly, these counties are located in urban areas and reported lower rates of obesity (Greenville = 28.5%, Charleston = 25.0%) and physical inactivity (Greenville = 23.0%, Charleston = 20.2%).
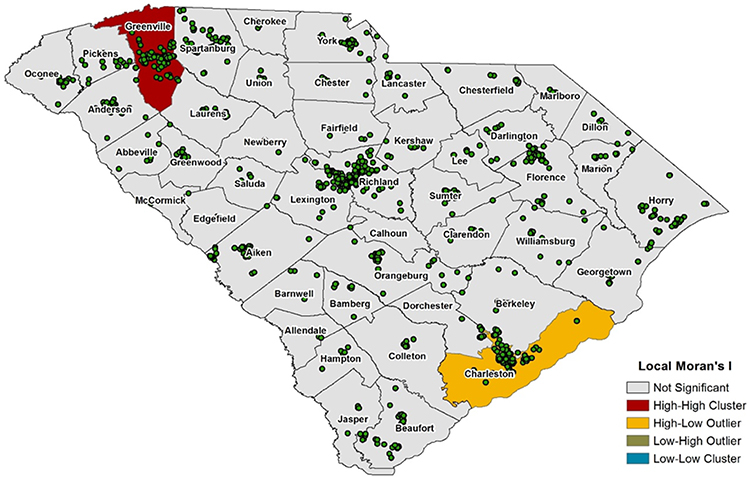 |
Figure 5 Spatial autocorrelation of healthcare facilities in South Carolina. Notes: Data from the SC GIS Data Clearinghouse – DHEC.27 |
Figures 6 and 7 show the geographic variation in access to exercise opportunities. More than 25% (n = 11) of SC counties had low access to exercise opportunities (0–25%), while less than 1% (n = 2) of the counties had high access opportunities (75–100%). McCormick (97.3%) and Greenville (77.9%) had the highest access to exercise opportunities, while spatial clusters significantly showed (P < 0.05) low access to exercise opportunities in rural counties such as Bamberg, Allendale, Hampton, and Marlboro (Low-Low). This finding emphasizes disparities in exercise opportunities between rural and urban counties.
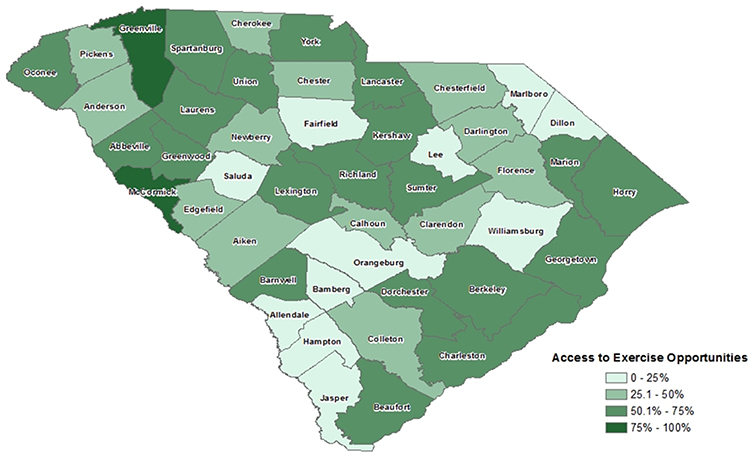 |
Figure 6 Demonstration of geographic variation in access to exercise opportunities in South Carolina. Notes: Data from the County Health Rankings.21 |
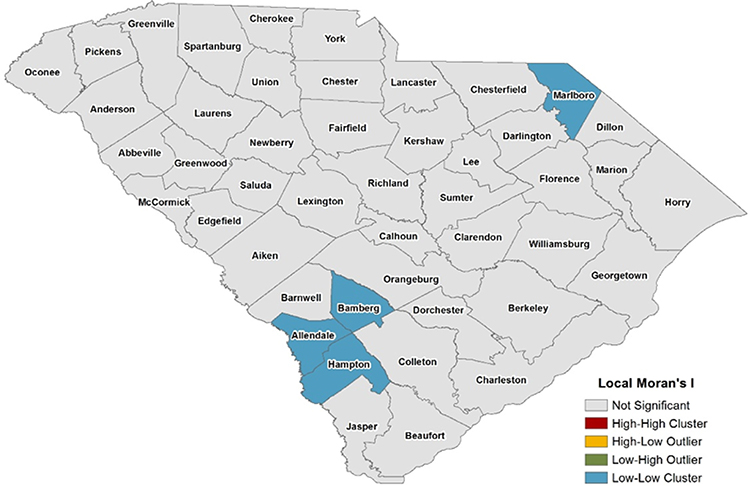 |
Figure 7 Demonstration of counties with clusters of low access to exercise opportunities in South Carolina. Notes: Data from the County Health Rankings.21 |
Regression Analysis
Obesity regression model in Table 6 shows that 73.5% of the variation in obesity is explained by the contextual factors. There was enough evidence to reject null hypothesis (p < 0.0001), and the significant predictors of obesity at 95% confidence level were, rates of physical inactivity (p = 0.011), health facilities ratio (p = 0.017), and PCP ratio per 100,000 of the adult population (p = 0.002). Adequacy of access to exercise opportunities was not significant predictor for obesity (p = 0.075). As for physical inactivity, the regression model in Table 7 shows that 72% of the variation in physical inactivity is explained by the contextual factors. There was enough evidence to reject null hypothesis (p < 0.0001), and the significant predictors of physical inactivity were, obesity rate (p = 0.011) and having a fair or poor perception about their own health (p = 0.001).
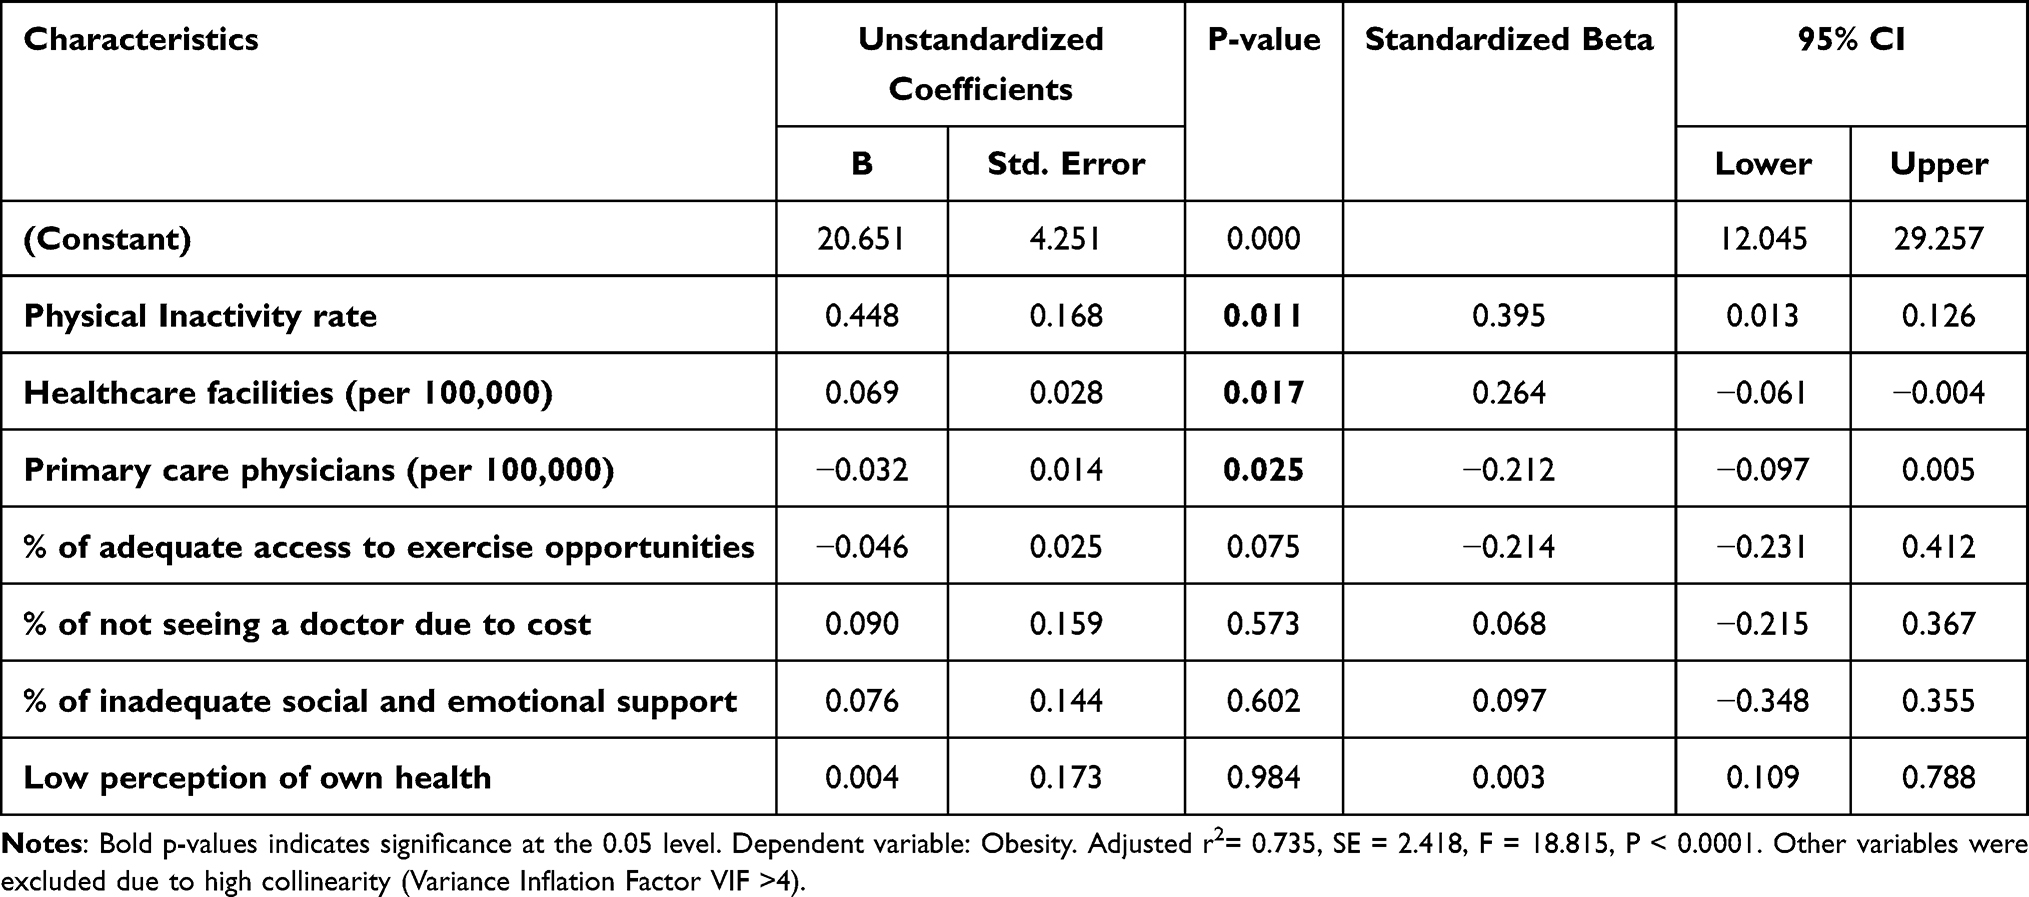 |
Table 6 Regression Analysis for Adult Obesity |
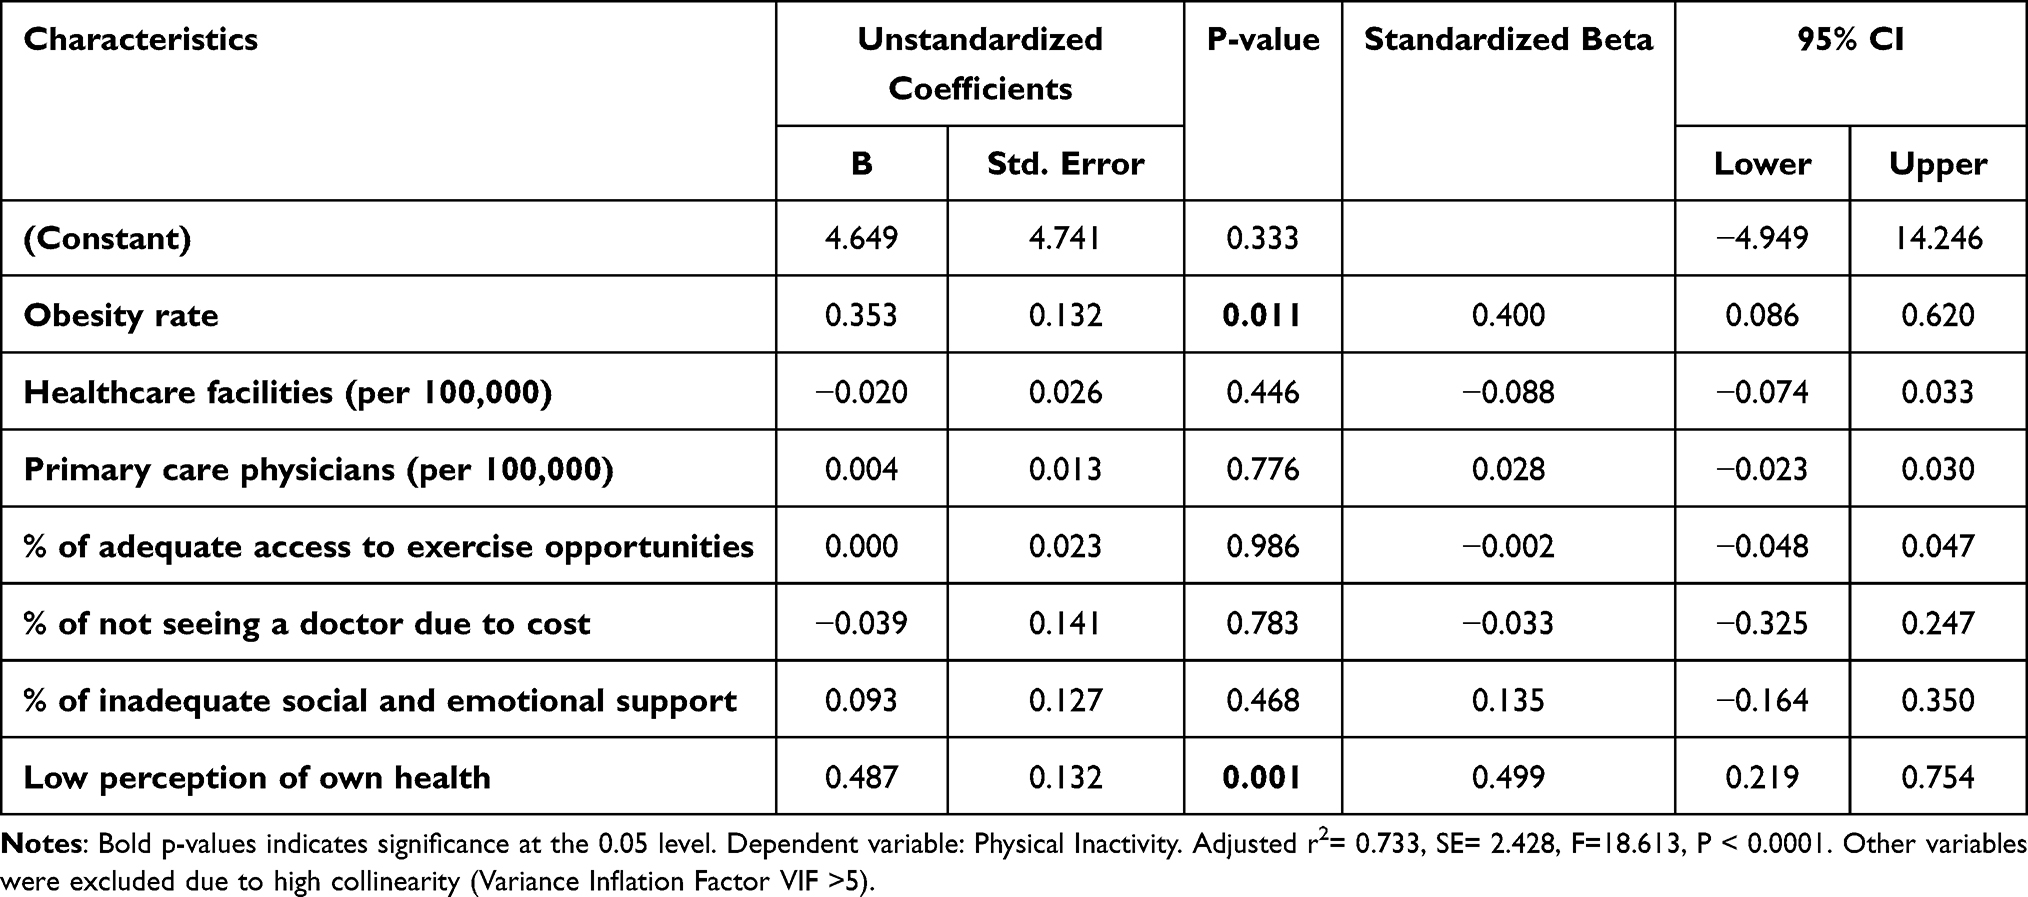 |
Table 7 Regression Analysis for Physical Inactivity |
Discussion
Capitalizing on the wide international variability in health capacity and built environments, this study integrates several databases to describe an example of the relationship between public health outcomes, built environment, and the density of healthcare capacity. By identifying clusters of obesity and physical inactivity across SC counties, the present findings highlight the significance of built environment improvements and proper healthcare resource allocation as a promising public health intervention strategy toward equitable and sustainable health outcomes.
This study found a considerable amount of variation in demographic, socioeconomic and contextual factors between rural and urban counties. Demographic and socioeconomic disparities due to geographical barriers have been shown to influence health in several studies.33–35 These studies found that differences in race, income, and health insurance between rural and urban areas are significantly associated with mortality and obesity. Allendale, a rural county in SC, had the lowest median income ($25,633), highest rates of African Americas (72.9%), and significant cluster of obesity and physical inactivity. Similarly, Patterson33 found that rural residents of every racial and ethnic group were at higher risk of obesity than urban Whites. Also, Probst et al36 found that minorities and families with lower socioeconomic status had higher odds of overweight.
Spatial analysis revealed significant clusters of high obesity and high physical inactivity in rural counties compared to urban counties. Interestingly, a study by Martin et al34 found that “the degree of urbanization is evident and robust in the South”, showing higher physical inactivity in rural compared with urban areas. On the other hand, local spatial analysis revealed high clusters of health facilities in urban compared to rural counties. Luke et al37 indicated that spatial proximities and clusters offer opportunities for hospitals to improve their performance by integrating care and coordinating services. However, other studies pointed that centralizing health facilities in urban areas may create duplicative capacities, increase travel costs, and decrease rural residents' access to facilities with high-complexity services.38–40
Healthcare Capacity
Regression and correlation results show obesity and physical inactivity to be equal predictors to one another and thus highly correlated. Obesity was positively correlated with health facilities and negatively correlated with PCP ratios in different directions. This finding was investigated to find that majority of those health facilities in rural areas have established themselves based on the high prevalence of obesity in the area rather than being based on planned preventive recommendations. Those health facilities were more likely to be hospice, rehabilitation, and surgical centers that are associated with obesity treatment rather than prevention. In this regard, health policymakers are often faced with infrastructural issues such as location and size of hospitals in the community. Thus, it is important for hospitals to develop the infrastructural capabilities according to the changing needs of the healthcare market and technologies.41
Findings also showed that PCP density a significant element associated with obesity. This is supported by several studies that discussed the role of PCP to the health system as well as the overall population health.42,43 Availability of PCPs is associated with greater patient trust in the provider, good patient-provider communication, better counseling and continuity of care.44,45 Despite those benefits, obesity counseling by PCPs may face barriers due to lack of training, lack of time, and shortage or inequality in the distribution of providers.46–48
Socioeconomic factors, preference for affluent neighborhoods, availability of technology are other reasons affecting physicians’ distribution.49,50 Furthermore, recent medical graduates may contribute to the unequal PCP distribution as they tend to be more interested in sub-specialties rather than primary care, under the effect of market motivations, ie, profit maximizing.43 In Indonesia, Meliala et al51 found that there is a concentration of specialist doctors in urban areas, where most hospitals are located. Physicians not only seek to maximize their profit in cities due to private work practice but also for the development and growth opportunities, access to supportive facilities, and increase the quality of their social life.49,51,52 Inequity in supply and distribution of physicians has been discussed in many national policy agendas and has been a continuous effort of international health policymakers.12,53
Studies have identified that even though there is significant increase in the number of physicians, the problem of inequality in the distribution of physicians continued to exist.54,55 There is also limited understanding of effective ways to achieve an improved sustainability-performance. Many health-care systems are increasing the number of medical graduates or building new health-care centers, as an attempt for making healthcare delivery sustainable. Yet, participatory and transformational health-care leaders need to encourage PCP to increase their commitment to sustainability by feeling empowered to make green behaviors in their own practices such as discouraging unhealthy lifestyles and benefiting from the natural environment, which can consequently improve population health.56
Therefore, focus should be on building health-care facilities that adopt sustainable-oriented approaches. Matsumoto et al57 compared the distribution of PCP in Japan, Britain and the United States and found that the political health system has a major role in PCP distribution in Japan and the US, while Britain had more equitable distribution and regulations. In Turkey, a two-year compulsory service law for newly graduated general practitioners and specialists have reduced the inequalities in the physician distribution.58 Thus, system-level government interventions to improve the capacity and allocation of healthcare resource is crucial to provide fair distribution of health-care facilities and physicians in rural and urban areas. Incentive and retention strategies need to be integrated into ongoing efforts to strengthen the health system and reduce inequities in population health.
Perception of Health
Low self-reported health status was a significant predictor for physical inactivity. People who are less likely to engage in leisure physical activities, were more likely to have low perception of their own health. Several studies identified the effects of health perception on living satisfaction and wellbeing activities. Lee59 found that leisure and sporting activities were recognized as ways to achieve mental and social satisfaction, and Oh60 found that swimming participation effectively decreased depression and improved psychological and physical health. Hardcastle et al61 suggested that health perception is one of the important factors to motivate individuals in promoting behavior and lifestyle. It is important to point out, however, that the observational nature of our ecological study does not allow us to examine whether physical inactivity is a downstream result of low perceived health status, or whether persons with low perceived health status tended to do less physical activity from the outset.
Built Environment
World Health Organization has identified the need to develop supportive environments promoting physical activity to achieve good health and well-being, and to control the rise of non-communicable diseases. In this study, there was a considerable decline in access to exercise opportunities between urban and rural areas. Many studies declared that geographic distance from parks and recreational facilities, fear of crime, traffic, lack of time and lack of interest in outdoor physical exercise are factors that contribute to low exercise.62–65 Studies also reported that people in rural areas had even less opportunities to exercise compared with people in urban areas due to their general better sidewalks, safer cycling paths, and more playgrounds and fitness centers.66,67 Several constraints in rural communities may be key factors for this problem, such as community design, walkability, transportation, recreational facilities, land availability, and funds that enable investment on building parks and active-friendly environments.
Despite the valuable contributions of the study, there are some limitations. First, the utilized secondary data for obesity and physical inactivity stemmed from the self-reported BRFSS survey, which is subject to underreporting of socially undesirable responses (obesity) and recall bias of reporting no-leisure activities in the past month (physical inactivity). In addition, physical inactivity question in the BRFSS was measured by a categorical answer rather than a continuous one. Hence, readers must be cautious in interpreting associations as causal relationships, especially in this cross-sectional study.
Furthermore, the measures of healthcare capacity were limited as they reflect the ratio in an area and cannot be used solely to infer the adequacy of provider resources. For example, county residents in a certain area may use health facilities and PCP services in proximate neighbored counties. Thus, spatial spillover bias might be an effect, especially in rural counties. It is recommended to measure the adequacy of healthcare capacity with more aggregate factors such as physicians’ characteristics, technology, and population needs and expectations. Future studies should consider other factors that affect obesity such as the proximity to food outlets and fast food restaurants. Finally, ecological fallacy is expected in the nature of this study, limiting its inference only to the county-level.
Conclusion
The study found significant geographic variations and high clusters of obesity and physical inactivity in rural areas, compared with high clusters of access to exercise opportunities and health-care facilities in urban areas. Analyzing patterns related to physical inactivity and obesity in the counties using GIS aided the assessment of the situation of healthcare capacity and the built environment. Local policymakers are encouraged to consider the results of this study as baseline to compare with after taking planned actions and interventions. The international health community is encouraged to utilize spatial information systems to examine variations, and recommend evidence-based recommendations to redistribute equitable public health efforts to rural and remote areas, taking this study as an example. The documentation of county-level differences would prove helpful in terms of local and international cooperation in adopting sustainable-oriented approaches and sharing knowledge toward achieving the Healthy People 2030 targets and the equity of the healthcare system. Focusing on convergent strategies that aim at solving health problems and strategies for sustainable development is a step toward transdisciplinary thinking and integration in strategy formulation to achieve desired health outcomes.
Abbreviations
AHRF, Area Health Resource File; BRFSS, Behavioral Risk Factor Surveillance System; ESRI, Environmental Systems Research Institute; GIS, Geographic Information System; PCP, Primary care physicians; TIGER, Topologically Integrated Geographic Encoding and Referencing; SC, South Carolina; US, United States.
Funding
There is no funding to report.
Disclosure
The author reports no conflicts of interest in this work.
References
1. Resolution A/RES/70/1. Transforming our world: the 2030 agenda for sustainable development. New York: Seventieth United Nations General Assembly; 2015. Available from: http://www.un.org/ga/search/view_doc.asp?symbol=A/RES/70/1&Lang=E.
2. Acharya S, Lin V, Dhingra N. The role of health in achieving the sustainable development goals. Bull World Health Organ. 2018;96(9):591–591A. doi:10.2471/BLT.18.221432
3. Gualdi-Russo E, Rinaldo N, Toselli S, Zaccagni L. Associations of physical activity and sedentary behaviour assessed by accelerometer with body composition among children and adolescents: a scoping review. Sustainability. 2021;13(1):335. doi:10.3390/su13010335
4. Kjӕrgård B, Land B, Bransholm Pedersen K. Health and sustainability. Health Promot Int. 2014;29(3):558–568. doi:10.1093/heapro/das071
5. Kickbusch I. Triggering debate, White paper: the food system—a prism of present and future challenges for health promotion and sustainable development. Health Promotion Switzerland; 2010.
6. A-Mansia Biotech. Obesity and diabetes in the world; 2021. Available from: https://www.a-mansia.com/obesity-and-diabetes-in-the-world.
7. Janssen F, Bardoutsos A, Vidra N. Obesity prevalence in the long-term future in 18 European countries and in the USA. Obes Facts. 2020;13(5):514–527. doi:10.1159/000511023
8. González-álvarez MA, Lázaro-Alquézar A, Simón-Fernández MB. Global trends in child obesity: are figures converging? Int J Environ Res Public Health. 2020;17(24):9252. doi:10.3390/ijerph17249252
9. Lim HJ, Xue H, Wang Y. Global trends in obesity. In: Meiselman HL, editor. Handbook of Eating and Drinking: Interdisciplinary Perspectives. Springer International Publishing; 2020:1217–1235. doi:10.1007/978-3-030-14504-0_157
10. Ruiz LD, Zuelch ML, Dimitratos SM, Scherr RE. Adolescent obesity: diet quality, psychosocial health, and cardiometabolic risk factors. Nutrients. 2020;12(1):43. doi:10.3390/nu12010043
11. Guthold R, Stevens GA, Riley LM, Bull FC. Worldwide trends in insufficient physical activity from 2001 to 2016: a pooled analysis of 358 population-based surveys with 1·9 million participants. Lancet Glob Health. 2018;6(10):e1077–e1086. doi:10.1016/S2214-109X(18)30357-7
12. Kohl HW
13. Andreyeva T, Luedicke J, Wang YC. State-level estimates of obesity-attributable costs of absenteeism. J Occup Environ Med Am Coll Occup Environ Med. 2014;56(11):1120–1127. doi:10.1097/JOM.0000000000000298
14. Tamura K, Puett RC, Hart JE, Starnes HA, Laden F, Troped PJ. Spatial clustering of physical activity and obesity in relation to built environment factors among older women in three U.S. states. BMC Public Health. 2014;14:1322. doi:10.1186/1471-2458-14-1322
15. Seboka B, Hailegebreal S, Yehualashet D, et al. Exploring spatial variations and determinants of dietary diversity among children in Ethiopia: spatial and multilevel analysis using EDHS (2011–2016). J Multidiscip Healthc. 2021;14:2633–2650. doi:10.2147/JMDH.S327456
16. Pawloski LR, Curtin KM, Gewa C, Attaway D. Maternal-child overweight/obesity and undernutrition in Kenya: a geographic analysis. Public Health Nutr. 2012;15(11):2140–2147. doi:10.1017/S1368980012000110
17. US Bureau of the Census American Fact Finder; 2010. Available from: http://factfinder.census.gov.
18. Census Bureau. 2011 TIGER/line shapefiles [machine-readable data files] and technical documentation prepared by the U.S; 2011. Available from: http://www.census.gov/geo/maps-data/data/tiger-line.html.
19. Health Resources and Services Administration. Area health resources files. Available from: https://data.hrsa.gov/topics/health-workforce/ahrf.
20. Centers for Disease Control and Prevention. Behavioral risk factor surveillance system. Available from: https://www.cdc.gov/brfss/index.html.
21. County health rankings & roadmaps. Available from: https://www.countyhealthrankings.org/.
22. Bowlin SJ, Morrill BD, Nafziger AN, Jenkins PL, Lewis C, Pearson TA. Validity of cardiovascular disease risk factors assessed by telephone survey: the behavioral risk factor survey. J Clin Epidemiol. 1993;46(6):561–571. doi:10.1016/0895-4356(93)90129-o
23. Bowlin SJ, Morrill BD, Nafziger AN, Lewis C, Pearson TA. Reliability and changes in validity of self-reported cardiovascular disease risk factors using dual response: the behavioral risk factor survey. J Clin Epidemiol. 1996;49(5):511–517. doi:10.1016/0895-4356(96)00010-8
24. Centers for Disease Control and Prevention. 2011–2013 National Survey of Family Growth (NSFG): summary of design and data collection methods. 2014.
25. Penchansky R, Thomas JW. The concept of access: definition and relationship to consumer satisfaction. Med Care. 1981;19(2):127–140. doi:10.1097/00005650-198102000-00001
26. Guagliardo MF. Spatial accessibility of primary care: concepts, methods and challenges. Int J Health Geogr. 2004;3(1):3. doi:10.1186/1476-072X-3-3
27. South Carolina Department of Health and Environmental Control. SC GIS data clearinghouse. Available from: https://sc-department-of-health-and-environmental-control-gis-sc-dhec.hub.arcgis.com/.
28. Roubal AM, Jovaag A, Park H, Gennuso KP. Development of a nationally representative built environment measure of access to exercise opportunities. Prev Chronic Dis. 2015;12:E09. doi:10.5888/pcd12.140378
29. Thornton PL, Kumanyika SK, Gregg EW, et al. New research directions on disparities in obesity and type 2 diabetes. Ann N Y Acad Sci. 2020;1461(1):5–24. doi:10.1111/nyas.14270
30. Okour AM, Saadeh RA, Hijazi MH, Khalaileh HEA, Alfaqih MA. Socioeconomic status, perceptions and obesity among adolescents in Jordan. Pan Afr Med J. 2019;34:148. doi:10.11604/pamj.2019.34.148.19641
31. Healthy People. Nutrition and weight status; 2020. Available from: https://www.healthypeople.gov/2020/topics-objectives/topic/nutrition-and-weight-status/objectives.
32. Guidelines for investigating clusters of health events. Available from: https://www.cdc.gov/mmwr/preview/mmwrhtml/00001797.htm.
33. Patterson PD, Moore CG, Probst JC, Shinogle JA. Obesity and physical inactivity in rural America. J Rural Health. 2004;20(2):151–159. doi:10.1111/j.1748-0361.2004.tb00022.x
34. Martin SL, Kirkner GJ, Mayo K, Matthews CE, Durstine JL, Hebert JR. Urban, rural, and regional variations in physical activity. J Rural Health. 2005;21(3):239–244. doi:10.1111/j.1748-0361.2005.tb00089.x
35. Wang Y, Beydoun MA. The obesity epidemic in the United States–gender, age, socioeconomic, racial/ ethnic, and geographic characteristics: a systematic review and meta-regression analysis. Epidemiol Rev. 2007;29:6–28. doi:10.1093/epirev/mxm007
36. Probst J, Moore C, Baxley E, Lammie J. Rural-urban differences in visits to primary care physicians. Fam Med. 2002;34:609–615.
37. Luke RD, Luke T, Muller N. Urban hospital ‘clusters’ do shift high-risk procedures to key facilities, but more could be done. Health Aff. 2011;30(9):1743–1750. doi:10.1377/hlthaff.2009.0660
38. Trinh HQ, Begun JW, Luke RD. Service duplication within urban hospital clusters. Health Care Manage Rev. 2014;39:41–49. doi:10.1097/HMR.0b013e318282660d
39. Birkmeyer JD, Siewers AE, Marth NJ, Goodman DC. Regionalization of high-risk surgery and implications for patient travel times. JAMA. 2003;290(20):2703–2708. doi:10.1001/jama.290.20.2703
40. Dimick JB, Finlayson SRG, Birkmeyer JD. Regional availability of high-volume hospitals for major surgery. Health Aff Proj Hope. 2004;23:VAR45–VAR53. doi:10.1377/hlthaff.var.45
41. Mckee M. Measuring the efficiency of health systems - the world health report sets the agenda, but there’s still a long way to go. BMJ. 2001;323:295–296. doi:10.1136/bmj.323.7308.295
42. Wang W, Shi L, Yin A, et al. Contribution of primary care to health: an individual level analysis from Tibet, China. Int J Equity Health. 2015;14:107. doi:10.1186/s12939-015-0255-y
43. Starfield B, Shi L, Macinko J. Contribution of primary care to health systems and health. Milbank Q. 2005;83(3):457–502. doi:10.1111/j.1468-0009.2005.00409.x
44. World Health Organization. Noncommunicable diseases and mental health cluster. A Global Review of Primary Health Care: Emerging Messages: Global Report. World Health Organization; 2003.
45. Ward MC, Miller BF, Marconi VC, Kaslow NJ, Farber EW. The role of behavioral health in optimizing care for complex patients in the primary care setting. J Gen Intern Med. 2016;31(3):265–267. doi:10.1007/s11606-015-3499-8
46. Lewis KH, Gudzune KA. Overcoming challenges to obesity counseling: suggestions for the primary care provider. J Clin Outcomes Manag. 2014;21:123–133.
47. Theodorakis PN, Mantzavinis GD. Inequalities in the distribution of rural primary care physicians in two remote neighboring prefectures of Greece and Albania. Rural Remote Health. 2005;5(3):457.
48. Petterson S, Robert L, Phillips J, Bazemore A, Koinis GT. Unequal distribution of the U.S. primary care workforce. Am Fam Physician. 2013;87:11.
49. Mistretta MJ. Differential effects of economic factors on specialist and family physician distribution in Illinois: a county-level analysis. J Rural Health. 2007;23(3):215–221. doi:10.1111/j.1748-0361.2007.00093.x
50. Frehywot S, Mullan F, Payne PW, Ross H. Compulsory service programmes for recruiting health workers in remote and rural areas: do they work? Bull World Health Organ. 2010;88(5):364–370. doi:10.2471/BLT.09.071605
51. Meliala A, Hort K, Trisnantoro L. Addressing the unequal geographic distribution of specialist doctors in Indonesia: the role of the private sector and effectiveness of current regulations. Soc Sci Med. 2013;82:30–34. doi:10.1016/j.socscimed.2013.01.029
52. Isabel C, Paula V. Geographic distribution of physicians in Portugal. Eur J Health Econ. 2010;11(4):383–393. doi:10.1007/s10198-009-0208-8
53. World Health Organization. Health workforce requirements for universal health coverage and the sustainable development goals. (Human resources for health observer, 17). World Health Organization; 2016.
54. Hann M, Gravelle H. The maldistribution of general practitioners in England and Wales: 1974–2003. Br J Gen Pract. 2004;54(509):894–898.
55. Zhang J, Han P, Sun Y, Zhao J, Yang L. Assessing spatial accessibility to primary health care services in Beijing, China. Int J Environ Res Public Health. 2021;18(24):13182. doi:10.3390/ijerph182413182
56. Pinzone M, Lettieri E, Masella C. Sustainability in healthcare: combining organizational and architectural levers. Int J Eng Bus Manag. 2012;4:38. doi:10.5772/54841
57. Matsumoto M, Inoue K, Farmer J, Inada H, Kajii E. Geographic distribution of primary care physicians in Japan and Britain. Health Place. 2010;16(1):164–166. doi:10.1016/j.healthplace.2009.07.005
58. Ünal E. How the government intervention affects the distribution of physicians in Turkey between 1965 and 2000. Int J Equity Health. 2015;14(1):1. doi:10.1186/s12939-014-0131-1
59. Lee BA, Oh DJ. The effects of health perception on living health belief, living satisfaction and wellbeing-oriented activities according to swimming participation with middle-aged women. J Exerc Rehabil. 2013;9(3):381–388. doi:10.12965/jer.130047
60. Oh DJ, Lee BA. Effects of participation in swimming lessons on health perception and belief. J Exerc Rehabil. 2015;11(1):48–56. doi:10.12965/jer.150185
61. Hardcastle SJ, Hancox J, Hattar A, Maxwell-Smith C, Thøgersen-Ntoumani C, Hagger MS. Motivating the unmotivated: how can health behavior be changed in those unwilling to change? Front Psychol. 2015;6:835. doi:10.3389/fpsyg.2015.00835
62. Boer R, Zheng Y, Overton A, Ridgeway GK, Cohen DA. Neighborhood design and walking trips in ten U.S. metropolitan areas. Am J Prev Med. 2007;32(4):298–304. doi:10.1016/j.amepre.2006.12.012
63. Gordon-Larsen P, Nelson MC, Page P, Popkin BM. Inequality in the built environment underlies key health disparities in physical activity and obesity. Pediatrics. 2006;117(2):417–424. doi:10.1542/peds.2005-0058
64. Li F, Fisher K, Brownson R, Bosworth M. Multilevel modelling of built environment characteristics related to neighbourhood walking activity in older adults. J Epidemiol Community Health. 2005;59(7):558. doi:10.1136/jech.2004.028399
65. Chigbu CO, Berger U, Aniebue U, Parhofer KG. Physical activity and outdoor leisure time physical exercise: a population study of correlates and hindrances in a resource-constrained African setting. J Multidiscip Healthc. 2020;13:1791–1799. doi:10.2147/JMDH.S281518
66. Yang W, Spears K, Zhang F, Lee W, Himler HL. Evaluation of personal and built environment attributes to physical activity: a multilevel analysis on multiple population-based data sources. J Obes. 2012;2012:548910. doi:10.1155/2012/548910
67. Handy SL, Boarnet MG, Ewing R, Killingsworth RE. How the built environment affects physical activity: views from urban planning. Am J Prev Med. 2002;23(2 Suppl):64–73. doi:10.1016/s0749-3797(02)00475-0
 © 2022 The Author(s). This work is published and licensed by Dove Medical Press Limited. The
full terms of this license are available at https://www.dovepress.com/terms
and incorporate the Creative Commons Attribution
- Non Commercial (unported, 3.0) License.
By accessing the work you hereby accept the Terms. Non-commercial uses of the work are permitted
without any further permission from Dove Medical Press Limited, provided the work is properly
attributed. For permission for commercial use of this work, please see paragraphs 4.2 and 5 of our Terms.
© 2022 The Author(s). This work is published and licensed by Dove Medical Press Limited. The
full terms of this license are available at https://www.dovepress.com/terms
and incorporate the Creative Commons Attribution
- Non Commercial (unported, 3.0) License.
By accessing the work you hereby accept the Terms. Non-commercial uses of the work are permitted
without any further permission from Dove Medical Press Limited, provided the work is properly
attributed. For permission for commercial use of this work, please see paragraphs 4.2 and 5 of our Terms.