")
Back to Journals » Infection and Drug Resistance » Volume 15
Association of TyG Index with CT Features in Patients with Tuberculosis and Diabetes Mellitus
Authors Chen Y , Peng A, Chen Y, Kong X, Li L, Tang G, Li H, Chen Y, Jiang F, Li P, Zhang Q
Received 5 November 2021
Accepted for publication 30 December 2021
Published 12 January 2022 Volume 2022:15 Pages 111—125
DOI https://doi.org/10.2147/IDR.S347089
Checked for plagiarism Yes
Review by Single anonymous peer review
Peer reviewer comments 2
Editor who approved publication: Professor Suresh Antony
Yong Chen,1,* Anzhou Peng,2,* Yiqing Chen,1 Xianghua Kong,2 Linyang Li,2 Guangxiao Tang,3 Huifen Li,2 Yu Chen,4 Fan Jiang,2 Peibo Li,5 Qiu Zhang1
1Department of Endocrinology, First Affiliated Hospital of Anhui Medical University, Hefei, Anhui, 230022, People’s Republic of China; 2Department of the Fifth Tuberculosis, Chongqing Public Health Medical Center, Chongqing, People’s Republic of China; 3Department of Radiology, Chongqing Public Health Medical Center, Chongqing, People’s Republic of China; 4Department of Medical Record Statistics Room, Chongqing Public Health Medical Center, Chongqing, People’s Republic of China; 5Department of Physician Assistant, Chongqing Public Health Medical Center, Chongqing, People’s Republic of China
*These authors contributed equally to this work
Correspondence: Qiu Zhang; Peibo Li Tel +8613965015060; +8618709843713
Email [email protected]; [email protected]
Background: The purpose of this study was to investigate the association of the triglyceride glucose (TyG) index, a surrogate marker of insulin resistance (IR) with a high sensitivity of 96.5% and a specificity of 85.0% for the diagnosis of IR, with computed tomography (CT) features in patients with tuberculosis and diabetes mellitus.
Methods: A total of 247 subjects were enrolled from July, 2020 to May, 2021. The basic clinical features and CT features were analyzed. In addition, multivariate logistic regression analysis models were employed to evaluate the association of the TyG indicator with CT features in participants.
Results: In the quartile groups of TyG index, air bronchial sign detection rate was 11.7%, 14.5%, 23.2%, and 44.1%; large segmented leafy shadow detection rate was 27.9%, 40.6%, 46.4%, and 66.2%; thick-walled cavity was found in 38.2%, 43.4%, 57.9%, and 69.1%; the rate of multiple cavities was 17.6%, 27.5%, 36.2%, 52.9%; the rate of lymph node enlargement was 22.1%, 17.4%, 28.9%, and 38.2%, respectively. In addition, the positive relation with the TyG index and the prevalence of abnormal CT signs was observed in the fully adjusted model: TyG, per one-unit increase: air bronchial sign: adjusted odds ratio (AOR) 3.92, 95% CI 1– 15.35, P = 0.049; multiple cavities: AOR 4.1, 95% CI 1.26– 13.31, P = 0.019; thick-walled cavity: AOR 2.89, 95% CI 1.05– 8.03, P = 0.041. In quartile of TyG index, compared with patients in quartile 1, the AOR (95% CI) values for air bronchial sign in quartile 4 was 8.1 (1.7– 44), p = 0.011; multiple cavities was 7.1 (1.7– 32), p = 0.008; thick-walled cavity was 7.8 (1.9– 34.7), p = 0.005.
Conclusion: The present study showed that an increased TyG index was positively related to the severity of patients with T2DM-PTB.
Keywords: CT features, insulin resistance, triglyceride glucose index, pulmonary tuberculosis, T2DM
Introduction
Tuberculosis (TB) is currently one of the major contributors of death due to infectious diseases and is a critical global public health care issue with a high incidence in many developing countries.1 According to the report of the Global tuberculosis report 2021, China has the second largest TB burden in the world, accounting for 8.5% of global TB incidence in 2020.2 Some infectious and non-infectious comorbidities have been considered risk factors for the progress of pulmonary TB (PTB), such as human immune deficiency virus (HIV) infection, T2DM, malnutrition, tobacco smoking and alcoholism related diseases.3
T2DM is a potential risk factor for tuberculosis. Some meta-analysis studies have demonstrated that compared with patients with solitary PTB, patients with T2DM-PTB show a 2-to-4-fold higher risk of developing active or multidrug-resistant TB.4–6 A strong relationship exists between TB and T2DM. A recent meta-analysis reported that 16% of newly treated patients with TB have T2DM and approximately 4.1% of patients with T2DM may progress to TB.7 In 2017, approximately 800,000 newly diagnosed cases of TB were ascribed to T2DM, and T2DM is the main risk factor that contributes to most case of TB in developing countries, even more than that contributed HIV infection.8
Generally, patients with T2DM-PTB exhibit the pathophysiological characteristic of disturbance of glucose and lipid-metabolism. Previous research has shown that insulin resistance (IR) plays a role in the pathogenesis of TB to a certain extent.9,10 IR is a hallmark of metabolism disorders and systemic inflammation.11 The current detection tests to evaluate IR are hyperinsulinaemic-euglycaemic clamps and homeostatic model assessment (HOMA), which are costly and complicated and are therefore inconvenient for routine clinical practice.12 Hence, a reliable and simple index to assess IR effectively is urgently required. Recently, a novel and convenient indicator, triglyceride glucose (TyG) indicator, has been reported to be a dependable alternative for the diagnosis of IR with a high sensitivity and specificity.13 Several studies have proved that the TyG indicator is correlated with an increased risk of T2DM, high blood pressure, metabolic syndrome, and heart disease.14–17
As far as we know, the correlation between CT imaging features and the TyG index in patients with T2DM-PTB remains unknown. Recently, Yang et al18 reported that the association of imaging findings of patients with T2DM-PTB with HOMA-IR values. However, HOMA-IR may not be an ideal method for routine clinical monitoring for many hospitals because of its high cost and complexity. Moreover, potential TB risk factors (eg, age, sex, body mass index (BMI), smoking status and alcoholism, dyslipidemia, blood pressure, and HbA1c level) were not included in the multivariate analysis to determine the association between imaging findings and HOMA-IR in their study. We believe that some potential confounding factors is important to enhance the reliability of the model. To address this knowledge gap and explore the association between the TyG indicator and CT characteristics and clinical features of patients with T2DM-PTB, we conducted the present study to help clinicians to evaluate the severity of patients with T2DM-PTB through a simple and effective method.
Methods
Study Design
This was a retrospective cross-sectional study, which was carried out in the Chongqing Public Health Medical Center (CPHM). From July, 2020 to May, 2021, 247 patients (aged 27–90 years) with the diagnosis of T2DM-PTB were enrolled. The main inclusion criteria were as follows: (1) age no less than 18 years; (2) antituberculosis therapy no more than one week before hospitalization in CPHM. Previous studies have reported that antituberculosis therapy may impact the blood glucose of patients after 2 weeks, especially rifampicin and isoniazid;19–22 (3) the diagnostic criterion of active PTB conform to at least one following laboratory test: sputum or Bronchial lavage fluid (BALF) smear positive, sputum or BALF bacterial culture positive, GeneXpert Mycobacterium tuberculosis/rifampicin resistance in sputum or BALF positive. Patients were excluded based on the following criteria: (4) using lipid-lower agents; (5) Patients who had incomplete clinical data, history of tumor, rheumatoid arthritis, or asthma, or coinfected with HIV and HBV.
Data Collection and Definitions
The clinical features of all subjects, including age, sex, body mass index (BMI), smoking status, drinking history, Symptoms, comorbidities, blood pressure, serum lipid, fasting blood glucose (FBG), HbA1c, Platelet, coagulation indices, including Prothrombin time (PT), activated partial thromboplastin time (APTT), mean platelet volume (MPV), plateletcrit (PCT), platelet distribution width (PDW), and medical medications history were all copied from the Electronics Medical Records (EMR) management system of CPHM.
Definition of Variables
TyG Index
We evaluated the TyG index using the following formula: Ln (fasting TG [mg/dL] × FBG [mg/dL]/2).13 TyG index was categorized as four groups according to its quartile in this study.
Smoking Status
Smoking status was defined as if one smoked at least 100 cigarettes in life: Yes (smoker) or No (non-smoker).
Drinking History
We defined one as one has ever had 1 drink of any alcoholic beverages, including liquor, beer, wine, wine coolers, and any other type of alcoholic beverage in his/her entire life, not counting small tastes or sips.
Comorbidities
It included hypertension, dyslipidemia, pneumonia, chronic obstructive pulmonary disease, coronary heart disease, bronchiectasis, hypoproteinemia, and renal failure.
Antidiabetic Use
It included Oral antidiabetic agents and insulin.
Diabetes Mellitus
We defined diabetes mellitus as patients who self-reported, HbA1c ≥6.5%, or FBG ≥7 mmol/L.23
Diabetes Status
It was classified as diabetes-poor control (HbA1c ≥7%) or diabetes-good control (HbA1c <7%).
Dyslipidemia
Based on the 2007 Chinese guidelines on the prevention and treatment of dyslipidemia,24 dyslipidemia was defined as TC (total cholesterol)≥6.2 mmol/L, TG (triglyceride) ≥2.3 mmol/L, HDL-C <1.0 mmol/L, low-density lipoprotein cholesterol (LDL-C) ≥4.1 mmol/L. Diabetes mellitus was defined as FBG ≥ 7.0 mmol/L, postprandial blood glucose (PBG) ≥11.1 mmol/L, glycated haemoglobin (HbA1c) ≥6.5% or self-reported use of antidiabetic medication.
CT Image Acquisition and Definition
Two experienced radiologists who were blinded to the related clinical data examined the CT images, and a senior TB expert made the final decision if the explanations of imaging results from the two radiologists were different. The CT examination was performed using Aquilion (Toshiba Medical Systems, Tokyo, Japan). The scan layer thickness and interval, 5.0 and 5.0 mm, respectively. The imaging assessments consisted of number of pulmonary lobes involved; (a) small patchy shadow (the lesions in the lungs were high density and the central density was higher than the periphery, and the edges were blurred); (b) air bronchial sign (the phenomenon of air-filled bronchi being made visible by the opacification of surrounding alveoli. It is almost always caused by a pathologic airspace/alveolar process, in which something other than air fills the alveoli); (c) large segmented leafy shadow (pathological tissues that caused by inflammation, edema, bleeding would replace the gas in the alveolar space to produce flaky shadows. The lesion that appears as a larger segment of the lung has an increased density and uniform solid shadow);18 (d) cavity (a pathologic gas-filled space in the lung parenchyma with a border, or wall, which was caused by infection with a pathogen of the M. tuberculosis complex).25 The CT feature of cavities is divided into several types: (1) the thick-walled cavity: cavity wall is >3 mm; (2) the thin-walled cavity: cavity wall is < 3mm; (3) The multiple cavity: the number of cavities on the CT imaging ≥2; (4) Single cavity: solitary cavity on the CT imaging; calcification (deposits of calcium that appear white on CT imaging and may present as parenchymal granulomas, mediastinal lymph nodes, and fibronodular areas of lung involvement); fibrosis (reticulation, architectural distortion, and honeycombing involving the lung lobes); pleural effusion (presence of a significant amount of fluid within the pleural space); and lymph node enlargement (presence of enlargement of lymph nodes in one or both hila or within the mediastinum, and the lymph node ≥10 mm in short axis diameter).
Statistical Analysis
Patients enrolled were divided into four groups based on the quartile of the TyG indicator in our study. Continuous variables were expressed as the mean (standard deviation, SD) or median [interquartile range, IQR] depending on the normality of the data distribution. Categorical variables were expressed of number subjects (percentage). One-way analysis of variance was employed to compare with the differences in continuous variables with a normal distribution across the TyG index quartile, while the Kruskal–Wallis H-test was performed to explore the differences in skewed distribution. Chi-square test or Fisher’s exact test was performed to analyse the differences in categorical variables.
Multivariable logistic regression analysis models were employed to evaluate the association of the TyG indicator with the CT features in patients with T2DM-PTB. The TyG indicator was analyzed as continuous variables or categorized into quartiles. Three models were established to adjust for potential confounding factors. (1) Model 1: age, sex; (2) model 2: model 1 plus BMI, systolic blood pressure (SBP), and diastolic blood pressure (DBP), smoking status, alcohol consumption, dyslipidemia; (3) model 3: model 2 plus comorbidities, FBG, HbA1c, antidiabetic medications, TG, LDL, PT, and APTT. Spearman correlation analyses of CT features with the TyG index was applied. Corrplot package of R platform was employed to study the associations between TyG index, lipid-metabolic, and hypercoagulation components.
To assess the predictive value of the TyG index for CT features, the area under the curve (AUC), 95% confidence interval (95% CI), sensitivity, specificity, and the optimal cut-off value were determined by a Receiver Operating Characteristic (ROC) curve.
Statistical analyses were performed in this study using RStudio (version 1.4.1717). The difference was considered statistically significant at two-sided P < 0.05. To minimize the risk of type I error, all the analyses were corrected for multiple comparisons using the stringent Bonferroni method, which is dividing 0.05 by the number of comparisons.
Results
Baseline Characteristics
A total of 274 patients between July, 2020 to May, 2021 were included in the study. A flow chart of the study population is shown in Figure 1. The detailed clinical characteristics based on the quartile of the TyG index are shown in Table 1. Variables such as BMI, DBP, FBG, HbA1c, triglyceride, total cholesterol, LDL-C, PT, PDW, diabetes-poor control, air bronchial sign, large segmented leafy shadow, multiple cavities, and thick-walled cavity are all significantly increased with TyG index quartile, while PT reduced with TyG index quartile. After Bonferroni correction, Patients in the highest quartile presented higher BMI, DBP, FBG, HbA1c, triglyceride, total cholesterol, LDL-C, PT, PDW, air bronchial sign, diabetes-poor control, large segmented leafy shadow, multiple cavities, and thick-walled cavity, and lower value of PT compared to the first quartile of TyG index.
 | 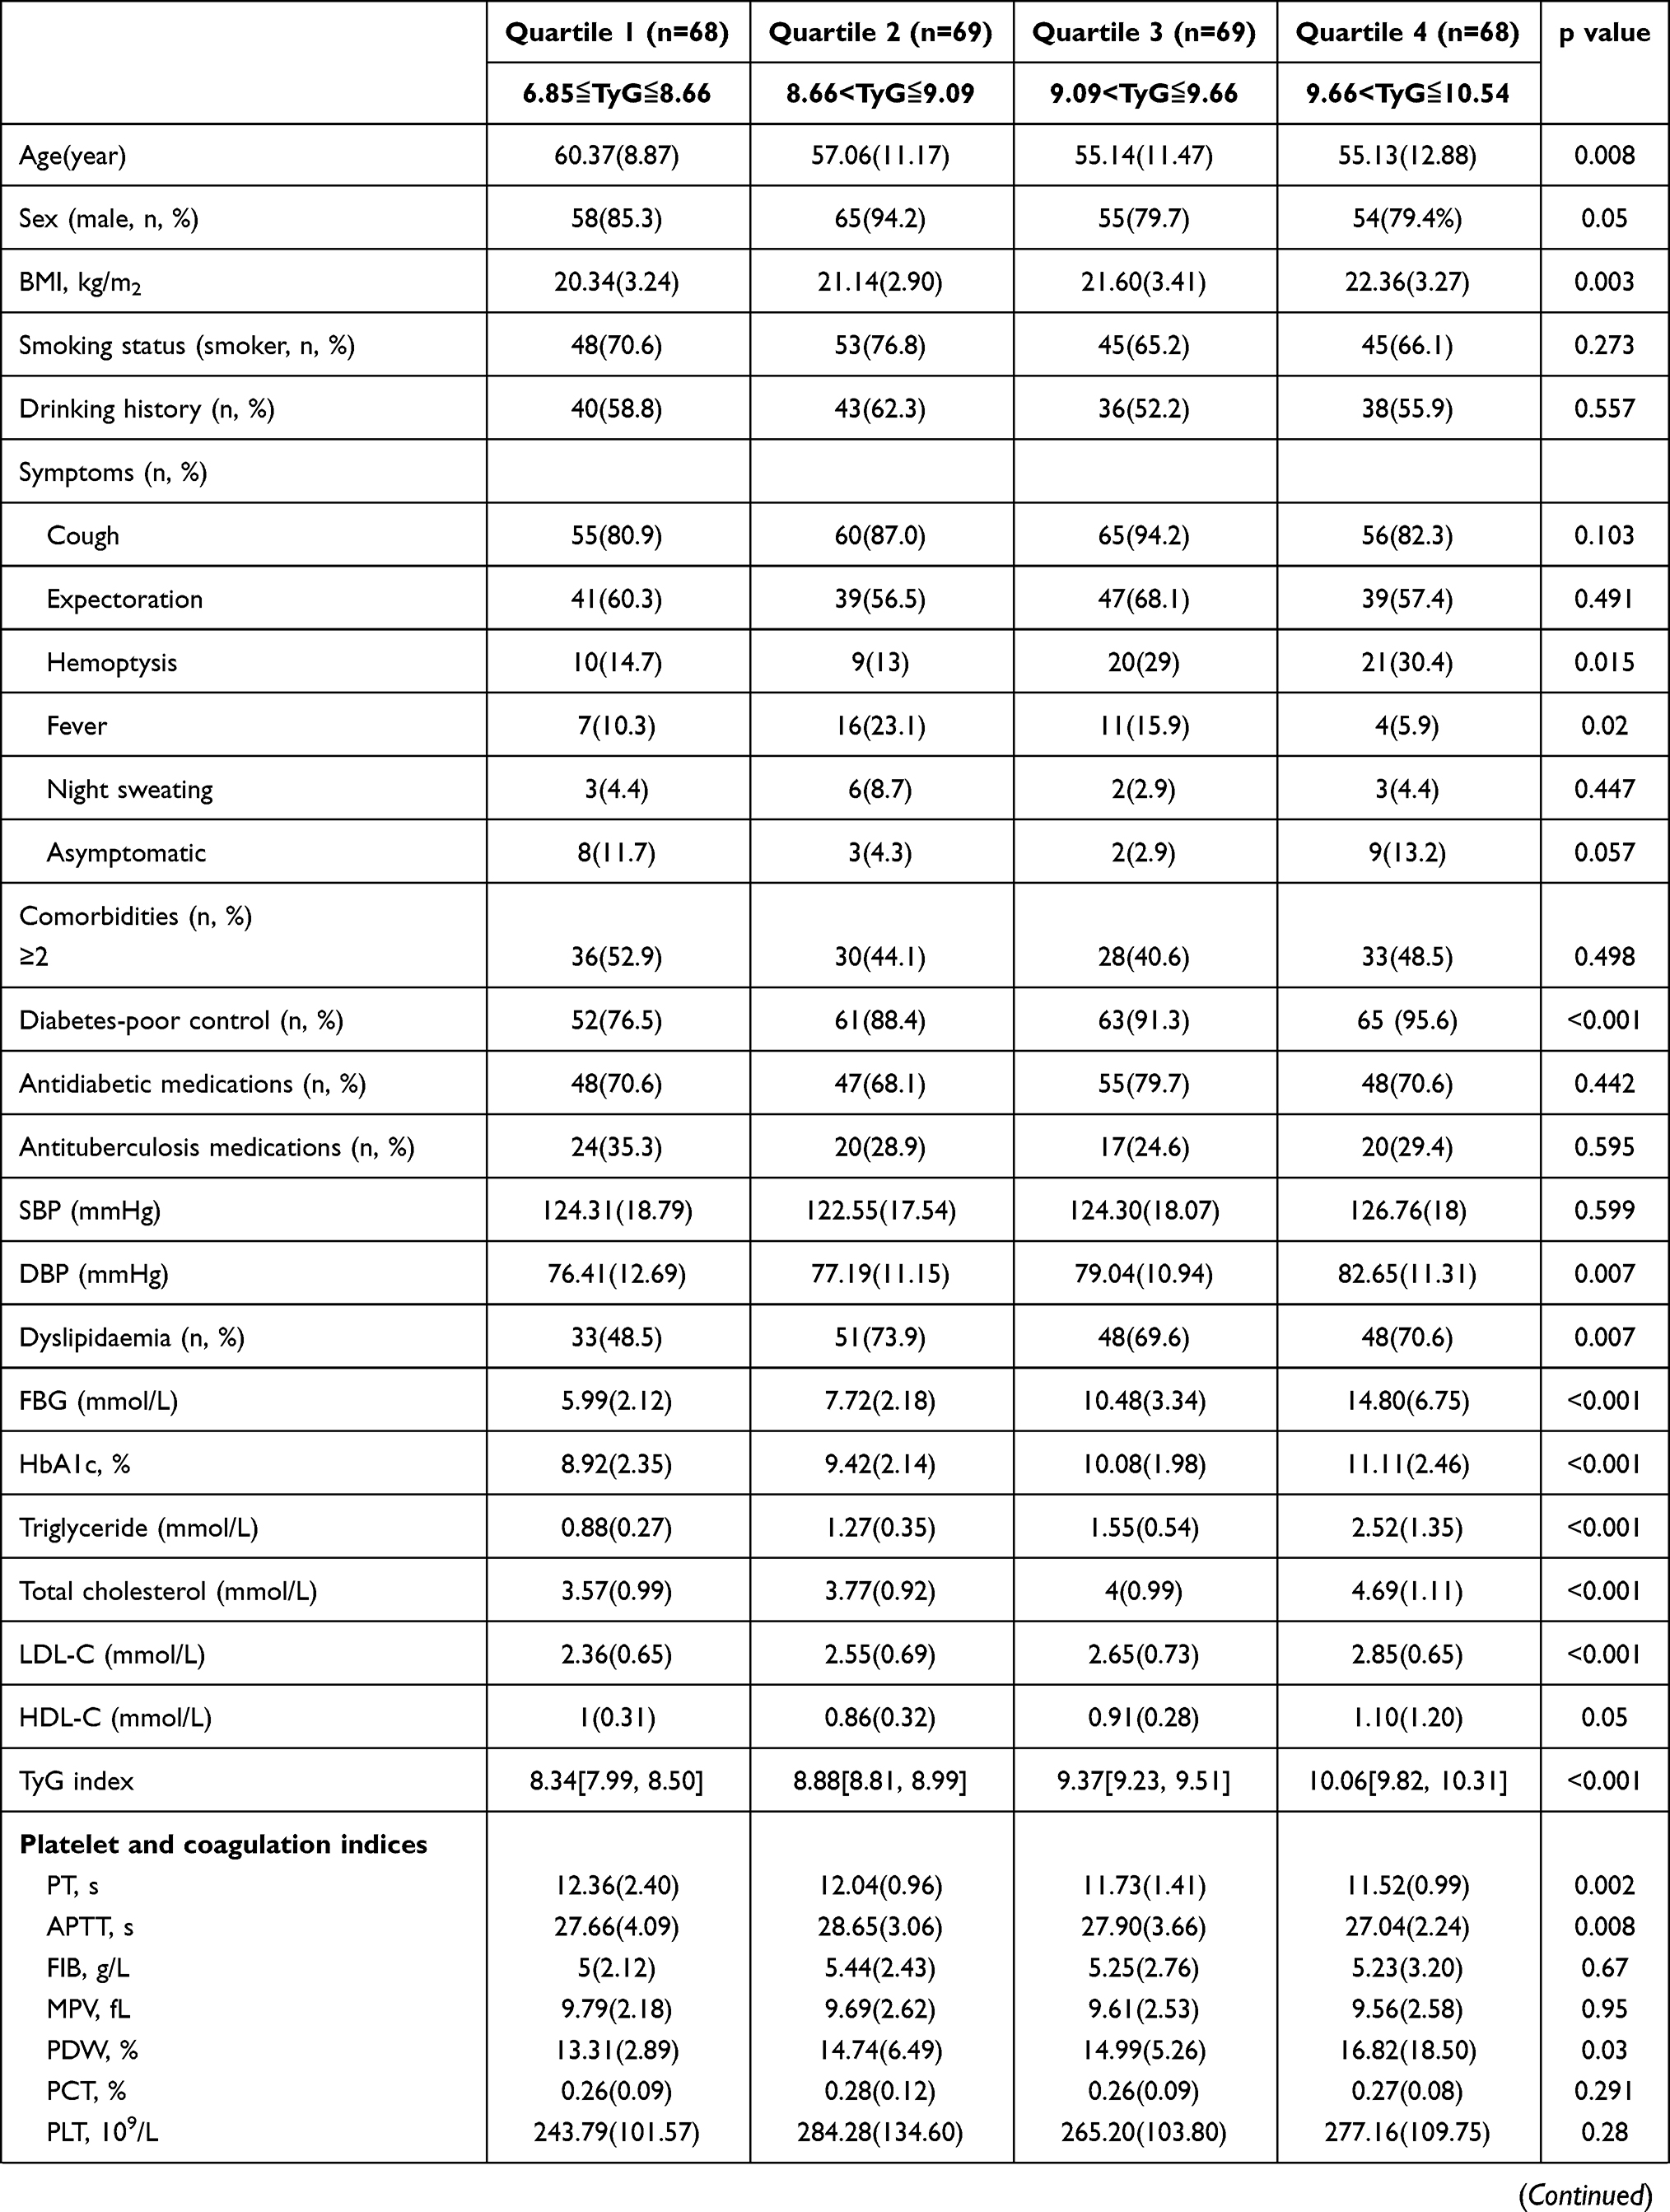 | 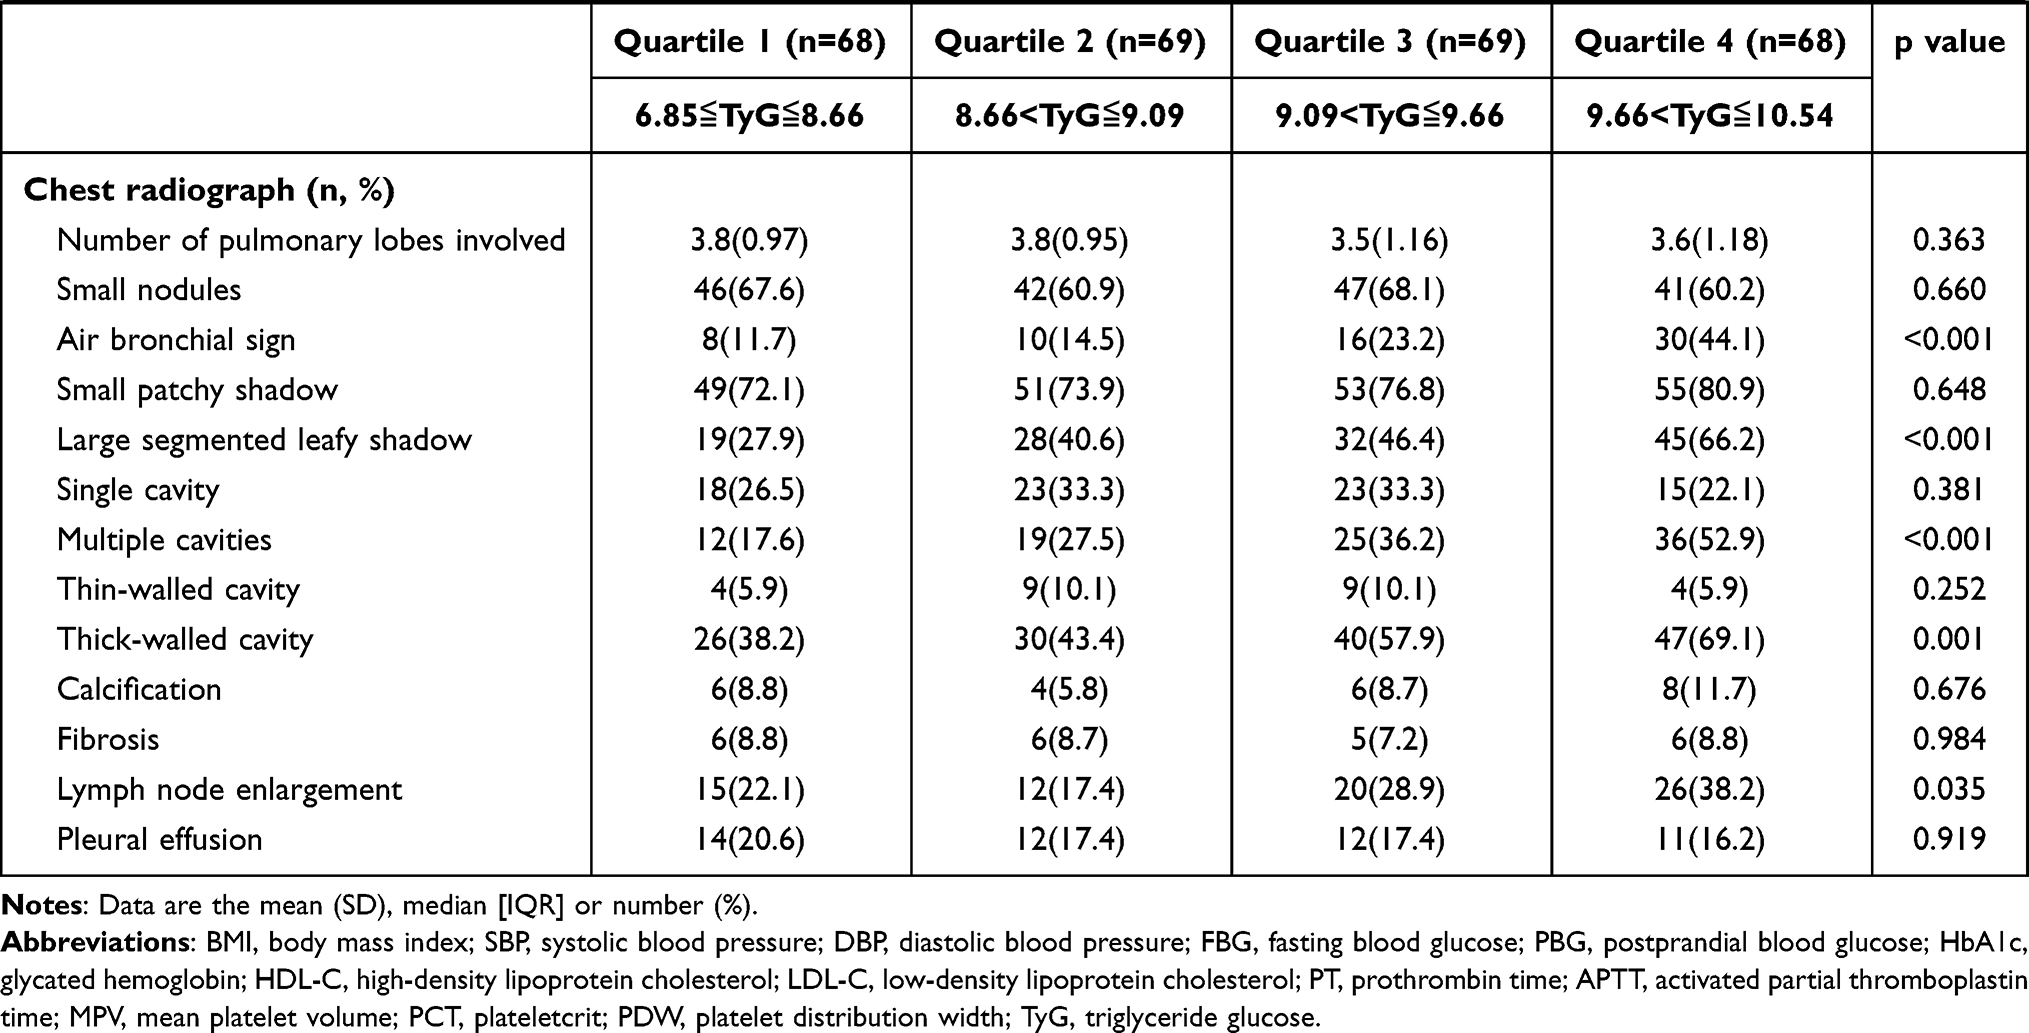 |
Table 1 Baseline Features of Patients Stratified by Quartile of TyG Index |
 |
Figure 1 Flow chart of the study population. |
The Detection Rate of CT Imaging Features in Patients with T2DM-PTB with the Quartile of TyG Index Group
Figure 2 demonstrates the five typical imaging characters in pulmonary and mediastinal window: air bronchial sign, large segmented leafy shadow, thick-walled cavity, multiple cavities, and lymph node enlargement. The quartile 4 of the TyG index accounted for the largest proportion in each of five chest radiograph signs (Figure 3). As shown in Table 1, there was a significant difference in air bronchial sign (p < 0.001), large segmented leafy shadow (p < 0.001), thick-walled cavity (p = 0.001), multiple cavities (p < 0.001), and lymph node enlargement (0.035) between the four TyG index groups.
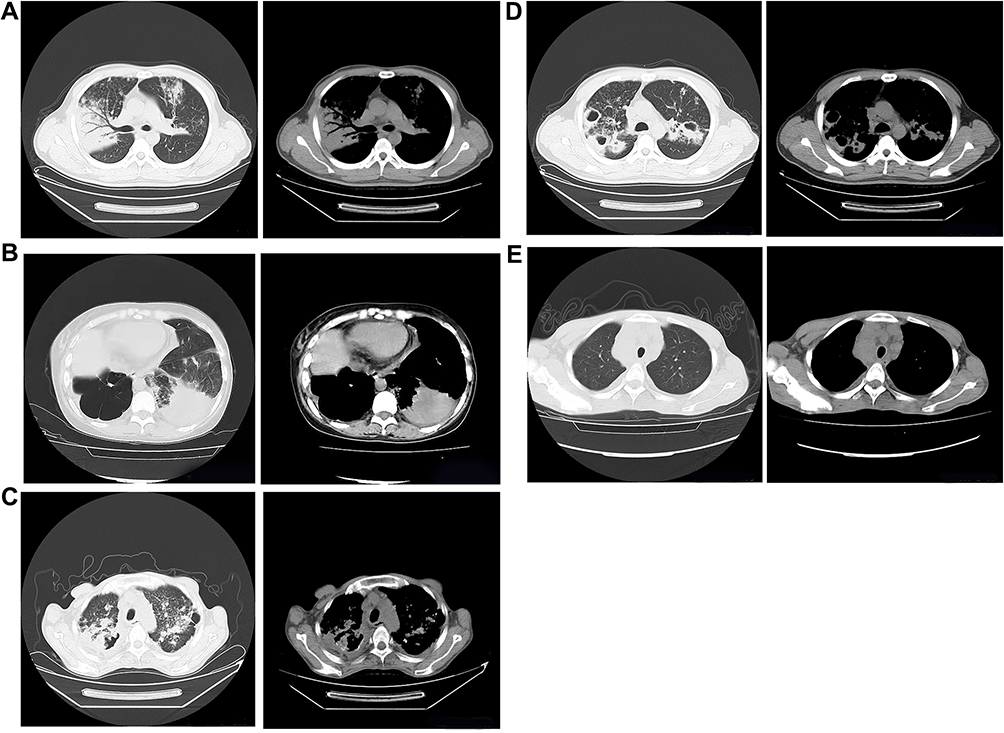 |
Figure 2 Chest radiograph signs in pulmonary window and mediastinal window. (A) Air bronchial sign. (B) Large segmented leafy shadow. (C) Thick-walled cavity. (D) Multiple cavities. (E) Lymph node enlargement. |
 |
Figure 3 Chest radiograph signs in pulmonary window and mediastinal window. |
Correlation Analysis of the TyG Index and CT Imaging Features
Significant correlations between air bronchial sign (r = 0.273, P < 0.001), large segmented leafy shadow (r = 0.287, P < 0.001), multiple cavities (r = 0.27, P < 0.001), thick-walled cavity (r = 0.224, P < 0.001), and lymph node enlargement (r = 0.176, P =0.001) and the TyG index are presented in Table 2.
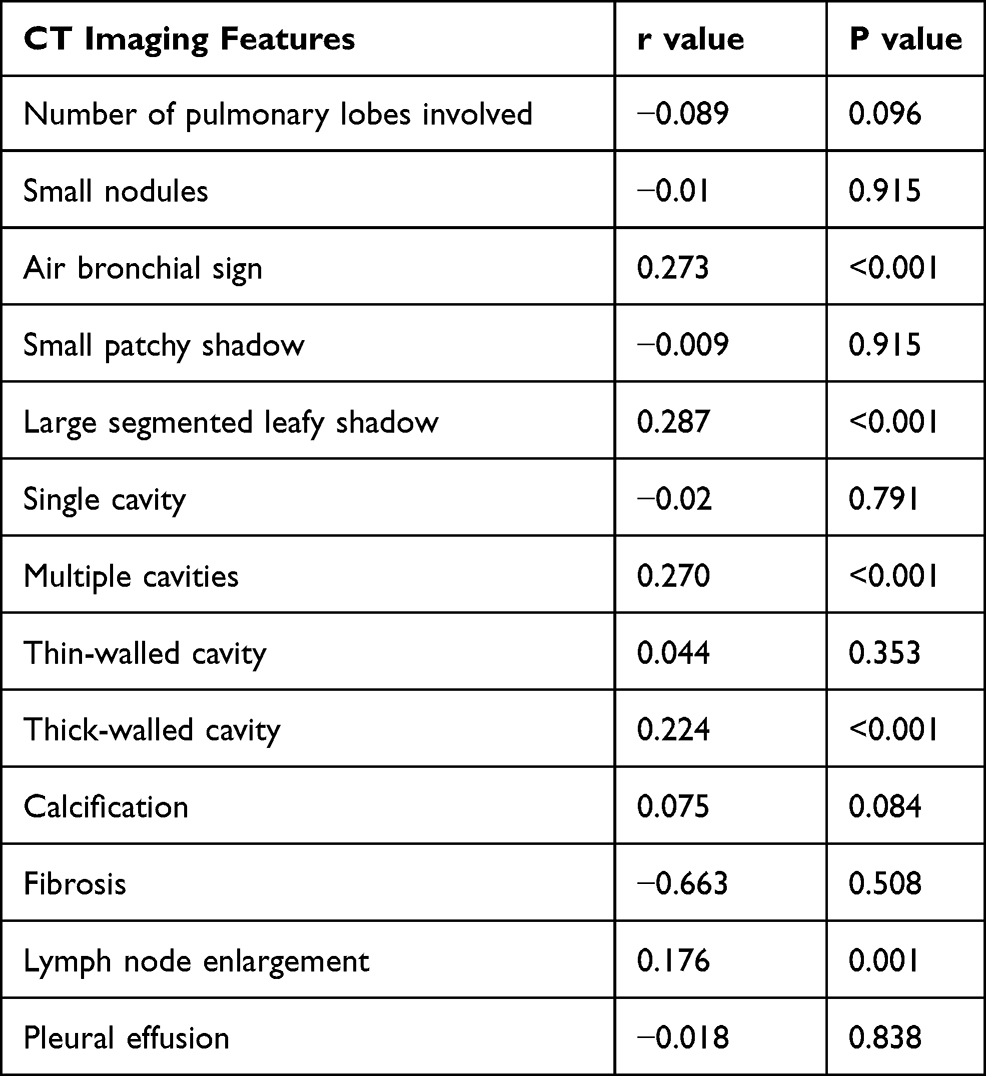 |
Table 2 Correlations Between the TyG Index and CT Imaging Features |
Association of CT Imaging Features and the TyG Index in Multivariable Logistic Regression Analysis Models
We used multivariable logistic regression analysis models to quantify the association of CT features in patients with T2DM-PTB and TyG index, which was independently associated with multiple cavities, thick-walled cavities, and air bronchial sign (Table 3). At first, we set the TyG index as a continuous variable. In model 3 (the fully adjusted model), a one-unit increase in the TyG index was associated with an increased risk of air bronchial sign (AOR = 3.920, 95% CI = 1–15.35, p = 0.049) (Figure 4), multiple cavities (AOR = 4.1, 95% CI = 1.26–13.31, p = 0.019) (Figure 5), and thick-walled cavity (AOR = 2.9, 95% CI = 1.05–8.03, p = 0.041) (Figure 6). When the TyG index was divided into quartiles, the association remains unchanged in the 3 models (Table 3). As demonstrated in Table 3, after fully adjusting possible confounding factors in model 3, compared to the reference quartile 1, the AOR values for subjects in quartile 4 with air bronchial sign was 8.07 (95% CI = 1.702–44.026, p = 0.011), multiple cavities 7.75 (95% CI = 1.714–31.95, p = 0.008), and thick-walled cavity 7.82 (95% CI = 1.865–34.706, p = 0.005), respectively.
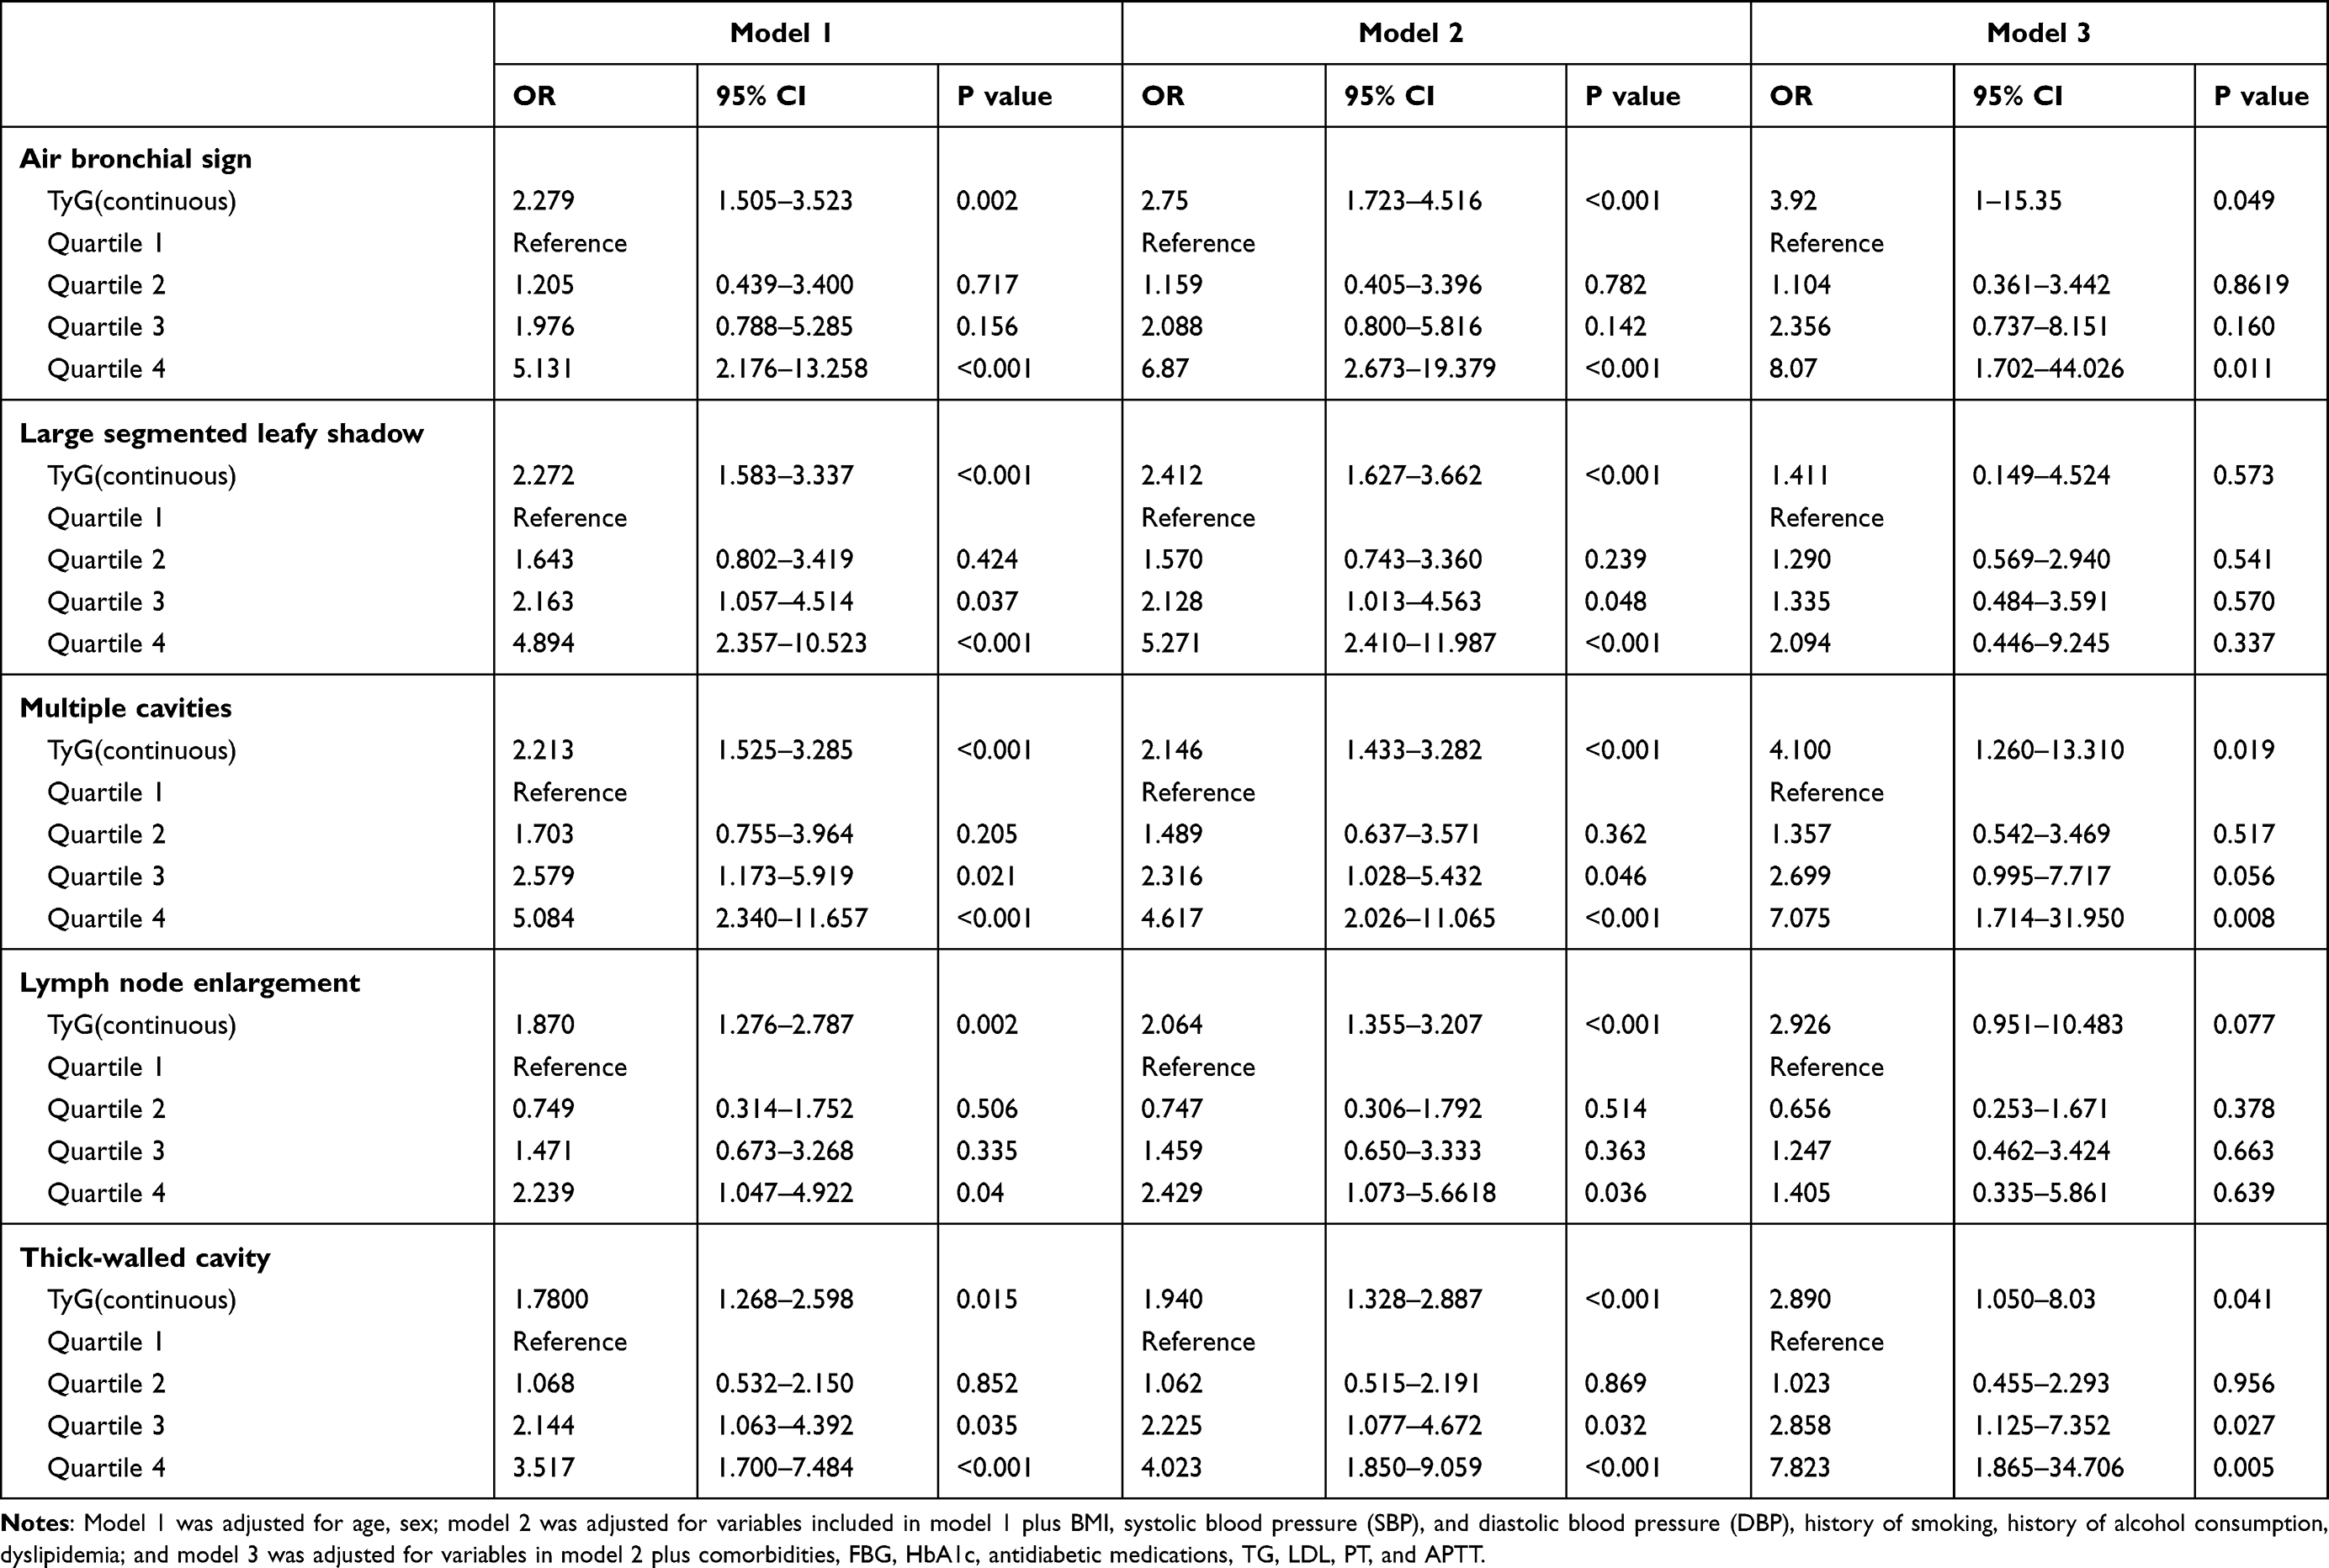 |
Table 3 Association of the TyG Index with CT Imaging Features in T2DM-PTB |
 |
Figure 4 Forest plot of multivariable logistic regression analysis model in patient with T2DM-TB demonstrating the association between the TyG index and air bronchial sign. |
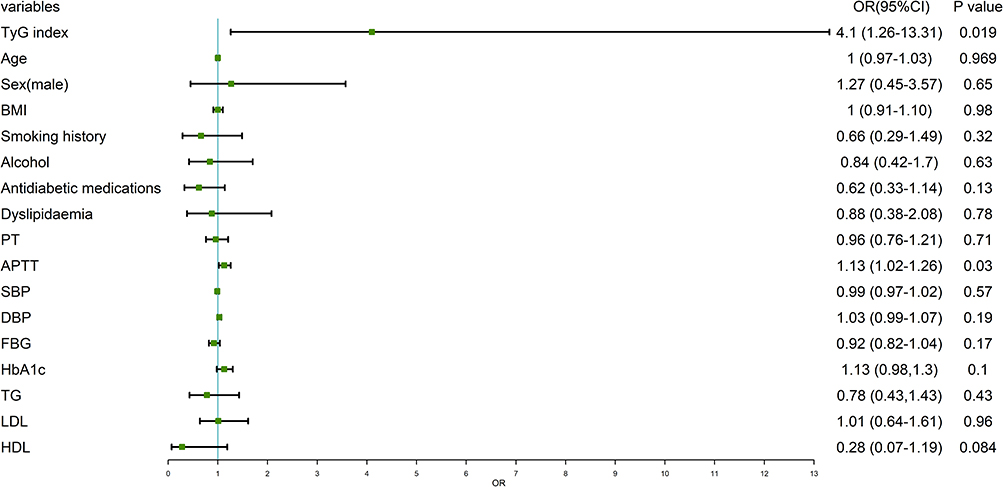 |
Figure 5 Forest plot of multivariable logistic regression analysis model in patient with T2DM-TB demonstrating the association between the TyG index and multiple cavities. |
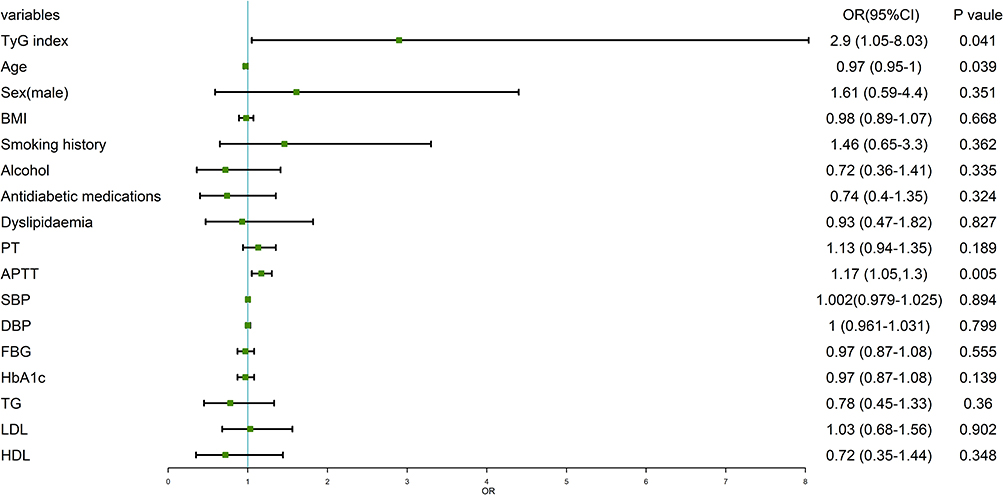 |
Figure 6 Forest plot of multivariable logistic regression analysis model in patient with T2DM-TB demonstrating the association between the TyG index and thick-walled cavity. |
ROC Curve of the TyG Index and CT Imaging Features
As presented in Figure 7 and Table 4, the TyG index may provide mild predictive power via the ROC curve analysis: air bronchial sign (AUC: 0.686, 95% CI: 0.611–0.761, Figure 7A), thick‐walled cavity (AUC: 0.629, CI: 0.563–0.695, Figure 7B), and multiple cavities (AUC: 0.665, CI:0.598–0.733, Figure 7C). Furthermore, the combination of FBG with the TyG index could lead to raising the AUC a little bit higher in CT imaging features.
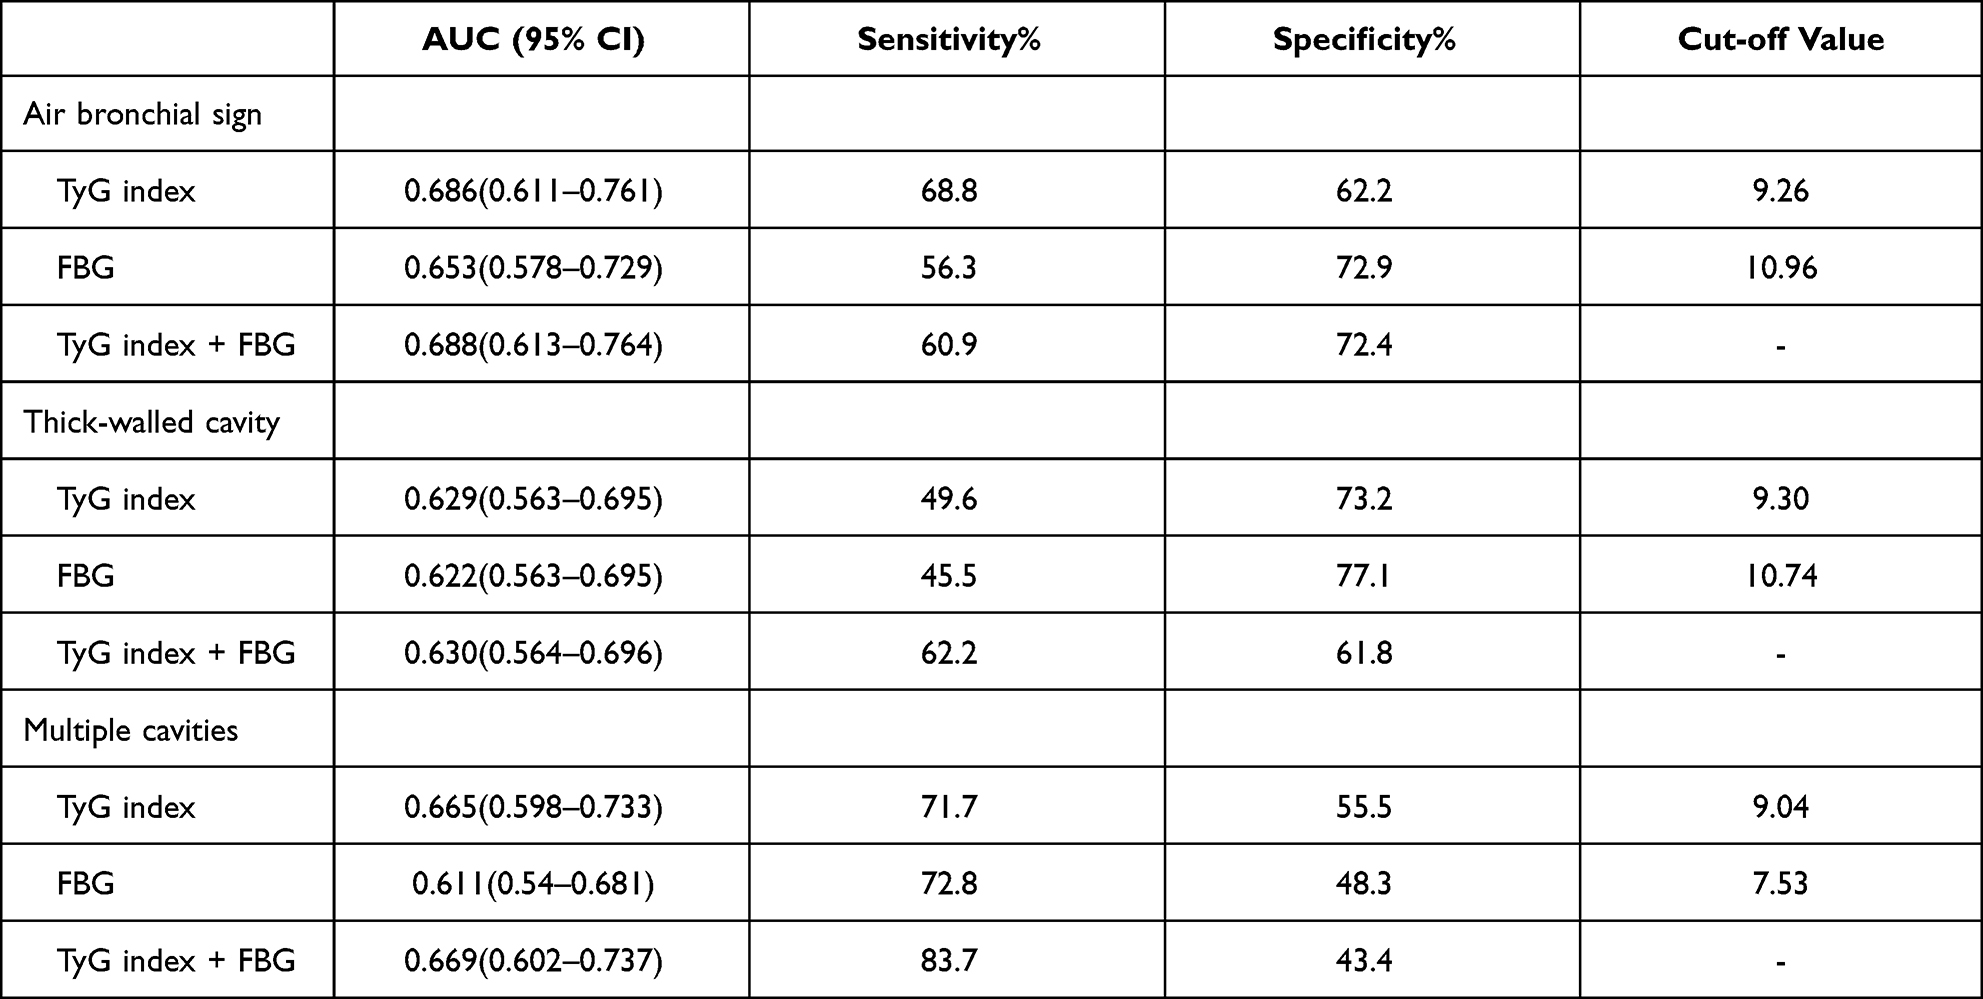 |
Table 4 ROC Curve Analysis of the TyG Index and CT Imaging Features in T2DM-PTB |
 |
Figure 7 ROC curve of the TyG index to predict the CT features. (A) Roc curve of air bronchial sign. (B) Roc curve of thick-walled cavity. (C) Roc curve of multiple cavities. |
The Correlation of TyG Index with Lipid-Metabolic and Systemic Coagulation
The correlation between the TyG indicator and lipid-metabolic and hypercoagulation risk factors are visualized in Figure 8. There were positive high correlations (0.5 < r < 0.8) of the TyG index with FBG and TG, positive moderate correlations (0.2 < r < 0.5) with LDL, HbA1c, and BMI, and negative weak correlations (r < −0.2) with PT and APTT. Negative correlations (r < 0) were found between: APTT with LDL, TC, TyG index and BMI; PT with LDL, HDL, TG, TyG index and TC.
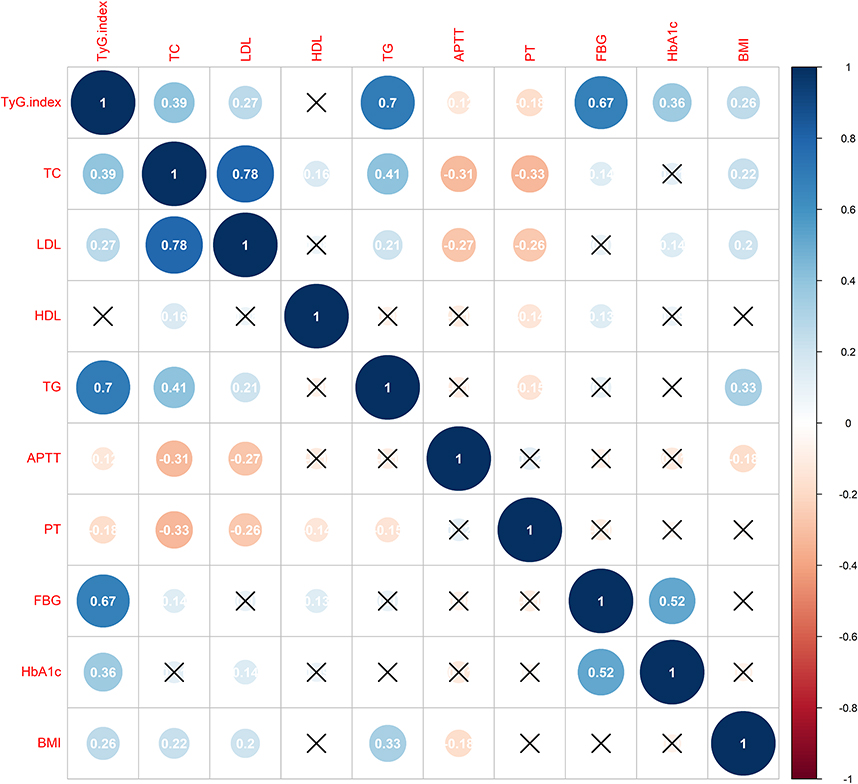 |
Figure 8 Corrplot of studied associations between the TyG index, lipid-metabolic and hypercoagulation risk factors. Blue colour represents positive correlation; red colour represents negative correlation; darker colors and larger shapes represent higher association. х represents no statistical difference. |
Discussion
In the retrospective cross-sectional study, we found that a high TyG indicator was associated with a high frequency of abnormal CT features in patients with T2DM-PTB. The associations remained significant even after adjusting for potential confounding factors, including age, sex, BMI, antidiabetic medications, FBG, HbA1c level, dyslipidemia, blood pressure, and coagulation index which are common PTB and T2DM risk factors and are related to CT imaging features of patients with T2DM-PTB. Therefore, the TyG indicator may be a convenient and potential serum marker for evaluating IR in clinical work -assessing the disease status of patients with T2DM-PTB. In the future, novel therapeutic strategy to control the TyG indicator may be beneficial for the treatment of PTB with T2DM.
Generally, IR is defined as a condition of impairment of insulin effect in metabolic and peripheral target, leading to abnormal insulin release to maintain a normal healthy blood sugar balance in the body.26 Recent studies have demonstrated the occurrence of defects in uptake and utilization of glucose, disorders in carbohydrate metabolism and changes in insulin response in new cases of TB.6,10 According to previous studies, a close relationship is observed between the TyG index and IR as evaluated by the hyperinsulinaemic-euglycaemic clamp method and showed better results than HOMA-IR in subjects with different body weights and glucose levels.13,27 The association of CT manifestations with HbA1c level and IR in patients with T2DM-PTB has also been demonstrated.18,28 However, to date, no study has reported the association between CT imaging findings and the TyG index in patients with T2DM-PTB. The present study demonstrated that the TyG index was associated with abnormal CT features of patients with T2DM-PTB, and those victims with a higher TyG indicator were more prone to show abnormal CT features.
In our study, we found that a higher TyG indicator was related to higher frequency of the following CT imaging features: air bronchial sign, large segmented leafy shadow, multiple cavities, thick-walled cavity, and lymph node enlargement. In the multivariate logistic regression analysis, the TyG indicator were independently related to air bronchial sign, multiple cavities, and thick-walled cavity both as a continuous and categorical variable after completely modulating potential confounding factors. It is worth noting that there was a high percentage of lymph node enlargement in our study. Generally, lymphadenopathy is the most common radiologic feature of primary tuberculosis, which is commonly found in 83–96% of pediatric cases of primary tuberculosis and 10–43% of adult cases.29,30 Lymph nodes are sites in body where Mtb can persist, disseminate, and reactivate.31 Once Mtb has invaded the lymph node and an adaptive immune response is activated, the lymph node needs to restrict or kill the growing number of Mtb bacteria inside it. Otherwise, the lymph node can be destroyed by necrosis. Therefore, we speculate the lymph nodes of patients with TB concurrent diabetes mellitus are more likely to be damaged by Mtb than patients with only TB because of hyperglycemia compromising on some relevant innate and adaptive immunity mechanisms that are necessary for Mtb clearance in patients with T2DM.32,33 A similar study has reported that lymphadenopathy was identified significantly more commonly in TB patients with DM than patients with only TB group (51.6% vs 35.0%).34 The underlying mechanisms is still need to be determined. As reported in a previous study, HOMA-IR in newly diagnosed cases of PTB revealed a relationship with the severity of TB and reduced over time, which may be a good index for clinical improvement.10 A series of studies have proved that IR is related to coagulation dysfunction, endothelial dysfunction, oxidative stress, glucose metabolism, dyslipidemia, and inflammation.10,35,36 Dong et al reported that compared to patients with TB without DM, victims with T2DM-PTB had more lesions and more cavities, especially thick-walled cavities. They also found that the severity of lung lesions was highly associated with the activation of coagulation in PTB, and that PT is more likely to reduce in patients with T2DM-PTB.37 Similar report was shown from Kager et al, compared with normal participants, systemic coagulation of patients with TB or recurrent TB was activated, and systemic anticoagulant pathways of patients with TB and recurrent were downregulated.38 Although there were no control subjects in our study to ascertain whether the systemic coagulation was activated, our results showed the serum PT and APTT had a significant difference between the quartile of TyG indicator groups and negative correlation of TyG index. Thus, we cannot exclude the possibility that association of TyG index and a systemic net procoagulant state in patients with T2DM-PTB. More research should be done to confirm this speculation in the future. In addition, there were also reports that hypercoagulation and dyslipidemia are associated with more cavities that aggravate lung injury in patients with T2DM-PTB.38,39 The possible mechanism may be high glucose level enhance pathogenetic associated signals for hypercoagulation and dyslipidemia, which is induced by TB infection. This process contributes to the exacerbation of caseous necrosis accompanied by severe fibroplasia in granulomas. Consequently, persistent fibroplasia leads to the constitution of thick-walled cavities, which destroys the pulmonary tissue structure and affects the functions of the lungs.40 Furthermore, hypercoagulation may cause a fibroproliferative reaction, which is associated with cavity formation.41–43
The TyG index also showed moderate correlations with components of the lipid-metabolic syndrome and high correlations with glucose-metabolic disorder, while a mild negative relationship with the coagulation index was also observed. These results implied that TyG index might precede the incidence of IR and hypercoagulation.44 Therefore, the TyG index may be an early serum marker of IR and T2DM-PTB. Further evidence needs to confirm this hypothesis.
The normal range or cut-off value of IR for increased risk of TB in healthy subjects remains unknown. By performing receiver operating characteristic (ROC) analysis, our present study showed that the prediction efficiency of the TyG indicator for abnormal CT feature of T2DM-PTB was mild, and combining of TyG index with FBG can improve its predictive power for abnormal CT features to some extent. Every year, the number of newly infected TB patients is increasing, which leads to a huge financial burden on low-income countries. Therefore, although the prediction efficiency of the TyG indicator for the CT imaging features of T2DM-PTB was mild, it still seems to be an economic and a simple indicator to predict of the prognosis of T2DM-PTB plus other possible risk factors. The application value of TyG index on diagnosis and treatment of T2DM-PTB needs further multicentre, prospective, and randomized clinical trials and time to prove.
The precise mechanisms of the relationship between the TyG indicator and CT features of patients with T2DM-PTB is unclear. Nevertheless, we assumed that the TyG indicator is a potential marker of IR to predict the severity of patients with T2DM-PTB. First, insulin can affect the phagocytic process of macrophages, which are the first line of defense against Mycobacterium tuberculosis.45 Second, IR promotes decline in glucose utilization and occurrence of dyslipidemia, which is beneficial for the growth of tubercle bacillus. Third, as a serum marker of IR, the TyG indicator is superior to HOMA-IR for predicting T2DM and cerebrocardiovascular diseases,12,46–48 thus, it could be applied as an index to reflect the condition of patients with PTB complicated with diabetes mellitus.
The following are the strengths of the present study: (1) appropriate study design to determine the association of the TyG index with the CT features of patients with T2DM-PTB, (2) adjustment of the potential confounding factors, (3) modulation of the TyG indicator to increase the reliability of the findings both as a continuous variable and categorical variable. The present research also had some limitations. First, this was a single-center research, with a relatively small sample size, and the 95% confidence interval range of the evaluated effect was wide. Therefore, the conclusion of this study needs further validation in multicenter trials to estimate the association of the TyG index and CT imaging findings in T2DM-PTB. Second, a comparison of T2DM-PTB group with isolated TB group was not performed in our present study. Therefore, a case–control study or a randomized controlled trial (RCT) needs to be conducted in the future to confirm the prediction efficiency of the TyG index for T2DM-PTB. Third, we did not compare the diagnostic sensitivity and specificity of HOMA-IR and the TyG indicator in patients with T2DM-PTB because the determination of fasting insulin level is not regularly conducted at this center. Four, this was a retrospective study with electronic medical records, which cannot avoid potential selection bias of the study cohort.
Conclusions
In summary, our study showed that as a fresh substitute serum marker of IR, the TyG index showed a positive association with CT features of T2DM-PTB. However, its predictive effect was mild for CT manifestations of T2DM-PTB and needs to be further validated. In addition, multicenter trials and RCTs should be required to further explore whether the combination of the TyG indicator and CT features could be beneficial for the diagnosis and treatment of T2DM-PTB.
Data Sharing Statement
The dataset used to support the findings of this study will be made available by the corresponding author upon reasonable request.
Ethical Approval
This study was conducted after agreement from the Ethics Committee of Chongqing Public Health Medical Center (no. 2021-023-02-KY). Due to the retrospective nature of the study, the Ethics Committee waived the requirement for patient consents. The patients were anonymized and their information was nonidentifiable. In general, all data in this study was obtained in accordance with the Helsinki declaration.
Author Contributions
All authors made a significant contribution to the work reported during the conception, study design, execution, data acquisition, analysis, interpretation, drafting, and revising, or critically reviewing the article. All authors gave their final approval of the version to be published and the chosen journal for submission, and they agreed to be accountable for all aspects of the work.
Funding
This study did not receive any specific grant from funding agencies in the public, commercial, or not-for-profit sectors.
Disclosure
Yong Chen and Anzhou Peng are co-first authors for this study. The authors report no conflicts of interest in this work.
References
1. Organization WH. Health at a glance: Asia/Pacific; 2020. Available from: https://www.oecd-ilibrary.org/content/publication/26b007cd-en.
2. WHO. Global tuberculosis report; 2021. Available from: https://www.who.int/publications/digital/global-tuberculosis-report-2021.
3. Marais BJ, Lönnroth K, Lawn SD. Tuberculosis comorbidity with communicable and non-communicable diseases: integrating health services and control efforts - ScienceDirect. Lancet Infect Dis. 2013;13(5):436–448. doi:10.1016/S1473-3099(13)70015-X
4. Al-Rifai RH, Pearson F, Critchley JA, Abu-Raddad LJ. Association between diabetes mellitus and active tuberculosis: a systematic review and meta-analysis. PLoS One. 2017;12(11):e0187967. doi:10.1371/journal.pone.0187967
5. Amare H, Gelaw A, Anagaw B, Gelaw B. Smear positive pulmonary tuberculosis among diabetic patients at the Dessie referral hospital, Northeast Ethiopia. Infect Dis Poverty. 2013;2(1):6. doi:10.1186/2049-9957-2-6
6. Hayashi S, Chandramohan D. Risk of active tuberculosis among people with diabetes mellitus: systematic review and meta-analysis. Trop Med Int Health. 2018;23(10):1058–1070. doi:10.1111/tmi.13133
7. Workneh MH, Bjune GA, Yimer SA, Wilkinson KA. Prevalence and associated factors of tuberculosis and diabetes mellitus comorbidity: a systematic review. PLoS One. 2017;12(4):e0175925. doi:10.1371/journal.pone.0175925
8. WHO. Global Tuberculosis Report; 2018.
9. Chumburidze-Areshidze N, Kezeli T, Avaliani Z, Mirziashvili M, Avaliani T, Gongadze N. The relationship between type-2 diabetes and tuberculosis. Georgian Med News. 2020;300:69–74.
10. Philips L, Visser J, Nel D, Blaauw R. The association between tuberculosis and the development of insulin resistance in adults with pulmonary tuberculosis in the Western sub-district of the Cape Metropole region, South Africa: a combined cross-sectional, cohort study. BMC Infect Dis. 2017;17(1):570. doi:10.1186/s12879-017-2657-5
11. Odegaard JI, Chawla A. Pleiotropic actions of insulin resistance and inflammation in metabolic homeostasis. Science. 2013;339(6116):172–177. doi:10.1126/science.1230721
12. Fiorentino TV, Marini MA, Succurro E, Andreozzi F, Sesti G. Relationships of surrogate indexes of insulin resistance with insulin sensitivity assessed by euglycemic hyperinsulinemic clamp and subclinical vascular damage. BMJ Open Diabetes Res Care. 2019;7(1):e000911. doi:10.1136/bmjdrc-2019-000911
13. Guerrero-Romero F, Simental-Mendia LE, Gonzalez-Ortiz M, et al. The product of triglycerides and glucose, a simple measure of insulin sensitivity. Comparison with the euglycemic-hyperinsulinemic clamp. J Clin Endocrinol Metab. 2010;95(7):3347–3351. doi:10.1210/jc.2010-0288
14. Angoorani P, Heshmat R, Ejtahed HS, et al. Validity of triglyceride–glucose index as an indicator for metabolic syndrome in children and adolescents: the CASPIAN-V study. Eat Weight Disord. 2018;23(6):877–883. doi:10.1007/s40519-018-0488-z
15. Hong S, Han K, Park CY. The triglyceride glucose index is a simple and low-cost marker associated with atherosclerotic cardiovascular disease: a population-based study. BMC Med. 2020;18(1):361. doi:10.1186/s12916-020-01824-2
16. Silva AD, Caldas A, Rocha D, Bressan J. Triglyceride-glucose index predicts independently type 2 diabetes mellitus risk: a systematic review and meta-analysis of cohort studies. Prim Care Diabetes. 2020;14(6):584–593. doi:10.1016/j.pcd.2020.09.001
17. Wang Y, Yang W, Jiang X. Association between triglyceride-glucose index and hypertension: a meta-analysis. Front Cardiovasc Med. 2021;8:644035. doi:10.3389/fcvm.2021.644035
18. Yang WB, Wang HL, Mao JT, et al. The correlation between CT features and insulin resistance levels in patients with T2DM complicated with primary pulmonary tuberculosis. J Cell Physiol. 2020;235(12):9370–9377. doi:10.1002/jcp.29741
19. He L. Oral Hypoglycemic Agents. Ellenberg and Rifkins’s Diabetes Mellitus, Theory and Practice.
20. Atkin SL, Masson EA, Bodmer CW, Walker BA, White MC. Increased insulin requirement in a patient with type 1 diabetes on rifampicin. Diabet Med. 1993;10(4):392. doi:10.1111/j.1464-5491.1993.tb00086.x
21. Niazi AK, Kalra S. Diabetes and tuberculosis: a review of the role of optimal glycemic control. J Diabetes Metab Disord. 2012;11(1):28. doi:10.1186/2251-6581-11-28
22. Madsbad S. Treatment of type 2 diabetes with incretin-based therapies. Lancet. 2009;373(9662):438–439. doi:10.1016/S0140-6736(08)61247-7
23. AD American Diabetes Association. 2. classification and diagnosis of diabetes: standards of medical care in diabetes-2021. Diabetes Care. 2021;44(Suppl1):S15–S33. doi:10.2337/dc21-S002
24. Joint Committee for Developing. Chinese guidelines on prevention and treatment of dyslipidemia in adults. Zhong Hua Xin Xue Guan Bing Za Zhi. 2007;35(5):390.
25. Gadkowski LB, Stout JE. Cavitary pulmonary disease. Clin Microbiol Rev. 2008;21(2):305–333. doi:10.1128/CMR.00060-07
26. Mlinar B, Marc J, Janež A, Pfeifer M. Molecular mechanisms of insulin resistance and associated diseases. Clin Chim Acta. 2007;375(1–2):20–35. doi:10.1016/j.cca.2006.07.005
27. Vasques A, Novaes FS, Oliveira M, et al. TyG index performs better than HOMA in a Brazilian population: a hyperglycemic clamp validated study. Diabetes Res Clin Pract. 2011;93(3):e98–e100. doi:10.1016/j.diabres.2011.05.030
28. Xia LL, Li SF, Shao K, Xin Z, Huang SJI, Resistance D. The correlation between CT features and glycosylated hemoglobin level in patients with T2DM complicated with primary pulmonary tuberculosis. Infect Drug Resist. 2018;11:187–193. doi:10.2147/IDR.S146741
29. Im JG, Song KS, Kang HS, et al. Mediastinal tuberculous lymphadenitis: CT manifestations. Radiology. 1987;164(1):115–119. doi:10.1148/radiology.164.1.3588896
30. Leung AN. Pulmonary tuberculosis: the essentials. Radiology. 1999;210(2):307–322. doi:10.1148/radiology.210.2.r99ja34307
31. Lin PL, Maiello P, Gideon HP, et al. PET CT identifies reactivation risk in cynomolgus macaques with latent M. tuberculosis. PLoS Pathog. 2016;12(7):e1005739. doi:10.1371/journal.ppat.1005739
32. Bloomgarden Z, Misra A. Diabetes and tuberculosis: an important relationship. J Diabetes. 2017;9(7):640–643. doi:10.1111/1753-0407.12547
33. Kumar NP, Moideen K, Bhootra Y, et al. Elevated circulating levels of monocyte activation markers among tuberculosis patients with diabetes co-morbidity. Immunology. 2019;156(3):249–258. doi:10.1111/imm.13023
34. Kim J, Lee IJ, Kim JH. CT findings of pulmonary tuberculosis and tuberculous pleurisy in diabetes mellitus patients. Diagn Interv Radiol. 2017;23(2):112–117. doi:10.5152/dir.2016.16157
35. Markus M, Rospleszcz S, Ittermann T, et al. Glucose and insulin levels are associated with arterial stiffness and concentric remodeling of the heart. Cardiovasc Diabetol. 2019;18(1):145. doi:10.1186/s12933-019-0948-4
36. McGarry J, Diabetes DJ. Dysregulation of fatty acid metabolism in the etiology of type 2 diabetes. Diabetes Care. 2002;5(1):7–18. doi:10.2337/diabetes.51.1.7
37. Dong Z, Shi J, Dorhoi A, et al. Hemostasis and lipoprotein indices signify exacerbated lung injury in TB with diabetes comorbidity. Chest. 2018;153(5):1187–1200. doi:10.1016/j.chest.2017.11.029
38. Kager LM, Blok DC, Lede IO, et al. Pulmonary tuberculosis induces a systemic hypercoagulable state. J Infect. 2015;70(4):324–334. doi:10.1016/j.jinf.2014.10.006
39. Deniz O, Gumus S, Yaman H, et al. Serum total cholesterol, HDL-C and LDL-C concentrations significantly correlate with the radiological extent of disease and the degree of smear positivity in patients with pulmonary tuberculosis. Clin Biochem. 2007;40(3–4):162–166. doi:10.1016/j.clinbiochem.2006.10.015
40. Cardona PJJC, Immunology D. A spotlight on liquefaction: evidence from clinical settings and experimental models in tuberculosis. Clin Dev Immunol. 2011;2011:1–9. doi:10.1155/2011/868246
41. Hunter RL, Jagannath C, Actor JK. Pathology of postprimary tuberculosis in humans and mice: contradiction of long-held beliefs. Tuberculosis. 2007;87(4):267–278. doi:10.1016/j.tube.2006.11.003
42. Mercer PF, Chambers RC. Coagulation and coagulation signalling in fibrosis. Biochim Biophys Acta. 2013;1832(7):1018–1027. doi:10.1016/j.bbadis.2012.12.013
43. Qu Z, Chaikof EL. Interface between hemostasis and adaptive immunity. Curr Opin Immunol. 2010;22(5):634–642. doi:10.1016/j.coi.2010.08.017
44. Han T, Cheng Y, Tian S, et al. Changes in triglycerides and high-density lipoprotein cholesterol may precede peripheral insulin resistance, with 2-h insulin partially mediating this unidirectional relationship: a prospective cohort study. Cardiovasc Diabetol. 2016;15(1):154. doi:10.1186/s12933-016-0469-3
45. Berrington WR, Hawn TR. Mycobacterium tuberculosis, macrophages, and the innate immune response: does common variation matter? Immunol Rev. 2010;219(1):167–186. doi:10.1111/j.1600-065X.2007.00545.x
46. Giannini C, Santoro N, Caprio S, et al. The triglyceride-to-HDL cholesterol ratio: association with insulin resistance in obese youths of different ethnic backgrounds. Diabetes Care. 2011;34(8):1869–1874. doi:10.2337/dc10-2234
47. Hmp A, Hsl B, Yjl C, Jhl DJDR, Practice C. The triglyceride–glucose index is a more powerful surrogate marker for predicting the prevalence and incidence of type 2 diabetes mellitus than the homeostatic model assessment of insulin resistance. Diabetes Res Clin Pract. 2021;180:109042. doi:10.1016/j.diabres.2021.109042
48. Zwa C, Jw A, Zl A, et al. Triglyceride glucose index and carotid atherosclerosis incidence in the Chinese population: a prospective cohort study. Nutr Metab Cardiovasc Dis. 2021;31(7):2042–2050. doi:10.1016/j.numecd.2021.03.027
 © 2022 The Author(s). This work is published and licensed by Dove Medical Press Limited. The full terms of this license are available at https://www.dovepress.com/terms.php and incorporate the Creative Commons Attribution - Non Commercial (unported, v3.0) License.
By accessing the work you hereby accept the Terms. Non-commercial uses of the work are permitted without any further permission from Dove Medical Press Limited, provided the work is properly attributed. For permission for commercial use of this work, please see paragraphs 4.2 and 5 of our Terms.
© 2022 The Author(s). This work is published and licensed by Dove Medical Press Limited. The full terms of this license are available at https://www.dovepress.com/terms.php and incorporate the Creative Commons Attribution - Non Commercial (unported, v3.0) License.
By accessing the work you hereby accept the Terms. Non-commercial uses of the work are permitted without any further permission from Dove Medical Press Limited, provided the work is properly attributed. For permission for commercial use of this work, please see paragraphs 4.2 and 5 of our Terms.