
Back to Journals » Diabetes, Metabolic Syndrome and Obesity » Volume 19
Association of the Triglyceride-Glucose Index and Its Central Obesity Derivatives with Peripheral Artery Disease in Type 2 Diabetes: A Cross-Sectional Study
Authors Guo Y  , Zhou X , Chen L , Zheng J
Received 13 February 2026
Accepted for publication 8 May 2026
Published 5 June 2026 Volume 2026:19 602358
DOI https://doi.org/10.2147/DMSO.S602358
Checked for plagiarism Yes
Review by Single anonymous peer review
Peer reviewer comments 2
Editor who approved publication: Dr Rebecca Baqiyyah Conway
Yangyang Guo,1,* Xiang Zhou,2,* Liyu Chen,1 Junmin Zheng1
1Department of Endocrinology, Sanming First Hospital Affiliated to Fujian Medical University, Sanming, 365000, Fujian, People’s Republic of China; 2Department of Emergency, Sanming First Hospital Affiliated to Fujian Medical University, Sanming, 365000, Fujian, People’s Republic of China
*These authors contributed equally to this work
Correspondence: Junmin Zheng, Email [email protected]
Aim: To investigate the associations of the triglyceride–glucose (TyG) index and TyG-related obesity indices with lower extremity peripheral artery disease (PAD) in type 2 diabetes mellitus (T2DM) patients, and to assess their discriminative ability.
Methods: This single-center, retrospective cross-sectional study included 2224 T2DM patients at a university-affiliated hospital between August 2020 and December 2024. PAD was defined as a resting ankle-brachial index (ABI) ≤ 0.90, or a post-exercise ABI decrease > 20%, or imaging-confirmed lower extremity arterial stenosis or thrombosis. Multivariable logistic regression, trend tests, subgroup analyses, and receiver operating characteristic (ROC) curves were applied.
Results: Among the 2,224 patients (45.0% women, mean age 61.0 ± 11.3 years), the TyG index and its combinations with central obesity indicators (TyG-WHtR, TyG-WHR, TyG-WC) were positively associated with the presence of PAD (all P < 0.05), whereas the general obesity indicator (TyG-BMI) lost its significant association after multivariable adjustment, although it remained significant in specific subgroups, such as patients with well-controlled glycemia. After multivariable adjustment, patients in the highest quartile of these significant indices had 1.787– 2.128 times higher odds of having PAD than those in the lowest quartile. Subgroup analyses identified significant interactions with sex and smoking status, showing stronger associations in women and non-smokers. Furthermore, ROC analyses indicated that TyG-WHtR had the highest discriminative ability (AUC = 0.622) among the indices, though its overall accuracy is modest.
Conclusion: In T2DM patients, the TyG index and its central obesity derivatives are independently associated with PAD, whereas TyG-BMI shows weaker relevance. TyG-WHtR demonstrates relatively better discriminative performance but limited accuracy, suggesting its role as a supplementary metabolic marker rather than a standalone screening tool.
Keywords: triglyceride–glucose index, central obesity, waist-to-height ratio, type 2 diabetes mellitus, lower extremity peripheral artery disease
Introduction
The global prevalence of type 2 diabetes mellitus (T2DM) has increased dramatically, constituting a significant public health challenge. Lower extremity peripheral artery disease (PAD), a common and severe macrovascular complication of diabetes, affects over 230 million adults worldwide and is associated with a significantly elevated risk of amputation, major adverse cardiovascular events, and all-cause mortality.1 In China, the prevalence of PAD among T2DM patients over 50 years old is reported to be as high as 21.2%, with a missed diagnosis rate exceeding 55%,2 underscoring critical issues of under-recognition and undertreatment. The early symptoms of PAD are often subtle, leading to frequent diagnosis only at advanced stages with heightened amputation risk. Although the ankle-brachial index (ABI) is a reliable diagnostic tool, its requirement for specialized equipment and trained operators limits its feasibility for widespread screening, particularly in primary care and resource-limited settings.3 This underscores an urgent need for simple, accessible, and cost-effective biomarkers to facilitate early identification of the presence of PAD.
Atherosclerosis is the core pathological process in PAD, with insulin resistance (IR) serving as a pivotal mechanistic link between T2DM and accelerated atherosclerosis.4 IR promotes vascular damage through endothelial dysfunction, oxidative stress, and a pro-inflammatory state. The triglyceride-glucose (TyG) index, calculated from fasting triglycerides and glucose, has emerged as a robust and practical surrogate marker for IR, showing a strong correlation with the hyperinsulinemic-euglycemic clamp.5 Obesity, particularly visceral adiposity, exacerbates IR and cardiovascular risk. Anthropometric indices such as waist circumference (WC), waist-to-hip ratio (WHR), waist-to-height ratio (WHtR), and body mass index (BMI) reflect different aspects of adiposity.6,7 Crucially, central obesity indicators (WC, WHtR, WHR) are more strongly associated with visceral fat and cardiometabolic risk than BMI, which measures overall obesity.7 Recent evidence suggests that combining the TyG index with obesity measures—forming TyG-derived indices (eg., TyG-WC, TyG-WHtR, TyG-BMI)—may provide a more integrated assessment of the “glucolipid toxicity” and metabolic burden, potentially offering superior predictive value for cardiovascular outcomes compared to the TyG index alone.8,9
Furthermore, the development and progression of PAD are multifactorial, profoundly influenced by lifestyle factors (eg., smoking, physical activity, diet) and therapeutic interventions.10 Notably, lipid-lowering therapies like statins and novel glucose-lowering agents, such as sodium-glucose cotransporter 2 (SGLT2) inhibitors and glucagon-like peptide-1 (GLP-1) receptor agonists, have demonstrated pleiotropic vascular benefits.11,12 Against this highly complex and confounded clinical backdrop, exploring robust, accessible metabolic markers remains critical for identifying residual metabolic burden and enhancing comprehensive clinical evaluation of PAD.
While the TyG index and its derivatives have been extensively studied in relation to macrovascular events such as coronary artery disease and stroke,13–16 their specific roles in PAD among patients with T2DM are still being elucidated. Recent studies have provided valuable insights into this area; for instance, Miao et al reported positive associations of the TyG index, TyG-WHR, and TyG-WC with the presence of PAD,17 and Mitrea et al identified a link between TyG-WHtR and lower limb complications.18 However, comprehensive evaluations comparing the relative strengths of these diverse indices remain limited. More importantly, a direct head-to-head comparison distinguishing the discriminative ability of indices based on central obesity (eg., TyG-WHtR, TyG-WHR) versus overall obesity (TyG-BMI) within the same T2DM cohort requires further elucidation. Clarifying this distinction is essential for identifying robust supplementary metabolic markers to optimize early evaluation strategies.
Therefore, this study aimed to comprehensively investigate the associations between the TyG index and its key obesity-derived indices (TyG-WHtR, TyG-WHR, TyG-WC, and TyG-BMI) and the presence of PAD in a cohort of patients with T2DM. We further sought to compare their discriminative ability to identify the optimal indicator among them, thereby providing evidence for their potential use as supplementary metabolic markers in the clinical assessment of PAD.
Materials and Methods
Study Participants
This retrospective cross-sectional study included patients with T2DM who attended the Department of Endocrinology at the Sanming First Hospital Affiliated to Fujian Medical University, between August 2020 and December 2024. The inclusion criteria were as follows: (1) diagnosis of T2DM according to the Standards of Medical Care in Diabetes (2020 edition) issued by the American Diabetes Association; (2) age >18 years; (3) complete data on the TyG index and its derived indicators; (4) completion of ankle–brachial index (ABI) measurement. The exclusion criteria were: (1) type 1 diabetes mellitus or other specific types of diabetes; (2) presence of acute diabetic complications, including diabetic ketoacidosis, hyperosmolar hyperglycemic state, or hypoglycemia; (3) self-reported history of coronary artery disease, heart failure, or stroke; (4) presence of other uncontrolled diseases, such as gangrene, amputation, malignancy, liver failure, or kidney failure (defined as an estimated glomerular filtration rate < 15 mL/min/1.73 m2); (5) incomplete or missing clinical data; (6) non-compressible arteries defined by an ankle-brachial index (ABI) > 1.40.
This study was approved by the Ethics Committee of Sanming First Hospital (Approval No. [2025] 216). PAD was diagnosed based on comprehensive clinical evaluation, defined as meeting any of the following criteria: (1) a resting ABI ≤ 0.90; (2) a post-exercise ankle pressure decrease of > 20% in symptomatic patients with normal or borderline resting ABI; or (3) imaging evidence of lower extremity arterial stenosis or thrombosis detected by ultrasonography, computed tomography angiography, or digital subtraction angiography.1
Demographic and Clinical Data
Basic demographic and clinical information was collected through structured review of electronic medical records and standardized patient interviews. This included sex, age, duration of diabetes, lifestyle factors, and medication use. Smoking status was categorized as never smoking (< 100 cigarettes in lifetime), smoking (≥ 100 cigarettes in lifetime). Alcohol consumption was defined as never drinking (< 12 drinks per year) or drinking (≥ 12 drinks per year). Current medication use within the past three months was determined from prescriptions and patient reports, including antihypertensive drugs, lipid-lowering drugs (primarily statins), antiplatelet agents, and glucose-lowering agents (oral medications and insulin).
Physical examinations were performed to obtain measurements of height, weight, hip circumference, waist circumference (WC), and blood pressure. Height and weight were measured with participants wearing light clothing and no shoes. WC was measured at the midpoint between the lower margin of the 12th rib and the iliac crest using a flexible tape, with participants standing upright and arms hanging naturally. Hip circumference was measured at the level of the maximum circumference of the pelvis. Systolic blood pressure (SBP) and diastolic blood pressure (DBP) were measured on the right upper arm after at least 15 minutes of rest using an Omron automatic sphygmomanometer. Blood pressure was measured three times, and the average value was recorded. Trained physicians performed all anthropometric measurements.
Laboratory Measurements
Venous blood samples were collected in the morning after at least 8 hours of overnight fasting. Fasting plasma glucose (FPG), 2-hour postprandial plasma glucose (2hPG), total cholesterol (TC), low-density lipoprotein cholesterol (LDL-C), high-density lipoprotein cholesterol (HDL-C), triglycerides (TG), alanine aminotransferase (ALT), aspartate aminotransferase (AST), blood urea nitrogen (BUN), serum creatinine (SCr), and uric acid (UA) were measured using a Roche fully automated biochemical analyzer. Glycated hemoglobin (HbA1c) was determined using a Tosoh G8 high-performance liquid chromatography system. A clean midstream urine sample was collected, and urinary albumin was measured using an immunoturbidimetric method. The urinary albumin-to-creatinine ratio (UACR, mg/g) was calculated by dividing urinary albumin concentration by urinary creatinine concentration. The estimated glomerular filtration rate (eGFR) was calculated using the Modification of Diet in Renal Disease (MDRD) equation as follows: eGFR = 186 × SCr (mg/dL) − 1.154 × age − 0.203 × 0.742 (if female).19
Measurement of Ankle–Brachial Index
The ABI is a reliable method for evaluating lower extremity hemodynamics. ABI and brachial–ankle pulse wave velocity (baPWV) were measured using a BP-203RPE III arteriosclerosis detection device (Omron, Japan). After supine rest, bilateral brachial and ankle systolic blood pressures were measured in duplicate, and the confirmed values were used for analysis. The ABI for each leg was calculated as the ankle systolic blood pressure divided by the higher brachial systolic blood pressure. In patients with exertional leg symptoms and a normal or borderline resting ABI, further evaluation, including postexercise ABI or vascular imaging, was performed according to clinical availability. Postexercise ABI was assessed after up to 50 consecutive repetitions of active plantar flexion while standing.20 Brachial–ankle pulse wave velocity (baPWV) was calculated as the linear distance between the brachial artery and ankle artery divided by the transit time of the pulse wave from the brachial artery to the ankle artery.
Calculation of the TyG Index and Its Derived Indicators
Body mass index (BMI) was calculated as weight (kg) divided by height squared (m2). Waist-to-height ratio (WHtR) was calculated as waist circumference divided by height, and waist-to-hip ratio (WHR) was calculated as waist circumference divided by hip circumference. The TyG index was calculated as follows: TyG = Ln [TG(mg/dl) × FPG(mg/dl)/2].21 TyG-WHtR = TyG × WHtR; TyG-WHR = TyG × WHR; TyG-WC = TyG × WC; TyG-BMI = TyG × BMI.
Statistical Analysis
Statistical analyses were performed using SPSS version 26.0 (IBM Corp., Armonk, NY, USA). Continuous variables with a normal distribution are presented as mean ± standard deviation (SD), and comparisons between two groups were conducted using the independent-samples t-test. Continuous variables with a non-normal distribution are presented as median (Q1, Q3), and comparisons between groups were performed using the Mann–Whitney U-test. Categorical variables were expressed as counts (percentages) and compared using the chi-square test. Logistic regression analyses were conducted to evaluate the associations between the TyG index and its derived indicators and PAD. The results are presented as multivariable-adjusted odds ratios (ORs) with 95% confidence intervals (CIs). Four regression models were constructed: Model 1, unadjusted; Model 2, adjusted for age and sex; Model 3, further adjusted for diabetes duration, smoking status, SBP, DBP, HbA1c, low-density lipoprotein cholesterol (LDL-C), high-density lipoprotein cholesterol (HDL-C), and estimated glomerular filtration rate (eGFR); and Model 4, further adjusted for the use of insulin, oral hypoglycemic agents, statins, antiplatelet agents, and antihypertensive agents. Collinearity among independent variables was assessed using the variance inflation factor (VIF); a VIF < 10 was considered acceptable, and all included variables met this criterion. Model fit was additionally assessed using the Hosmer-Lemeshow goodness-of-fit test for the multivariable logistic regression models. In addition, stratified analyses and interaction tests were performed using the fully adjusted logistic regression model (Model 4) to examine whether other factors modified the associations between the TyG index and its derived indicators and PAD. These subgroup analyses were prespecified as exploratory. To control the false discovery rate for multiple testing, P values for interaction were adjusted using the Benjamini-Hochberg procedure, and adjusted P values were reported (statistical significance defined as adjusted P < 0.05). The discriminative performance of the TyG index and its derived indicators for PAD was evaluated by constructing receiver operating characteristic (ROC) curves and comparing the areas under the curves (AUCs). The statistical significance of differences between paired AUCs was assessed using DeLong’s test for two correlated ROC curves. For the comparison of multiple ROC curves, DeLong’s test was used, and the Bonferroni correction was applied to adjust for multiple testing (statistical significance defined as P < 0.005). All statistical tests were two-sided, and P < 0.05 was considered statistically significant.
Results
Baseline Characteristics
A total of 3,110 patients with diabetes were initially screened. After applying the inclusion and exclusion criteria, 886 patients were excluded (253 with non-type 2 diabetes, 160 with acute diabetic complications, 21 with a history of major cardiovascular diseases, 36 with other uncontrolled diseases, 14 with non-compressible arteries (ABI >1.40), and 402 with incomplete or missing clinical data). Consequently, 2,224 patients with T2DM were finally included in this study, comprising 1,224 men and 1,000 women, with a mean age of 61.01 ± 11.25 years. Among them, 224 patients (10.1%) were diagnosed with PAD (Table 1). Compared with patients without PAD, those with PAD were older, had a longer duration of diabetes, were more often female, and had greater waist circumference and higher systolic blood pressure. They also had a higher prevalence of hypertension, higher rates of antihypertensive medication and antiplatelet agent use, and higher levels of triglycerides, low-density lipoprotein cholesterol, blood urea nitrogen, uric acid, urinary albumin-to-creatinine ratio, TyG, TyG-WHtR, TyG-WHR, TyG-WC, and TyG-BMI (all P < 0.05). In contrast, patients with PAD had significantly lower height, diastolic blood pressure, left and right ABI, high-density lipoprotein cholesterol, eGFR, and alanine aminotransferase levels than those without PAD (all P < 0.05).
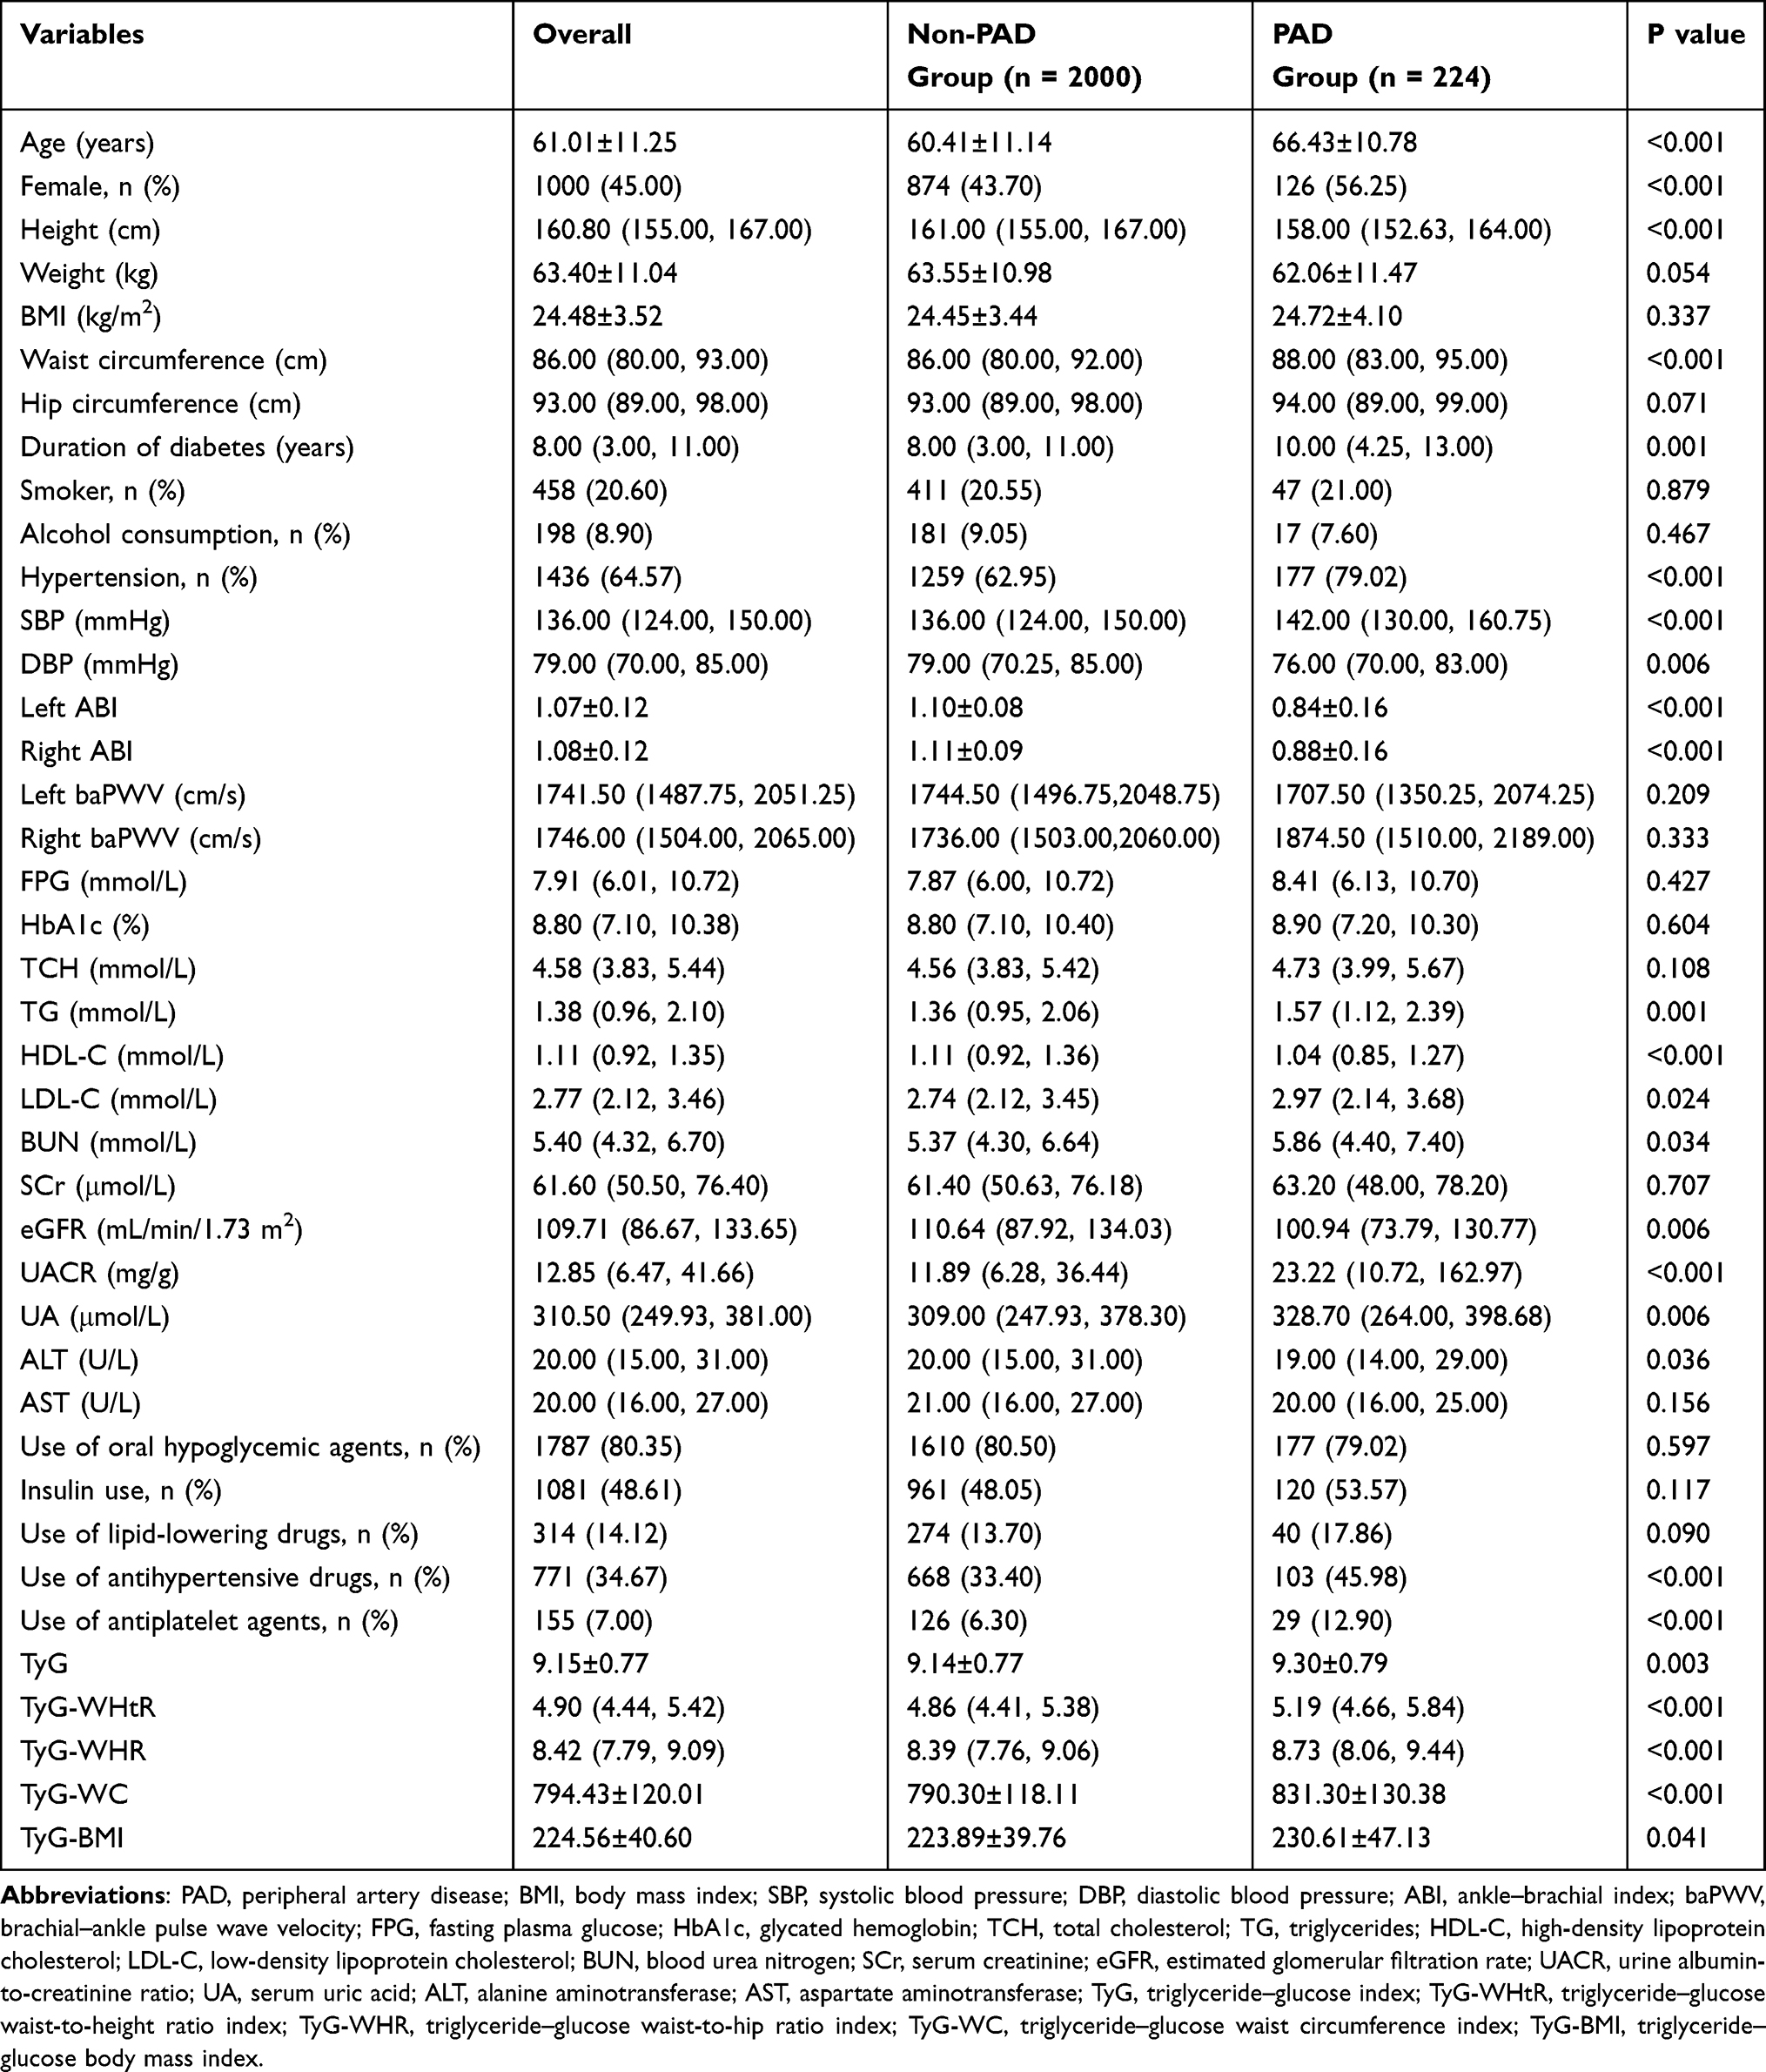 |
Table 1 Comparison of Clinical Characteristics Between the Non-PAD and PAD Groups |
Prevalence of PAD Across Quartiles of TyG and Its Derived Indicators
The study population was divided into quartiles (Q1–Q4) for the TyG index and each derived indicator. The prevalence of PAD increased progressively with increasing levels of TyG, TyG-WHtR, TyG-WHR, and TyG-WC (all P for trend <0.05). However, no significant difference in PAD prevalence was observed across quartiles of TyG-BMI (P for trend > 0.05) (Figure 1).
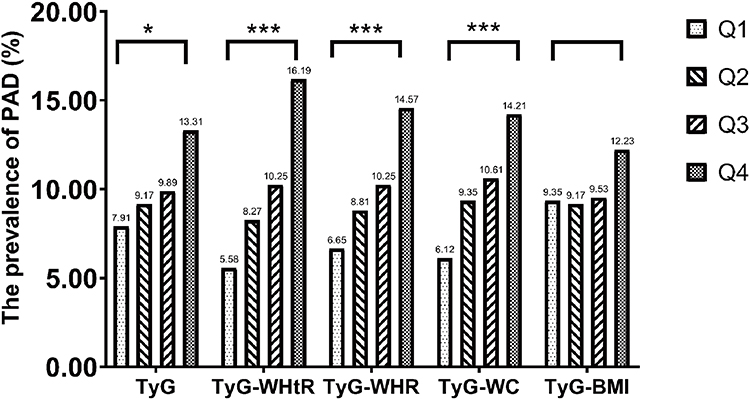 |
Figure 1 Bar chart of the prevalence of PAD across different TyG and derived indicator groups. Abbreviations: PAD, peripheral artery disease; TyG, triglyceride–glucose index; WHtR, Waist-to-height ratio; WHR, Waist-to-hip ratio; WC, Waist circumference; BMI, Body mass index. Notes: *Indicates P < 0.05, ***Indicates P < 0.001, blank indicates P > 0.05. |
Logistic Regression Analysis of TyG and Its Derived Indicators in Relation to PAD in Patients with T2DM
Prior to regression analyses, collinearity diagnostics confirmed that the variance inflation factors (VIF) for all independent variables were within the acceptable range (1.068–7.523; Supplementary Table 1). When evaluating the association between TyG-WC and PAD, TyG-WC was rescaled by dividing by 10 so that the estimated odds ratio corresponded to a 10-unit increase in TyG-WC. As shown in Table 2, univariate logistic regression analyses indicated that the TyG index and all derived indicators (TyG-WHtR, TyG-WHR, TyG-WC, and TyG-BMI) were significantly and positively associated with the presence of PAD in patients with T2DM (all P < 0.05). In Model 4, higher levels of TyG, TyG-WHtR, TyG-WHR, and TyG-WC remained independently associated with an increased presence of PAD, with ORs (95% CIs) of 1.374 (1.107, 1.704), P = 0.004; 1.480 (1.204, 1.82), P < 0.001; 1.400 (1.190, 1.646), P < 0.001; and 1.022 (1.009, 1.035) per 10-unit increase in TyG-WC, P = 0.001, respectively. In contrast, no significant association was observed between TyG-BMI and the presence of PAD after multivariable adjustment (P > 0.05). The Hosmer-Lemeshow goodness-of-fit test indicated that all final models fitted the data well (all P > 0.05). Furthermore, model 4 revealed that patients in the highest quartile of TyG, TyG-WHtR, TyG-WHR, and TyG-WC had significantly higher odds of PAD compared with those in the lowest quartile, with ORs (95% CIs) of 1.787 (1.118, 2.857), 2.078 (1.298, 3.327), 2.128 (1.337, 3.387), and 1.918 (1.217, 3.022), respectively. TyG-BMI was not significantly associated with the presence of PAD (Table 2). Trend analyses revealed a dose–response relationship between increasing quartiles of TyG, TyG-WHtR, TyG-WHR, and TyG-WC and the presence of PAD (all P for trend <0.05). These trends remained statistically significant after adjustment for all potential confounding factors (all P for trend < 0.05).
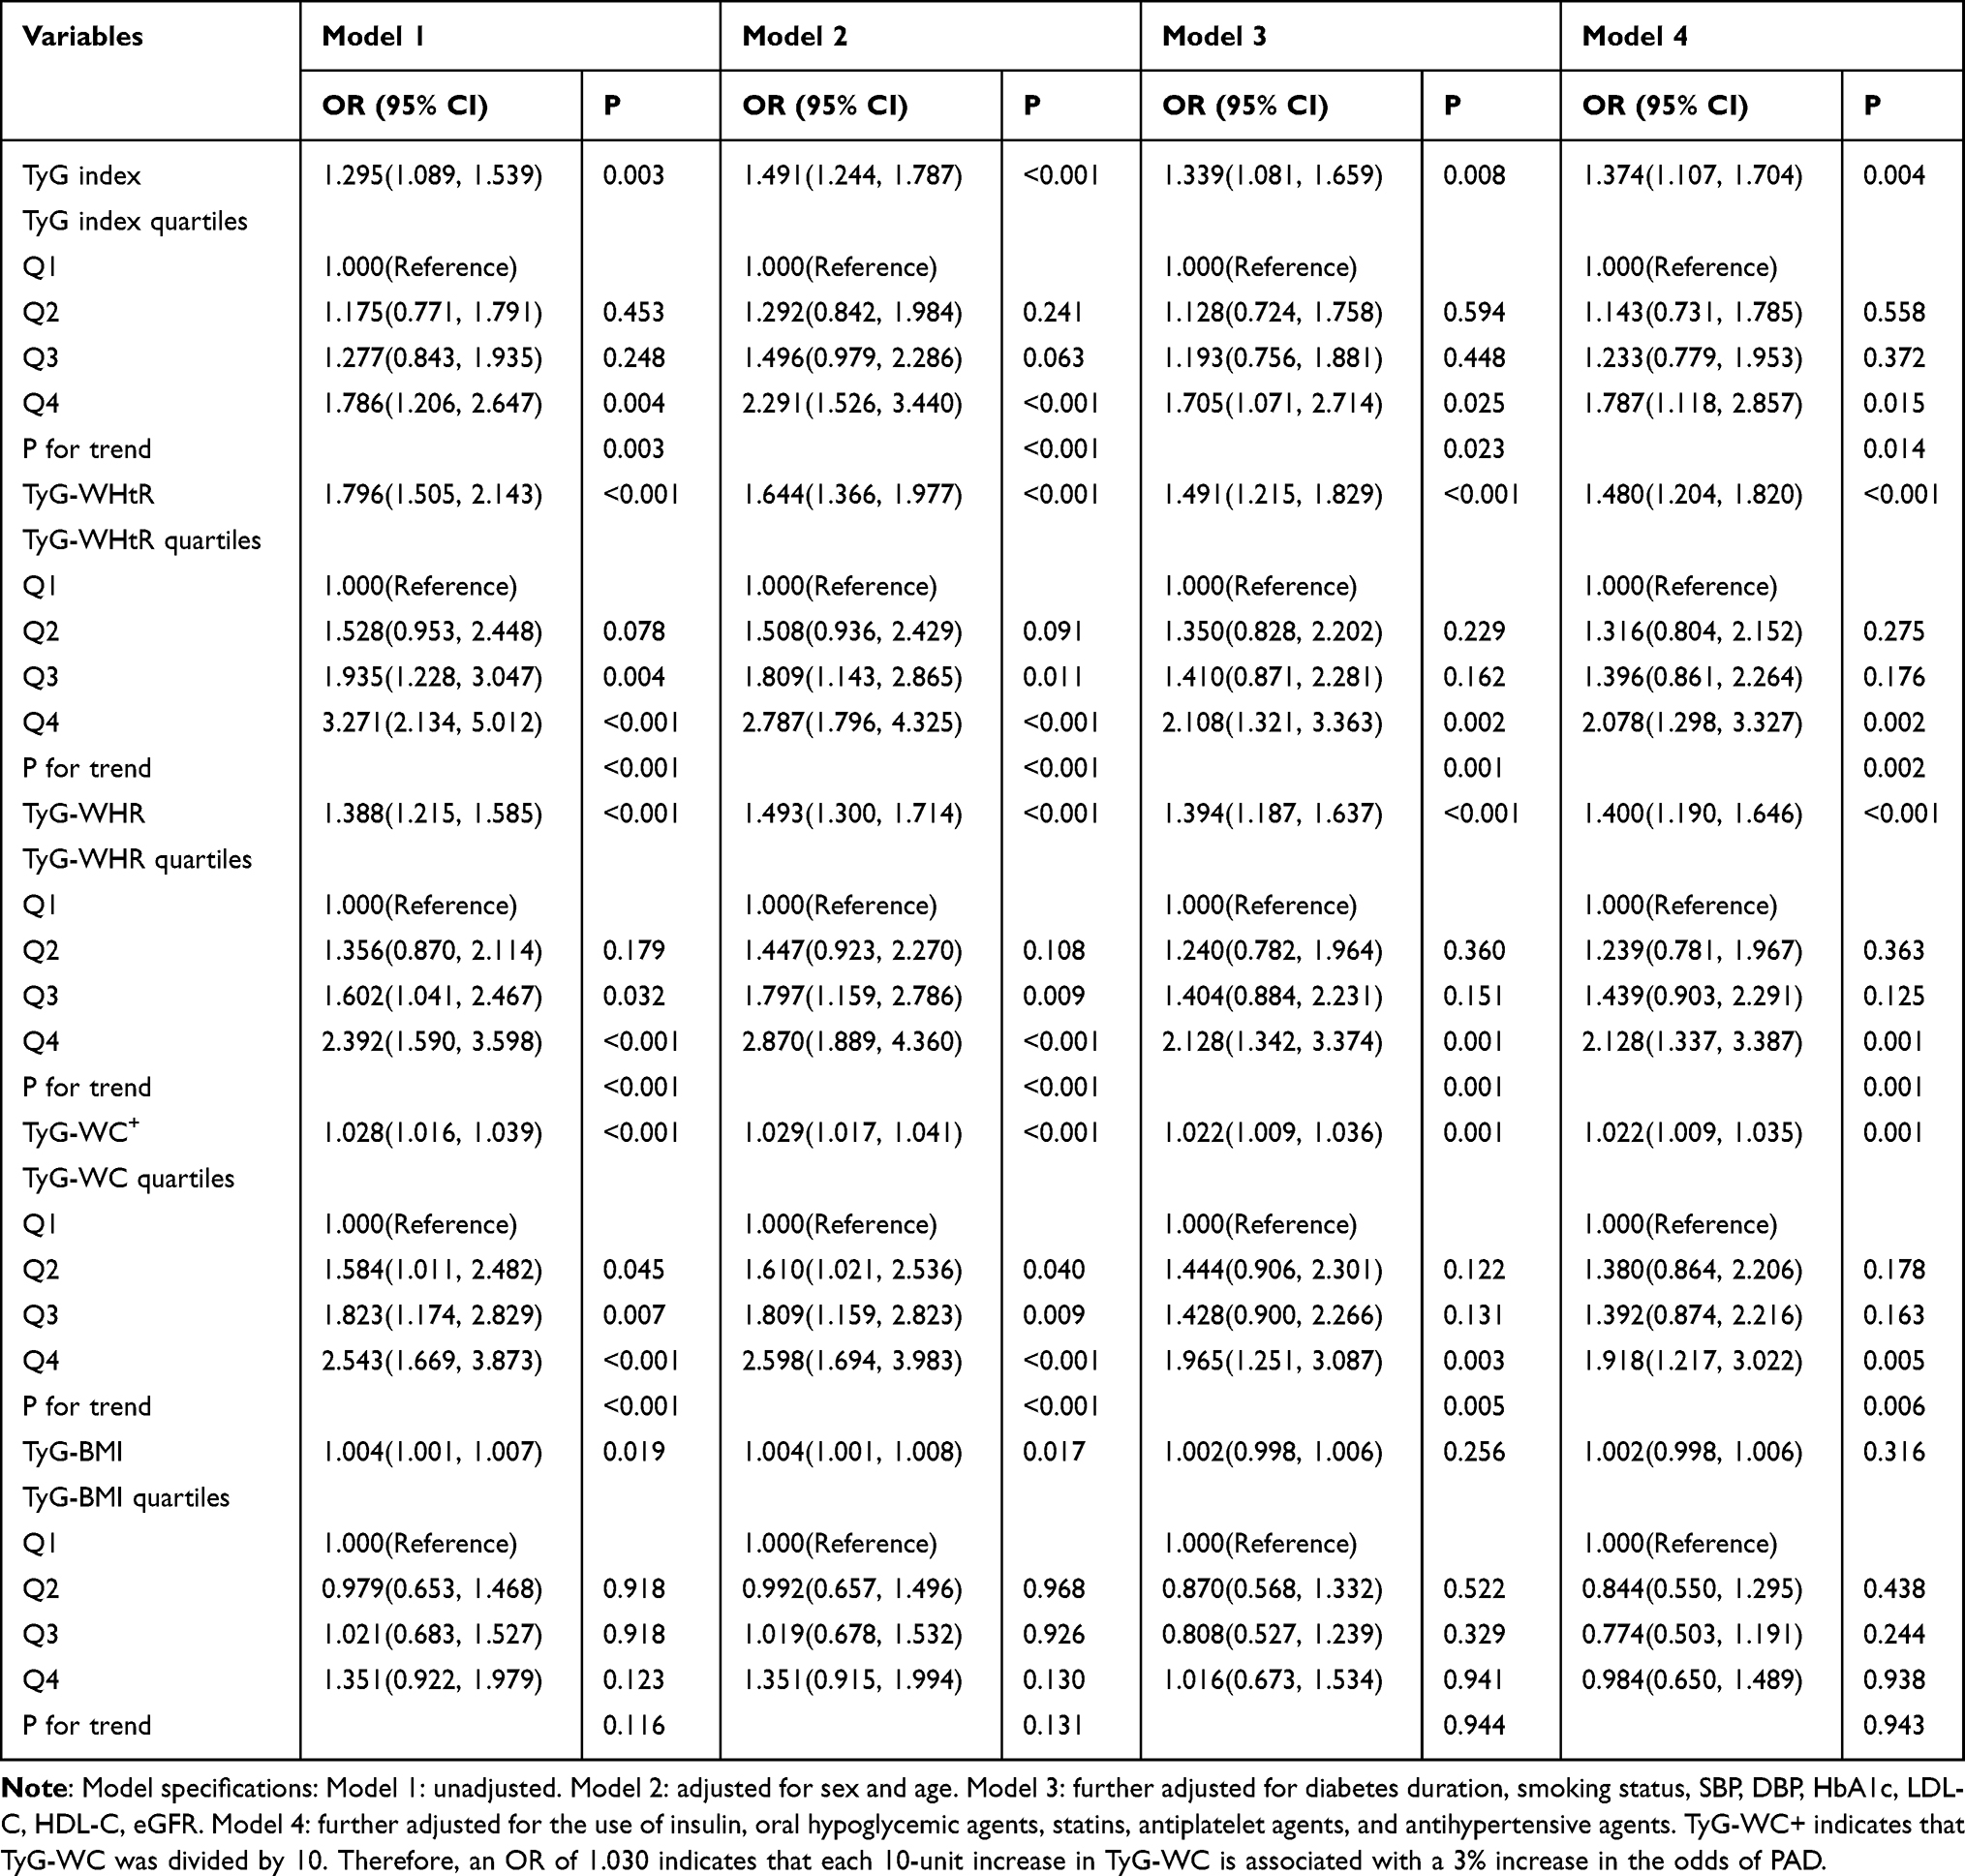 |
Table 2 Logistic Regression Analysis of the Association Between Different Indices and the Presence of Peripheral Artery Disease (PAD) in Patients with T2DM |
Exploration of Subgroup Analyses
Participants were stratified by sex (male, female), age (< 60 years, ≥ 60 years), smoking status (yes, no), duration of diabetes (< 10 years, ≥ 10 years), glycemic control (HbA1c < 7%, HbA1c ≥ 7%), and renal function (eGFR < 60 or ≥ 60 mL/min/1.73 m2). Stratified analyses were conducted to further assess the strength of associations between the TyG indicators and the presence of PAD. The results of the subgroup analyses for each indicator are presented in Figure 2. Among female participants, non-smokers, and patients with eGFR ≥ 60 mL/min/1.73 m2, TyG, TyG-WHtR, TyG-WHR, and TyG-WC were significantly associated with higher odds of PAD. In contrast, these associations were not observed among male participants, smokers, or patients with eGFR < 60 mL/min/1.73 m2. In patients with controlled glycemia (HbA1c < 7%), TyG, TyG-WC, and TyG-BMI were significantly and positively associated with the presence of PAD; however, these associations were not evident in patients with HbA1c ≥ 7%. Notably, the associations of TyG-WHtR and TyG-WHR with PAD remained statistically significant in both glycemic control subgroups, with stronger effect sizes observed in the well-controlled glycemic group. In the fully adjusted model, after Benjamini-Hochberg correction for multiple testing, significant interactions were identified between sex and TyG-derived indices (TyG-WHtR, TyG-WHR, and TyG-WC) with respect to the presence of PAD (adjusted interaction P values = 0.040, 0.030, and 0.030, respectively). Significant interactions were observed between smoking status and TyG-related indices (TyG, TyG-WHtR, TyG-WHR, and TyG-WC) in relation to the presence of PAD (adjusted interaction P values = 0.047, 0.030, 0.030, and 0.030, respectively) (Supplementary Table 2).
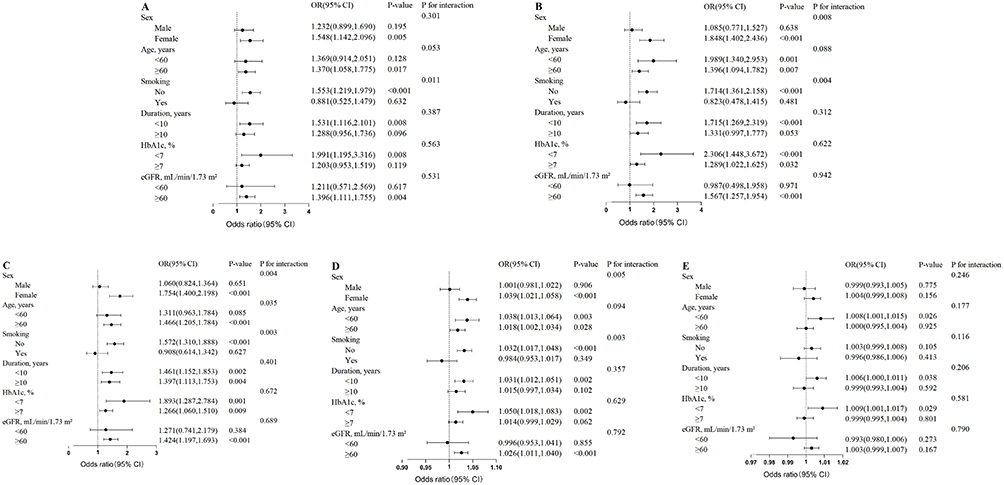 |
Figure 2 Subgroup analyses of the association between TyG (A), TyG-WHtR (B), TyG-WHR (C), TyG-WC+ (D), TyG-BMI (E) and the presence of PAD in T2DM patients. Adjustments were made for sex, age, diabetes duration, smoking, SBP, DBP, HbA1c, LDL-C, HDL-C, eGFR, the use of insulin, oral hypoglycemic agents, statins, antiplatelet agents, and antihypertensive agents before stratification. Benjamini–Hochberg-adjusted P values are provided in Supplementary Table 2. Abbreviations: CI, confidence interval; OR, odds ratio; SBP, systolic blood pressure; DBP, diastolic blood pressure; HbA1c, glycated hemoglobin, LDL-C: low-density lipoprotein cholesterol; HDL-C, high-density lipoprotein cholesterol; eGFR, estimated glomerular filtration rate. Note: TyG-WC+ represents TyG-WC was divided by 10. |
Discriminative Performance for the Presence of PAD in Patients with T2DM
The discriminative performance of the TyG index and its derived indicators for the presence of PAD was evaluated using receiver operating characteristic (ROC) curves (Table 3 and Figure 3). Among all indicators, TyG-WHtR demonstrated the highest AUC of 0.622 (95% CI: 0.582–0.662, P < 0.001), followed by TyG-WHR (AUC = 0.593, 95% CI: 0.554–0.632, P < 0.001), TyG-WC (AUC = 0.592, 95% CI: 0.552–0.631, P < 0.001), and the TyG index alone (AUC = 0.558, 95% CI: 0.518–0.597, P = 0.005). TyG-BMI showed the lowest discriminative ability (AUC = 0.538, 95% CI: 0.497–0.580, P = 0.060).
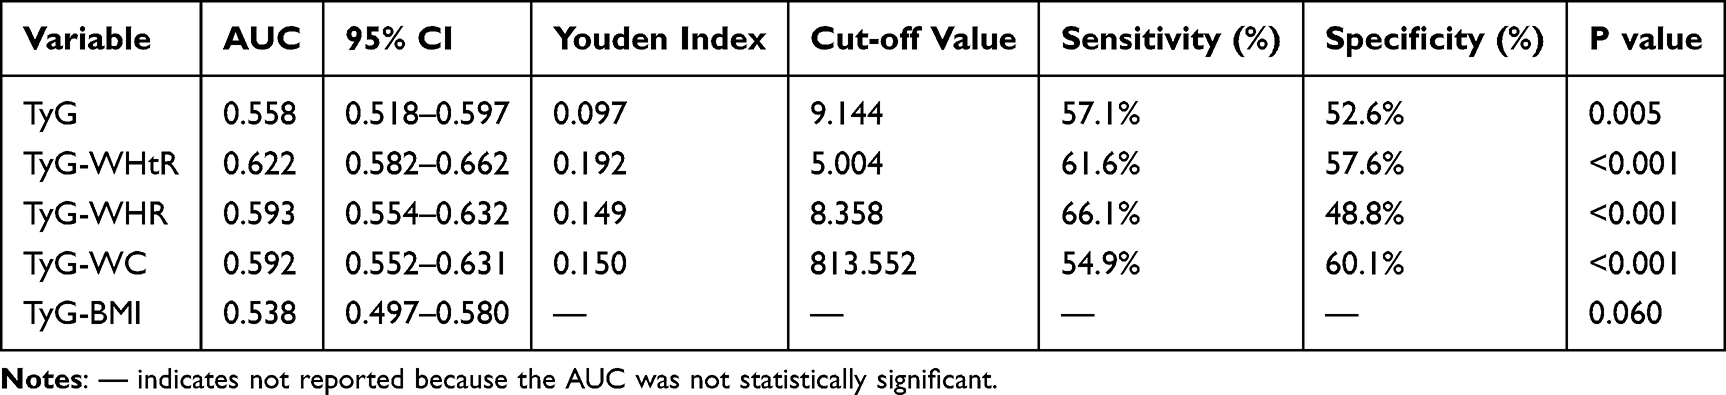 |
Table 3 Discriminative Ability of TyG Index and Its Derived Indices for the Presence of PAD |
 |
Figure 3 Receiver operating characteristic (ROC) curves of TyG and its derived indices for identifying the presence of PAD. |
At the optimal cut-off value of 5.004, TyG-WHtR achieved a sensitivity of 61.6% and a specificity of 57.6%. Pairwise comparisons using DeLong’s test with Bonferroni correction (Supplementary Table 3) confirmed that the AUC of TyG-WHtR was significantly greater than those of the TyG index (P < 0.001), TyG-WC (P < 0.001), and TyG-BMI (P < 0.001). However, after multiple testing correction, no significant difference was observed between the AUCs of TyG-WHtR and TyG-WHR (P = 0.015), nor between TyG-WHR and TyG-WC (P = 0.911).
Discussion
This study demonstrates that the TyG index and its derivatives based on central obesity indicators (TyG-WHtR, TyG-WHR, TyG-WC) are positively associated with the presence of PAD in patients with T2DM, exhibiting clear dose–response relationships, whereas TyG-BMI, derived from a general obesity index, shows no significant association. Notably, TyG-WHtR showed relatively better discriminative ability compared with other indices evaluated. These associations were significantly modified by sex and smoking status, being most pronounced in women and non-smokers. This suggests that TyG-WHtR may serve as a valuable supplementary metabolic marker associated with PAD in patients with T2DM, particularly in specific subgroups.
Our findings regarding the positive association between the TyG index and the presence of PAD are highly consistent with those of several previous studies.22–24 However, existing literature concerning TyG-derived indices in relation to the presence of PAD remains limited. Recent studies have begun to address this gap; for instance, Miao et al reported positive associations of the TyG index, TyG-WHR, and TyG-WC with the presence of PAD,17 and Mitrea et al identified a link between TyG-WHtR and lower limb complications.18 The present study extends these findings by directly comparing multiple obesity-related derivatives, demonstrating that TyG-WHtR exhibits the best discriminative performance among the indices evaluated. The discriminative superiority of TyG-WHtR over TyG-BMI can be attributable to the distinct pathophysiological roles of different adipose compartments. While BMI serves as a measure of overall body size, it fails to distinguish between fat mass and lean mass, and its discriminative utility may be further attenuated by a potentially U-shaped relationship with cardiovascular risk.25 In contrast, WHtR is a height-standardized indicator of central obesity that correlates strongly with the accumulation of visceral adipose tissue (VAT).26,27 Excess VAT is metabolically active, releasing pro-inflammatory adipokines and free fatty acids that directly exacerbate insulin resistance, endothelial dysfunction, and chronic inflammation—the primary drivers of atherosclerosis.28 This distinction is particularly critical in East Asian populations, who tend to accumulate a higher proportion of VAT at lower BMI levels compared with Caucasians.29 Such a “metabolically obese, normal weight” phenotype suggests that Chinese patients with T2DM may harbor significant metabolic risks driven by visceral adiposity even when their BMI remains within the normal range,29,30 thereby limiting the sensitivity of BMI-based indices.31 Consequently, by integrating WHtR, the TyG-WHtR index effectively captures the synergistic impact of “glucolipotoxicity” and pathogenic visceral fat on the vascular wall,32 making it a more robust marker for PAD in this specific population.32
The greater discriminative ability of TyG-WHtR observed in this study is consistent with previous reports that identify it as a superior predictor of atherosclerosis32 and cardiovascular events.14,33 Given that prior research has consistently demonstrated strong associations between the TyG index and its obesity-related derivatives with other atherosclerotic outcomes,13–16 our findings in lower extremity vascular disease align well with these established trends. While TyG-WHtR exhibited the highest AUC (0.622), it is important to note that its absolute discriminative power remains modest, suggesting that PAD is a multifactorial disease where TyG-WHtR serves as a valuable supplementary tool rather than a standalone diagnostic marker.
The subgroup analyses suggested possible heterogeneity in the associations between TyG-related indices and PAD. Regarding sex differences, the magnitude of the association was significantly greater in women (mean age 62.5 years) than in men, consistent with other findings.34 The underlying mechanisms may involve the differential effects of sex hormones on fat distribution and metabolism. Declining estrogen levels during the perimenopausal and postmenopausal periods attenuate estrogen’s cardioprotective effects, promoting central adiposity and insulin resistance.35,36 In this context, insulin resistance and its related metabolic disturbances may contribute more prominently to the atherosclerotic process. In contrast, the associations were significantly attenuated among smokers and patients with chronic kidney disease. Beyond the possibility that the direct endothelial damage caused by nicotine or uremic toxins predominates in these groups,37,38 this attenuation strongly points to the presence of unmeasured or residual confounding related to lifestyle, medications, and disease severity. First, regarding lifestyle, our binary classification of smoking status could not account for the cumulative dose effect (eg., pack-years); the profound vascular injury in heavy smokers may completely overshadow the metabolic contributions of TyG-derived indices. Second, confounding by medication intensity must be considered. Patients with impaired renal function (eGFR < 60 mL/min/1.73 m2) or multiple risk factors often receive more aggressive pharmacological interventions, including high-intensity statins,39 antiplatelet agents, and novel antidiabetics (eg., SGLT2 inhibitors or GLP-1 receptor agonists).11,12 These therapies profoundly alter lipid and glucose profiles—directly lowering the TyG index—while simultaneously providing potent cardiovascular protection, thereby potentially blunting the observable association between baseline TyG levels and PAD. Taken together, these subgroup findings imply that TyG-related indices reflect a cumulative systemic metabolic burden, whose associative strength is most evident in earlier stages of disease before irreversible vascular damage (eg., from heavy smoking) or heavy polypharmacy dominates the clinical picture. The modifying role of glycemic control is also notable In individuals with poor glycemic control, hyperglycemia-driven mechanisms may predominate,40 yet TyG-WHtR and TyG-WHR remained significant, underscoring the robustness of indices that incorporate visceral adiposity measures. Although P values for interaction were adjusted using the Benjamini-Hochberg procedure to mitigate the false discovery rate, these subgroup analyses were exploratory; therefore, the subgroup findings should be interpreted as hypothesis-generating and require further validation.
Although the precise mechanisms underlying the associations between the TyG index, its obesity-related derivatives, and PAD are multifaceted, insulin resistance, dyslipidemia, and chronic inflammation play central roles.8,9,41 The TyG index and its derivatives are validated markers of insulin resistance, which promotes atherosclerosis through endothelial dysfunction, oxidative stress, and procoagulant states.41 Concurrently, glucolipotoxicity contributes to atherosclerosis through multiple pathways.42,43
Several limitations of this study should be acknowledged: (1) As a single-center retrospective cross-sectional study, causal relationships cannot be established, and the findings may have limited generalizability to other populations or settings. (2) All biomarkers were measured at a single time point, and the longitudinal trajectories of these parameters and their associations with clinical outcomes remain unknown. (3) Some potential confounding factors may not have been fully accounted for. Specifically, detailed information on novel antidiabetic classes (eg., SGLT2 inhibitors and GLP-1 receptor agonists), the intensity of statin therapy, and lifestyle variables (eg., physical activity and diet) were unavailable due to the retrospective nature of this study. Although we adjusted for general medication use in Model 4, potential residual confounding from these specific therapies cannot be entirely excluded. (4) This study included only a Chinese population; given differences in ethnicity, diet, physical activity, and sleep patterns, the findings should be validated in multicenter, multiethnic, large-scale prospective cohort studies in the future.
Conclusions
The TyG index and its central obesity–based derivatives (TyG-WHtR, TyG-WHR, TyG-WC) are independently associated with the presence of lower extremity PAD in T2DM patients, with TyG-WHtR showing the highest discriminative value among these markers. Given their simplicity and accessibility, these indices may assist in early clinical evaluation and the identification of metabolic burden, particularly in primary care settings.
Abbreviations
TyG, Triglyceride–glucose; PAD, Peripheral artery disease; T2DM, Type 2 diabetes mellitus; ABI, Ankle-brachial index; ROC, Receiver operating characteristic; IR, Insulin resistance; WC, Waist circumference; WHR, Waist-to-hip ratio; WHtR, Waist-to-height ratio; BMI, Body mass index; SBP, Systolic blood pressure; DBP, Diastolic blood pressure; FPG, Fasting plasma glucose; 2hPG, 2-hour postprandial plasma glucose; TC, Total cholesterol; LDL-C, Low-density lipoprotein cholesterol; HDL-C, High-density lipoprotein cholesterol; TG, Triglycerides; ALT, Alanine aminotransferase; AST, Aspartate aminotransferase; BUN, Blood urea nitrogen; SCr, Serum creatinine; UA, Uric acid; HbA1c, Glycated hemoglobin; UACR, Urinary albumin-to-creatinine ratio; eGFR, Estimated glomerular filtration rate; MDRD, Modification of Diet in Renal Disease; baPWV, Brachial–ankle pulse wave velocity.
Data Sharing Statement
The authors confirm that the data supporting the findings of this study are available within the article and its supplementary materials.
Ethics Approval and Informed Consent
This study was approved by the Ethics Committee of Sanming First Hospital (Approval No. [2025] 216). The requirement for informed consent was waived by the Institutional Review Board of Sanming First Hospital because of the retrospective nature of the study. All procedures were performed in accordance with the ethical standards laid down in the 1964 Declaration of Helsinki and its later amendments.
Author Contributions
Yangyang Guo: Conceptualization, Data curation, Writing – original draft; Xiang Zhou: Formal analysis, Investigation, Writing – original draft; Liyu Chen: Software, Resources, Supervision, Writing – review & editing; Junmin Zheng: Methodology, Project administration, Writing – review & editing. All authors gave final approval of the version to be published; have agreed on the journal to which the article has been submitted; and agree to be accountable for all aspects of the work.
Funding
The study was supported by the Sanming Science and Technology Bureau Scientific Fund (Number: 2024-S-098).
Disclosure
All authors report grants from Scientific Fund of Sanming Science and Technology Bureau, during the conduct of the study.
References
1. Criqui MH, Matsushita K, Aboyans V, et al. Lower extremity peripheral artery disease: contemporary epidemiology, management gaps, and future directions: a scientific statement from the American Heart Association. Circulation. 2021;144(9):e171–13. doi:10.1161/CIR.0000000000001005
2. Zhang X, Ran X, Xu Z, et al. Epidemiological characteristics of lower extremity arterial disease in Chinese diabetes patients at high risk: a prospective, multicenter, cross-sectional study. J Diabetes Complications. 2018;32(2):150–156. doi:10.1016/j.jdiacomp.2017.10.003
3. Monteiro-Soares M, Russell D, Boyko EJ, et al. Guidelines on the classification of diabetic foot ulcers (IWGDF 2019). Diabetes Metab Res Rev. 2020;36(1):e3273. doi:10.1002/dmrr.3273
4. Samavarchitehrani A, Cannavo A, Behnoush AH, Kazemi Abadi A, Shokri Varniab Z, Khalaji A. Investigating the association between the triglyceride-glucose index and peripheral artery disease: a systematic review and meta-analysis. Nutr Diabetes. 2024;14(1):80. doi:10.1038/s41387-024-00341-y
5. Ramdas Nayak VK, Satheesh P, Shenoy MT, Kalra S. Triglyceride Glucose (TyG) index: a surrogate biomarker of insulin resistance. J Pak Med Assoc. 2022;72(5):986–988. doi:10.47391/JPMA.22-63
6. Sheng G, Lu S, Xie Q, Peng N, Kuang M, Zou Y. The usefulness of obesity and lipid-related indices to predict the presence of Non-alcoholic fatty liver disease. Lipids Health Dis. 2021;20(1):134. doi:10.1186/s12944-021-01561-2
7. Juonala M, Magnussen CG, Berenson GS, et al. Childhood adiposity, adult adiposity, and cardiovascular risk factors. N Engl J Med. 2011;365(20):1876–1885. doi:10.1056/NEJMoa1010112
8. Lim J, Kim J, Koo SH, Kwon GC. Comparison of triglyceride glucose index, and related parameters to predict insulin resistance in Korean adults: an analysis of the 2007-2010 Korean National Health and Nutrition Examination Survey. PLoS One. 2019;14(3):e0212963. doi:10.1371/journal.pone.0212963
9. Lee J, Kim B, Kim W, et al. Lipid indices as simple and clinically useful surrogate markers for insulin resistance in the U.S. population. Sci Rep. 2021;11(1):2366. doi:10.1038/s41598-021-82053-2
10. Boccatonda A, D’Ardes D, Moronti V, et al. From MASLD to PAD: looking for cardiovascular disease starting from metabolic status. Medicina. 2024;60(11):1781. doi:10.3390/medicina60111781
11. Gómez-Huelgas R, Sanz-Cánovas J, Cobos-Palacios L, López-Sampalo A, Pérez-Belmonte LM. Glucagon-like peptide-1 receptor agonists and sodium-glucose cotransporter 2 inhibitors for cardiovascular and renal protection: a treatment approach far beyond their glucose-lowering effect. Eur J Internal Med. 2022;96:26–33. doi:10.1016/j.ejim.2021.11.008
12. Luna-Marco C, Iannantuoni F, Hermo-Argibay A, et al. Cardiovascular benefits of SGLT2 inhibitors and GLP-1 receptor agonists through effects on mitochondrial function and oxidative stress. Free Radic Biol Med. 2024;213:19–35. doi:10.1016/j.freeradbiomed.2024.01.015
13. Tang X, Zhang K, He R. Correction: the association of triglyceride-glucose and triglyceride-glucose related indices with the risk of heart disease in a national cohort study. Cardiovasc Diabetol. 2025;24(1):174. doi:10.1186/s12933-025-02726-4
14. Dang K, Wang X, Hu J, et al. The association between triglyceride-glucose index and its combination with obesity indicators and cardiovascular disease: NHANES 2003-2018. Cardiovasc Diabetol. 2024;23(1):8. doi:10.1186/s12933-023-02115-9
15. Liu MJ, Pei JY, Zeng C, et al. Triglyceride-glucose related indices as predictors for major adverse cardiovascular events and overall mortality in type-2 diabetes mellitus patients. World J Diabetes. 2025;16(3):101488. doi:10.4239/wjd.v16.i3.101488
16. Li Z, Ban Y, Hu M, Deng L, Xie X. Joint association of triglyceride-glucose index and obesity indicators with stroke risk: a nationwide prospective cohort study. Sci Rep. 2025;15(1):37276. doi:10.1038/s41598-025-21331-9
17. Miao Y, Wang Y, Wang Y, Yan P, Chen Z, Wan Q. The association between triglyceride-glucose index and its combination with obesity indicators and lower extremity peripheral artery disease in patients with type 2 diabetes mellitus: a Cross-Sectional Study. Diabetes Metab Syndr Obes. 2024;17:2607–2617. doi:10.2147/DMSO.S469692
18. Mitrea A, Ștefan AG, Vladu IM, et al. A Composite score of insulin resistance and inflammation biomarkers for predicting lower limb complications in type 2 diabetes mellitus. Int J Mol Sci. 2025;26(24):11859. doi:10.3390/ijms262411859
19. Levey AS, Coresh J, Greene T, et al. Using standardized serum creatinine values in the modification of diet in renal disease study equation for estimating glomerular filtration rate. Ann Intern Med. 2006;145(4):247–254. doi:10.7326/0003-4819-145-4-200608150-00004
20. Aboyans V, Criqui MH, Abraham P, et al. Measurement and interpretation of the ankle-brachial index: a scientific statement from the American Heart Association. Circulation. 2012;126(24):2890–2909. doi:10.1161/CIR.0b013e318276fbcb
21. Wu S, Xu L, Wu M, Chen S, Wang Y, Tian Y. Association between triglyceride-glucose index and risk of arterial stiffness: a cohort study. Cardiovasc Diabetol. 2021;20(1):146. doi:10.1186/s12933-021-01342-2
22. Shao C, Fei C, Gu M, et al. Comparative predictive value of the TyG index and UHR for lower extremity artery disease in type 2 diabetes: a retrospective analysis. Diabetes Metab Syndr Obes. 2025;18:1341–1351. doi:10.2147/DMSO.S496727
23. Liu Y, Chang L, Wu M, Xu B, Kang L. Triglyceride glucose index was associated with the risk of peripheral artery disease. Angiology. 2022;73(7):655–659. doi:10.1177/00033197211070644
24. Gao JW, Hao QY, Gao M, et al. Triglyceride-glucose index in the development of peripheral artery disease: findings from the Atherosclerosis Risk in Communities (ARIC) Study. Cardiovasc Diabetol. 2021;20(1):126. doi:10.1186/s12933-021-01319-1
25. Zhang Y, Guo Y, Shen X, Zhao F, Yan S. Lower body mass index is not of more benefit for diabetic complications. J Diabetes Investig. 2019;10(5):1307–1317. doi:10.1111/jdi.13003
26. McLaughlin T, Lamendola C, Liu A, Abbasi F. Preferential fat deposition in subcutaneous versus visceral depots is associated with insulin sensitivity. J Clin Endocrinol Metab. 2011;96(11):E1756–1760. doi:10.1210/jc.2011-0615
27. Swainson MG, Batterham AM, Tsakirides C, Rutherford ZH, Hind K. Prediction of whole-body fat percentage and visceral adipose tissue mass from five anthropometric variables. PLoS One. 2017;12(5):e0177175. doi:10.1371/journal.pone.0177175
28. Kwon H, Pessin JE. Adipokines mediate inflammation and insulin resistance. Front Endocrinol. 2013;4:71. doi:10.3389/fendo.2013.00071
29. Zheng H, Xu M, Yang J, Xu M. Association between the triglyceride-glucose index and its combined obesity indicators and the risk of hypertension in middle-aged and older Chinese adults: a nationwide cross-sectional study. PLoS One. 2025;20(1):e0316581. doi:10.1371/journal.pone.0316581
30. Xuan W, Liu D, Zhong J, Luo H, Zhang X. Impacts of triglyceride glucose-waist to height ratio on diabetes incidence: a secondary analysis of a population-based longitudinal data. Front Endocrinol. 2022;13:949831. doi:10.3389/fendo.2022.949831
31. Tewari A, Kumar G, Maheshwari A, Tewari V, Tewari J. Comparative evaluation of waist-to-height ratio and BMI in predicting adverse cardiovascular outcome in people with diabetes: a systematic review. Cureus. 2023;15(5):e38801. doi:10.7759/cureus.38801
32. He Y, Cao Y, Chen Z, Qin Y, Wang F. Association between the triglyceride-glucose-waist-to-height ratio and early arterial stiffness in cardiovascular-kidney-metabolic syndrome. Eur J Med Res. 2025;30(1):629. doi:10.1186/s40001-025-02881-0
33. Zhuang Y, Qiu L, Han D, et al. The association between triglyceride-glucose index and related parameters and risk of cardiovascular disease in American adults under different glucose metabolic states. Diabetol Metab Syndr. 2024;16(1):102. doi:10.1186/s13098-024-01340-w
34. Wang S, Shi J, Peng Y, et al. Stronger association of triglyceride glucose index than the HOMA-IR with arterial stiffness in patients with type 2 diabetes: a real-world single-centre study. Cardiovasc Diabetol. 2021;20(1):82. doi:10.1186/s12933-021-01274-x
35. Regitz-Zagrosek V, Gebhard C. Gender medicine: effects of sex and gender on cardiovascular disease manifestation and outcomes. Nat Rev Cardiol. 2023;20(4):236–247. doi:10.1038/s41569-022-00797-4
36. Nappi RE, Chedraui P, Lambrinoudaki I, Simoncini T. Menopause: a cardiometabolic transition. Lancet Diabetes Endocrinol. 2022;10(6):442–456. doi:10.1016/S2213-8587(22)00076-6
37. Addissouky TA, El Sayed IET, Ali MMA, et al. Oxidative stress and inflammation: elucidating mechanisms of smoking-attributable pathology for therapeutic targeting. Bull Natl Res Cent. 2024;48(1):16. doi:10.1186/s42269-024-01174-6
38. Serra R, Bracale UM, Ielapi N, et al. The impact of chronic kidney disease on peripheral artery disease and peripheral revascularization. Int J Gen Med. 2021;14:3749–3759. doi:10.2147/IJGM.S322417
39. Liao G, Wang X, Li Y, et al. Antidyslipidemia pharmacotherapy in chronic kidney disease: a systematic review and bayesian network meta-analysis. Pharmaceutics. 2022;15(1):6. doi:10.3390/pharmaceutics15010006
40. Giacco F, Brownlee M. Oxidative stress and diabetic complications. Circ Res. 2010;107(9):1058–1070. doi:10.1161/CIRCRESAHA.110.223545
41. Di Pino A, DeFronzo RA. Insulin resistance and atherosclerosis: implications for insulin-sensitizing agents. Endocr Rev. 2019;40(6):1447–1467. doi:10.1210/er.2018-00141
42. Marques ARA, Ferreira IS, Ribeiro Q, et al. Glucosylated cholesterol accumulates in atherosclerotic lesions and impacts macrophage immune response. J Lipid Res. 2025;66(6):100825. doi:10.1016/j.jlr.2025.100825
43. Bachar E, Ariav Y, Cerasi E, Kaiser N, Leibowitz G. Neuronal nitric oxide synthase protects the pancreatic beta cell from glucolipotoxicity-induced endoplasmic reticulum stress and apoptosis. Diabetologia. 2010;53(10):2177–2187. doi:10.1007/s00125-010-1833-6
 © 2026 The Author(s). This work is published and licensed by Dove Medical Press Limited. The
full terms of this license are available at https://www.dovepress.com/terms
and incorporate the Creative Commons Attribution
- Non Commercial (unported, 4.0) License.
By accessing the work you hereby accept the Terms. Non-commercial uses of the work are permitted
without any further permission from Dove Medical Press Limited, provided the work is properly
attributed. For permission for commercial use of this work, please see paragraphs 4.2 and 5 of our Terms.
© 2026 The Author(s). This work is published and licensed by Dove Medical Press Limited. The
full terms of this license are available at https://www.dovepress.com/terms
and incorporate the Creative Commons Attribution
- Non Commercial (unported, 4.0) License.
By accessing the work you hereby accept the Terms. Non-commercial uses of the work are permitted
without any further permission from Dove Medical Press Limited, provided the work is properly
attributed. For permission for commercial use of this work, please see paragraphs 4.2 and 5 of our Terms.