Back to Journals » Patient Preference and Adherence » Volume 16
Association of Supply Source with Continence Product and Care Satisfaction in Patients with Urinary Incontinence
Authors Grotenhuis N, Schreuder MC, van den Bos TW, van der Worp H, Blanker MH ![]()
Received 15 February 2022
Accepted for publication 27 May 2022
Published 15 August 2022 Volume 2022:16 Pages 2115—2123
DOI https://doi.org/10.2147/PPA.S359960
Checked for plagiarism Yes
Review by Single anonymous peer review
Peer reviewer comments 2
Editor who approved publication: Dr Johnny Chen
Nina Grotenhuis,1 Miranda C Schreuder,1 Tine WL van den Bos,2 Henk van der Worp,1 Marco H Blanker1
1Department of General Practice and Elderly Care Medicine, University Medical Center Groningen, University of Groningen, Groningen, the Netherlands; 2Foundation Bekkenbodem4All, Tiel, the Netherlands
Correspondence: Miranda C Schreuder, Department of General Practice and Elderly Care medicine, University Medical Center Groningen, University of Groningen, FA21, PO Box 196, Groningen, 9700AD, the Netherlands, Tel +31 625647144, Email [email protected]
Purpose: We aimed to examine how supply source affects satisfaction with continence products and care among individuals with urinary incontinence (UI). Supply source was compared among pharmacies, national suppliers, and shops. The secondary aim was to compare participant characteristics between the three groups.
Patients and Methods: A survey questionnaire was distributed via social media between April and June 2020. This included the international consultation on incontinence questionnaire (ICIQ) UI short form (ICIQ-UI-SF), the ICIQ-PadPROM, and the ICIQ-LUTSqol, together with questions about respondent characteristics and satisfaction with continence products.
Results: Of the 1045 respondents, 706 fully completed and 339 partially completed the survey. Among these, 322 (45.6%), 199 (28.1%), and 185 (26.2%) made purchases from shops, national suppliers, and pharmacies, respectively. The mean ICIQ-UI-SF sum scores were comparable for the pharmacy (13.3 ± 3.7) and national supplier (13.8 ± 3.5) groups, but were significantly lower for the shop group (12.0 ± 3.3). Mean sum scores for satisfaction with continence products and satisfaction with continence care were also significantly lower in the shop group (7.9 ± 2.6 and 6.4 ± 2.7, respectively) compared with the pharmacy (9.1 ± 2.7 and 7.9 ± 2.6, respectively) and national supplier (9.3 ± 2.6 and 8.1 ± 3.0, respectively) groups. There were no statistically significant differences in the ICIQ-PadPROM and ICIQ-LUTSqol scores. Respondents’ characteristics were similar, apart from the significantly lower number of males in the shop group.
Conclusion: Satisfaction with continence products and continence care is lower for people with UI who purchase materials from a shop than from a pharmacy or national supplier.
Keywords: incontinence care, health insurance, incontinence pads, urinary loss
Plain Language Summary
Many people use absorbent materials to manage urinary incontinence (UI). In the Netherlands, these are prescribed by a physician and delivered through either local pharmacies or national medical suppliers or they are bought without prescription in shops. We surveyed people with UI to examine how the supply source affected their satisfaction with continence products and satisfaction with care. The survey contained questionnaires about the extent and impact of UI, satisfaction with UI products, and satisfaction with continence care. The pharmacy and national supplier groups had similar levels of satisfaction, but those who bought products from a shop had lower satisfaction scores. More research needs to be done to identify the main reasons for lower satisfaction among people who buy continence products from a shop.
Introduction
Urinary incontinence (UI) is a prevalent condition for which about 80% of women and 11% of men use continence products.1–4 In the Netherlands UI affects 29–57% of women and 9–23% of men, depending on age and definitions used.1–3 Its prevalence increases with age. In 2018 the prevalence in the general practice of both genders with UI was 11%.4 The prevalence in the general population compared to the prevalence in the general practice shows an enormous gap. Studies have shown that the main reason to not seek professional help is based on the feeling the UI is not severe enough or that it is part of the ageing process and must be accepted.5,6 Increased severity of UI together with negative effect on daily activities and emotional wellbeing were reasons to actively seek help.6 Social impact is an important factor of UI, with patients being more prone to anxiety and social isolation.7,8
Men most frequently have urgency incontinence, whilst in women stress or mixed incontinence is the most common.1,2 In both types of UI absorbent products are effective aids. In the Netherlands, these are reimbursed when prescribed by a physician and delivered through local pharmacies or national medical suppliers,5,9 with patients directed to one of these options by insurance companies based on contractual agreements. Many patients also buy continence products over-the-counter from supermarkets or drug stores.9 Despite their frequent use, however, there is limited research into patient satisfaction regarding different continence products.10 Indeed, only one study has been conducted in the Netherlands, and this reported that 33% of women and 50% of men were dissatisfied with the continence product they used, citing skin irritation, leakage, and discomfort as the main reasons.9 This is unfortunate because suitable continence products are proven to decrease the (social) impact of UI in daily life, and thereby, improve quality of life (QoL).11 Not just for patients themselves, but also among caregivers.12 It may be that how continence products are supplied affects patient satisfaction and use, but there is no research on this topic.
In this study, we aimed to determine the effect of supply source on satisfaction with continence products and care, comparing supply via pharmacy, national supplier, and shop. Secondary aims were to identify differences and similarities in characteristics, QoL, and continence product use.
Materials and Methods
Study Design
This was a cross-sectional, survey-based study in which people with UI completed questionnaires and provided information about satisfaction with continence products and continence care. We distributed the survey via Facebook, Twitter, and LinkedIn between April and June 2020. To reach more respondents, a paid promotion was used for the Facebook post, targeting males and females aged ≥30 years in the Netherlands. Respondents were required to have completed at least two parts of the survey for their responses to be eligible for inclusion. The study focused on the supply of materials for UI from pharmacies, national suppliers, or shops. Therefore, respondents who obtained their supplies from other or unknown sources were excluded, as were those who denied UI or the use of continence products. The study was exempted from ethical approval by the Medical Ethical Committee of the University Medical Center Groningen (UMCG), number 2018/551, because it is not subject to the Medical Research Involving Human Subjects Act (Wet Medisch-wetenschappelijk Onderzoek, WMO) as subjects only complete a survey once and are not required to follow rules of behavior. The study complies with the declaration of Helsinki (Fortaleza, 2013). Participants gave informed consent before the start of the questionnaire.
Data Collection
The survey comprised seven questionnaires. REDCap v9.1.0 was used both to build the survey and to collect data. The questionnaires about participant characteristics and satisfaction with products and care were composed by the research team, but all others were taken from the International Consultation on Incontinence Questionnaire (ICIQ).13 Information about the type and extent of UI was assessed by the ICIQ Urinary Incontinence Short Form (ICIQ-UI-SF), with the total score ranging from 0 to 21 points.14 Lower scores indicated fewer complaints in all questionnaires. The impact of continence products on different aspects of daily life was assessed by the ICIQ for Absorbent Pads (ICIQ-PadPROM).15,16 We used the linguistically validated Dutch version of the PadPROM (data not yet reported). Sum scores for pad design and physical effects, psychological effects, social effects, and leakage and burden were in the ranges 3–31, 0–16, 0–12, and 0–12 points, respectively. The ICIQ Lower Urinary Tract Symptoms Quality of Life (ICIQ-LUTSqol) was used to assess the impact of UI on QoL, with sum scores ranging from 19 to 86 points.17
In the absence of an existing validated questionnaire to measure satisfaction with continence care and continence products, our research group created one that covered the two domains with three questions each. The questions about satisfaction with continence products were “To what extent are you satisfied with the continence product you use?”, “To what extent do the continence products support you during sleep?”, and “To what extent do the continence products support your daily activities?”. The questions about satisfaction with continence care were “To what extent are you satisfied with your treatment for urinary incontinence?”, “To what extent are you satisfied with freedom of choice in both continence care and urinary incontinence treatment?”, and “To what extent are you satisfied with your freedom of choice in continence product selection?”. Answers were collected on five-point Likert scales: “Not at all”, “Slightly”, “Neutral”, “Moderately”, and “Very” and were assigned 0, 1, 2, 3, and 4 points, respectively. Sum scores were calculated for the two domains and ranged from 0 to 12 points each.
We first enquired about the birth year, gender, and how the respondents’ continence products were supplied. Questionnaires were then completed in the following order: UI-SF, satisfaction, PadPROM, and LUTSqol. Any remaining general questions, such as postal code, ethnicity, marital status, living situation, education level, and profession were asked after completing the questionnaires. Response was considered “complete” if respondents completed the entire survey (even if individual questions were not answered), but response was considered “partial” if they dropped out before the end of the survey.
Analysis
Data were exported to IBM SSPS Version 25.0 (IBM Corp., Armonk, NY, USA) for analysis. We calculated descriptive statistics and compared survey questionnaires between those marked partially completed and complete. Outcomes missing in partial respondents were expected to be comparable to those for complete respondents. Continuous data are reported as means ± standard deviation and compared between two groups by independent t-tests, while categorical variables are reported as numbers and percentages and analyzed by χ2 tests. Statistical differences among pharmacy, online, and shop supply were analyzed by one-way analysis of variance (ANOVA). When statistically significant, a post-hoc Tukey’s honestly significant difference test was performed to see which groups differed significantly from each other. Bonferroni correction was used to minimize the chance of type I error due to multiple testing. Any p-value <0.0026 was considered statistically significant. Stratified analyses taking the severity of symptoms into account were performed for satisfaction with products and satisfaction with care. Stratification was done based on categorization of the ICIQ-UI-SF into four categories; slight, moderate, severe and very severe symptoms.18
Sample size for this study was calculated with the following formula: [distribution of 50%]/[(margin of error)/(confidence level score)].2 A sample size of 384 continence product users was required to achieve a 5% margin of error at the 95% confidence level. Given that the target population exceeded 100,000, no adjustment was needed for the true sample size.19
Results
Respondent Characteristics
In total, 1927 people responded to the survey, among whom 1045 were included in the analysis (Figure 1). These comprised 706 who completed the entire survey and 339 who partially completed the survey (Figure S1). Among those who gave partial responses, 224 stopped after the ICIQ-PadPROM and 73 stopped after the ICIQ-LUTSqol.
 |
Figure 1 Survey response flowchart. |
Of the 706 complete responders, 322 (45.6%), 199 (28.1%), and 185 (26.2%) purchased incontinence products from shops, national suppliers, and pharmacies, respectively. Their characteristics are shown in Table 1. The average age of respondents in the pharmacy group (63.8 years) was higher than in the other groups (58.7 and 59.5 years in the national supplier and shop groups, respectively). Only seven respondents were younger than 31 years. Most men bought products from a national supplier (55.1%) and fewest bought them from a shop (10.3%), whereas most women bought their products from a shop (50.0%). In the northern and southern regions of the Netherlands, most respondents bought materials from a shop (50.9% and 43.6%, respectively), while in the middle region of the Netherlands, supply was equal from national suppliers (38.8%) and shops (38.8%).
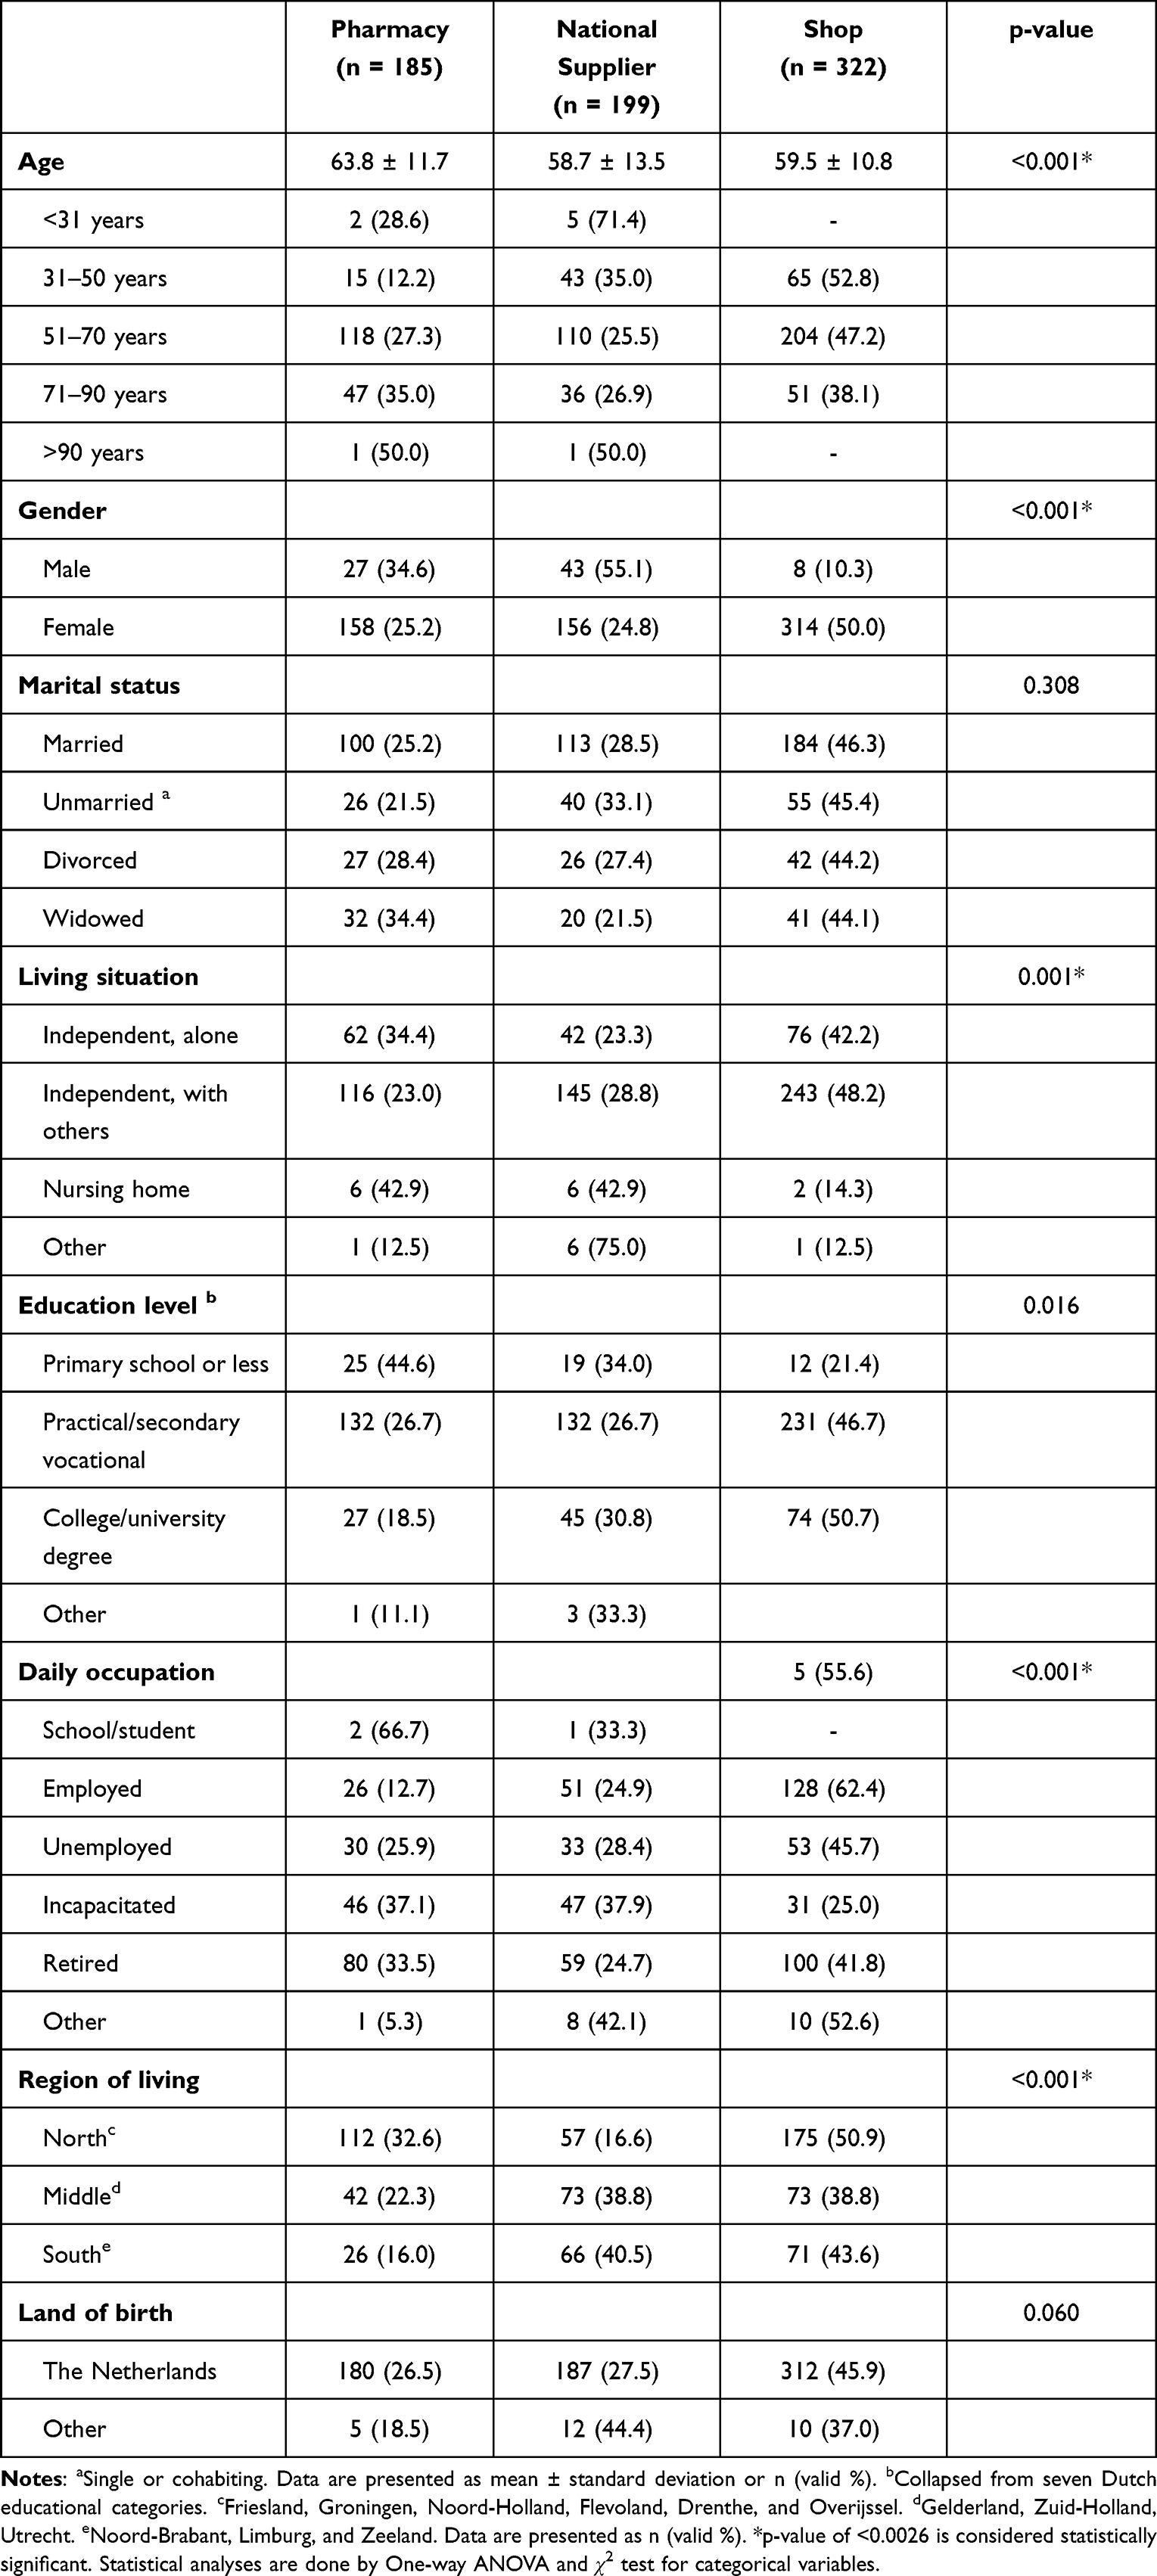 |
Table 1 Characteristics of Complete Respondents Divided into Groups by Supply of Continence Products |
Partial and Complete Responders
Approximately 90% of partial and complete responders were female and almost half bought continence products at a shop (Table S1). The average age of partial responders (63.2 ± 12.0 years) was significantly higher than that of complete responders (60.4 ± 12.0 years). Notably, the mean sum score of the ICIQ-PadPROM social aspects was 5.1 ± 3.5 for those who failed to complete the survey compared with 4.3 ± 3.3 for those who completed all sections (p = 0.001).
Severity of Complaints, QoL, and Satisfaction
Outcomes on the ICIQ-UI-SF and satisfaction with both the materials used and the care received were lowest for respondents who bought products at a shop (Table 2, Figure 2). A similar pattern of results was seen in the stratified analyses (Table S2), with the satisfaction being lowest for respondents who bought products at a shop.
 |
Table 2 Differences in Survey Questionnaire Outcomes in Patients with Urinary Incontinence Who Receive Continence Products Either by Pharmacy, National Supplier, or Shop |
 |
Figure 2 Outcomes on the ICIQ-UI-SF and satisfaction with both the materials used and the care received. |
No significant differences were found between the pharmacy and national supplier groups. ICIQ-PadPROM scores and ICIQ-LUTSqol scores in the 706 complete responders showed no differences between groups.
Discussion
This study revealed differences and similarities among Dutch people with UI by whether they obtained continence materials from a pharmacy, national supplier, or shop. There was notably lower satisfaction with both continence products and care among respondents who bought their materials from a shop compared with those who obtained materials from a pharmacy or national supplier. This difference was independent of the severity of UI.
Supply route did not alter the impact of continence products on daily life or the impact of UI on QoL. Respondents’ demographic characteristics were very similar overall, but some interesting differences were found between the three groups in the number of male respondents and where respondents lived in the Netherlands.
Comparison with Existing Literature
The most important finding of this study is that respondents who bought their continence products at a supermarket or drug store were less satisfied with those products and the continence care they received. Teunissen et al observed that men are generally less satisfied with continence products than women, possibly explaining the difference.9 However, only 10.3% of respondents who bought continence materials at a shop were male in our study, making it unlikely that this caused the lower satisfaction scores.
A more plausible explanation for the lower satisfaction may be the lack of guidance and information received when purchasing from a shop. Patients must undergo consultations to obtain products from pharmacies and national suppliers, thereby resulting in greater attention being given to individual continence care, which in turn, may increase patient satisfaction. Another factor could be that costs are higher because supply from a pharmacy or national supplier can be reimbursed by health insurance, while purchases made at a shop are made at the patient’s expense.5,9 This is in line with a previous study that showed that improving appropriateness of continence product provision by consultation and on an individual basis increases patient satisfaction.20 Consequently, patients may feel free to be more critical about products that are paid for directly out of pocket. Together, the lack of individual care and/or higher costs could result in lower patient satisfaction with products bought from a shop.
We should also consider that the lower severity and extent of UI in respondents who bought materials at a shop led to reduced comparability with the other groups. Both Teunissen et al and Visser et al found that the main reason for not visiting the GP was because patients perceive their complaints as insufficiently serious.5,9 Other studies have shown that also shame is a factor that prevents patients from visiting their GP.7,8,12 This is consistent with our findings, which add that reduced satisfaction with care may follow if patients feel their only recourse is to purchase costly products over-the-counter without reimbursement. Nonetheless, this is only the first study to consider the role of supply route in the Netherlands. Further research needs to be done to support these assumptions. In our study, respondents who purchased continence products at a shop did not experience lower QoL than those who obtained them via a pharmacy or national supplier, despite reporting less satisfaction with the continence products.
Even though we found a statistically significant difference in satisfaction between the groups, no statistically significant differences were found for the ICIQ-PadPROM and ICIQ-LUTSqol scores. This contrasts with previous studies, which found that satisfaction with continence products is linked to the impact of UI on daily life.1,9 However it is shown that the impact of UI goes beyond pad performance alone and that could be a possible explanation to this difference.11
Similarities and differences in respondent characteristics were present among the three groups. As in previous studies, most patients were female and aged 51–70 years, with only seven aged <31 years.1–3,5,9,11 This could be explained by the paid promotion on Facebook to focus on individuals aged 30 years or older. Although the study groups were similar in most regards, there were some important differences. For example, few men bought continence products at a shop, possibly due to embarrassment or unawareness that this was possible.9 Another explanation could be that males present to their GP earlier, as reported by Teunissen et al, who found that men seek help for less severe UI complaints than women.9 Lastly, shop purchases were common in all three regions, whereas national supplier use was less common than pharmacy use in the north and more common in middle and southern regions. This may be due to differences in health insurance policy, which determines whether pharmacies and/or national suppliers are used by patients. However, we found no difference between the pharmacy and national supplier groups, indicating that respondents were equally satisfied with products from these groups.
Strengths and Limitations
Although UI is frequently studied, we are aware of no other research that has considered the effect of supply route on satisfaction with continence products. This approach increases the perspective of continence care to include both patients known to their GP and the large group of people who manage and treat UI themselves. A limitation of the study is that the satisfaction questionnaire was not validated. Another limitation is the unbalanced sample group, which was statistically corrected during analysis. There may also have been sampling bias given that the survey was distributed via social media and thereby excluding the majority of elderly patients, who represent the main users of absorbent products as UI is worsened by age. However, the high response rate should have ensured reliability.
Given that many respondents did not finish the survey, we decided to analyze and compare the partial and complete questionnaire responders. Complete responders were on average almost 3 years younger than partial responders, possibly because they were more willing to put in the effort and had better digital skills. Complete responders scored statistically significantly lower on social aspects of the ICIQ-PadPROM. We think this may be explained by them being more motivated to complete research in the hope of future benefit regarding their social burden. Apart from age and impact of continence products on social effects, the groups can be considered equal. Nevertheless, we must take care not to assume that complete responders represented all participants regarding the other outcomes.
Conclusion
In conclusion, our data indicate that individuals who purchase continence products from a shop, such as a supermarket or drug store, are less satisfied with their continence products and care than those who obtain supplies from a pharmacy or national supplier regardless the severity of UI. By contrast, there are no major differences between groups who obtain supplies from a pharmacy or national supplier. Given that this is the first study to have incorporated supply method as a factor in patient satisfaction with UI care and products, more research is needed to support our findings and identify reasons for lower satisfaction with over-the-counter products.
Acknowledgment
Dr Robert Sykes (www.doctored.org.uk) provided English and technical editing services for the final drafts of this manuscript.
Disclosure
The authors report no conflicts of interest in this work.
References
1. van der Vaart CH, de Leeuw JR, Roovers JP, Heintz AP. De invloed van urine-incontinentie op de kwaliteit van leven bij thuiswonende Nederlandse vrouwen van 45–70 jaar [The influence of urinary incontinence on quality of life of community-dwelling, 45–70 year old Dutch women]. Ned Tijdschr Geneeskd. 2000;144(19):894–897. Dutch.
2. Teunissen TA, van den Bosch WJ, van den Hoogen HJ, Lagro-Janssen AL. Prevalence of urinary, fecal and double incontinence in the elderly living at home. Int Urogynecol J Pelvic Floor Dysfunct. 2004;15(1):10–13. doi:10.1007/s00192-003-1106-8
3. Linde JM, Nijman RJM, Trzpis M, Broens PMA. Urinary incontinence in the Netherlands: prevalence and associated risk factors in adults. Neurourol Urodyn. 2017;36(6):1519–1528. doi:10.1002/nau.23121
4. NIVEL. Zorgregistraties eerste lijn (2018) [care registrations first line (2018)]; 2020. Available from: http://www.nivel.nl/NZR/zorgregistraties-eerstelijn.
5. Visser E, de Bock GH, Kollen BJ, Meijerink M, Berger MY, Dekker JH. Systematic screening for urinary incontinence in older women: who could benefit from it? Scand J Prim Health Care. 2012;30(1):21–28. doi:10.3109/02813432.2011.628244
6. Teunissen D, Van Weel C, Lagro-Janssen ALM. Urinary incontinence in older people living in the community: examining help-seeking behaviour. Br J Gen Pract. 2005;55:776–782.
7. Shaw C. A review of the psychosocial predictors of help-seeking behaviour and impact on quality of life in people with urinary incontinence. J Clin Nurs. 2001;10(1):15–24. doi:10.1046/j.1365-2702.2001.00443.x
8. Mendes A, Hoga L, Gonçalves B, Silva P, Pereira P. Adult women’s experiences of urinary incontinence: a systematic review of qualitative evidence. JBI Database System Rev Implement Rep. 2017;15(5):1350–1408. doi:10.11124/JBISRIR-2017-003389
9. Teunissen TA, Lagro-Janssen AL. Sex differences in the use of absorbent (incontinence) pads in independently living elderly people: do men receive less care? Int J Clin Pract. 2009;63(6):869–873. doi:10.1111/j.1742-1241.2008.01975.x
10. Santini S, Fabbietti P, Lamura G. The impact of the absorbent products distribution system on family caregivers of older people with incontinence in Italy: perception of the support received. BMC Geriatr. 2019;19(1):239. doi:10.1186/s12877-019-1254-4
11. Getliffe K, Fader M, Cottenden A, Jamieson K, Green N. Absorbent products for incontinence: ‘treatment effects’ and impact on quality of life. J Clin Nurs. 2007;16(10):1936–1945. doi:10.1111/j.1365-2702.2007.01812.x
12. Santini S, Andersson G, Lamura G. Impact of incontinence on the quality of life of caregivers of older persons with incontinence: a qualitative study in four European countries. Arch Gerontol Geriatr. 2016;63:92–101. doi:10.1016/j.archger.2015.10.013
13. Abrams P, Cardozo L, Wagg A, Wein A. Incontinence.
14. The International Consultation on Incontinence Questionnaire. International consultation on incontinence questionnaire-urinary incontinence short form; 2020. Available from: https://iciq.net/iciq-ui-sf.
15. The International Consultation on Incontinence Questionnaire. International consultation on incontinence questionnaire absorbent pads; 2020. Available from: https://iciq.net/iciq-padprom.
16. Yearwood Martin C, Murphy C, Cotterill N, Williams S, Cottenden A, Fader M. Development and psychometric evaluation of ICIQ-PadPROM: a quality of life questionnaire to assess the treatment effect of absorbent continence products. Neurourol Urodyn. 2018;37(5):1650–1657. doi:10.1002/nau.23389
17. International Consultation on Incontinence Questionnaire. International consultation on incontinence questionnaire lower urinary tract symptoms quality of life module; 2020. Available from: https://iciq.net/iciq-lutsqol.
18. Klovning A, Avery K, Sandvik H, Hunskaar S. Comparison of two questionnaires for assessing the severity of urinary incontinence: the ICIQ-UI SF versus the incontinence severity index. Neurourol Urodyn. 2009;28(5):411–415. doi:10.1002/nau.20674
19. Zorginstituut Nederland. Aantal gebruikers 2016–2020, hulpmiddelencategorie A05: incontinentiematerialen [Number of users 2016–2020 tool category A05: continence products]. GIPdatabank.nl. Dutch; 2020. Available from: https://www.gipdatabank.nl/databank?infotype=h&label=00-totaal&tabel_h_00-totaal=B_01-basis&geg=gebr&spec=&item=A05.
20. Sacco E, Bientinesi R, Gandi C, Palermo G, Pierconti F, Bassi P. Objectively improving appropriateness of absorbent products provision to patients with urinary incontinence: the DIAPPER study. Neurourol Urodyn. 2018;37(1):485–495. doi:10.1002/nau.23335
 © 2022 The Author(s). This work is published and licensed by Dove Medical Press Limited. The
full terms of this license are available at https://www.dovepress.com/terms
and incorporate the Creative Commons Attribution
- Non Commercial (unported, 3.0) License.
By accessing the work you hereby accept the Terms. Non-commercial uses of the work are permitted
without any further permission from Dove Medical Press Limited, provided the work is properly
attributed. For permission for commercial use of this work, please see paragraphs 4.2 and 5 of our Terms.
© 2022 The Author(s). This work is published and licensed by Dove Medical Press Limited. The
full terms of this license are available at https://www.dovepress.com/terms
and incorporate the Creative Commons Attribution
- Non Commercial (unported, 3.0) License.
By accessing the work you hereby accept the Terms. Non-commercial uses of the work are permitted
without any further permission from Dove Medical Press Limited, provided the work is properly
attributed. For permission for commercial use of this work, please see paragraphs 4.2 and 5 of our Terms.