")
Back to Journals » Diabetes, Metabolic Syndrome and Obesity » Volume 12
Association of salivary C-reactive protein with the obesity measures and markers in children
Authors Selvaraju V, Babu JR, Geetha T
Received 9 April 2019
Accepted for publication 15 June 2019
Published 23 July 2019 Volume 2019:12 Pages 1239—1247
DOI https://doi.org/10.2147/DMSO.S211624
Checked for plagiarism Yes
Review by Single anonymous peer review
Peer reviewer comments 2
Editor who approved publication: Professor Ming-Hui Zou
Vaithinathan Selvaraju,1 Jeganathan Ramesh Babu,1,2 Thangiah Geetha1,2
1Department of Nutrition, Dietetics, and Hospitality Management, Auburn University, Auburn, AL, USA; 2Boshell Metabolic Diseases and Diabetes Program, Auburn University, Auburn, AL, USA
Objective: Overweight and obesity is a pro-inflammatory state. This study aimed to examine the level of the salivary obesity markers in normal weight (NW) and overweight/obese (OW/OB) children, association with the obesity measures and the interrelations between the biomarkers.
Subjects and methods: Seventy-six children (40 normal weight and 36 overweight/obese) were recruited for this study. Body weight, height, and waist circumference measurement were obtained. The saliva sample was collected from all the participants. According to the Center for Disease Control and Prevention (CDC), the participants were classified into the normal weight or overweight/obese depending upon the body mass index (BMI) percentile ranking. The obesity panel of salivary markers resistin, C-C Motif Chemokine Ligand 2 (CCL2)/monocyte chemotactic protein-1 (MCP-1), tumor necrosis factor-alpha (TNF-α), interleukin-6 (IL-6), C-reactive protein (CRP), complement factor D, and interleukin-10 (IL-10) were determined using human magnetic Luminex performance assay. The receiver operating characteristics (ROC) analysis was used to determine the area under the curve (AUC) to identify the best salivary biomarker in children. Linear regression and Pearson’s correlation analyses to determine the association between the parameters.
Results: The obesity biomarkers resistin, MCP-1, TNF-α, IL-6 and CRP were significantly high in overweight/obese compared to normal weight. Salivary CRP (AUC: 0.866, 95% CI: 0.780–0.952; p<0.0001) showed superiority area under ROC curves with good discriminatory power than resistin, MCP-1, TNF-α, and IL-6. BMI z-score, WC z-score, and WHtR z-score showed a significant association (p<0.0001) with CRP. The CRP significantly (p<0.0001) correlated with resistin, CCL2/MCP-1, TNF-α, IL-6, and IL-10 by linear regression and Pearson’s correlation analysis.
Conclusion: Increased level of salivary CRP in children may be considered as a non-invasive marker for childhood obesity for detection of the risk factors for the development of metabolic dysregulation.
Keywords: childhood obesity, non-invasive, inflammation, body mass index
Introduction
Childhood obesity is one of the most serious public health challenges. Since 1970s, the childhood obesity has more than tripled in the United States.1 Every one in five school age children are obese.2 Alabama is the 6th highest ranked state with obesity, with more than 35% of the children being overweight and obese.3 The increasing prevalence of childhood obesity raises concern about the risk of developing metabolic dysregulation such as type 2 diabetes and cardiovascular diseases among obese children as they grow into adulthood. Early detection of the risk factors to develop the metabolic dysregulation in children is critical for effective interventions.
In this study, we are using a non-invasive, simple, harmless, and appropriate measure to analyze the obesity markers in children.4 Saliva sample used as a diagnostic fluid instead of blood as it is more economical and easier to handle for children.5 The saliva contains several biological markers as the circulating molecules are continuously secreted into the saliva.6 Various biomarkers present in the saliva can be determined using ELISA assays for diagnosis of various diseases in children and adults.7–9 The biomarkers focused in this study are adipokines markers resistin, monocyte chemotactic protein-1 (MCP-1); proinflammatory cytokines tumor necrosis factor-alpha (TNF-α), interleukin-6 (IL-6); inflammatory C-reactive protein (CRP); anti-inflammatory marker IL-10; and complement protein (Factor D/adipsin) in healthy and overweight/obese children. The adipokines are important determinants of metabolic syndrome and chronic inflammation associated with obesity.10 The macrophages in the adipocytes are of two types M1 (classically activated) and M2 (alternatively activated). The proinflammatory cytokines (TNF-α, IL-6) are secreted by M1 macrophages, and the receptor antagonists (IL-10 and IL-1) are secreted by M2 macrophages.10,11 Obesity and insulin resistance increase the numbers of M1 macrophages in adipose tissue and elevate the expression of cytokines.12 Resistin is a 12-kDa peptide that belongs to the family of “Resistin-like molecules” and is expressed by the macrophages.13 Resistin expression levels have found to correlate with inflammatory markers, insulin resistance, and type 2 diabetes.14–17 MCP-1 or chemokine (C-C motif) ligand 2 (CCL-2) is a chemoattractant secreted by adipocytes. Increased MCP-1 plasma levels have found to be associated with obesity.18,19 The complement factor D (Cfd)/adipsin is secreted by the adipose tissue and is involved in protection against infection. The expression of Cfd decreased in obese and diabetic mouse models.20–22 CRP is a sensitive marker of low-grade inflammation and is a risk factor for cardiovascular complications.23–25 The level of systemic CRP is higher in obese children is a risk factor to develop the metabolic syndrome in early life.26,27
There is limited research focusing on the association of obesity measures with the salivary obesity markers specifically in elementary school children. The aim of this study was to examine the level of the salivary obesity markers in normal weight (NW) and overweight/obese (OW/OB) children, association with the obesity measures, and the interrelations between the biomarkers.
Materials and methods
Study population
Seventy-six participants (40 NW and 36 OW/OB) aged between 6 and 10 years old were enrolled from Lee County and Macon County, Alabama. Approval was obtained for the study (protocol # 17-310 MR 1708) by the Auburn University Institute Review Board (IRB), and signed written consent form was collected from all parents and participants. Prior phone survey from the parents was obtained to ratify none of the children with a history of diabetes or cardiovascular disease in the current study.
Anthropometric measurements
Anthropometric measurements were collected from the participant as per the World Health Organization (WHO) recommendations. Body weight was evaluated to nearest 0.1 kg using Tanita digital Scale (WB-800H plus) without shoes and with light clothing,28 and height was measured with a stadiometer attached to the scale. In accordance with Centers for Diseases Control and Prevention (CDC) growth chart, BMI was calculated based on the body weight and height obtained. Participants were classified as underweight (<5th percentile), normal weight (≥5th to ≤85th percentile), overweight (>85th to ≤95th percentile), and obese (>95th percentile) based on their BMI values.29 SPSS macro (WHO growth reference 2007) was used to calculate BMI z-score by adjusting age and sex.30 The waist circumference (WC) was measured using flexible tape closest to 0.1 cm. WC and waist to height ratio (WHtR) z-scores were derived from waist circumference and height of the participants using R macro package.31
Measurement of salivary biomarkers by multiplex analysis
The participants were informed not to eat or drink 30 mins prior to saliva collection. Saliva samples were collected during screening of participants in the daytime between 2017 and 2018 throughout the year. The whole saliva samples were collected using saliva collection aid (SalivaBio LLC, PA, USA) in 2.0 mL vials and centrifuged to remove debris and other cells at 2,800 rpm at 4°C for 20 mins. Centrifuged salivary supernatant was transferred to a new cryovial and stored at −80°C until assayed. Measurement of obesity biomarkers was performed in saliva samples using Luminex magnetics multiplex assay kit. The panel used to evaluate obesity markers in saliva was human magnetic Luminex performance assay, Obesity Panel-7plex (catalog # LOBM000, R&D systems, MN, USA) for 7 analytes (CRP, IL-6, complement factor D, IL-10, MCP-1, resistin, and TNF-α). All magnetic luminex assays were performed as per the manufacturer protocols. Saliva samples were thawed at 4°C in an ice bucket overnight. Briefly, all reagents brought to room temperature before use. Wash buffer was prepared from 25X to 1X using double distilled water. Standard cocktail and samples were prepared in calibrator diluent RD5K. Series of standards were prepared as 3-fold dilution from the highest standard and samples are prepared 1:2 dilution.32 Magnetic beads, dilution of biotin-antibody, and streptavidin-PE were prepared as per the manufacturer protocol before use. For the assay, 96-well plate was pipetted with 50 µL of standards or samples as duplicate in each well followed by 50 µL of diluted microparticle cocktail. The plate was securely covered with foil plate sealer and incubated for 3 hrs at room temperature in a horizontal plate shaker with a speed of 800±50 rpm. Plates were washed with 1X wash buffer using Bio-Plex handheld magnetic washer three times and incubated with 50 µL biotin-antibody cocktail for 1 hr at room temperature in a plate shaker. Repeated the wash step three times and 50 µL diluted streptavidin-PE was added to each well. Plates were incubated at room temperature in the shaker for 30 mins. After streptavidin-PE incubation, plates were washed and microparticles complex were suspended in 100 µL of wash buffer and placed on a shaker for 2 mins. The plates were read within 90 mins using a Bio-Plex 3D analyzer and data were acquired with exponent software. Data were generated from the software by generating a five parametric logistic (5-PL) curve fit. Salivary protein estimation was performed using Pierce Rapid Gold BCA protein assay kit (Catalog # A53226, Thermo Fisher Scientific, MA, USA) as per the manufacturer instruction and normalized with the obesity markers.
Statistical analysis
The sample size was calculated with 80%> power with a Type 1 error probability of 0.05 to identify a logical difference in obesity markers and association analysis between NW and OW/OB groups using the free power and sample size calculation (PS) software v 3.1.6 and verified with the sample size requirement table.33 Two-group comparison was performed by GraphPad prism (5.0, GraphPad Software, CA, USA) for unpaired t-test. The results are expressed as mean±standard error in the text and in the box whisker graph median was shown. Distribution of obesity parameters highly skewed data were natural logarithm transformation was performed before statistical analysis to achieve normality using SPSS (version 24, IBM, Armonk, NY, USA). The Receiver Operating Characteristic (ROC) curve analysis was performed to determine the diagnostic accuracy of the different biomarkers of obesity. The area under the curve (AUC) was calculated, and it distinguishes participants with high and low biomarkers. The value of AUC ranges between 1 (perfect test) and 0 (worthless test). Pearson’s correlation and linear regression analysis were done between various parameters to determine the significantly affected biomarkers.
Results
The study participants anthropometric measurement of NW and OW/OB groups is provided in Table 1. A total of 76 participants were classified into 2 groups (NW and OW/OB). NW group contains 20 male/20 female (50% each) and OW group was 21 (58% male)/15 (42% female). There was no significant difference between two groups with age and height of the participants. Body mass index (BMI) z-score was significantly higher in OW/OB group (2.02±0.11; n=36) compared to NW (−0.04±0.13; n=40; p<0.0001) group. WC and its z-scores were significantly (p<0.0001) higher in children with OW/OB (71.19±1.44; 1.26±0.08) in comparison with NW (60.18±0.74; 0.15±0.08) group. Similarly, the WHtR z-score showed an increase in the OW/OB group (1.02±0.08; n=36) compared with NW group (−0.13±0.10; n=40; p<0.0001).
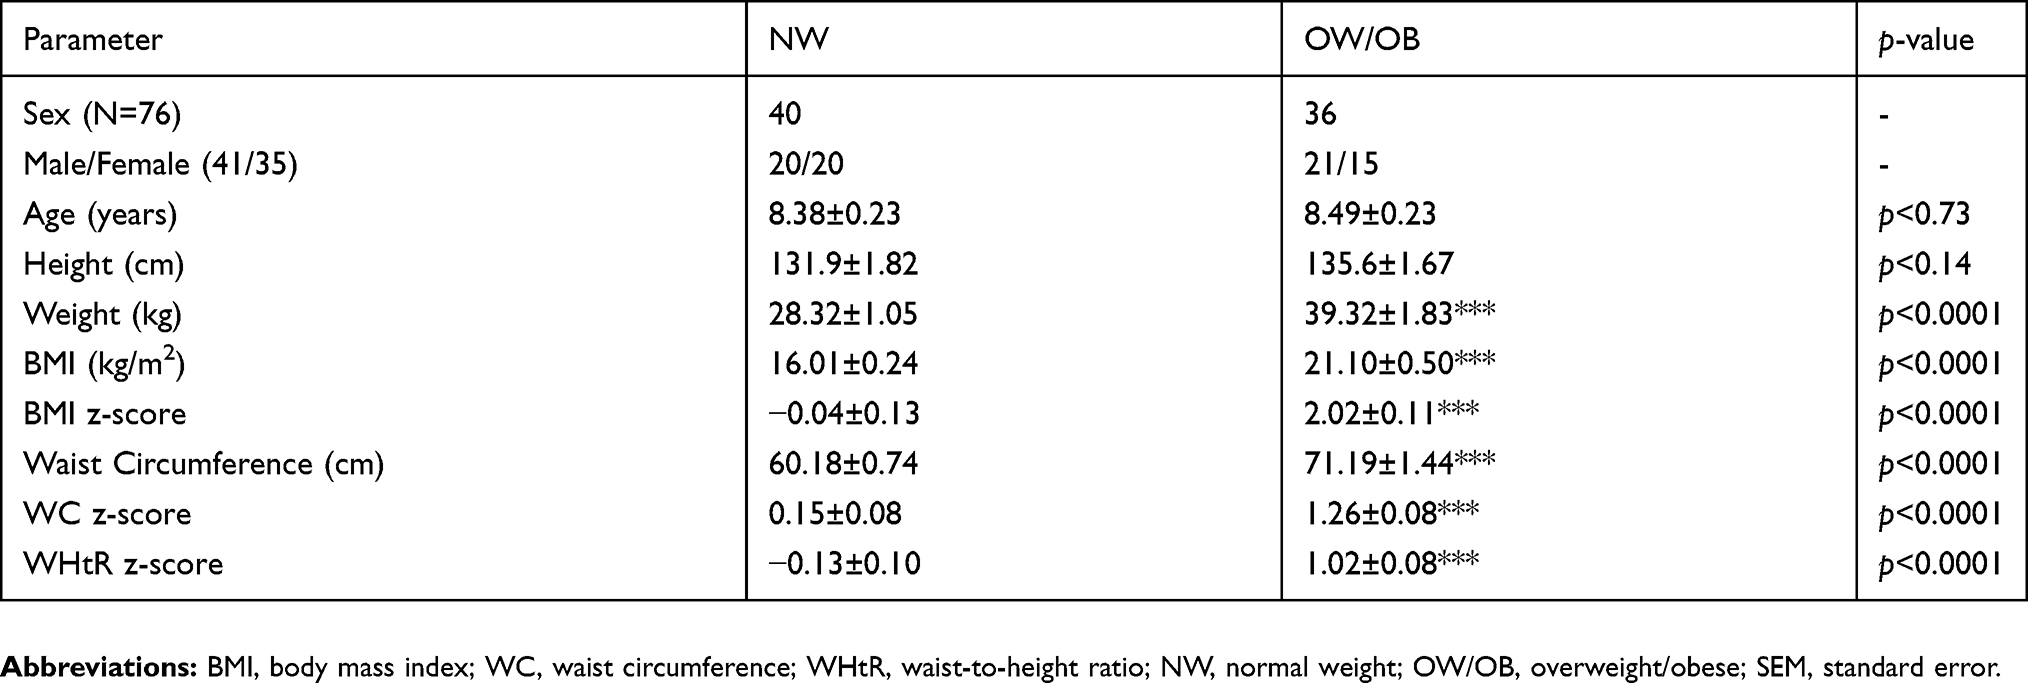 |
Table 1 Anthropometric measurements of study subjects |
The Magnetic Luminex performance assay results for the salivary obesity marker panels are given in Figure 1 as graphical representation. Seven probes were measured in saliva samples, and among these, CRP, resistin, MCP-1, TNFα, and IL-6 showed significant increase in the concentration of OW/OB groups compared with NW group. Salivary adipokine resistin (1,843.23 pg/mL vs 769.88 pg/mL) and MCP-1 (80.45 pg/mL vs 18.24 pg/mL) in OW/OB participants was 2.4- and 4.4-fold higher median than NW participants (Figure 1A and B). The variance between NW and OW/OB children was significant for resistin and MCP-1 at p<0.0001 level. The proinflammatory cytokines TNF-α (4.34 pg/mL vs 2.87 pg/mL) and IL-6 (24.05 pg/mL vs 7.06 pg/mL) was 1.5 and 3.4 times higher median and significantly (p<0.001) increased compared to NW (Figure 1C and D). The inflammatory biomarker CRP in the saliva of OW/OB (215.50 pg/mL) was almost 6-fold higher median and significantly (p<0.0001) greater than NW group (36.71 pg/mL) (Figure 1E). The anti-inflammatory marker IL-10 (1.64 pg/mL vs 12.47 pg/mL) and complement protein D/adipsin (3,634.89 pg/mL vs 5,767.14 pg/mL) were decreased 7.6- and 1.6-fold, respectively, in OW/OB subjects in comparison with NW subjects (Figure 1F and G). However, there was no significant difference between these two biomarkers concentration in saliva samples of NW and OW/OB participants. One to five samples from three of the seven analytes did not fall within the detectable standard range, and these reflects in the “n” numbers.
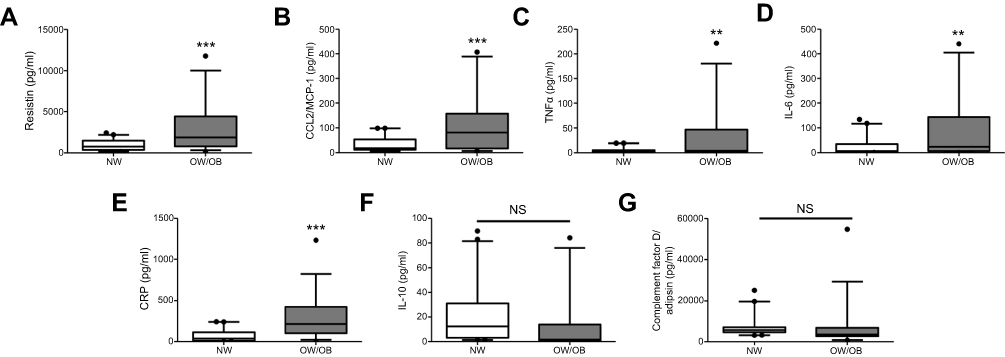 |
Figure 1 Salivary concentration of obesity markers in comparison with normal weight (NW) and overweight/obese (OW/OB) participants. Magnetic Luminex performance multiplex assay shows the expression of (A) resistin (n=40 and 36), (B) CCL2/MCP-1 (n=40 and 36), (C) TNF-α (n=40 and 36), (D) IL-6 (n=40 and 31), (E) CRP (n=40 and 35), (F) IL-10 (n=40 and 33), and (G) complement Factor D/adipsin (n=40 and 36). Data are expressed with Box-Whisker plots with median, first (25th percentile) and third (75th) quartile range with minimum and maximum of the blot. ***p<0.0001 vs NW; **p<0.001 vs NW.Abbreviation: NS, not significant. |
ROC with area under curve (AUC) was analyzed to resolve the predictive value of anthropometric measurements and assessment of salivary biomarkers that have a significant difference between OW/OB and NW group (Table 2 and Figure 2). The area under the ROC curves for the BMI z-score is (AUC: 0.992, 95% CI: 0.978–1.000; p<0.0001), WC z-score (AUC: 0.943, 95% CI: 0.886–1.000; p<0.0001) and WHtR z-score (AUC: 0.943, 95% CI: 0.891–0.994; p<0.0001). CRP (AUC: 0.866, 95% CI: 0.780–0.952; p<0.0001) showed superiority area under ROC curves with good discriminatory power among the other obesity biomarkers. However, the AUC values for other biomarkers MCP-1 (0.715), resistin (0.731), IL-6 (0.673), and TNF-α (0.694) were lower than 0.75 for predicting the suitable obesity marker in the participants salivary samples (Table 2 and Figure 2).
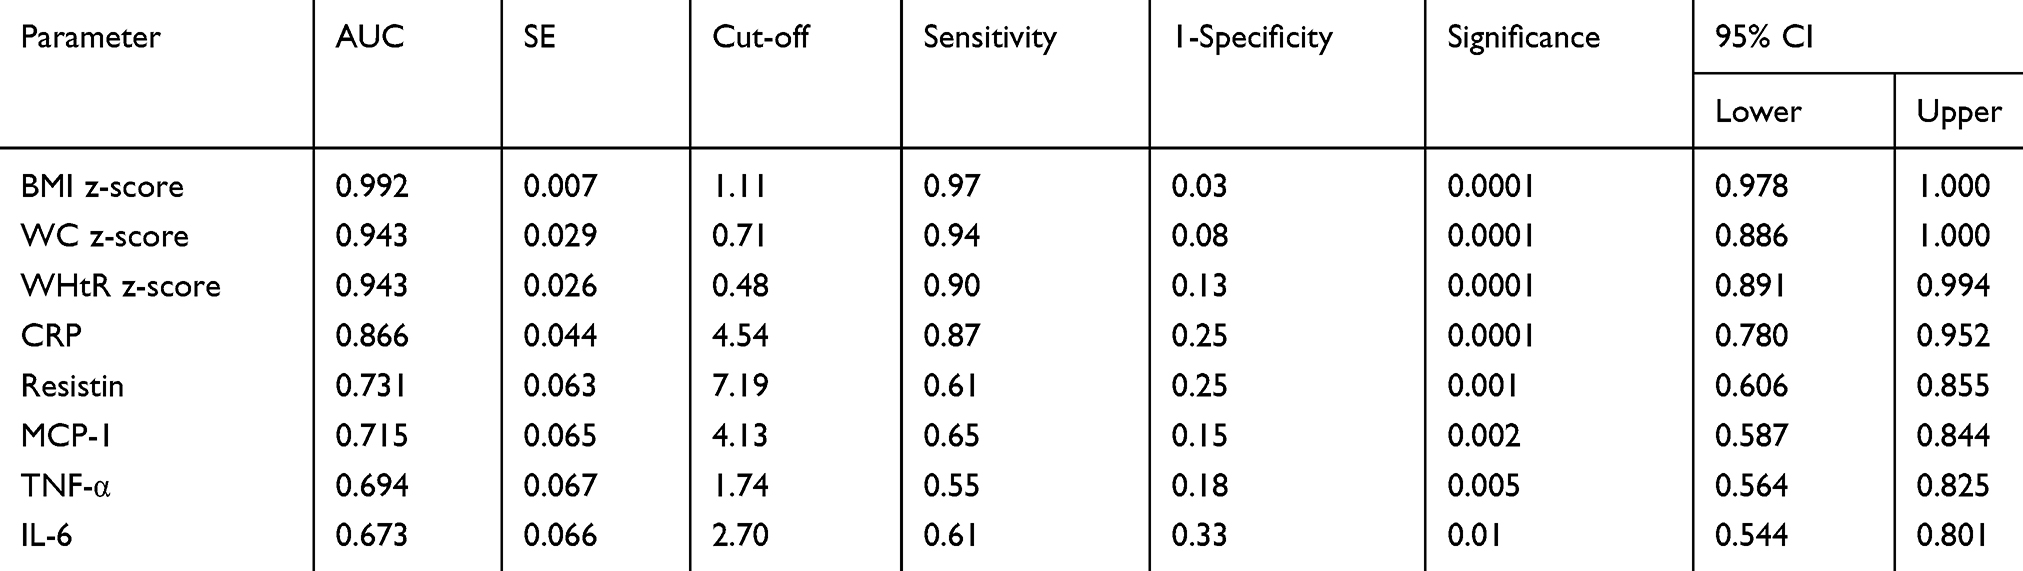 |
Table 2 Area under the curve derived by ROC curve analysis |
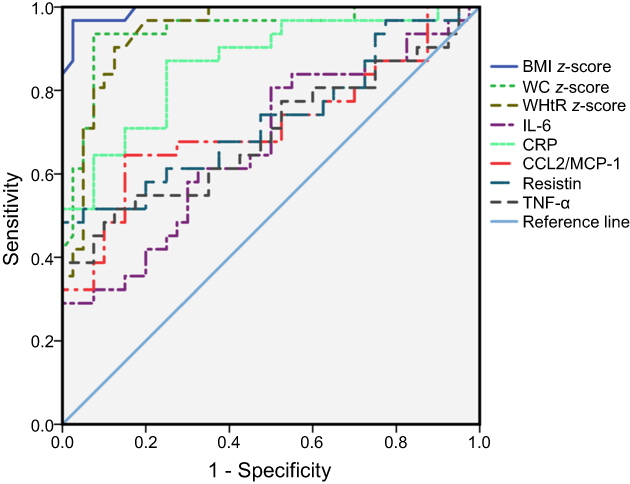 |
Figure 2 Receiver operating characteristic (ROC) curve analysis demonstrating the discriminative value of the participating children in anthropometric and obesity markers such as CRP, IL-6, CCL2/MCP-1, resistin, and TNF-α. Diagonal solid line represents the reference line.Abbreviations: BMI, body mass index; WC, waist circumference; WHtR, waist-to-height ratio; CRP, C-reactive protein; MCP-1, monocyte chemoattractant protein 1; TNF-α, tumor necrosis factor – α; IL-6, interleukin-6. |
Since the area under ROC was greater than 0.75 for CRP and it represents as a good diagnostic value of a biomarker,34 we further analyzed the association of CRP with the anthropometric measurements. A positive correlation of the log-transformed CRP with BMI z-score, WC z-score, and WHtR z-score was observed in the scatterplot as shown in Figure 3. All the three obesity measures such as BMI z-score, WC z-score, and WHtR z-score showed a significant association (p<0.0001) with CRP concentration along with Pearson correlation values of r=0.573, r=0.542, and r=0.525, respectively (Table 3).
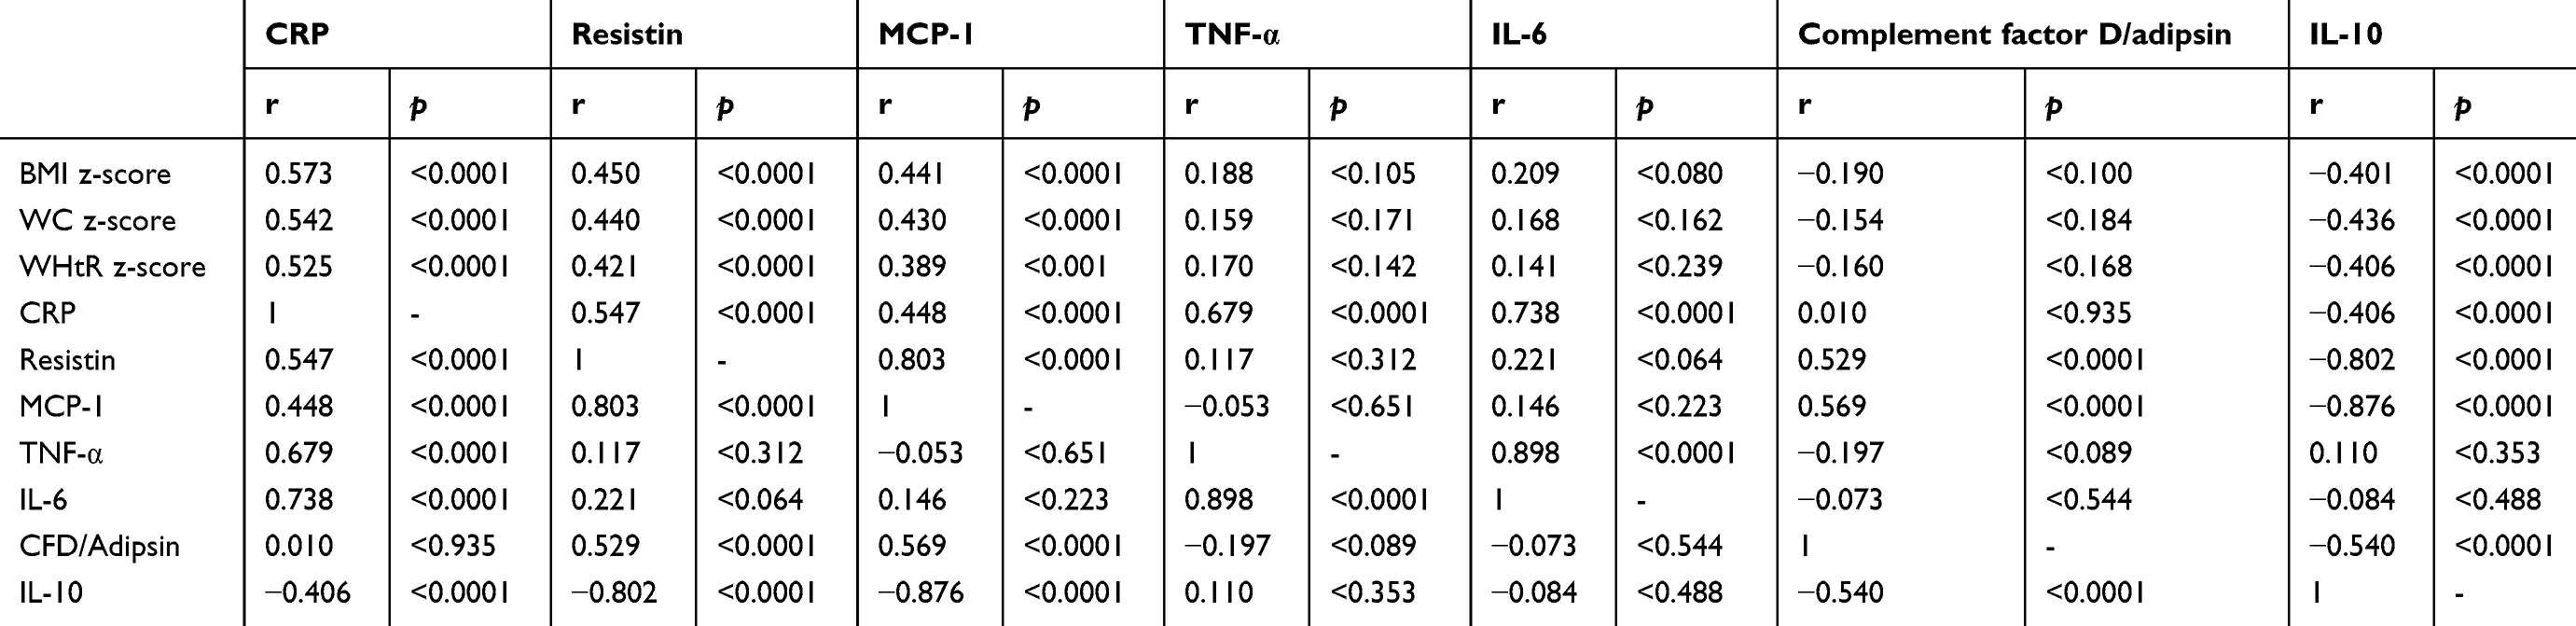 |
Table 3 Pairwise Pearson Correlation between salivary obesity biomarkers and anthropometric parameters |
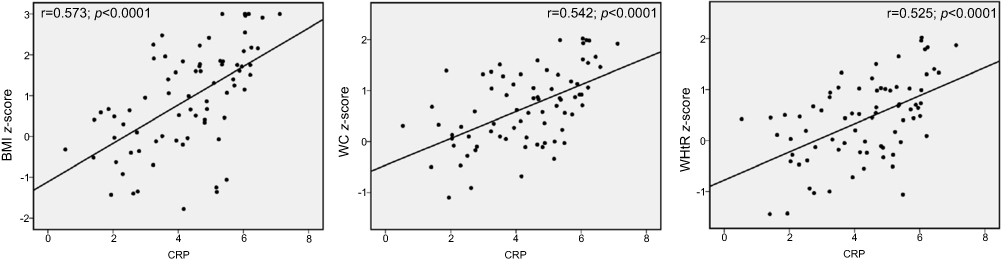 |
Figure 3 Result of linear regression analysis and Pearson correlation analysis between natural log-transformed CRP data and BMI z-score, WC z-score and WHtR z-score. Scatter plot represented with the p-value of 0.0001 for Pearson correlation coefficients.Abbreviations: BMI, body mass index; WC, waist circumference; WHtR, waist-to-height ratio; CRP, C-reactive protein. |
In addition to the anthropometric measurements, CRP showed significant association with resistin, MCP-1, TNF-α, IL-6, and IL-10 except complementary factor D by linear regression and Pearson’s correlation analysis as shown in Figure 4 and Table 3. A positive correlation of CRP was observed with resistin (r=0.547; p<0.0001), MCP-1 (r=0.448; p<0.0001), TNF-α (r=0.679; p<0.0001), and IL-6 (r=0.738; p<0.0001). The CRP was inversely correlated with anti-inflammatory cytokine IL-10 with an r-value of 0.406; p<0.0001.
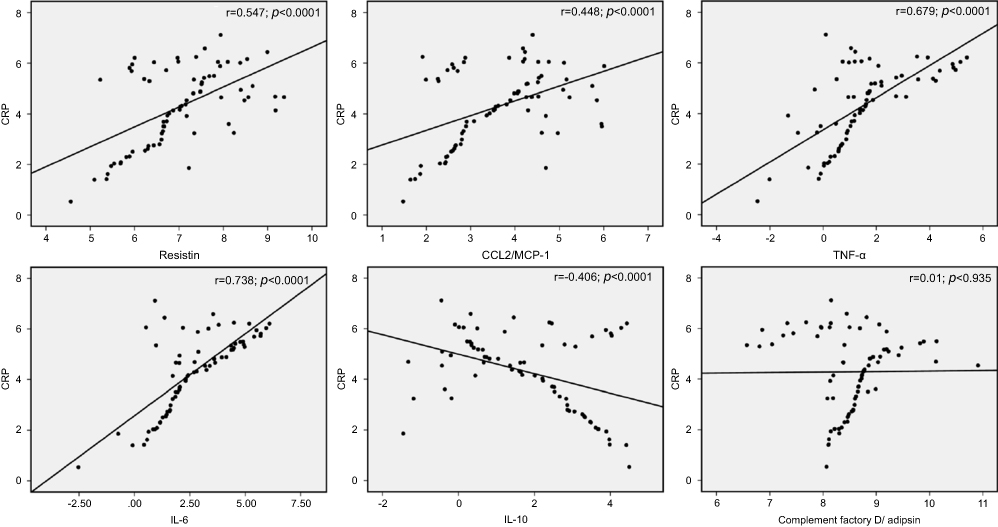 |
Figure 4 Evaluation of the correlation of natural log-transformed CRP with other obesity biomarkers. Scatter plot shows the correlation coefficient values with of CRP with resistin, CCL2/MCP-1, TNF-α, IL-6, IL-10, and complement factor D/adipsin.Abbreviation: CRP, C-reactive protein. |
Discussion
This study aimed to determine a non-invasive marker of obesity for early detection of the risk factors to develop the metabolic dysregulation in children. The findings of this study suggest that the salivary levels of CRP, resistin, MCP-1, TNF-α, and IL-6 were significantly increased in overweight/obese children compared to normal weight. This indicates that obesity increases the risk factors of developing metabolic syndrome such as type 2 diabetes and cardiovascular diseases in early stages of life as shown in other studies. In this study, we also analyzed the area under the ROC curve for all the obesity measures and the significantly increased biomarkers in OW/OB group to confirm the probability of the biomarker. According to the statistical analysis, when the AUC is greater than 0.90, the biomarkers are considered as excellent diagnostic value, 0.75–0.90 as good diagnostic value, 0.50–0.75 as poor value, and less than 0.50 as no diagnostic value.34 The AUC for all the obesity measures (BMI z-score, WC z-score, and WHtR z-score) was greater than 0.90 and with more than 0.90 sensitivity and 1-specificity lower than 0.13. All the anthropometric measurements are considered as excellent diagnostic value and used to determine obesity. The AUC for CRP found to be 0.866, cut-off of 4.54 with the sensitivity of 0.87 and 1-specificity of 0.25. Based upon the values, salivary CRP was considered as good diagnostic value and used as a biomarker. The AUC for all the other salivary biomarkers resistin, MCP-1, IL-6, and TNF-α were less than 0.75 and considered as poor diagnostic value for a biomarker.
A significant and positive correlation was determined between salivary CRP and all the obesity measures by linear regression and Pearson correlation analyses and suggests a link between inflammation and childhood obesity. Association between obesity and inflammation in children is reported in several studies.35,36 Elevated CRP is correlated with the risk of developing diabetes mellitus, a major factor for cardiovascular complications.37 Increased levels of systemic CRP are associated with features of the metabolic syndrome.38–40
This study demonstrates that obese children are associated with a chronic low-grade inflammation and can be determined by an increase in the level of biomarkers in saliva sample. In particular, the CRP level is significantly higher in obese children, and with greater AUC compared to other biomarkers in saliva. All the obesity measures and cytokines such as resistin, MCP-1, TNF-α, IL-6, and anti-inflammatory IL-10 correlate significantly with salivary CRP. Resistin levels in plasma are shown to be elevated with increased metabolic syndrome and cardiovascular risk.41–44 Elevated MCP-1 levels are associated with obesity and are reduced by weight loss in obese participants with metabolic syndrome.45,46 IL-6 and TNF-α are significantly increased in patients with metabolic syndrome.47–49 Previous study showed that the circulating anti-inflammatory cytokine IL-10 concentration is lower in obese children, negatively correlated with percentage of body fat, and can serve as a marker for metabolic risk in children.50 In this study, CRP correlates independently with the cytokines that are known to be associated with metabolic syndrome. Hence, salivary CRP may be used as a marker to determine the risk factors of metabolic syndrome.
The limitation of this study is the small number of participants, and this needs to be confirmed with a larger cohort study. However, the advantage is using non-invasive sample for children and the results not affected by factors such as smoking, alcohol consumption, or other chronic conditions as in adults. The data revealed correlation of salivary CRP with obesity measures, and markers demonstrate it as a non-invasive marker of childhood obesity for early detection of the risk factors to develop the metabolic dysregulation.
Conclusion
Salivary CRP was significantly increased in overweight/obese children compared to normal weight. The area under the ROC curves for the CRP represents it as a good diagnostic value of a biomarker than resistin, MCP-1, TNF-α, and IL-6. CRP also significantly correlated with obesity measures (BMI z-score, WC z-score, and WHtR z-score) and markers such as resistin, MCP-1, TNF-α, IL-6, and IL-10. Based upon the results, increased level of salivary CRP in children may be considered as non-invasive marker for childhood obesity for detection of the risk factors for the development of metabolic dysregulation.
Acknowledgments
We would like to thank all the children for their participation and Dr Cinzia Mastrorilli, Discipline Chair for Microbiology and Immunology, Edward Via College of Osteopathic Medicine, Auburn Campus for helping us with the use of Bio-Plex 3D analyzer. This work was supported by the Women’s Philanthropy Board Impact grant and Alabama Agriculture Experimental Station (AAES) Hatch Funding Program to TG.
Disclosure
The authors report no conflicts of interest in this work.
References
1. Fryar CD, Carroll MD, Ogden CL. Prevalence of overweight and obesity among children and adolescents: United States, 1963–1965 through 2011–2012. Health E-Stats. 2017. Available from: https://www.cdc.gov/nchs/data/hestat/obesity_child_11_12/obesity_child_11_12.htm. Accessed April 05, 2019.
2. Hales CM, Carroll MD, Fryar CD, et al. Prevalence of Obesity Among Adults and Youth: United States, 2015–2016. NCHS Data Brief. 2017. Available from: https://www.cdc.gov/nchs/products/databriefs/db288.htm. Accessed April 05, 2019.
3. CDC. Centers for Disease Control and Prevention. Obesity Prevalence USA: Division of Nutrition, Physical Activity, and Obesity, National Center for Chronic Disease Prevention and Health Promotion. 2016. Available from: https://www.cdc.gov/obesity/data/prevalence-maps.html. Accessed April 05, 2019.
4. Christodoulides N, Mohanty S, Miller CS, et al. Application of microchip assay system for the measurement of C-reactive protein in human saliva. Lab Chip. 2005;5:261–269. doi:10.1039/b414194f
5. Malamud D. Saliva as a diagnostic fluid. Dent Clin North Am. 2011;55:159–178. doi:10.1016/j.cden.2010.08.004
6. Lac G. Saliva assays in clinical and research biology. Pathol Biol (Paris). 2001;49:660–667.
7. Attlee A, Hasan H, AlQattan A, et al. Relationship of salivary adipocytokines, diet quality, physical activity, and nutrition status in adult Emirati females in United Arab Emirates. Diabetes Metab Syndr. 2019;13:40–46. doi:10.1016/j.dsx.2018.08.006
8. Janem WF, Scannapieco FA, Sabharwal A, et al. Salivary inflammatory markers and microbiome in normoglycemic lean and obese children compared to obese children with type 2 diabetes. PLoS One. 2017;12:e0172647. doi:10.1371/journal.pone.0172647
9. Pirsean C, Negut C, Stefan-van Staden RI, et al. The salivary levels of leptin and interleukin-6 as potential inflammatory markers in children obesity. PLoS One. 2019;14:e0210288. doi:10.1371/journal.pone.0210288
10. Cao H. Adipocytokines in obesity and metabolic disease. J Endocrinol. 2014;220:T47–59. doi:10.1530/JOE-13-0339
11. Gordon S. Alternative activation of macrophages. Nat Rev Immunol. 2003;3:23–35. doi:10.1038/nri978
12. Lumeng CN, Bodzin JL, Saltiel AR. Obesity induces a phenotypic switch in adipose tissue macrophage polarization. J Clin Invest. 2007;117:175–184. doi:10.1172/JCI29881
13. Curat CA, Wegner V, Sengenes C, et al. Macrophages in human visceral adipose tissue: increased accumulation in obesity and a source of resistin and visfatin. Diabetologia. 2006;49:744–747. doi:10.1007/s00125-006-0173-z
14. Burnett MS, Devaney JM, Adenika RJ, Lindsay R, Howard BV. Cross-sectional associations of resistin, coronary heart disease, and insulin resistance. J Clin Endocrinol Metab. 2006;91:64–68. doi:10.1210/jc.2005-1653
15. Chen BH, Song Y, Ding EL, et al. Circulating levels of resistin and risk of type 2 diabetes in men and women: results from two prospective cohorts. Diabetes Care. 2009;32:329–334. doi:10.2337/dc08-1625
16. Heidemann C, Sun Q, van Dam RM, et al. Total and high-molecular-weight adiponectin and resistin in relation to the risk for type 2 diabetes in women. Ann Intern Med. 2008;149:307–316.
17. Reilly MP, Lehrke M, Wolfe ML, Rohatgi A, Lazar MA, Rader DJ. Resistin is an inflammatory marker of atherosclerosis in humans. Circulation. 2005;111:932–939. doi:10.1161/01.CIR.0000155620.10387.43
18. Di Gregorio GB, Yao-Borengasser A, Rasouli N, et al. Expression of CD68 and macrophage chemoattractant protein-1 genes in human adipose and muscle tissues: association with cytokine expression, insulin resistance, and reduction by pioglitazone. Diabetes. 2005;54:2305–2313. doi:10.2337/diabetes.54.8.2305
19. Sartipy P, Loskutoff DJ. Monocyte chemoattractant protein 1 in obesity and insulin resistance. Proc Natl Acad Sci U S A. 2003;100:7265–7270. doi:10.1073/pnas.1133870100
20. Flier JS, Cook KS, Usher P, Spiegelman BM. Severely impaired adipsin expression in genetic and acquired obesity. Science. 1987;237:405–408.
21. Lowell BB, Napolitano A, Usher P, et al. Reduced adipsin expression in murine obesity: effect of age and treatment with the sympathomimetic-thermogenic drug mixture ephedrine and caffeine. Endocrinology. 1990;126:1514–1520. doi:10.1210/endo-126-3-1514
22. Rosen BS, Cook KS, Yaglom J, et al. Adipsin and complement factor D activity: an immune-related defect in obesity. Science. 1989;244:1483–1487.
23. Fortmann Stephen P, Ford E, Criqui Michael H, et al. CDC/AHA workshop on markers of inflammation and cardiovascular disease. Circulation. 2004;110:e554–e559.
24. Hubacek JA, Peasey A, Pikhart H, et al. APOE polymorphism and its effect on plasma C-reactive protein levels in a large general population sample. Hum Immunol. 2010;71:304–308. doi:10.1016/j.humimm.2010.01.008
25. Mathur N, Pedersen BK. Exercise as a mean to control low-grade systemic inflammation. Mediators Inflamm. 2008;2008:109502. doi:10.1155/2008/109502
26. Parrett AL, Valentine RJ, Arngrimsson SA, Castelli DM, Evans EM. Adiposity, activity, fitness, and C-reactive protein in children. Med Sci Sports Exerc. 2010;42:1981–1986. doi:10.1249/MSS.0b013e3181e0355e
27. Siegrist M, Hanssen H, Lammel C, Haller B, Halle M. A cluster randomised school-based lifestyle intervention programme for the prevention of childhood obesity and related early cardiovascular disease (JuvenTUM 3). BMC Public Health. 2011;11:258. doi:10.1186/1471-2458-11-258
28. NICHD. NICHD Study of Early Child Care and Youth Development. Overview of Health and Physical Development Assessment (HPDA) Visit, Operations Manual–Phase IV, Chapter 85.1. Research Triangle Park (NC): RTI International; 2006.
29. Kuczmarski RJ, Ogden CL, Guo SS, et al. 2000 CDC Growth Charts for the United States: methods and development. Vital Health Stat. 2002;11:1–190.
30. Butte NF, Garza C, de Onis M. Evaluation of the feasibility of international growth standards for school-aged children and adolescents. J Nutr. 2007;137:153–157. doi:10.1093/jn/137.1.153
31. Sharma AK, Metzger DL, Daymont C, Hadjiyannakis S, Rodd CJ. LMS tables for waist-circumference and waist-height ratio Z-scores in children aged 5-19 y in NHANES III: association with cardio-metabolic risks. Pediatr Res. 2015;78:723–729. doi:10.1038/pr.2015.160
32. Goodson JM, Kantarci A, Hartman ML, et al. Metabolic disease risk in children by salivary biomarker analysis. PLoS One. 2014;9:e98799. doi:10.1371/journal.pone.0098799
33. Browner WS, Newman TB, Hulley SB. Estimating sample size and power: applications and examples. In: Stephen BH, Steven RC, Warren SB, Deborah G, Thomas BN, editors. Designing Clinical Research.
34. Ray P, Le Manach Y, Riou B, Houle TT. Statistical evaluation of a biomarker. Anesthesiology. 2010;112:1023–1040. doi:10.1097/ALN.0b013e3181d47604
35. Dedoussis GVZ, Kapiri A, Samara A, et al. Expression of inflammatory molecules and associations with BMI in children. Eur J Clin Invest. 2010;40:388–392. doi:10.1111/j.1365-2362.2010.02277.x
36. Siervo M, Ruggiero D, Sorice R, et al. Body mass index is directly associated with biomarkers of angiogenesis and inflammation in children and adolescents. Nutrition. 2012;28:262–266. doi:10.1016/j.nut.2011.06.007
37. Mazidi M, Karimi E, Rezaie P, Ferns GA. Treatment with GLP1 receptor agonists reduce serum CRP concentrations in patients with type 2 diabetes mellitus: A systematic review and meta-analysis of randomized controlled trials. J Diabetes Complications. 2017;31:1237–1242. doi:10.1016/j.jdiacomp.2016.05.022
38. Devaraj S, Singh U, Jialal I. Human C-reactive protein and the metabolic syndrome. Curr Opin Lipidol. 2009;20:182–189. doi:10.1097/MOL.0b013e32832ac03e
39. Zaki ME, El-Bassyouni HT, El-Gammal M, Kamal S. Indicators of the metabolic syndrome in obese adolescents. Arch Med Sci. 2015;11:92–98. doi:10.5114/aoms.2015.49214
40. Mazidi M, Rezaie P, Ferns GA, Vatanparast H. Impact of probiotic administration on serum C-reactive protein concentrations: systematic review and meta-analysis of randomized control trials. Nutrients. 2017;9:20. doi:10.3390/nu9010020
41. Liu GL, Fu XH, Jiang LH, Ma X-C, Yang J-Y. [Serum resistin concentration and insulin resistance in obese children]. Zhonghua Er Ke Za Zhi. 2006;44:114–117.
42. Norata GD, Ongari M, Garlaschelli K, Raselli S, Grigore L, Catapano AL. Plasma resistin levels correlate with determinants of the metabolic syndrome. Eur J Endocrinol. 2007;156:279–284. doi:10.1530/eje.1.02338
43. Osawa H, Ochi M, Tabara Y, et al. Serum resistin is positively correlated with the accumulation of metabolic syndrome factors in type 2 diabetes. Clin Endocrinol (Oxf). 2008;69:74–80. doi:10.1111/j.1365-2265.2007.03154.x
44. Singh AK, Tiwari S, Gupta A, Natu SM, Mittal B, Pant AB. Association of resistin with metabolic syndrome in Indian subjects. Metab Syndr Relat Disord. 2012;10:286–291. doi:10.1089/met.2011.0128
45. Christiansen T, Richelsen B, Bruun JM. Monocyte chemoattractant protein-1 is produced in isolated adipocytes, associated with adiposity and reduced after weight loss in morbid obese subjects. Int J Obes (Lond). 2005;29:146–150. doi:10.1038/sj.ijo.0802839
46. Fu CP, Sheu WH, Lee IT, et al. Weight loss reduces serum monocyte chemoattractant protein-1 concentrations in association with improvements in renal injury in obese men with metabolic syndrome. Clin Chem Lab Med. 2015;53:623–629. doi:10.1515/cclm-2014-0468
47. Mohammadi M, Gozashti MH, Aghadavood M, et al. Clinical significance of Serum IL-6 and TNF-alpha levels in patients with metabolic syndrome. Rep Biochem Mol Biol. 2017;6:74–79.
48. Moon YS, Kim DH, Song DK. Serum tumor necrosis factor-alpha levels and components of the metabolic syndrome in obese adolescents. Metabolism. 2004;53:863–867.
49. Sarbijani HM, Khoshnia M, Marjani A. The association between Metabolic Syndrome and serum levels of lipid peroxidation and interleukin-6 in Gorgan. Diabetes Metab Syndr. 2016;10:S86–89. doi:10.1016/j.dsx.2015.09.024
50. Chang JS, Bai CH, Huang ZC, et al. Interleukin 10 and clustering of metabolic syndrome components in pediatrics. Eur J Clin Invest. 2014;44:384–394. doi:10.1111/eci.12247
 © 2019 The Author(s). This work is published and licensed by Dove Medical Press Limited. The full terms of this license are available at https://www.dovepress.com/terms.php and incorporate the Creative Commons Attribution - Non Commercial (unported, v3.0) License.
By accessing the work you hereby accept the Terms. Non-commercial uses of the work are permitted without any further permission from Dove Medical Press Limited, provided the work is properly attributed. For permission for commercial use of this work, please see paragraphs 4.2 and 5 of our Terms.
© 2019 The Author(s). This work is published and licensed by Dove Medical Press Limited. The full terms of this license are available at https://www.dovepress.com/terms.php and incorporate the Creative Commons Attribution - Non Commercial (unported, v3.0) License.
By accessing the work you hereby accept the Terms. Non-commercial uses of the work are permitted without any further permission from Dove Medical Press Limited, provided the work is properly attributed. For permission for commercial use of this work, please see paragraphs 4.2 and 5 of our Terms.