")
Back to Journals » International Journal of General Medicine » Volume 15
Association of Placental Parameters with Low Birth Weight Among Neonates Born in the Public Hospitals of Hadiya Zone, Southern Ethiopia: An Institution-Based Cross-Sectional Study
Received 20 December 2021
Accepted for publication 7 May 2022
Published 16 May 2022 Volume 2022:15 Pages 5005—5014
DOI https://doi.org/10.2147/IJGM.S354909
Checked for plagiarism Yes
Review by Single anonymous peer review
Peer reviewer comments 2
Editor who approved publication: Dr Scott Fraser
Simeon Meskele Leyto,1 Kusse Urmale Mare2
1Department of Anatomy, College of Medicine and Health Sciences, Arba Minch University, Arba Minch, Ethiopia; 2Department of Nursing, College of Medicine and Health Sciences, Samara University, Samara, Ethiopia
Correspondence: Simeon Meskele Leyto, Department of Anatomy, College of Medicine and Health Sciences, Arba Minch University, Post Box No: 21, Arba Minch, Ethiopia, Tel +251916127305, Fax +2510468810279, Email [email protected]
Introduction: Placenta indices are the significant determinants of perinatal outcome and neonatal mortality. A clinician can predict neonatal status based on the findings from the placental indices. However, there are limited studies on the relationship between placental parameters and neonatal birth weight in Ethiopia. Hence, this study aimed to assess placental parameters and their association with birth weight among neonates born at public hospitals in southern Ethiopia.
Methods: A facility-based cross-sectional study was conducted on 249 systematically selected placentae with the attached umbilical cord from normal singleton live birth with known gestational age. A weighing scale, long needle, and standard non-elastic tape were used to measure placental parameters. Maternal and neonatal characteristics were obtained from the medical charts. Bivariable and multivariable logistic regressions analyses were done to assess the association between placental indices with neonatal birth weight. Finally, an adjusted odds ratio with the corresponding 95% CI was used to declare the statistical significance.
Results: In this study, the mean placental weight, diameter, and thickness were 475.9gm, 17.73cm, and 4.43cm, respectively, and the prevalence of low birth weight was 10% (95% CI: 6– 14%). Low placental weight (AOR: 6.57; 95% CI: 2.47– 17.48), low placental thickness (AOR: 4.94; 95% CI: 1.42– 17.22), and gestational age (AOR: 4.73; 95% CI: 1.49– 14.99) were associated with low birth weight.
Conclusion: This study revealed that placental parameters, particularly weight and thickness, and gestational age have a significant influence on low birth weight. Therefore, proper examination of the placenta should be performed routinely following delivery for better newborn care.
Keywords: birth weight, Ethiopia, parameter, placenta
Introduction
Mother and fetus are the two important ends of reproduction and come in close contact with each other by a vital organ known as the placenta.1 Because of its delicate and important nature, the placenta is the mirror of the perinatal period and functions in maintaining pregnancy and promoting normal fetal development.2,3
Its dimensions at term are approximately circular or oval, with an average weight of 500 g (range 200–800 g), a diameter of 185 mm (range 150–200 mm), and a thickness of 23 mm.1,4 According to a study conducted in Argentina, the corresponding figures were 432 g (range 110–838) for placental weight, 166 mm (50–290) for larger diameter, and 30 mm (10–70) for thickness.5
Placental weight is the most common way to characterize its growth and it approximately weighs one-sixth of the fetal weight.6,7 Placental weight was reported to have a strong correlation with birth weight6,8 and its weight becomes more prominent in babies with congenital abnormalities.3 Besides, abnormally decreased placental weight was linked with increased perinatal complications like intrauterine fetal demise and growth restriction,8 low Apgar score, respiratory distress, and perinatal death.4,9
The placenta plays an important role in the regulation of healthy fetal growth and development during intrauterine life and its parameters strongly predict low birth weight (LBW), a significant risk factor for adverse neonatal outcomes.10 LBW is defined as a birth weight of an infant less than 2500 grams that can result from fetal growth restriction and/or preterm birth.11 In addition, preterm birth (birth before 37 completed weeks of gestation) that contributes to the occurrence of LBW, accounts for 9.6% of births worldwide, generally higher in developing countries.12 The most significant contributor to preterm birth is intrauterine infection including chorioamnionitis, which is involved in up to 40% of preterm births.13 According to a recent estimate, globally about 25 million births had LBW each year.7 In sub-Saharan countries, LBW continues to remain a major public health problem affecting 3.1 million newborns.14
A scoping review in Africa (1975–2016) showed that the prevalence of FGR varied between 2.6 and 59.2% and the median prevalence in the eastern Africa region was 15.8% (8–23.5%).15 Studies in Ethiopia showed that the prevalence of LBW was 17.9% in Southwest,14 17.4% in Gondar,15 and 9.9% in Northern Ethiopia.16 It was revealed that LBW was associated with different maternal socio-demographic and obstetric, and neonatal characteristics.17–20
Evidence revealed the importance of the placenta indices in providing information about fetal wellbeing and predicting pregnancy outcomes. Studies conducted previously related placental indices with maternal diseases like gestational diabetes, pregnancy-induced hypertension, and anemia.1,21,22 In addition, one study conducted in Ethiopia assessed the relationship between placental indices and fetal distress but did not examine the association of placental parameters with birth weight.23 Moreover, evidence on the placental indices and their association with adverse neonatal outcomes in Ethiopia is limited. Therefore, this study aimed to assess placental parameters and their association with the low birth weight among neonates born in public hospitals in Southern Ethiopia.
Materials and Methods
Study Area
This study was conducted in the public hospitals of Hadiya zone, southern Ethiopia. Hadiya zone is one of the 14 zones in Southern Ethiopia. It is situated over a total area of 3850.2 square kilometers and is administratively divided into ten districts. It has an estimated total population of 1.6 million, of which 817,267 were males and 826,201 were females. In this zone, there are three public hospitals.
Study Design and Period
An institution-based cross-sectional study design was conducted among randomly selected mother-neonate pairs and placentae of neonates delivered in the public hospitals of Hadiya zone, southern Ethiopia from 01 September to 30 November 2018.
Source and Study Population
All mother-neonate pairs and placentae of neonates delivered in the public hospitals of the Hadiya zone during the study period were the source population. On the other hand, systematically selected mother-neonate pairs and placentae of neonates delivered in the public hospitals of the Hadiya zone were the study population.
Exclusion Criteria
The placentae from multiple live births and of the unknown gestational age and mothers-neonate pair whose birth took place at home but transferred to the obstetric units of the selected hospitals for emergency treatment were excluded from the study.
Sample Size Determination
Single population proportion formula was used to determine the sample size by considering the following assumptions; 95% confidence level, z α/2=critical value for normal distribution at 95% confidence level (1.96), 50% expected prevalence of low birth weight (p=0.5) since there is no prior study regarding placental indices and their association with low birth weight in Ethiopia, 5% margin of error (d=0.05), and 10% non-response rate.
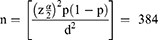
However, since the source population in the three public hospitals (593) was less than 10,000, the correction formula was used to determine the final sample size. After considering a non-response rate of 10%, the final sample size for this was 256 mother-neonate pairs and their placentae.
Sampling Procedures
In this study, all the three public hospitals in the Hadiya zone were included. Before the data collection, an average number of monthly deliveries was estimated for each hospital by using the number of deliveries in the previous three months. Then, the sample size was proportionally allocated for each hospital based on the estimated number of deliveries per month and the sampling interval (k=2) was calculated for each hospital based on the allocated sample size and the number of deliveries. Finally, a systematic random sampling technique was used to select mothers admitted to the delivery unit and their neonates and placentae (Figure 1).
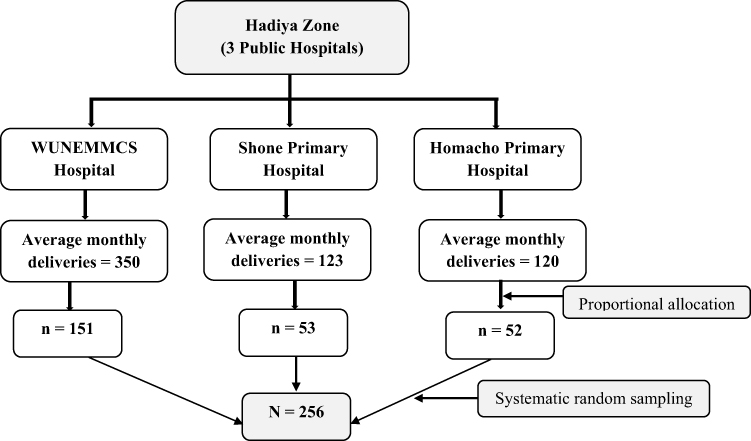 |
Figure 1 Schematic presentation of the sampling procedure for study on the association of placental parameters with birth weight among neonates delivered in the public hospitals of Hadiya zone, Southern Ethiopia, 2018. |
Data Collection Tool and Procedures
A pretested structured interviewer-administered questionnaires and checklist to retrieve data from the medical chart prepared in the English language were used to collect data on maternal and neonatal characteristics. Besides, a weighing scale, long needle, and standard non-elastic tape were used to measure placental parameters. Gestational age was expressed in complete weeks from the last normal menstrual period confirmed by the ultrasound scan report. Infant weight was measured weighing scale calibrated in kilograms. Data were collected by the principal investigator and three midwives working in the delivery units of the hospitals included in the study.
Specimen Collection and Preparation
Following the delivery of the randomly selected mothers, their placentae were checked for completeness and weight was taken after trimming off all membranes and removing the umbilical cord leaving a length of 5cm from its fetal site of insertion.3,4 Then, the placentae were washed in normal saline, mopped by a towel, and placed in plastic containers filled with formalin (10%) within 20 minutes of delivery to prevent drying.24
Finally, the placentae were labeled with a number sticker for identification20,22 and stored again in a solution of 0.5% formaldehyde in saline for further examinations and measurements.24 After all, placental diameter, weight, and thickness were measured using the following procedures. The maximum (a) and minimum (b) diameters of the chorionic disc were recorded in cm using a standard non-elastic tape measure at a right angle to each other and the mean of two measurements was considered as the diameter of the placenta22 (Figure 2).
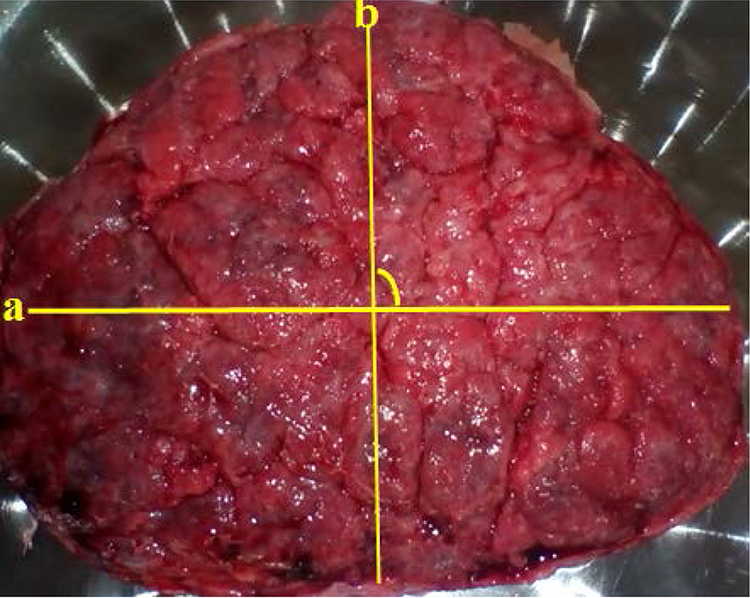 |
Figure 2 A photo demonstrating how average placental diameter (a = maximum diameter and b = minimum diameter) was measured in public hospitals of Hadiya zone, Southern Ethiopia, 2018. |
Placentae were weighed using a weighing machine scaled in grams.22 The placental shape and presence of the accessory lobe were checked and recorded during observation and then categorized accordingly as round, oval, or irregular.21 Placental thickness was measured using a long needle at five points of the placenta. The placenta was placed on the fetal surface and arbitrarily divided into three zones of equal parts by drawing two circles on the maternal surface. The circles divided the radius of the placenta into three equal parts. Then, one thickness was measured from the center of the central zone, two from the middle zone, and another two from the peripheral zone, which were the points taken within the outer zone. Finally, the mean of all five measurements was calculated and considered as the thickness of the placenta22 (Figure 3).
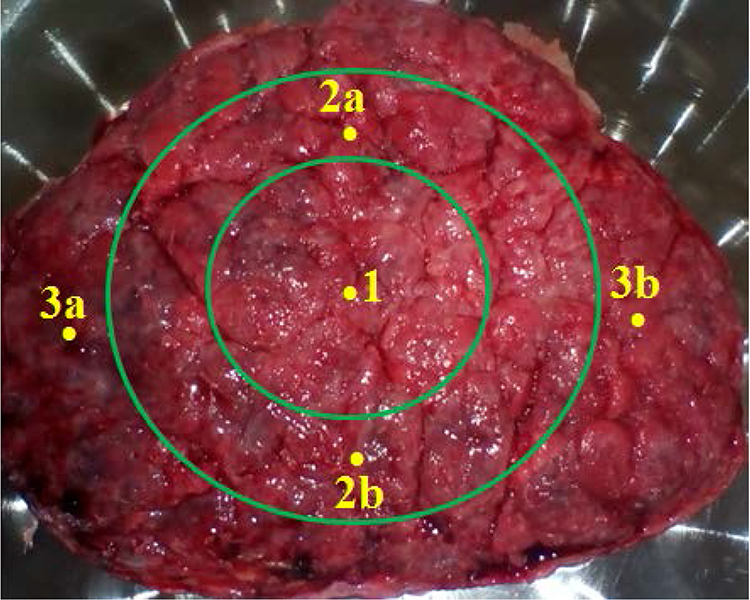 |
Figure 3 A photo demonstrating how the surface of the placenta was divided into three zones (1 = central zone, 2a and 2b = middle zones, and 3a and 3b = peripheral zones) to measure its thickness in public hospitals of Hadiya zone, Southern Ethiopia, 2018. |
Operational Definitions
Low birth weight: birth weight of a neonate measured <2.5kg whereas normal birth weight is the birth weight of a neonate ≥ 2.5kg.
Placental weight: a placenta with a weight of 330gm and above was considered “normal” and a weight less than 330gm was considered “low placental weight”.
Placental thickness: a placenta with a thickness of 2cm and above was considered “normal” and a thickness less than 2cm was considered “low placental thickness”.
Placental diameter: the placentae with a diameter of 15–22cm, <15cm, and >22cm were considered as “normal”; “below normal”, and “above normal”, respectively.
Data Quality Control
Data collectors were trained for three days on the data collection tool and procedures during specimen collection and preparation. Two weeks before the data collection, the questionnaire was pretested on 5% of the sample size in the Ottona referral hospital to assure the clarity and understandability of the tool. During the actual data collection process, the principal investigator checked the questionnaires for consistency and completeness daily.
Data Management and Statistical Analysis
Data were checked manually for completeness, coded, and entered into Epi-Data version 2.1 and then exported to SPSS Version 20.0 for further analysis. Descriptive results were presented using frequency tables and pictures. Bivariable and multivariable logistic regression analyses were carried out to examine the association of the placental indices (placental weight, thickness, and diameter) and other independent variables with birth weight. Adjusted Odds Ratio (AOR) with a 95% confidence interval was estimated to assess the strength of the association and a p-value <0.05 was used to declare statistical significance. Multicollinearity between the explanatory variable was checked by conducting lasso logit regression and using variance inflation factor (VIF) value and the VIF values for the variable included in the final regression model ranged from 1.09 to 1.18, indicating there was no collinearity between variables. The model fitness test was checked using the Hosmer and Lemeshow goodness of fit test and the P-value of this test was 0.22 suggesting the model was best fitted.
Results
Maternal Socio-Demographic and Obstetric Characteristics
A total of 249 mothers were included in the study, giving a response rate of 97.26%. One hundred sixty-nine (67.9%) mothers were in the age group of 20–34 years. Regarding maternal education, 51 (20.5%) mothers had no formal education and 58 (23.3%) of them attended higher education. More than half of mothers (67.9%) resided in urban areas. Among the study participants, 98 (39.4%) and 88 (35.3%) mothers were government employees and housewives, respectively. Concerning obstetric characteristics, 159 (63.9%) were multiparous and 222 (89.2%) gave birth by spontaneous vaginal delivery (Table 1).
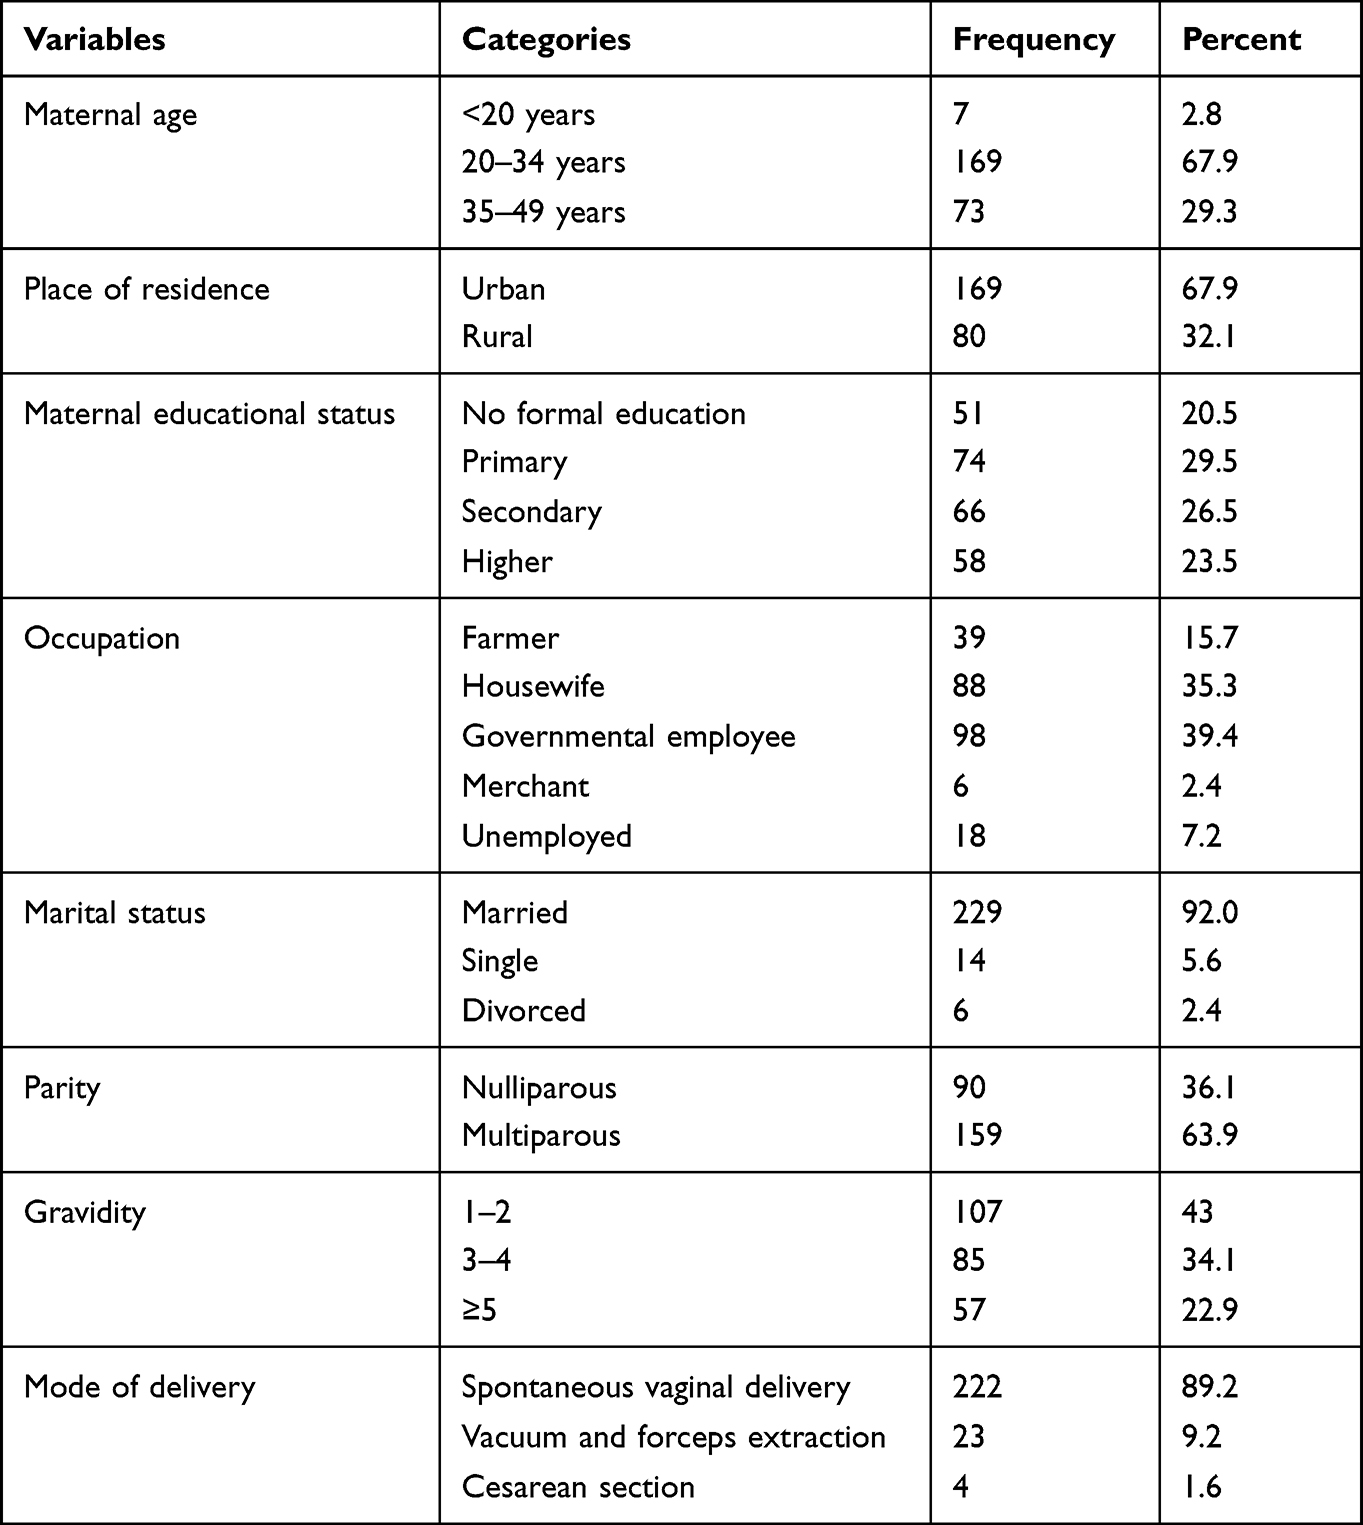 |
Table 1 Socio-Demographic and Obstetric Characteristics of the Mothers Who Gave Birth in Public Hospitals of Hadiya Zone, Southern Ethiopia, 2018 |
Neonatal Characteristics
Among 249 neonates, 136 (54.6%) were males and 151 (60.6%) were delivered at a gestational age of 37 weeks and above (term), whereas 98 (39.4%) were preterm. The mean birth weight of the neonates was 3.3±0.6 kg SD (range=2.0–4.5kg). Two hundred-twenty-four neonates (90.0%) had a birth weight of 2.5kg and above and the proportion of neonates with low birth weight was 10% (95% CI: 6–14%). Moreover, it was found that the prevalence low birth weight among preterm neonates was 8%. Regarding the Apgar score, 66 (26.5%) and 26 (10.4%) neonates had a score of less than 7 at the first and fifth minute of birth, respectively. In addition, it was revealed that the mean placental weight to birth weight ratio × 100 was 14.8±3.4 SD (range=7.6–27.4).
Placental Parameters
The mean major diameter of the placenta was 18.3±2.7cm SD (range = 12.0–24.2cm) and the mean minor diameter was 17.2±2.6cm SD (range=10.5–23.5cm), with an overall mean placental diameter of 17.7±2.6cm. Three-fourth (75.9%) of studied placentae had a diameter that was in the normal range, whereas 45 (18.1%) and 15 (6.0%) had a diameter below and above the normal range, respectively. The mean placental weight (PW) and thickness were 475.9 (±103.4 SD; range=300.0–751.0gm) and 2.4±0.4cm SD (range=1.6–3.9cm), respectively. The weight of 243 (97.6%) placentae was in the normal range and the majority (68.7%) of the placentae were round in shape and irregularly shaped placentae accounted for 7.6%.
Association of Placental Parameters with Neonatal Birth Weight
The result of the correlation showed that the correlation coefficient was −0.31 (P<0.001) for placenta weight, −0.12 (P=0.04) for placenta thickness, and −0.11 (P=0.07). This indicates that while placenta weight and thickness were found to have a statistically significant negative relation with birth weight, placental diameter did not correlate with birth weight.
In the bivariable logistic regression analysis, placental weight, placental thickness, gestational age, and place of residence were significantly associated with low birth weight. However, in the adjusted regression analysis, only placental weight (AOR: 6.57; 95% CI: 2.47–17.48), placental thickness (AOR: 4.94; 95% CI: 1.42–17.22), and gestational age (AOR: 4.73; 95% CI: 1.49–14.99) were identified as the statistically significant factors affecting low birth weight (Table 2).
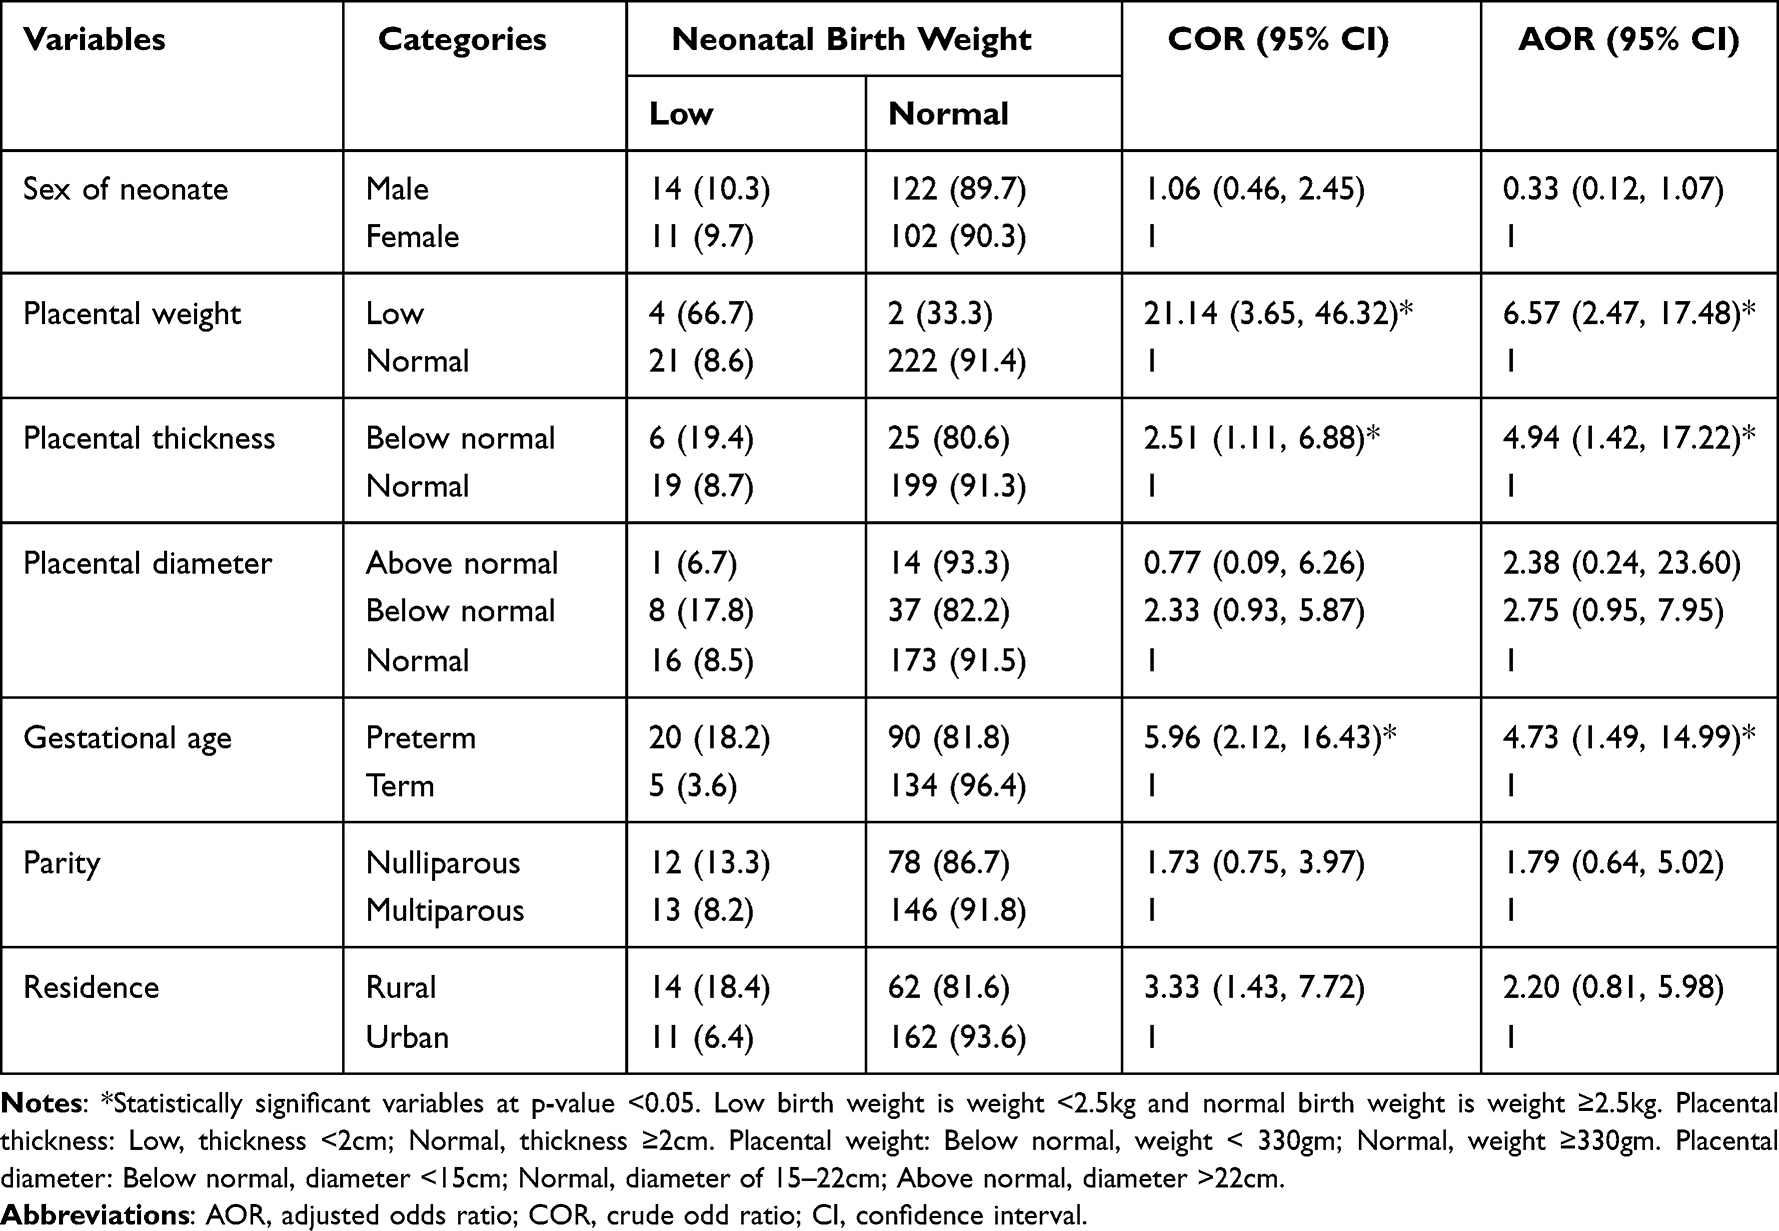 |
Table 2 Results of Bivariable and Multivariate Logistic Regression Analysis for the Association of Placental Parameters with Low Birth Weight Among Neonates Delivered in Public Hospitals of Hadiya Zone, Southern Ethiopia, 2018 |
In addition, population attributable risk for the statistically significant placental indices (thickness and weight) revealed that there will be a 13% and 14% reduction in the occurrence of low birth weight among neonates if the placental thickness and placental weight of these neonates are within a normal range, respectively.
Discussion
This study aimed to assess placental parameters and their association with birth weight among singleton live births with known gestational age born in the public hospitals of Hadiya zone, southern Ethiopia. In this study, the prevalence of LBW was 10% (95% CI: 6–14%). This finding is consistent with the results of the studies done in Jimma, Western Ethiopia 11.2%,25 Bahir Dar, Ethiopia 8.8%,26 and Tigray, Northern Ethiopia 9.9%.16 However, our finding is lower than that of the studies in Gondar, Northern Ethiopia 17.4%15 and Southwest Ethiopia 17.9%.14 This variation might be due to differences in the study settings, sample size, and maternal and neonatal characteristics.
The result of logistic regression analysis identified different factors affecting low birth weight. For instance, the odds of low birth weight were more than six times higher among neonates with a placental weight below the normal range (AOR: 6.57; 95% CI: 2.47–17.48) compared to those with normal placental weight. This finding is supported by the results of the studies conducted in Nigeria27 and Mexico28 which reported a positive relationship between placental weight and birth weight. A possible explanation for this finding might be because lower placentae size limits the transfer of nutrients to the fetus during the intrauterine life which restricts fetal growth and development resulting in poor neonatal outcomes like low birth weight.29
Consistent with the finding reported from the studies conducted in Iran30 and Pennsylvania,31 the current study revealed that the likelihood of low birth weight was increased by about five times among neonates with a low placental thickness (AOR: 4.94; 95% CI: 1.42–17.22) compared to neonates with the normal placental thickness. Our finding is also supported by the study conducted in India which reported a good neonatal outcome among neonates with normal placental thickness.32 This might be due to limited structural organization and vascularization of the thin placenta which results in limited oxygen and nutrient supply thereby restricting the growth of the fetus.
Gestational age was also found to be an independent predictor of low birth weight. Accordingly, the odds of having low birth weight were more than four times higher among preterm neonates (AOR: 4.73; 95% CI: 1.49–14.99) compared to those delivered at the gestational age of 37 weeks or more. This finding is in agreement with the findings of the studies in Ethiopia.16–18 Likewise, studies in Tanzania19 and Nigeria27 reported a higher risk of low birth weight among preterm neonates. This can be explained by the fact that preterm neonates might not have a matured placenta during the intrauterine life that can supply the nutrients required for fetal growth and development and thus more likely to have lower birth weight than term neonates. Variation in placental weight for any given birth weight and gestational age might be responsible for this finding.
Strengths and Limitations
In this study, placental indices were measured precisely to the nearest decimal and accordingly recorded by well-trained data collectors under the close supervision of the principal investigator. However, this study only examined the association of placental parameters with low birth weight and did not consider other potential risk factors for low birth weight like congenital anomalies, multiple pregnancies, maternal nutritional status, gestational diabetes, hypertension, and antenatal care attendance. Furthermore, since this study was conducted in health institutions, the result of the study might not be generalized to the entire population.
Conclusion
In this study, one in ten singleton births had low birth weight. It was also revealed that low placental weight, low placental thickness, and gestational age were the factors that were significantly associated with LBW. Thus, proper examination of the placenta should be performed routinely to provide valuable information regarding the subsequent care given to the newborns. In addition, large-scale studies with strong designs are required to establish the causal relationship between placental parameters and birth weight.
Data Sharing Statement
The datasets used and analyzed in the current study are available from the corresponding author on reasonable request.
Ethical Approval and Informed Consent
Ethical clearance was obtained from Addis Ababa University, College of Health Sciences, Research and Ethical Review Committee (RERC) numbered RERC/01/09. Official letters of cooperation were obtained from the Hadiya zone health department. Written informed consent was obtained from the study participants and confidentiality was maintained at all possible levels.
Acknowledgments
The authors acknowledge Addis Ababa University, Arba Minch University, Hadiya zone health bureau, study participants, data collectors, supervisors, and administrations of the selected public hospitals of Hadiya Zone.
Author Contributions
All authors made a significant contribution to the work reported, whether that is in the conception, study design, execution, acquisition of data, analysis and interpretation, or in all these areas; took part in drafting, revising or critically reviewing the article; gave final approval of the version to be published; have agreed on the journal to which the article has been submitted; and agree to be accountable for all aspects of the work.
Funding
This research did not receive any specific grant from funding agencies in the public, commercial, or not-for-profit sectors.
Disclosure
The authors declare that they have no conflicts of interest in this work.
References
1. Patel S, Kumar RN, Contractor J, Vaniya VH. Morphological changes of placenta in pregnancy induced hypertension. Int J Res Med. 2016;5(1):104–107.
2. Lakshmi D, Shashank N, Raghupathy N. Morphological Studies of normal human placenta at different gestational periods. J Dent Med Sci. 2013;6(3):2279–2861.
3. Adesina KT, Ogunlaja OO, Aboyeji AP, et al. Relationship between gross placental characteristics and perinatal outcome of low risk singleton deliveries. Niger Postgrad Med J. 2016;23(4):191–195. doi:10.4103/1117-1936.196255
4. Elangovan M, Raviraj K. Analysis of morphology and morphometry of human placenta and its clinical relevance. Imp J Interdiscip Res. 2016;2(8):1531–1534.
5. Grandi C, Veiga A, Mazzitelli N, Cavalli RD, Cardoso V. Placental growth measures in relation to birth weight in a Latin American population. Rev Bras Ginecol Obstet. 2016;38(8):373–380. doi:10.1055/s-0036-1586721
6. Macdonald EM. Population-based placental weight ratio distributions and determinants of placental weight ratios; 2012.
7. Londhe PS, Mane AB. Placental morphometry in relation to birth weight of full term newborn babies. NJIRM. 2012;3:67–72.
8. Azpurua H, Funai EF, Coraluzzi LM, et al. Determination of placental weight using two-dimensional sonography and volumetric mathematic modeling. Am J Perinatol. 2010;27(02):151–155. doi:10.1055/s-0029-1234034
9. Asgharnia M, Esmailpour N, Poorghorban M, Atrkar-Roshan Z. Placental weight and its association with maternal and neonatal characteristics. Acta Medica Iranica. 2008:467–472. doi:10.1155/2015/790617
10. Tabrizi FM, Saraswathi G. Maternal anthropometric measurements and other factors: relation with birth weight of neonates. Nutr Res Pract. 2012;6(2):132–137. doi:10.4162/nrp.2012.6.2.132
11. Siza J. Risk factors associated with low birth weight of neonates among pregnant women attending a referral hospital in northern Tanzania. Tanzan J Health Res. 2008;10(1):1–8. doi:10.4314/thrb.v10i1.14334
12. Gardosi JO. Prematurity and fetal growth restriction. Early Hum Dev. 2005;81(1):43–49. doi:10.1016/j.earlhumdev.2004.10.015
13. Chawanpaiboon S, Vogel JP, Moller AB, et al. Global, regional, and national estimates of levels of preterm birth in 2014: a systematic review and modelling analysis. Lancet Glob Health. 2019;7(1):37–46. doi:10.1016/S2214-109X(18)30451-0
14. Wado YD, Afework MF, Hindin MJ, Bhutta ZA. Effects of maternal pregnancy intention, depressive symptoms and social support on risk of low birth weight: a prospective study from southwestern Ethiopia. PLoS One. 2014;9(5):e96304. doi:10.1371/journal.pone.0096304
15. Zenebe K, Awoke T, Birhan N. Low birth weight & associated factors among newborns in Gondar town, North West Ethiopia: institutional based cross-sectional study. Indo glob j pharm sci. 2014;4(2):74–80. doi:10.35652/IGJPS.2014.110
16. Teklehaimanot N, Hailu T, Assefa H. Prevalence and factors associated with low birth weight in axum and laelay maichew districts, North Ethiopia: a comparative cross sectional study. Int J Nutr Food Sci. 2014;3(6):560–566.
17. Gebremedhin M, Ambaw F, Admassu E, Berhane H. Maternal associated factors of low birth weight: a hospital based cross-sectional mixed study in Tigray, Northern Ethiopia. BMC Pregnancy Childbirth. 2015;15(1):1–8. doi:10.1186/s12884-015-0658-1
18. Mamelle N, Boniol M, Rivière O, et al. Identification of newborns with Fetal Growth Restriction (FGR) in weight and/or length based on constitutional growth potential. Eur J Pediatr. 2006;165(10):717–725. doi:10.1007/s00431-005-0045-4
19. Accrombessi M, Zeitlin J, Massougbodji A, Cot M, Briand V. What do we know about risk factors for fetal growth restriction in Africa at the time of sustainable development goals? A scoping review. Paediatr Perinat Epidemiol. 2018;32(2):184–196. doi:10.1111/ppe.12433
20. Keche HA, Keche AS. Morphometric differentiation between placenta in PIH and normal pregnancy. Int J Med Sci Public Health. 2015;4(2):62–67. doi:10.5455/ijmsph.2015.0711201457
21. Kishwara S, Ara S, Rayhan KA, Begum M. Morphological changes of placenta in preeclampsia. Bangladesh J Anat. 2009;7(1):49–54. doi:10.3329/bja.v7i1.3026
22. Akhter F, Ferdousi R, Sultana R. Gross morphological variation in preterm placenta in gestational diabetes mellitus and pregnancy induced hypertension. J Enam Med Coll. 2011;1(2):71–75. doi:10.3329/jemc.v1i2.11466
23. Meskele S, Mulu A, GebreMickael A, Ena L. Placental and umbilical cord indices and their association with fetal distress in Hadiya zone public hospitals, Southern Ethiopia: a Cross-Sectional Study. Int j gen med. 2021;14:10045–10053. doi:10.2147/IJGM.S346544
24. Pathak S, Jessop F, Hook L, Sebire NJ, Lees CC. Placental weight, digitally derived placental dimensions at term and their relationship to birth weight. J Matern-Fetal Neonatal Med. 2010;23(10):1176–1182. doi:10.3109/14767051003615434
25. Gebremariam A. Factors predisposing to low birth weight in Jimma Hospital south western Ethiopia. East Afr Med J. 2005;82(11):554. doi:10.4314/eamj.v82i11.9408
26. Mulatu H, Zepre K, Betre M, Hailemicael G. Magnitude and factors associated with low birth weight among new born in selected public hospitals of Addis Ababa, Ethiopia, 2016. Glob J Med Res. 2017;17:5.
27. Langston C, Kaplan C, Macpherson T, Manci E. Practice guideline for examination of the placenta. Arch Pathol Lab Med. 1997;121(5):449.
28. Sanina LH, Lo´peza SR, Olivaresc ET, Terrazasc MC, Silvac MAR, Carrilloc ML. Relation between birth weight and placenta weight. Neonatology. 2001;80(2):113–117. doi:10.1159/000047129
29. Brett KE, Ferraro ZM, Yockell-Lelievre J, Gruslin A, Adamo KB. Maternal–fetal nutrient transport in pregnancy pathologies: the role of the placenta. Int J Mol Sci. 2014;15(9):16153–16185. doi:10.3390/ijms150916153
30. Afrakhteh M, Moeini A, Taheri MS, Haghighatkhah HR. Correlation between placental thickness in the second and third trimester and fetal weight. Rev Bras Ginecol Obstet. 2013;35(7):317–322. doi:10.1590/S0100-72032013000700006
31. Hamidi OP, Hameroff A, Kunselman A, Curtin WM, Sinha R, Ural SH. Placental thickness on ultrasound and neonatal birthweight. J Perinat Med. 2019;47(3):331–334. doi:10.1515/jpm-2018-0100
32. Nagpal K, Mittal P, Grover SB. Role of ultrasonographic placental thickness in prediction of fetal outcome: a prospective Indian study. J Obstet Gynecol India. 2018;68(5):349–354. doi:10.1007/s13224-017-1038-8
 © 2022 The Author(s). This work is published and licensed by Dove Medical Press Limited. The
full terms of this license are available at https://www.dovepress.com/terms.php
and incorporate the Creative Commons Attribution
- Non Commercial (unported, v3.0) License.
By accessing the work you hereby accept the Terms. Non-commercial uses of the work are permitted
without any further permission from Dove Medical Press Limited, provided the work is properly
attributed. For permission for commercial use of this work, please see paragraphs 4.2 and 5 of our Terms.
© 2022 The Author(s). This work is published and licensed by Dove Medical Press Limited. The
full terms of this license are available at https://www.dovepress.com/terms.php
and incorporate the Creative Commons Attribution
- Non Commercial (unported, v3.0) License.
By accessing the work you hereby accept the Terms. Non-commercial uses of the work are permitted
without any further permission from Dove Medical Press Limited, provided the work is properly
attributed. For permission for commercial use of this work, please see paragraphs 4.2 and 5 of our Terms.