")
Back to Journals » Diabetes, Metabolic Syndrome and Obesity » Volume 16
Association of Novel Insulin Resistance Indices with Blood Pressure in New-Onset Hypertension and Elevated Blood Pressure Individuals: A Cross-Sectional Study
Authors Liu H, Meng C, Wang Z, Liu C, Yu C, Li Z
Received 24 July 2023
Accepted for publication 26 November 2023
Published 5 December 2023 Volume 2023:16 Pages 3953—3965
DOI https://doi.org/10.2147/DMSO.S432049
Checked for plagiarism Yes
Review by Single anonymous peer review
Peer reviewer comments 2
Editor who approved publication: Prof. Dr. Juei-Tang Cheng
Huanxin Liu,1 Cuiqiao Meng,1 Zhongli Wang,1 Chenghao Liu,1 Chunhong Yu,1 Zhong Li2
1Health Examination Center, Hebei General Hospital, Shijiazhuang, Hebei, 050051, People’s Republic of China; 2Department of General Surgery, Shijiazhuang People’s Hospital, Shijiazhuang, Hebei, 050011, People’s Republic of China
Correspondence: Huanxin Liu, Health Examination Center, Hebei General Hospital, Shijiazhuang, Hebei, 050051, People’s Republic of China, Tel +86 13513317389, Email [email protected]
Objective: Insulin resistance (IR) has a bearing on blood pressure (BP). Nevertheless, research on the relationships between surrogates for IR and BP is limited. In this study, we investigate the associations of these novel IR indices with BP in new-onset hypertension (HTN) and elevated BP individuals.
Methods: An overall sample of 55,381 adult subjects was included in Hebei General Hospital. BP and other clinical indicators were measured. Triglyceride glucose (TyG) index, TyG-waist circumference (TyG-WC), TyG-body mass index (TyG-BMI), TyG-waist to height ratio (TyG-WHtR), triglyceride-to-high-density lipoprotein-cholesterol ratio (TG/HDL-C) and metabolic score for IR (METS-IR) were collected as dependable surrogates for IR. Examinees were categorized into four groups based on BP levels. Those involved were classified as quartiles according to the levels of six surrogate IR indices. Logistic regression analysis was adopted to evaluate the impact of substitute IR indicators on BP. The receiver operating characteristic curve (ROC) analysis was performed to explore the predictive ability of the parameters on BP.
Results: The incidence of elevated BP, stage 1 HTN and stage 2 HTN was 7.86%, 24.05% and 23.76%, respectively. As the levels of six substitute IR indices rose, so did the BP. In the logistic regression analysis, after full adjustment, all alternative IR indicators were independently related to both stage 1 HTN and stage 2 HTN. Except for TG/HDL-C, other substitute IR indices were strongly associated with elevated BP. ROC curves analysis suggested TyG-WC and TyG-WHtR outperformed other indicators with higher odd ratios and area under the curve (AUC) in all the participants.
Conclusion: Increased substitute IR indices were significantly associated with elevated BP in new-onset HTN and elevated BP individuals. TyG-WC and TyG-WHtR could better predict elevated BP, stage 1 HTN and stage 2 HTN.
Keywords: insulin resistance, hypertension, elevated blood pressure, triglyceride glucose index, metabolic score for insulin resistance
Introduction
Hypertension (HTN) is usually associated with a variety of chronic diseases, involving cardiovascular diseases (CVD), organ dysfunction of brain and kidneys, etc.1,2 The incidence rate of HTN has risen during the last decades, with 1.28 billion patients being influenced globally by HTN in 2019.3 China accounts for approximately one-fifth of the world population, where the increase of morbidity and mortality of HTN and HTN-related diseases has become the Chinese main health burden.4 The slight increase in blood pressure (BP) within normal limits has also caused widespread concern owing to its adverse clinical significance.5,6
A quantity of proof obtained in previous research suggested a causal relationship between insulin resistance (IR), associated hyperinsulinism and certain forms of HTN. This was related to the water-sodium retention caused by insulin.7–10 Recently, convincing proof also revealed that IR was an independent predictor of CVD as well as chronic kidney disease (CKD).11 However, hyperinsulinemic-euglycemic clamp (HIEC), as a quantitative IR check method, needs the use of complex devices and invasive operations, which are unable to be performed in the clinic.12 Consequently, as an IR surrogate, the triglyceride glucose (TyG) index was chosen to assess insulin sensitivity, which has been proven to have the same effect as HIEC.13–16 Recently, some researchers have demonstrated that the modified TyG indices, including TyG-waist circumference (TyG-WC), TyG-body mass index (TyG-BMI) and TyG-waist to height ratio (TyG-WHtR), exhibited higher predictability of IR than TyG index alone.17,18 It also found that TyG index related parameters outperformed anthropometric indicators in predicting diabetes and HTN.19,20 Besides, other IR surrogates, such as triglyceride-to-high-density lipoprotein-cholesterol ratio (TG/HDL-C) and metabolic score for IR (METS-IR) could also be conducted as alternatives for IR.21,22 Currently, there is limited research on comparing the associations between these IR surrogates and BP. The purpose of this study was to investigate the relationships between six surrogate IR indicators and BP, as well as the predictive ability of these parameters on BP in new-onset HTN and elevated BP individuals.
Materials and Methods
Study Design and Subjects
Our cross-sectional study was on the foundation of the data from adults who received regular check-ups at Hebei General Hospital in China from 2018 to 2019. Of the 83,287 screening subjects with original data, physical examinees who met one of the following conditions were excluded. (1) Those previously diagnosed with HTN. (2) Those taking antihypertensive, antihyperlipidemic, or hypoglycemic agents considering the impact of medication treatment. (3) Participants with malignancy, serious liver and kidney dysfunction, or other diseases that affected BP, blood sugar, and blood lipids. (4) Participants with missing data. Eventually, 55,381 adults were eligible to participate in this study. This research protocol was performed in terms of the Helsinki Declaration and got the ethical committee’s approval of Hebei General Hospital (The number of ethics committee: NO. 2022003). All objects finished informed consent.
Clinical Measurement
Detailed case histories and utilization of drugs were gathered with questionnaires. The measurement of human body parameters (height [Ht], weight [Wt], WC) was carried out by trained technicians with examinees wearing lightweight, loose clothes and no shoes. BMI was worked out. The automatic BP monitor (OMRON, HEM-7125) was applied to obtain 3 times of systolic blood pressure (SBP) and diastolic blood pressure (DBP) following at least a 5-min break. These averages were used for data analyses. The participants fasted for 8 h at a minimum in the night before collecting blood samples. The fasting serum levels of total cholesterol (TC), TG, HDL-C, low-density lipoprotein cholesterol (LDL-C), fasting plasma glucose (FPG), serum uric acid (SUA), serum creatinine (Scr), aspartate aminotransferase (AST) and alanine aminotransferase (ALT) were assessed by automatic biochemistry analyzer.
Definitions
BP categories were based on the classification recommended by the 2017 American College of Cardiology (ACC)/American Heart Association (AHA) criteria for defining hypertension. 55,381 research objects were divided into four groups: normal BP (SBP<120mmHg and DBP<80mmHg), elevated BP (SBP 120–129mmHg and DBP<80mmHg), stage 1 HTN (SBP 130–139mmHg or DBP 80–89mmHg) and stage 2 HTN (SBP≥140mmHg or DBP≥90mmHg).23
Calculations of Surrogate IR Indices
TyG index = Ln [fasting TG (mg/dL) × FPG (mg/dL)/2].24
TyG-WC = TyG × WC (cm).25
TyG-BMI = TyG × BMI (kg/m2).26
TyG-WHtR = TyG × [WC (cm)/Ht (cm)].27
TG/HDL-C = TG (mg/dL)/HDL-C (mg/dL).28
METS-IR = Ln [(2 × FPG (mg/dL)) + TG (mg/dL)] × BMI (kg/m2)/(Ln[HDL-C (mg/dL)]).22
Statistical Analysis
Statistical analysis was conducted using SPSS 26.0. Kolmogorov–Smirnov tests were employed to examine the normal distribution of data. Continuous data were presented as average±standard deviation (SD) for compliance with the normality test and as median [interquartile ranges (IQR)] for skew distribution. Categorical variables were represented as numbers (%) and analyzed by chi-square tests. In order to the comparison of multiple sets of data, we adopted the one-way analysis of variance for normal distribution data and the Kruskal-Wallis rank sum test for skew distribution data. Pearson correlation analysis was used to discuss the correlations between substitute parameters of IR and BP. Logistic regression analysis was adopted to evaluate the effect of these indicators on BP. The receiver operating characteristic curve (ROC) was performed to explore the predictive ability of the parameters on BP. P-values <0.05, which was significantly statistical significance in the analysis.
Results
Basic Demographic Characteristics in Different Blood Pressure Categories
Figure 1 showed that an overall sample of 55,381 adult subjects was contained within this study, including 32,369 (58.45%) males and 23,012 (41.55%) females. Physical examinees were categorized into four groups based on BP levels, which included normal BP group 24,551 (44.33%), elevated BP group 4351 (7.86%), stage 1 HTN group 13,319 (24.05%) and stage 2 HTN group 13,160 (23.76%). This population’s average age was 46.75 (±18.26) years old. Table 1 demonstrated that as BP levels increased, the proportion of males, former smokers, current smokers, former drinking, current drinking, central obesity, diabetes and CVD significantly elevated. Additionally, the other three groups represented higher-level age, BMI, WC, TC, TG, LDL-C, FPG, serum creatinine, uric acid, AST, ALT, six surrogate IR indices, as well as lower HDL-C concentrations compared to the normal BP group (P<0.05).
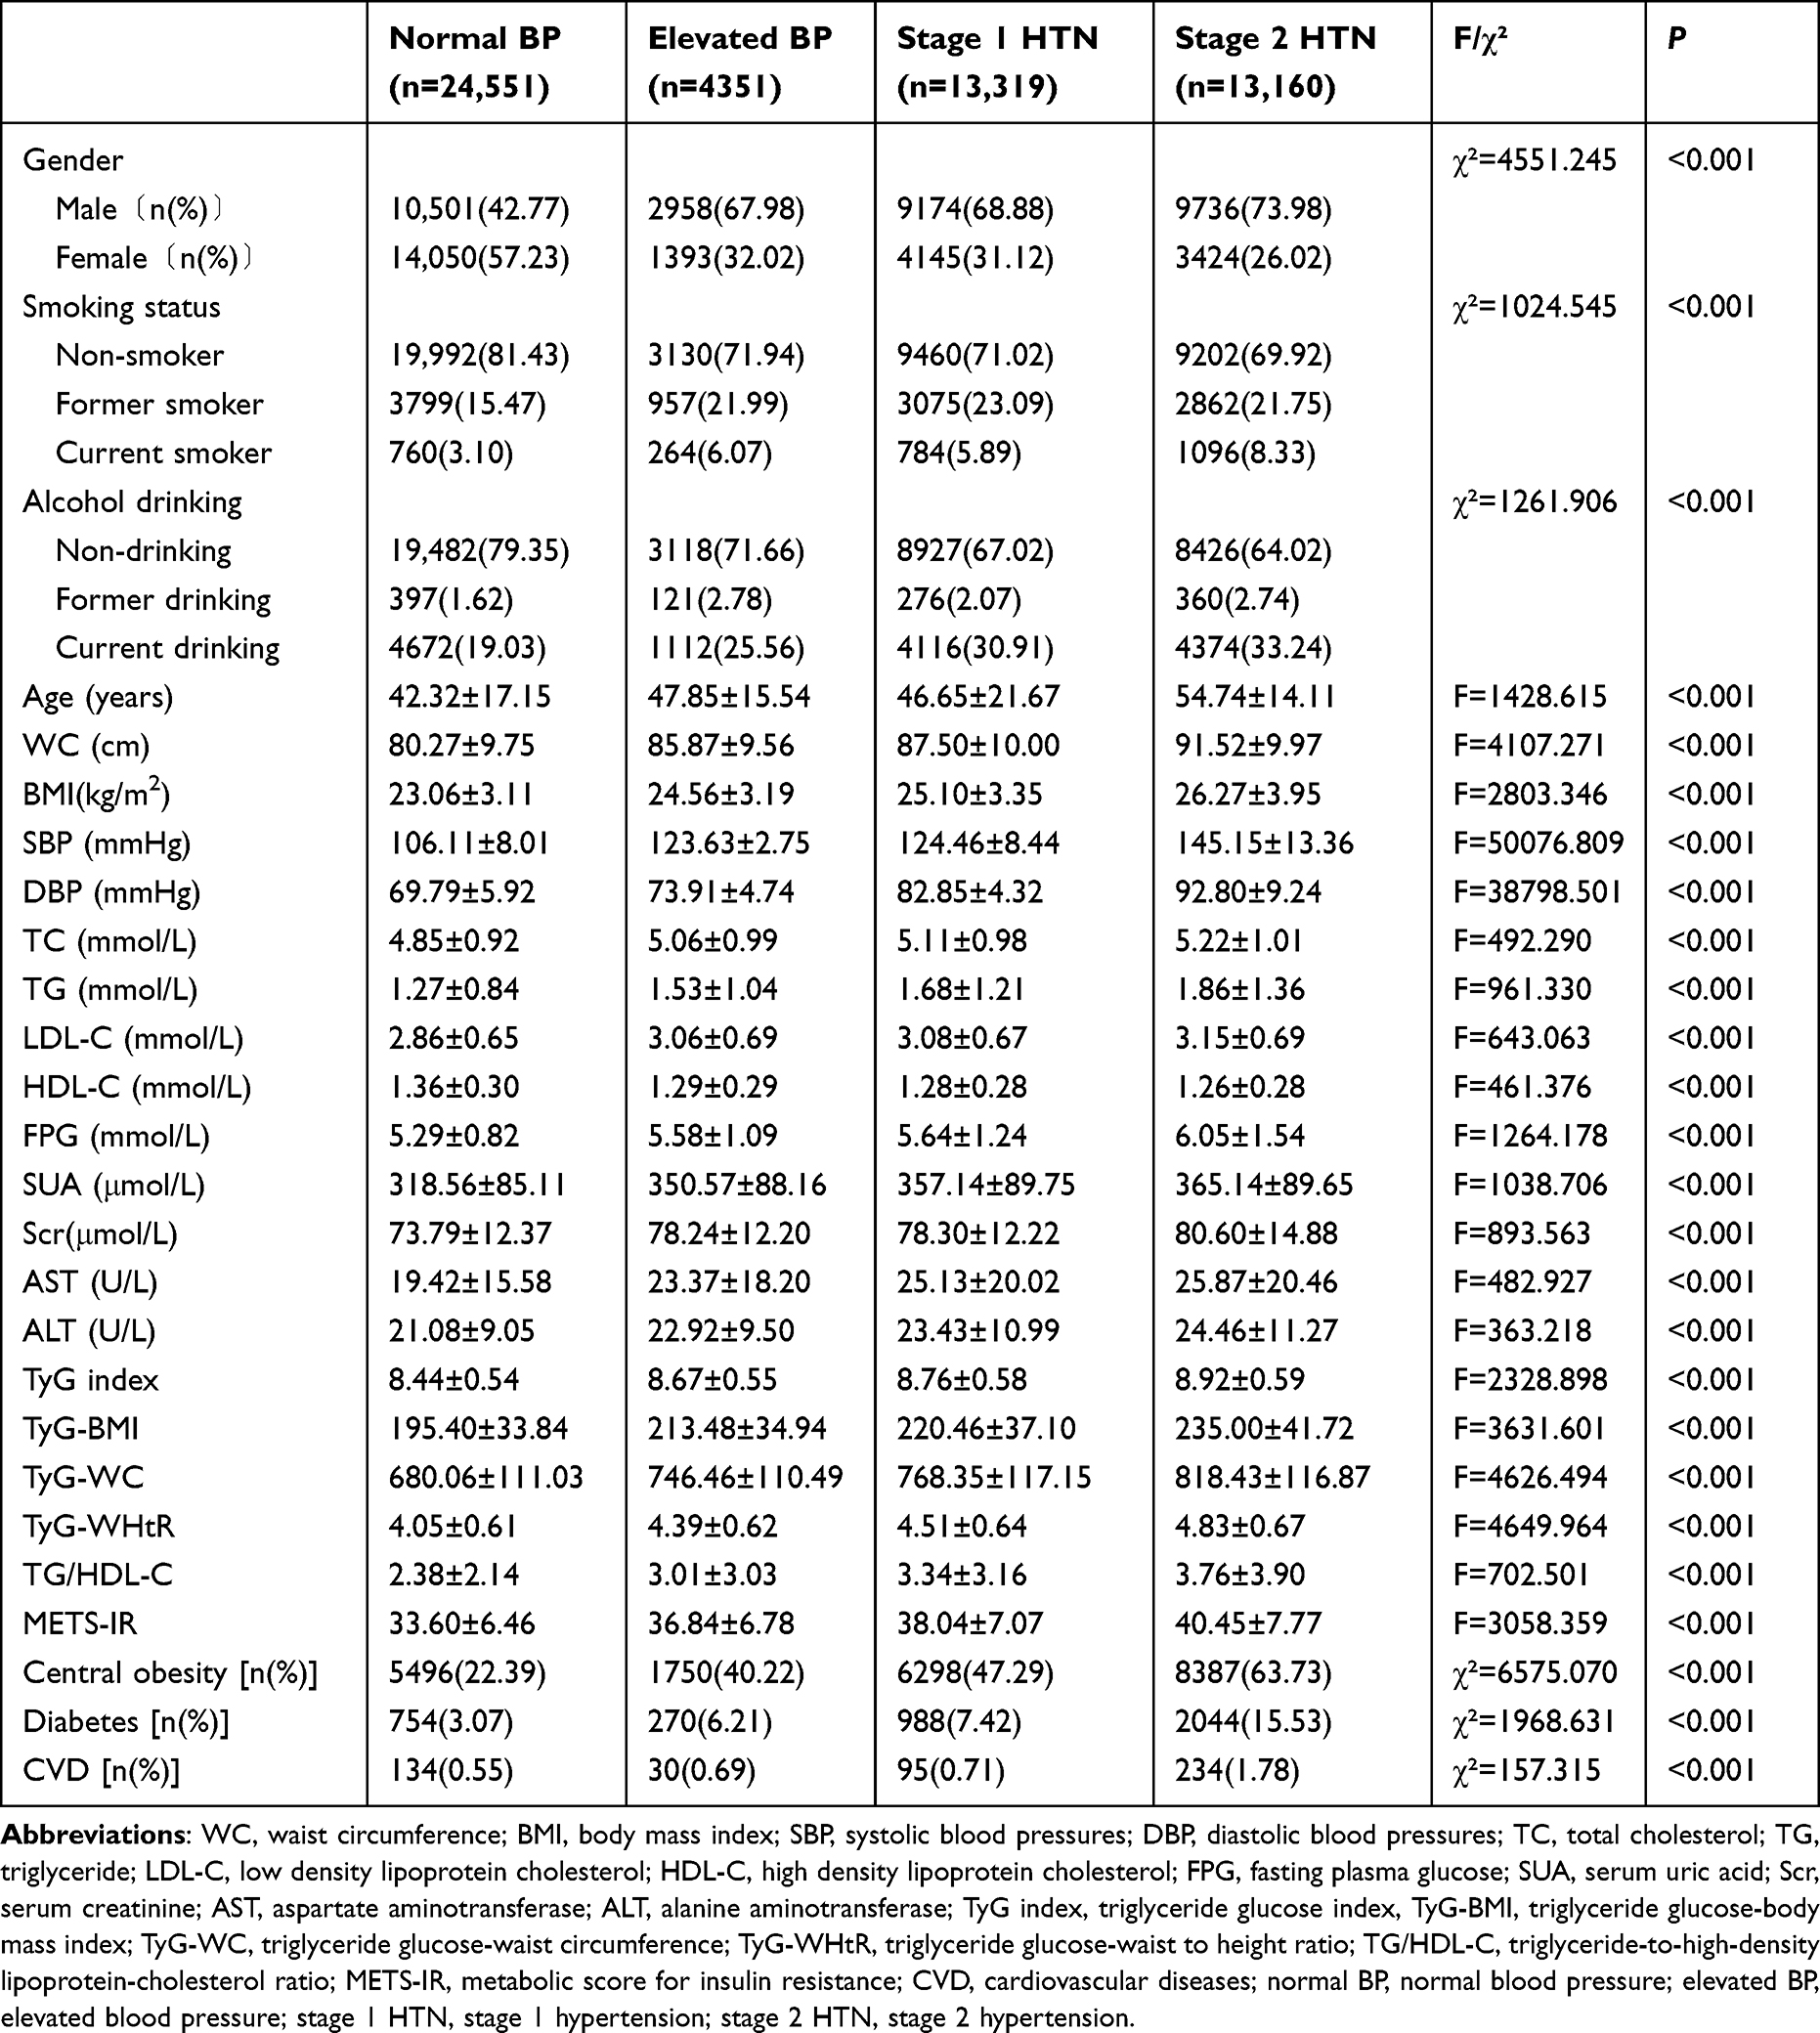 |
Table 1 Comparisons of Basic Demographic Characteristics of Physical Examinees in Different Blood Pressure Categories |
 |
Figure 1 Flowchart of the inclusion and exclusion. |
The BP Levels and Proportion of BP Categories According to the Quartiles of Surrogate IR Indices
Research objects were categorized into four groups (Q1–Q4) according to the quartile range of six substitute IR parameters. The BP levels and proportion of BP categories in quartiles of the TyG index and other novel IR indicators are displayed in Table 2 and Figure 2, respectively. Both SBP and DBP increased with the increase of six surrogate IR indices (P<0.001). The highest quartile of surrogate IR indices had the highest values of SBP and DBP (Table 2). Figure 2 indicated that the morbidity of stage 1 HTN elevated stepwise, from 17.03% to 28.95%, as the TyG index rose from quartile 1 to quartile 4. The analogous tendency was discovered for the subjects defined as stage 2 HTN (from 9.55% to 38.05%) (Figure 2A). In addition, with the increase of TyG-BMI, TyG-WC, TyG-WHtR, TG/HDL-C and METS-IR from Q1 to Q4, the incidence rates of stage 1 HTN and stage 2 HTN gradually increased (Figure 2B–F). Compared to the other three quartiles, the proportion of subjects classified as stage 1 HTN was highest in the highest quartile of IR surrogates except for TyG-WHtR (P<0.05). The Q4 group of the six non-insulin-based IR indicators also exhibited an apparently higher incidence of stage 2 HTN than the other quartiles (P<0.05) (Figure 2A–F).
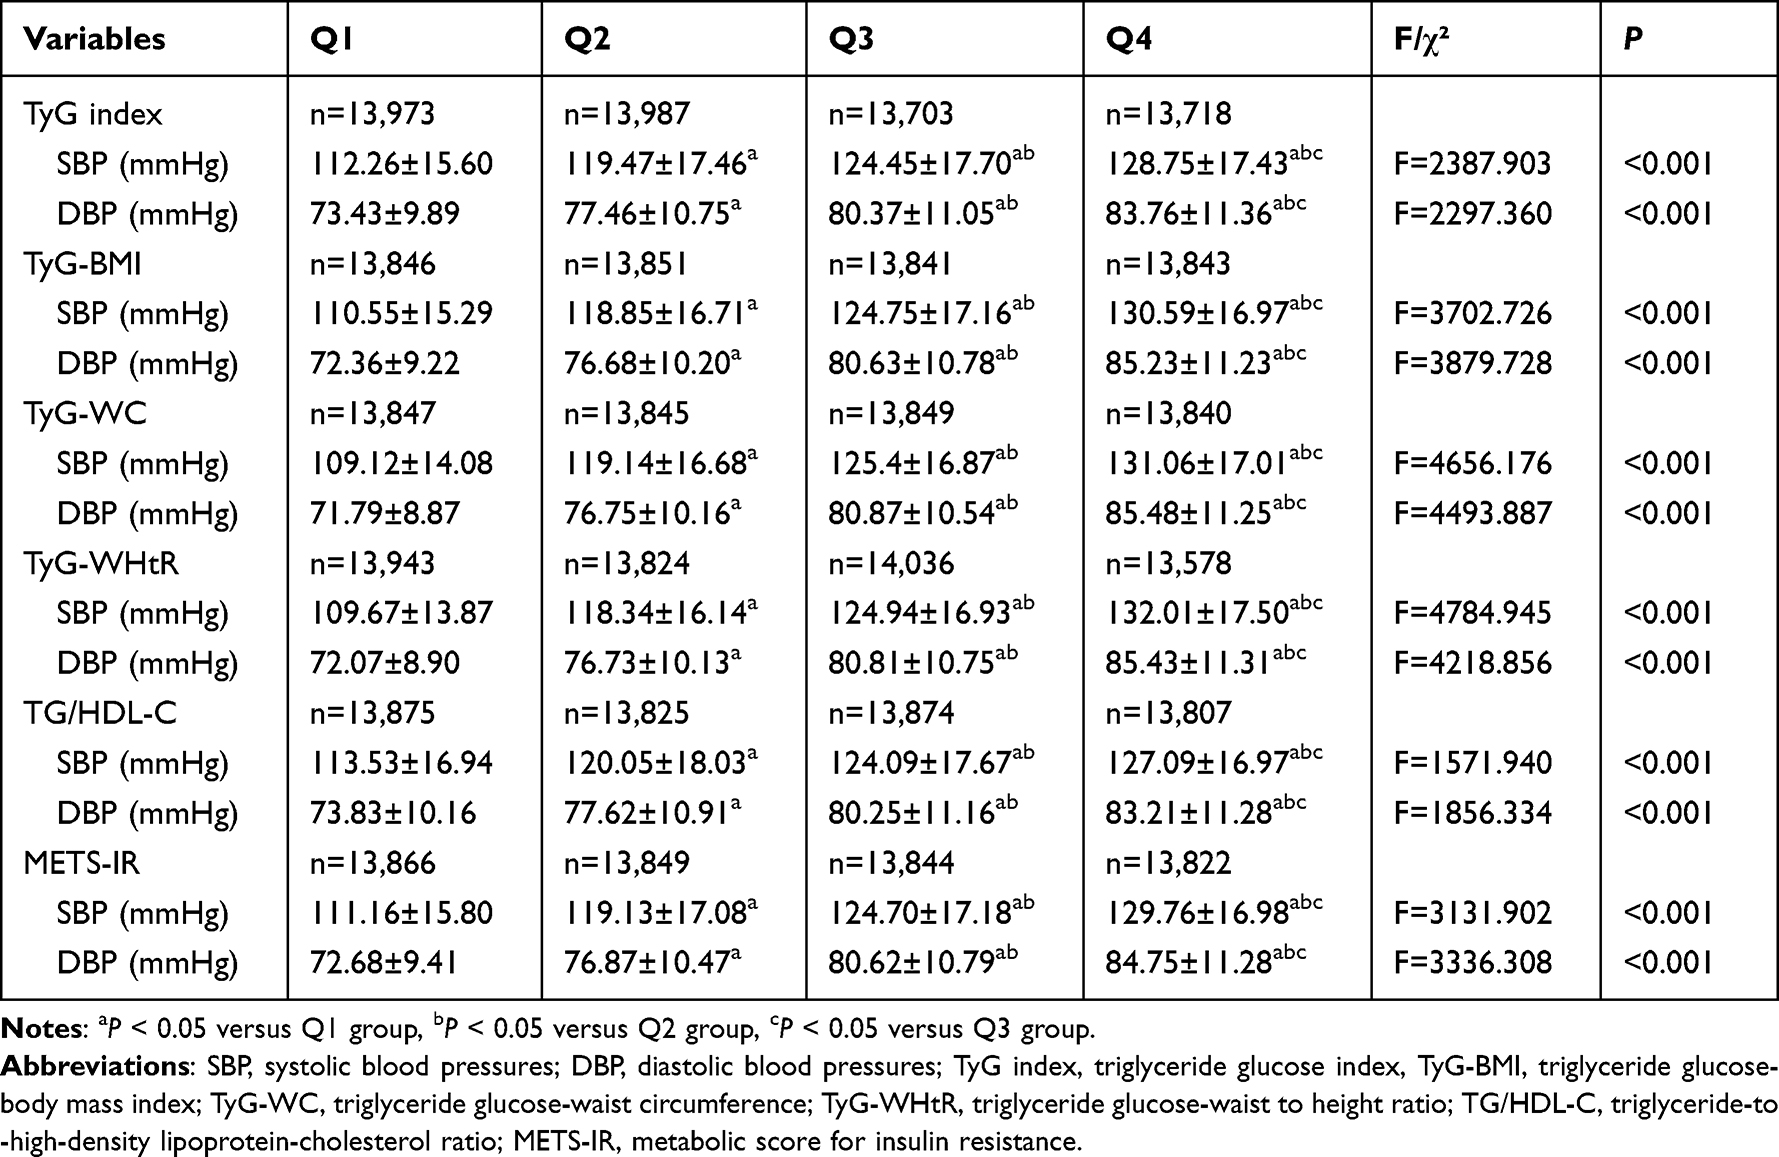 |
Table 2 Blood Pressure Levels of Study Populations According to the Quartiles of Surrogate Insulin Resistance Indices |
 |
Figure 2 The proportion of BP categories according to the quartiles of surrogate insulin resistance indices. (A) TyG index quartiles, (B) TyG-BMI quartiles, (C) TyG-WC quartiles, (D) TyG-WHtR quartiles, (E) TG/HDL-C quartiles, (F) METS-IR quartiles. |
Correlations Between Surrogate IR Indicators and Blood Pressure
Pearson correlation analysis demonstrated that SBP was significantly related to TyG index (r=0.342, P<0.001), TyG-BMI (r=0.412, P<0.001), TyG-WC (r=0.459, P<0.001), TyG-WHtR (r=0.465, P<0.001), TG/HDL-C (r=0.182, P<0.001) and METS-IR (r=0.381, P<0.001). DBP was also positively associated with TyG index (r=0.344, P<0.001), TyG-BMI (r=0.425, P<0.001), TyG-WC (r=0.461, P<0.001), TyG-WHtR (r=0.441, P<0.001), TG/HDL-C (r=0.216, P<0.001) and METS-IR (r=0.399, P<0.001) (Figure 3).
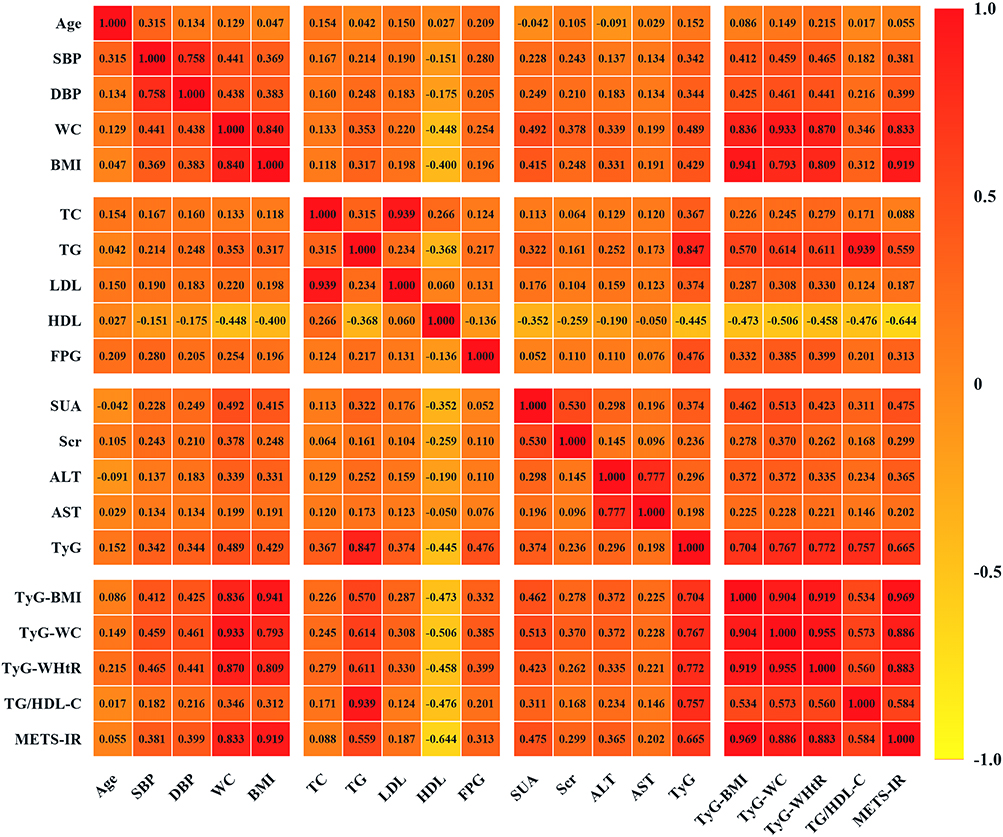 |
Figure 3 Correlation of the insulin resistance parameters with blood pressure levels. |
Logistic Regression Analyses of Surrogate IR Indexes with BP Categories
In the multivariate logistic regression analyses, the TyG index and other IR surrogates were related to the risk of elevated BP, stage 1 HTN as well as stage 2 HTN after adjustments for age and gender. Specifically, TyG-WHtR had the highest odds ratio in all study objects, including elevated BP (1.699, 95% CI 1.604–1.800), stage 1 HTN (2.469, 95% CI 2.372–2.569) and stage 2 HTN participants (4.956, 95% CI 4.725–5.199) (Table 3, Model I). This association persisted after adjusting for the covariates of Model I plus smoking status, alcohol drinking, central obesity, diabetes, CVD and BMI (P<0.05). However, METS-IR did not show a correlation with stage 1 HTN in Model II (OR 1.004, 95% CI 0.991–1.017). All non-insulin-based IR indicators were strongly related to elevated BP, stage 1 HTN and 2 HTN for the adjusted Model III (P<0.05). Nevertheless, no correlation was found between TG/HDL-C and elevated BP after adjustment for the above confounders (OR 1.019, 95% CI 1.000–1.038) (Table 3).
 |
Table 3 Multivariate Logistic Regression Analysis for the Associations Between Surrogate Insulin Resistance Indices Quartiles and Blood Pressure Categories |
The easily measurable substitute indicators of IR were discussed as nominal variables (quartile 1–quartile 4) to make the findings robust and accurate. After potential confounding factors were adjusted, the study found that the incidence of elevated BP notably rose with TyG index, TyG-BMI, TyG-WC, TyG-WHtR as well as TG/HDL-C quartiles increasing (all P for trend <0.05). Yet no strongly graded association was discovered between METS-IR and elevated BP (P for trend >0.05) (Figure 4A). Figure 4B and Figure 4C demonstrated that both stage 1 HTN and stage 2 HTN prevalence remained positively and rankly associated with those substitute indexes of IR after adjusting for potential confounders (age, sex, smoking status, alcohol drinking, central obesity, diabetes, CVD, BMI, TC, LDL-C, HDL-C, SUA, Scr, ALT and AST) (all P for trend <0.05).
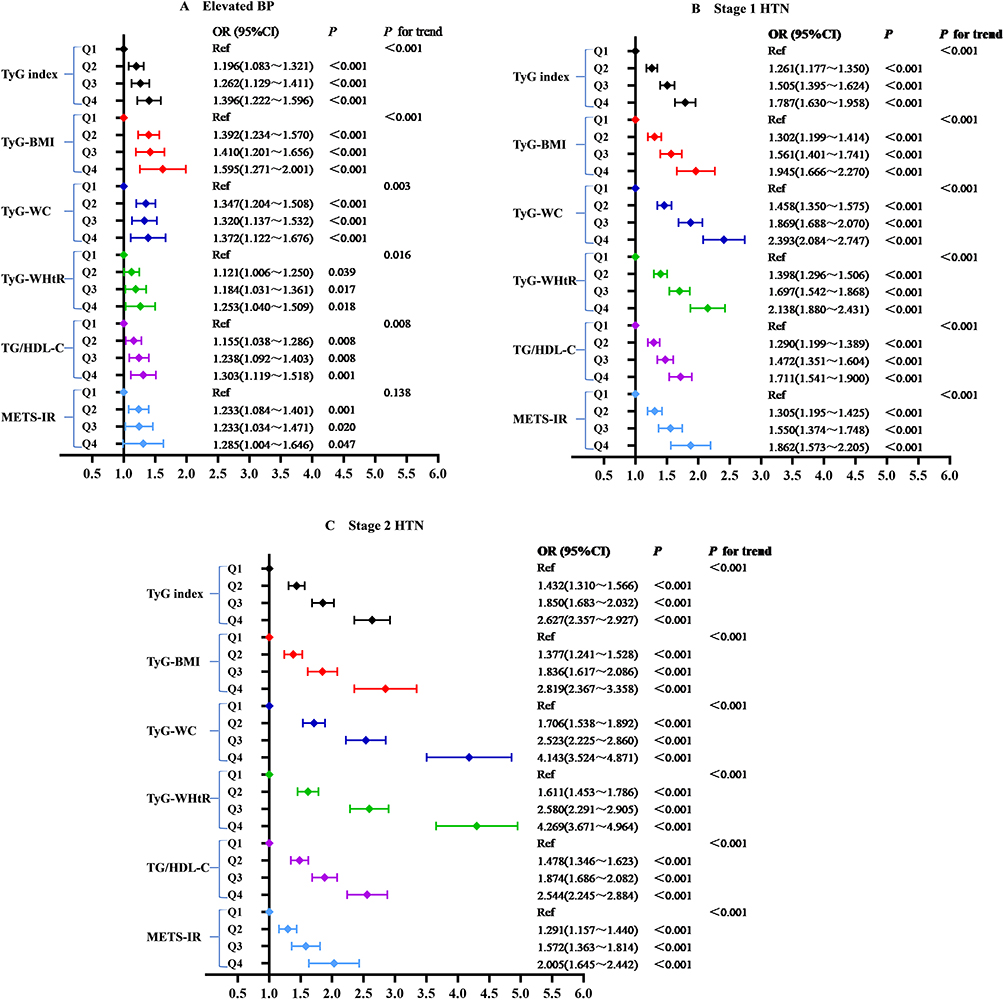 |
Figure 4 Logistic regression analysis of relationship between insulin resistance parameters and blood pressure categories. Normal BP group was the reference group. Model adjusted for age, gender, smoking status, alcohol drinking, central obesity, diabetes, CVD, BMI, TC, LDL-C, HDL-C, SUA, Scr, ALT and AST. (A) Elevated BP, (B) Stage 1 HTN, (C) Stage 2 HTN. |
The Predictive Ability of Surrogate IR Indices on Blood Pressure
The ROC analyses of surrogate IR parameters predicting the occurrence of elevated BP, stage 1 HTN and stage 2 HTN are revealed in Figure 5. For elevated BP, the maximum area under the curve (AUC) value was shown in TyG-WC (AUC 0.669, 95% CI 0.660–0.677), followed by TyG-WHtR (AUC 0.655, 95% CI 0.646–0.663), TyG-BMI (AUC 0.651, 95% CI 0.642–0.659) (Figure 5A). For stage 1 HTN, the maximum AUC was also shown in TyG-WC (AUC 0.711, 95% CI 0.706–0.717), followed by TyG-WHtR (AUC 0.702, 95% CI 0.696–0.707), TyG-BMI (AUC 0.696, 95% CI 0.691–0.702) (Figure 5B). For stage 2 HTN, the maximum AUC was shown in TyG-WHtR (AUC 0.813, 95% CI 0.809–0.817), followed by TyG-WC (AUC 0.806, 95% CI 0.802–0.811), TyG-BMI (AUC 0.784, 95% CI 0.779–0.789) (Figure 5C). Considering the OR value and the AUC, TyG-WC and TyG-WHtR might be regarded as better markers for predicting elevated BP, stage 1 HTN and stage 2 HTN in those participants compared to the TyG index.
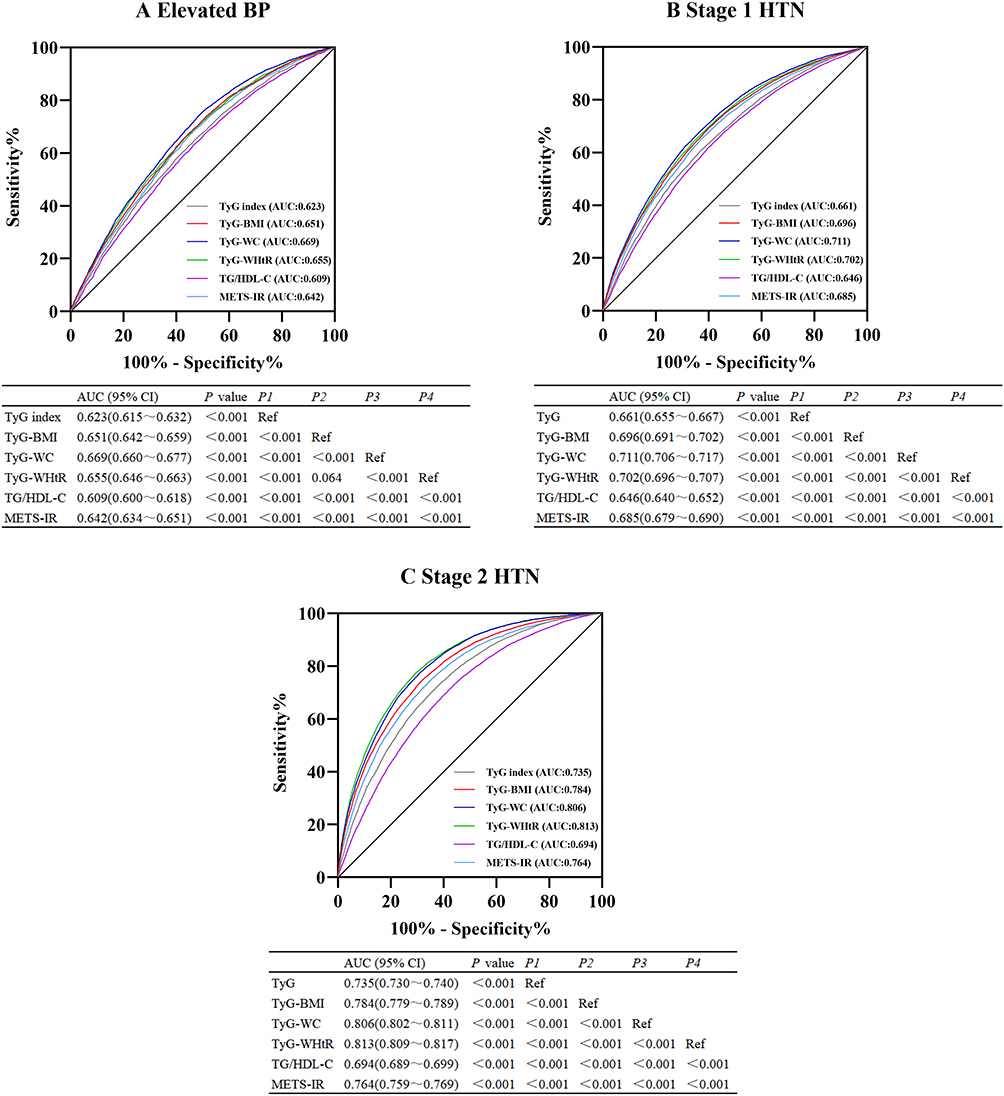 |
Figure 5 The ROC curves analysis of insulin resistance indexes for predicting blood pressure. AUC and 95% CI of each indicator were listed below. (A) Elevated BP, (B) Stage 1 HTN, (C) Stage 2 HTN. |
Discussion
The determination of blood insulin was restricted in clinics because of its comparatively great cost and low accessibility. Therefore, this study combined more cost-effective biochemical indicators as surrogate markers of IR. The previous results on estimating the influence of surrogate IR indices on BP remained not completely consistent.21,29–34 In this large-scale cross-sectional research, we compared the relationships between six easily measurable substitute indices of IR and BP in new-onset HTN and elevated BP individuals. Our data revealed that the new incidence of elevated BP, stage 1 HTN and stage 2 HTN was 7.86%, 24.05% and 23.76%, respectively. Studies discovered that not only hypertension but also elevated BP was a recognized hazard factor for apoplexy, coronary heart disease and heart failure.5,35 Moreover, the US cohort study reported that more than 60% of CVD events happened to subjects with SBP/DBP<140/90mmHg.36 Consequently, attention should also be paid to the prevention of elevated BP and stage 1 HTN.
In this study, the levels of all the novel IR indices were strongly related to both stage 1 HTN and stage 2 HTN. And, obviously graded associations between these new IR indices and HTN were discovered. The cohort research conducted by Sánchez-Íñigo et al37 expressed that the positive associations between TyG index, TG/HDL-C and HTN appeared to be independent of adiposity. Other research also showed that TG/HDL-C, TyG index, TyG-BMI along with TyG-WC were independent correlates of HTN prevalence.33 Additionally, the evidence suggested that TyG-WHtR and METS-IR were hazard factors for HTN.20 Our study was in keeping with these earlier results. It indicated that substitute IR indices could serve as methods for identifying high-risk populations of hypertension. However, an observational study discovered that TyG index was positively related to isolated systolic hypertension rather than isolated diastolic hypertension in subjects beyond the age of forty.34 The cause was probably the diversity in race and sample capacity.
As we all know, high TG and low HDL-C are markers of serum lipid metabolism, and it has been fully proved that they are related to IR.38 Nevertheless, relevance was not found between TG/HDL-C and elevated BP when TG/HDL-C was described as a continuous variable in our study. Similar to our findings, a previous study including 108,370 Chinese adults by Fan et al39 did not express a positive correlation between prehypertension (pre-HTN) and TG/HDL-C. It was considered that the TG/HDL-C ratio was racially dependent. Even in African Americans, TG/HDL-C were not dependable markers of IR.40 However, unlike the definition of elevated BP in our study, pre-HTN was defined as SBP of 120–139 mmHg and/or DBP of 80–89 mmHg. In addition, Zhang et al41 revealed that TG/HDL-C, TyG index, as well as METS-IR were apparently correlated with pre-HTN risk. But they also believed that there existed diversity in insulin secretion abilities between East Asians and other races. From further analysis, the presence of elevated BP was inclined to increase with TyG index, TyG-BMI, TyG-WC and TyG-WHtR quartiles ascending. Therefore, discriminating IR was also very crucial for preventing early elevated BP. Yet no strong graded association was discovered between METS-IR and elevated BP.
ROC curves analysis suggested that six substitute IR indices could predict higher BP risks. TyG-WC and TyG-WHtR outperformed other indicators with higher odd ratios and AUC in all the participants. The result indicated that TyG-WC and TyG-WHtR might be feasible and valid evaluation indicators in the hierarchical management of elevated BP, stage 1 HTN and 2 HTN individuals. Prior studies showed either WC or WHtR was the marker of visceral obesity.42 Visceral adipose tissue could release excessive free fatty acids (FFA) and inflammatory cytokines, which were related to HTN and its target-organ complications.43,44 This might be a possible explanation for our study result. Raimi et al17 demonstrated that TyG-WHtR and TyG-WC also predicted metabolic syndrome (MS) better than the TyG index alone. As an indicator of central obesity, WHtR normally might be superior to BMI and WC in predicting cardiometabolic outcomes, particularly among Asians.45,46 Therefore, it was further emphasized that the combination of TyG index and anthropometric indicators should be used to predict elevated BP and HTN rather than only TyG index. However, Bala et al33 discovered that there was no advantage in using TyG-BMI and TyG-WC as predictive indicators of HTN compared to the TyG index. It might have a bearing on the limited capability of WC and BMI to distinguish between abdominal subcutaneous adipose and visceral adipose.
Numerous epidemiological and experimental researches have expressed that IR is the core pathophysiological mechanism of HTN and pre-HTN.47,48 IR and resulting compensatory hyperinsulinemia contribute to activating the carotid body excessively, thereby causing increased sympathetic activity, which can elevate the total tension of peripheral blood vessels.49 Additionally, the renin-angiotensin II-aldosterone system is activated in response to IR, which leads to enhanced sodium reabsorption in renal tubules, plasma volume overload and increased BP.7,50 In the states of IR, oxidative stress and the disorder of mitochondria may be essential triggers of HTN.51,52 In this case, the synthesis of bioavailable nitric oxide is diminished and the generation of endothelin is increased, ultimately leading to increased vasoconstriction.53–55 Recently, studies have also shown that changes of gut microbiota might play a causal role in IR. It could affect adiposity, IR, as well as related HTN by regulating the microbiota.56 This may provide a new mechanism for investigating IR and HTN.
The advantages of our study include considerable sample capacity, sufficient comparison of each substitute IR index and their ability to predict elevated BP, stage 1 HTN and stage 2 HTN. Nevertheless, a few limitations of this study are as follows. Firstly, our research was a cross-sectional design and we could not infer causal relationships between surrogate IR indices and BP. Secondly, blood insulin levels could not be measured or compared with surrogate IR indicators due to a considerable number of subjects and high costs. Thirdly, due to the lack of physical examination data, such as education level, marital status and dietary habits, some limitations exist in providing effective guidance in these areas. Finally, it raised doubts about the general applicability of our research results due to the same race. Therefore, there is an urgent need for a prospective multiracial study in the future to better express the associations between substitute IR indicators and elevated BP.
Conclusion
In conclusion, the measurement of surrogate IR indices might supply useful information for stratification of the prevention and treatment of HTN and elevated BP. TyG-WC and TyG-WHtR could better predict elevated BP, stage 1 HTN and stage 2 HTN, but still more studies were required to confirm this outcome.
Data Sharing Statement
The raw stats can be obtained from the corresponding author via E-mail at all times (Huanxin Liu: [email protected]).
Funding
This study was funded by Hebei Medical Science Research Project (20230302).
Disclosure
The authors report no conflicts of interest in this work.
References
1. GBD 2015 Risk Factors Collaborators. Global, regional, and national comparative risk assessment of 79 behavioural, environmental and occupational, and metabolic risks or clusters of risks, 1990–2015: a systematic analysis for the global burden of disease study 2015. Lancet. 2016;388(10053):1659–1724. doi:10.1016/S0140-6736(16)31679-8
2. Timmis A, Townsend N, Gale CP, et al. European society of cardiology: cardiovascular disease statistics 2019. Eur Heart J. 2020;41(1):12–85. doi:10.1093/eurheartj/ehz859
3. Collaboration NCDRF. Worldwide trends in hypertension prevalence and progress in treatment and control from 1990 to 2019: a pooled analysis of 1201 population-representative studies with 104 million participants. Lancet. 2021;398(10304):957–980. doi:10.1016/S0140-6736(21)01330-1
4. He J, Gu D, Chen J, et al. Premature deaths attributable to blood pressure in China: a prospective cohort study. Lancet. 2009;374(9703):1765–1772. doi:10.1016/S0140-6736(09)61199-5
5. Lewington S, Clarke R, Qizilbash N, et al. Age-specific relevance of usual blood pressure to vascular mortality: a meta-analysis of individual data for one million adults in 61 prospective studies. Lancet. 2002;360(9349):1903–1913. doi:10.1016/s0140-6736(02)11911-8
6. Kaneko H, Yano Y, Suzuki Y, et al. Reduction in blood pressure for elevated blood pressure/stage 1 hypertension according to the American College of Cardiology/American Heart Association guideline and cardiovascular outcomes. Eur J Prev Cardiol. 2022;29(14):1921–1929. doi:10.1093/eurjpc/zwac193
7. Brosolo G, Da Porto A, Bulfone L, et al. Insulin resistance and high blood pressure: mechanistic insight on the role of the kidney. Biomedicines. 2022;10(10):2374. doi:10.3390/biomedicines10102374
8. Palei AC, Spradley FT, Granger JP. Euglycemic hyperinsulinemia increases blood pressure in pregnant rats independent of placental antiangiogenic and inflammatory factors. Am J Hypertens. 2013;26(12):1445–1451. doi:10.1093/ajh/hpt137
9. Lin CH, Wei JN, Fan KC, et al. Different cutoffs of hypertension, risk of incident diabetes and progression of insulin resistance: a prospective cohort study. J Formos Med Assoc. 2022;121(1 Pt 1):193–201. doi:10.1016/j.jfma.2021.02.022
10. Sasaki N, Maeda R, Ozono R, et al. Adipose tissue insulin resistance predicts the incidence of hypertension: the Hiroshima study on glucose metabolism and cardiovascular diseases. Hypertens Res. 2022;45(11):1763–1771. doi:10.1038/s41440-022-00987-0
11. Whaley-Connell A, Sowers J. Insulin resistance in kidney disease: is there a distinct role separate from that of diabetes or obesity? Cardiorenal Med. 2017;8(1):41–49. doi:10.1159/000479801
12. Tam CS, Xie W, Johnson WD, et al. Defining insulin resistance from hyperinsulinemic‐euglycemic clamps. Diabetes Care. 2012;35(7):
13. Guerrero-Romero F, Villalobos-Molina R, Jimnez-Flores J, et al. Fasting triglycerides and glucose index as a diagnostic test for insulin resistance in young adults. Arch Med Res. 2016;47(5):382–387. doi:10.1016/j.arcmed.2016.08.012
14. Vasques AC, Novaes FS, de Oliveira MS, et al. TyG index performs better than HOMA in a Brazilian population: a hyperglycemic clamp validated study. Diabetes Res Clin Pract. 2011;93(3):e98–e100. doi:10.1016/j.diabres.2011.05.030
15. Guerrero-Romero F, Simental-Mendía LE, González-Ortiz M, et al. The product of triglycerides and glucose, a simple measure of insulin sensitivity. Comparison with the euglycemic-hyperinsulinemic clamp. J Clin Endocrinol Metab. 2010;95(7):3347–3351. doi:10.1210/jc.2010-0288
16. Li Y, You A, Tomlinson B, et al. Insulin resistance surrogates predict hypertension plus hyperuricemia. J Diabetes Investig. 2021;12(11):2046–2053. doi:10.1111/jdi.13573
17. Raimi TH, Dele-Ojo BF, Dada SA, et al. Triglyceride-glucose index and related parameters predicted metabolic syndrome in Nigerians. Metab Syndr Relat Disord. 2021;19(2):76–82. doi:10.1089/met.2020.0092
18. Zeng ZY, Liu SX, Xu H, et al. Association of triglyceride glucose index and its combination of obesity indices with prehypertension in lean individuals: a cross-sectional study of Chinese adults. J Clin Hypertens. 2020;22(6):1025–1032. doi:10.1111/jch.13878
19. Zheng S, Shi S, Ren X, et al. Triglyceride glucose-waist circumference, a novel and effective predictor of diabetes in first-degree relatives of type 2 diabetes patients: cross-sectional and prospective cohort study. J Transl Med. 2016;14(1):260. doi:10.1186/s12967-016-1020-8
20. Gui J, Li Y, Liu H, et al. Obesity-and lipid-related indices as a predictor of hypertension in Mid-aged and Elderly Chinese: a Cross-sectional Study. Res Sq. 2023:2708175. doi:10.21203/rs.3.rs-2708175/v1
21. Zhang F, Zhang Y, Guo Z, et al. The association of triglyceride and glucose index, and triglyceride to high-density lipoprotein cholesterol ratio with prehypertension and hypertension in normoglycemic subjects: a large cross-sectional population study. J Clin Hypertens. 2021;23(7):1405–1412. doi:10.1111/jch.14305
22. Bello-Chavolla OY, Almeda-Valdes P, Gomez-Velasco D, et al. METS-IR, a novel score to evaluate insulin sensitivity, is predictive of visceral adiposity and incident type 2 diabetes. Eur J Endocrinol. 2018;178(5):533–544. doi:10.1530/EJE-17-0883
23. Whelton PK, Carey RM, Aronow WS, et al. 2017 ACC/AHA/AAPA/ABC/ACPM/AGS /APhA/ASH/ASPC/NMA/PCNA guideline for the prevention, detection, evaluation, and management of high blood pressure in adults: executive summary: a report of the American College of Cardiology/American Heart Association Task Force on clinical practice guidelines. Circulation. 2018;138(17):e426–e483. doi:10.1161/CIR.0000000000000597
24. Zhang S, Du T, Zhang J, et al. The triglyceride and glucose index (TyG) is an effective biomarker to identify nonalcoholic fatty liver disease. Lipids Health Dis. 2017;16(1):15. doi:10.1186/s12944-017-0409-6
25. Khamseh ME, Malek M, Abbasi R, et al. Triglyceride glucose index and related parameters (triglyceride glucose-body mass index and triglyceride glucose-waist circumference) identify nonalcoholic fatty liver and liver fibrosis in individuals with overweight/obesity. Metab Syndr Relat Disord. 2021;19(3):167–173. doi:10.1089/met.2020.0109
26. Sánchez-García A, Rodríguez-Gutiérrez R, Mancillas-Adame L, et al. Diagnostic accuracy of the triglyceride and glucose Index for insulin resistance: a systematic review. Int J Endocrinol. 2020;2020:4678526. doi:10.1155/2020/4678526
27. Li HH, Huang S, Liu XZ, et al. Applying the China‐PAR risk algorithm to assess 10‐year atherosclerotic cardiovascular disease risk in populations receiving routine physical examinations in Eastern China. Biomed Environ Sci. 2019;32(2):
28. Abbasi F, Reaven GM. Comparison of two methods using plasma triglyceride concentration as a surrogate estimate of insulin action in nondiabetic subjects: triglycerides×glucose versus triglyceride/high‐density lipoprotein cholesterol. Metabolism. 2011;60(12):1673–1676. doi:10.1016/j.metabol.2011.04.006
29. Liu XZ, Fan J, Pan SJ. METS-IR, a novel simple insulin resistance indexes, is associated with hypertension in normal-weight Chinese adults. J Clin Hypertens. 2019;21(8):1075–1081. doi:10.1111/jch.13591
30. Zhu B, Wang J, Chen K, et al. A high triglyceride glucose index is more closely associated with hypertension than lipid or glycemic parameters in elderly individuals: a cross-sectional survey from the reaction study. Cardiovasc Diabetol. 2020;19(1):112. doi:10.1186/s12933-020-01077-6
31. Lee DH, Park JE, Kim SY, et al. Association between the triglyceride-glucose (TyG) index and increased blood pressure in normotensive subjects: a population-based study. Diabetol Metab Syndr. 2022;14(1):161. doi:10.1186/s13098-022-00927-5
32. Wang K, He G, Zhang Y, et al. Association of triglyceride-glucose index and its interaction with obesity on hypertension risk in Chinese: a population-based study. J Hum Hypertens. 2021;35(3):232–239. doi:10.1038/s41371-020-0326-4
33. Bala C, Gheorghe-Fronea O, Pop D, et al. The association between six surrogate insulin resistance indexes and hypertension: a population-based study. Metab Syndr Relat Disord. 2019;17(6):328–333. doi:10.1089/met.2018.0122
34. Jian S, Su-Mei N, Xue C, et al. Association and interaction between triglyceride-glucose index and obesity on risk of hypertension in middle-aged and elderly adults. Clin Exp Hypertens. 2017;39(8):732–739. doi:10.1080/10641963.2017.1324477
35. Almgren T, Persson B, Wilhelmsen L, et al. Stroke and coronary heart disease in treated hypertension -- a prospective cohort study over three decades. J Intern Med. 2005;257(6):496–502. doi:10.1111/j.1365-2796.2005.01497.x
36. Tajeu GS, Booth JN, Colantonio LD, et al. Incident cardiovascular disease among adults with blood pressure <140/90 mm hg. Circulation. 2017;136(9):798–812. doi:10.1161/CIRCULATIONAHA.117.027362
37. Sánchez-Íñigo L, Navarro-González D, Pastrana-Delgado J, et al. Association of triglycerides and new lipid markers with the incidence of hypertension in a Spanish cohort. J Hypertens. 2016;34(7):1257–1265. doi:10.1097/HJH.0000000000000941
38. Boden G, Lebed B, Schatz M, et al. Effects of acute changes of plasma free fatty acids on intramyocellular fat content and insulin resistance in healthy subjects. Diabetes. 2001;50(7):1612–1617. doi:10.2337/diabetes.50.7.1612
39. Fan J, Gao ST, Wang LJ, et al. Association of three simple insulin resistance indexes with prehypertension in normoglycemic subjects. Metab Syndr Relat Disord. 2019;17(7):374–379. doi:10.1089/met.2019.0029
40. Sumner AE, Finley KB, Genovese DJ, et al. Fasting triglyceride and the triglyceride-HDL cholesterol ratio are not markers of insulin resistance in African Americans. Arch Intern Med. 2005;165(12):1395–1400. doi:10.1001/archinte.165.12.1395
41. Zhang X, Yu C, Ye R, et al. Correlation between non-insulin-based insulin resistance indexes and the risk of prehypertension: a cross-sectional study. J Clin Hypertens. 2022;24(5):573–581. doi:10.1111/jch.14449
42. Lim J, Kim J, Koo SH, et al. Comparison of triglyceride glucose index, and related parameters to predict insulin resistance in Korean adults: an analysis of the 2007–2010 Korean national health and nutrition examination survey. PLoS One. 2019;14(3):e0212963. doi:10.1371/journal.pone.0212963
43. Kwon H, Pessin JE. Adipokines mediate inflammation and insulin resistance. Front Endocrinol. 2013;4:71. doi:10.3389/fendo.2013.00071
44. Seravalle G, Grassi G. Obesity and hypertension. Pharmacol Res. 2017;122:1–7. doi:10.1016/j.phrs.2017.05.013
45. Ashwell M, Gunn P, Gibson S. Waist-to-height ratio is a better screening tool than waist circumference and BMI for adult cardiometabolic risk factors: systematic review and meta-analysis. Obes Rev. 2012;13(3):275–286. doi:10.1111/j.1467-789X.2011.00952.x
46. Gibson S, Ashwell M. A simple cut-off for waist-to-height ratio (0.5) can act as an indicator for cardiometabolic risk: recent data from adults in the Health Survey for England. Br J Nutr. 2020;123(6):681–690. doi:10.1017/S0007114519003301
47. Xun P, Liu K, Cao W, et al. Fasting insulin level is positively associated with incidence of hypertension among American young adults: a 20-year follow-up study. Diabetes Care. 2012;35(7):1532–1537. doi:10.2337/dc11-2443
48. Zhao H, Wang G, Zhang M, et al. Prehypertension and insulin resistance among Mongolian people, Inner Mongolia, China. Blood Press. 2011;20(2):98–103. doi:10.3109/08037051.2010.532320
49. Arauz‐Pacheco C, Lender D, Snell PG, et al. Relationship between insulin sensitivity, hyperinsulinemia, and insulin‐mediated sympathetic activation in normotensive and hypertensive subjects. Am J Hypertens. 1996;9(12 Pt 1):
50. Fonseca VA. Insulin resistance, diabetes, hypertension, and renin angiotensin system inhibition: reducing risk for cardiovascular disease. J Clin Hypertens. 2006;8(10):713–722. doi:10.1111/j.1524-6175.2006.05583.x
51. Jia G, Hill MA, Sowers JR. Diabetic cardiomyopathy: an update of mechanisms contributing to this clinical entity. Circ Res. 2018;122(4):624–638. doi:10.1161/CIRCRESAHA.117.311586
52. Montezano AC, Touyz RM. Reactive oxygen species, vascular Noxs, and hypertension: focus on translational and clinical research. Antioxid Redox Signal. 2014;20(1):164–182. doi:10.1089/ars.2013.5302
53. Khalil RA. Modulators of the vascular endothelin receptor in blood pressure regulation and hypertension. Curr Mol Pharmacol. 2011;4(3):
54. Muniyappa R, Chen H, Montagnani M, et al. Endothelial dysfunction due to selective insulin resistance in vascular endothelium: insights from mechanistic modeling. Am J Physiol Endocrinol Metab. 2020;319(3):E629–E646. doi:10.1152/ajpendo.00247.2020
55. Hill MA, Yang Y, Zhang L, et al. Insulin resistance, cardiovascular stiffening and cardiovascular disease. Metabolism. 2021;119:154766. doi:10.1016/j.metabol.2021.154766
56. Ridaura VK, Faith JJ, Rey FE, et al. Gut microbiota from twins discordant for obesity modulate metabolism in mice. Science. 2013;341(6150):1241214. doi:10.1126/science.1241214
 © 2023 The Author(s). This work is published and licensed by Dove Medical Press Limited. The full terms of this license are available at https://www.dovepress.com/terms.php and incorporate the Creative Commons Attribution - Non Commercial (unported, v3.0) License.
By accessing the work you hereby accept the Terms. Non-commercial uses of the work are permitted without any further permission from Dove Medical Press Limited, provided the work is properly attributed. For permission for commercial use of this work, please see paragraphs 4.2 and 5 of our Terms.
© 2023 The Author(s). This work is published and licensed by Dove Medical Press Limited. The full terms of this license are available at https://www.dovepress.com/terms.php and incorporate the Creative Commons Attribution - Non Commercial (unported, v3.0) License.
By accessing the work you hereby accept the Terms. Non-commercial uses of the work are permitted without any further permission from Dove Medical Press Limited, provided the work is properly attributed. For permission for commercial use of this work, please see paragraphs 4.2 and 5 of our Terms.