Back to Journals » Diabetes, Metabolic Syndrome and Obesity » Volume 15
Association of Non-Insulin-Based Insulin Resistance Indices with Risk of Incident Prediabetes and Diabetes in a Chinese Rural Population: A 12-Year Prospective Study
Authors Li X, Xue Y, Dang Y, Liu W, Wang Q ![]() , Zhao Y
, Zhao Y ![]() , Zhang Y
, Zhang Y
Received 11 August 2022
Accepted for publication 6 December 2022
Published 12 December 2022 Volume 2022:15 Pages 3809—3819
DOI https://doi.org/10.2147/DMSO.S385906
Checked for plagiarism Yes
Review by Single anonymous peer review
Peer reviewer comments 2
Editor who approved publication: Professor Gian Paolo Fadini
Xiaoxia Li,1,2,* Yixuan Xue,1,* Yuanyuan Dang,1 Wanlu Liu,1 Qingan Wang,1,2 Yi Zhao,1,2 Yuhong Zhang1,2
1Department of Epidemiology and Health Statistics, School of Public Health and Management of Ningxia Medical University, Yinchuan, People’s Republic of China; 2Key Laboratory of Environmental Factors and Chronic Disease Control, School of Public Health and Management of Ningxia Medical University, Yinchuan, People’s Republic of China
*These authors contributed equally to this work
Correspondence: Yuhong Zhang, Department of Epidemiology and Health Statistics School of Public Health and Management, Ningxia Medical University, 1160 Shengli Street, Xingqing District, Yinchuan, 750004, People’s Republic of China, Tel +86951-6980144, Fax +86951-6980144, Email [email protected]
Objective: Three non-insulin-based insulin resistance (IR) indices, ie, triglyceride-glucose (TyG) index, triglyceride-to-high-density lipoprotein cholesterol (TG/HDL-C) ratio, and metabolic score for IR (METS-IR), were considered powerful and simplified alternatives for IR. However, evidence for the association between the three IR indices and incident type 2 diabetes mellitus (T2DM), especially impaired fasting glucose (IFG), remains limited. Therefore, this study aimed to explore the association among IR indices, incident IFG, and T2DM in a rural population cohort.
Methods: We analyzed data from 2209 adults (aged 24– 75 years) at baseline and from 1205 normoglycemic participants who were followed up. Cox proportional hazards models were used to evaluate the associations between the three indices and IFG or T2DM. Restricted cubic spline curves based on the Cox regression model were used to examine the association between baseline indices and incident T2DM.
Results: For the baseline data, logistic analyses demonstrated that the TyG index, TG/HDL-C ratio, and METS-IR had a significantly positive correlation with IFG or T2DM after multivariable adjustment. During a median follow-up of 12.17 years, 157 incident cases of IFG and 97 incident cases of T2DM were noted. The risk of T2DM, but not IFG, was strongly associated with the baseline TyG index in the adjusted model, and participants with the TyG index in the third tertile had a higher risk of developing T2DM (adjusted hazards ratio, 2.84; 95% confidence intervals, 1.26– 6.37; p for trend < 0.001) than those in the lowest tertile (reference). Moreover, a linear relationship was observed between the TyG index and T2DM incidence. The TG/HDL-C ratio and METS-IR had no significant relationship with the risk of IFG or T2DM.
Conclusion: The TyG index is more useful than the TG/HDL-C ratio and METS-IR in predicting T2DM in the normoglycemic population.
Keywords: triglyceride-glucose index, triglyceride-to-high-density lipoprotein cholesterol, metabolic score for insulin resistance, impaired fasting glucose, type 2 diabetes mellitus
Introduction
The prevalence of type 2 diabetes mellitus (T2DM) is increasing worldwide, placing a tremendous burden on health economies.1,2 Impaired fasting glucose (IFG) is characterized by elevated blood glucose levels, which are higher than the normal range but below the diabetes diagnostic threshold, and can predict a higher risk of T2DM3 and increased risk of cardiovascular disease.4 Insulin resistance (IR) is one of the most common risk factors for the development of T2DM and IFG and plays an essential role in its pathogenesis.5 IR is usually determined by the hyperinsulinemic-euglycemic clamp test6 and fasting insulin-based homeostasis model assessment index (HOMA-IR).7 However, they are expensive, invasive, impractical, and/or not sufficiently accurate,8,9 leading to a lack of widespread suitability in large clinical and epidemiological studies. Recently, three non-insulin-based IR indices have been developed as the reliable and simplified surrogate for IR, such as the fasting triglyceride-glucose (TyG) index, triglyceride-to-high-density lipoprotein cholesterol (TG/HDL-C) ratio, and metabolic score for IR (METS-IR).
These three indicators are calculated using simple formulas based on biochemical and anthropometric variables, largely compensating for the shortcomings of traditional IR indicators. Several longitudinal observational studies have shown that the TyG index,10,11 TG/HDL-C ratio,12 and METS-IR13 are significant and independent predictors of T2DM. It is noteworthy that this association between the three indicators and T2DM is not exactly similar in different population characteristics; for example, the TyG index had a linear14 or U-shaped15 relationship with T2DM in the Japanese population; it also showed a positive correlation in the white European population,16 especially in participants with TyG index levels ≥8.31. The relationship of the TG/HDL-C ratio change trajectory with the risk of T2DM in Chinese, especially in males with normal weight and younger than 60 years, was U-shaped, bell-shaped, and others;17 the association between the TG/HDL-C ratio and incident T2DM is linear in Koreans18 and nonlinear19 in Chinese. METS-IR is positively associated with T2DM risk in non-obese Japanese adults,13 but studies on the Chinese population are scarce. Therefore, the relationship between these three indicators and T2DM has been inconsistent. In addition, evidence on the association between the three indicators and incident IFG remains unclear, particularly in the Chinese population.
Therefore, this cross-sectional cohort study aimed to evaluate the relationship between the three baseline non-insulin-based IR indices with incident IFG or T2DM in Chinese participants with normal glycemic levels. To the best of our knowledge, this is the first study to comprehensively examine the longitudinal association between the TyG index, TG/HDL-C ratio, and METS-IR and the IFG or T2DM risk in a Chinese rural population.
Materials and Methods
Study Participants
Details of the baseline cross-sectional study methods have been reported elsewhere.20 Briefly, 4614 participants (aged 24–75 years) were enrolled in the baseline survey from 2008 to 2012 in three counties or administrative equivalents (Yuanzhou District, Qingtongxia City, and Pingluo County) in the Ningxia Hui Autonomous Region of China. Of the 4614 participants, 2615 were selected to donate samples using mechanical sampling (k=1) due to budget constraints. A total of 406 participants with severe infection, mental illness, tumors, or other serious diseases were excluded. Thus, 2209 participants with complete data participated in a second visit from 2019 to 2020. Of the 2209 participants, 554 were lost to follow-up because they were hospitalized or they voluntarily left the study or because of other causes. A total of 1655 participants completed the follow-up, with a response rate of 74.92%. Meanwhile, 256 participants with fasting blood glucose (FBG) ≥6.1 mmol/L, 56 participants with T2DM at baseline, and 138 participants who died were excluded. Finally, 1205 participants were included in the final analysis. Figure 1 shows the flowchart of the study population.
 |
Figure 1 Flowchart of participant selection for the study cohort. Abbreviations: FBG, fasting blood glucose; IFG, impaired fasting glucose; T2DM, type 2 diabetes mellitus. |
Anthropometric Measurement
A total of 4614 participants were interviewed by well-trained research assistants with a standardized questionnaire to collect information on general characteristics such as age, sex, education status, cigarette smoking, alcohol intake, and history of disease. Anthropometric measurement indices, such as height, waist circumference (WC), and weight, were measured using standard methods. Body mass index (BMI) was calculated as weight (kg)/height (m2); the waist-to-height ratio (WHtR) was calculated by dividing WC by height, and the waist-to-hip ratio (WHR) was calculated by dividing WC by hip circumference. Blood pressure was measured twice using Omron-7124 (Omron, Tokyo, Japan) after participants had rested for at least 5 mins, and the two readings were averaged and used in the data analysis. A total of 2209 participants with follow-up anthropometric data, including BMI, WHtR, and WHR, underwent multi frequency bioelectric impedance analysis using bioelectrical impedance devices (InBody 370 system; InBody, Seoul, South Korea). Blood pressure was measured using Omron HEM-801 according to a standard protocol similar to the baseline.
Biochemical Measurements
Of the 4614 participants, 2615 were selected by mechanical sampling (k=1) to provide samples at 6:00–8:00 am after 8–12 h of fasting and alcohol avoidance for the assessment of FBG levels and lipid parameters. Baseline FBG levels were determined using One Touch Ultra 2 (Life Scan, Wayne, PA, USA) immediately after the blood was drawn. Baseline lipid parameters, including serum high-density lipoprotein cholesterol (HDL-C), total cholesterol (TC), and triglycerides (TG), were determined using an automatic biochemical analyzer (COBAS 501; Roche Diagnostics, Rotkreuz, Switzerland). Serum low-density lipoprotein cholesterol (LDL-C) was calculated using the Friedewald formula.21 FBG levels and lipid parameters at follow-up were measured using an automatic biochemical analyzer (Mindray BS-430; Mindray, Shenzhen, China) in local township hospitals within 2 h after blood samples were drawn.
Definition of Exposure
Three non-insulin-based IR indices were calculated using the following formulas:
 ;15
;15

 ,13
,13
where FPG is the fasting plasma glucose level.
Primary Outcomes
Outcomes were defined according to the diagnostic criteria of the International Diabetes Federation.2 T2DM was defined as FPG ≥7 mmol/L, being previously diagnosed with T2DM, or currently taking diabetic medications; IFG was defined according to FPG ≥6.1 to <7 mmol/L.
Statistical Analyses
Continuous variables are presented as mean±standard deviation or as median (interquartile range), and analysis of variance and Kruskal–Wallis H-tests were used to compare differences among the three groups, where appropriate. Categorical data are presented as frequencies (percentages) and were compared among groups using the chi-squared test. Logistic regression analysis was applied to assess the association of three IR indices with DM or IFG at baseline. Cox proportional hazards regression analysis of risk of incident IFG or T2DM by tertiles of the baseline TyG index, TG/HDL-C ratio, and METS-IR at follow-up was performed after multivariable adjustment. In the models, the median values of the three IR indices in each tertile were utilized to perform linear trend tests. Restricted cubic spline curves based on the Cox regression model were used to examine the association between the baseline indices and incident T2DM. Results were considered statistically significant at p<0.05 (two-tailed). All statistical analyses were performed using SPSS software version 25.0 (IBM Corp., Armonk, NY, USA) and R software (The R Foundation, Vienna, Austria).
Results
Baseline Cross-Sectional Characteristics of the Study Population
The baseline characteristics of the study participants were compared among the NFG, IFG, and T2DM groups (Table 1). A gradient increase was observed in the TyG index, TG/HDL-C ratio, and METS-IR across the three groups (all p<0.001). Individuals with T2DM had higher WC, BMI, WHtR, WHR, systolic blood pressure (SBP), diastolic blood pressure (DBP), TC, TG, and LDL-C than those with NFG or IFG; meanwhile, HDL-C showed the opposite trend (p=0.187).
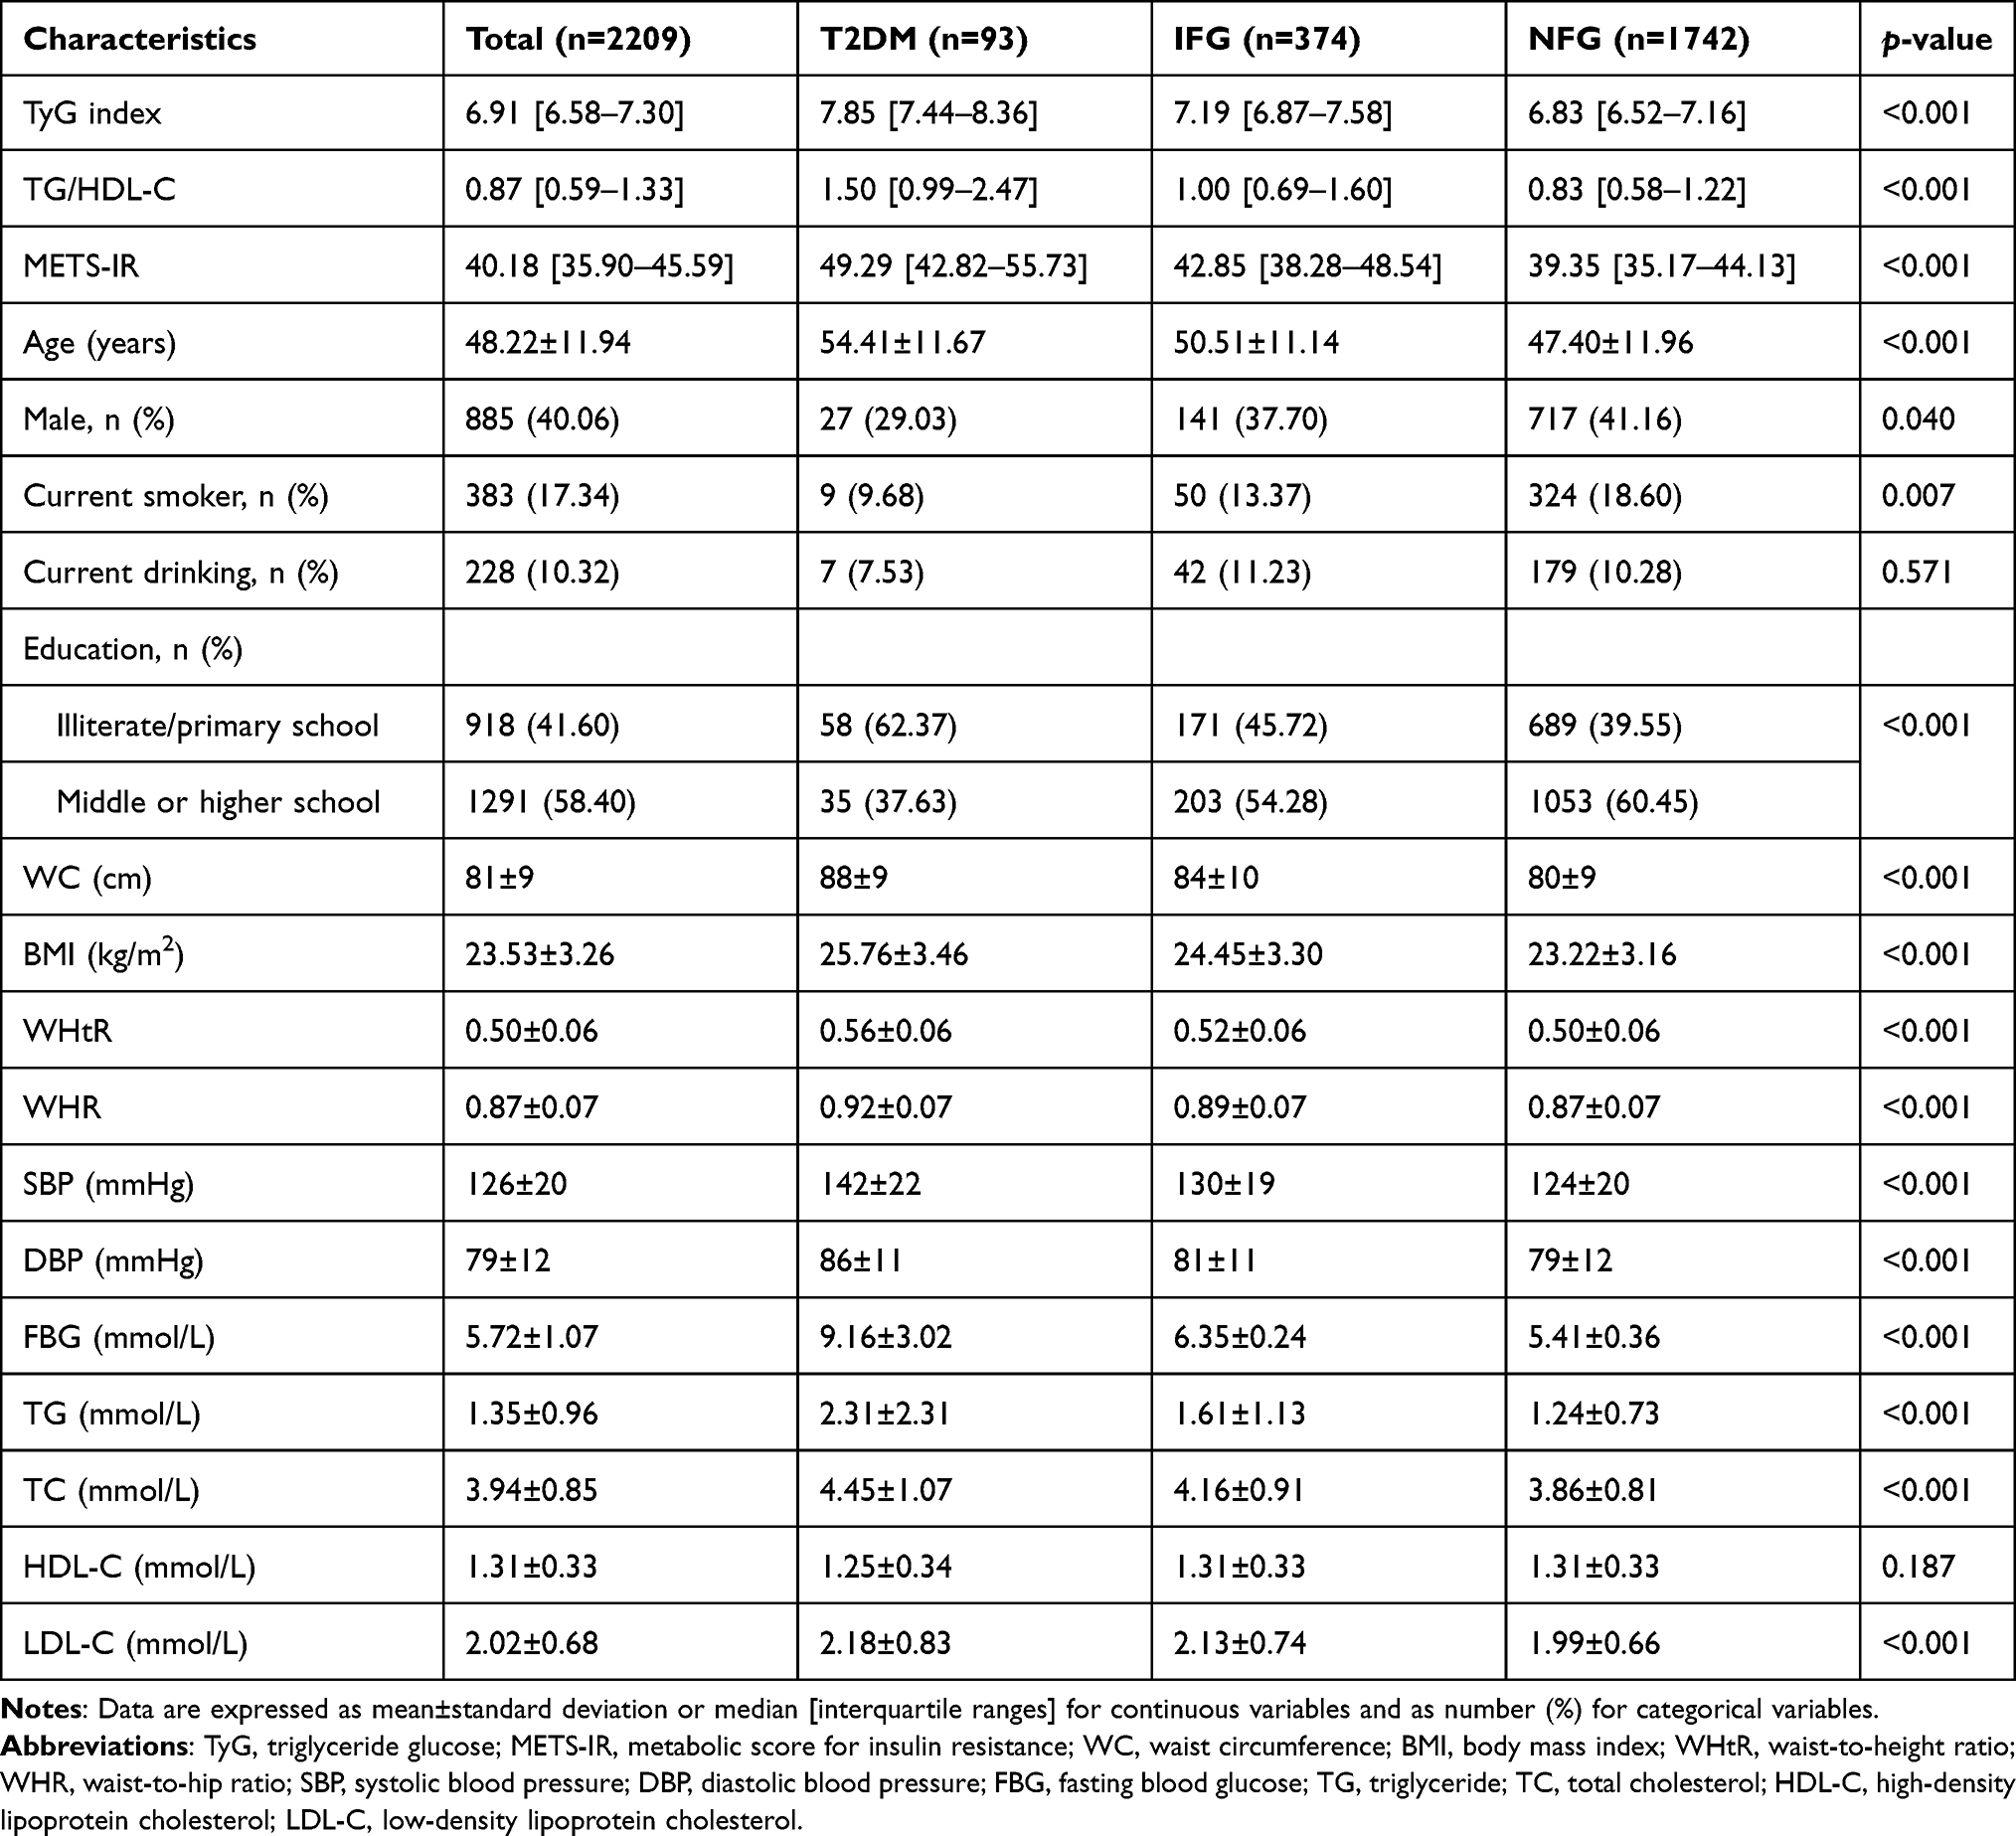 |
Table 1 Characteristics of Participants According to Fasting Glycemia Levels at Baseline (n=2209) |
Cross-Sectional Relationship Between the Three Non-Insulin-Based IR Indices and IFG or T2DM
Table 2 shows the odds ratios (OR) and confidence interval (CI) by logistic regression analysis for the association between three non-insulin-based IR indices and T2DM or IFG. The TyG index, TG/HDL-C ratio, and METS-IR were stratified by tertiles, and in the crude model, the three indices were all positively associated with T2DM or IFG. After adjustment for age, sex, educational status, cigarette smoking, drinking, physical activity, family history of hypertension and diabetes, BMI, WC, SBP, TC, TG and HDL-C, the association between the three indices and T2DM remained. Comparison of the reference group (lowest tertile) with the participants in the third tertile revealed the following ORs of the three indices for T2DM: TyG index, 46.49 (95% CI, 6.21–347.92), TG/HDL-C ratio, 3.60 (95% CI, 1.47–8.86), METS-IR, 55.70 (95% CI, 11.58–267.78) (all p for trend <0.05). The three indices and IFG were shown similar positive relationship.
 |
Table 2 Association of Three IR Indices with T2DM or IFG at Baseline Using Logistic Regression Analysis (n=2209) |
Longitudinal Relationship Between the Three Non-Insulin-Based IR Indices and IFG and T2DM
Cox proportional hazards regression analysis was conducted to assess the risk of the baseline TyG index, TG/HDL-C ratio, and METS-IR on incident IFG (Table 3) and T2DM (Table 4). We divided the participants into tertiles according to the baseline TyG index, TG/HDL-C ratio, and METS-IR. The risk of IFG was strongly associated with the baseline TyG index in the crude model (hazards ratio [HR], 1.78; 95% CI, 1.20–2.66; p for trend=0.004); however, the association was not significant after further adjustment in multivariate-adjusted models 2 (HR, 1.47; 95% CI, 0.98–2.20; p for trend=0.067) and 3 (HR, 1.06; 95% CI, 0.58–1.96; p for trend=0.784). In contrast, the risk of T2DM was strongly associated with the baseline TyG index. Compared with the lowest TyG tertile, the risk of incident T2DM increased significantly in tertiles 2 and 3, and the association remained after multivariate adjustment in models 2 (HR, 2.65; 95% CI, 1.53–4.59; p for trend <0.001) and 3 (HR, 2.84; 95% CI, 1.26–6.379; p for trend <0.001). However, the baseline TG/HDL-C and METS-IR levels were not associated with the risk of incident T2DM or IFG after further adjustment in multivariate-adjusted models.
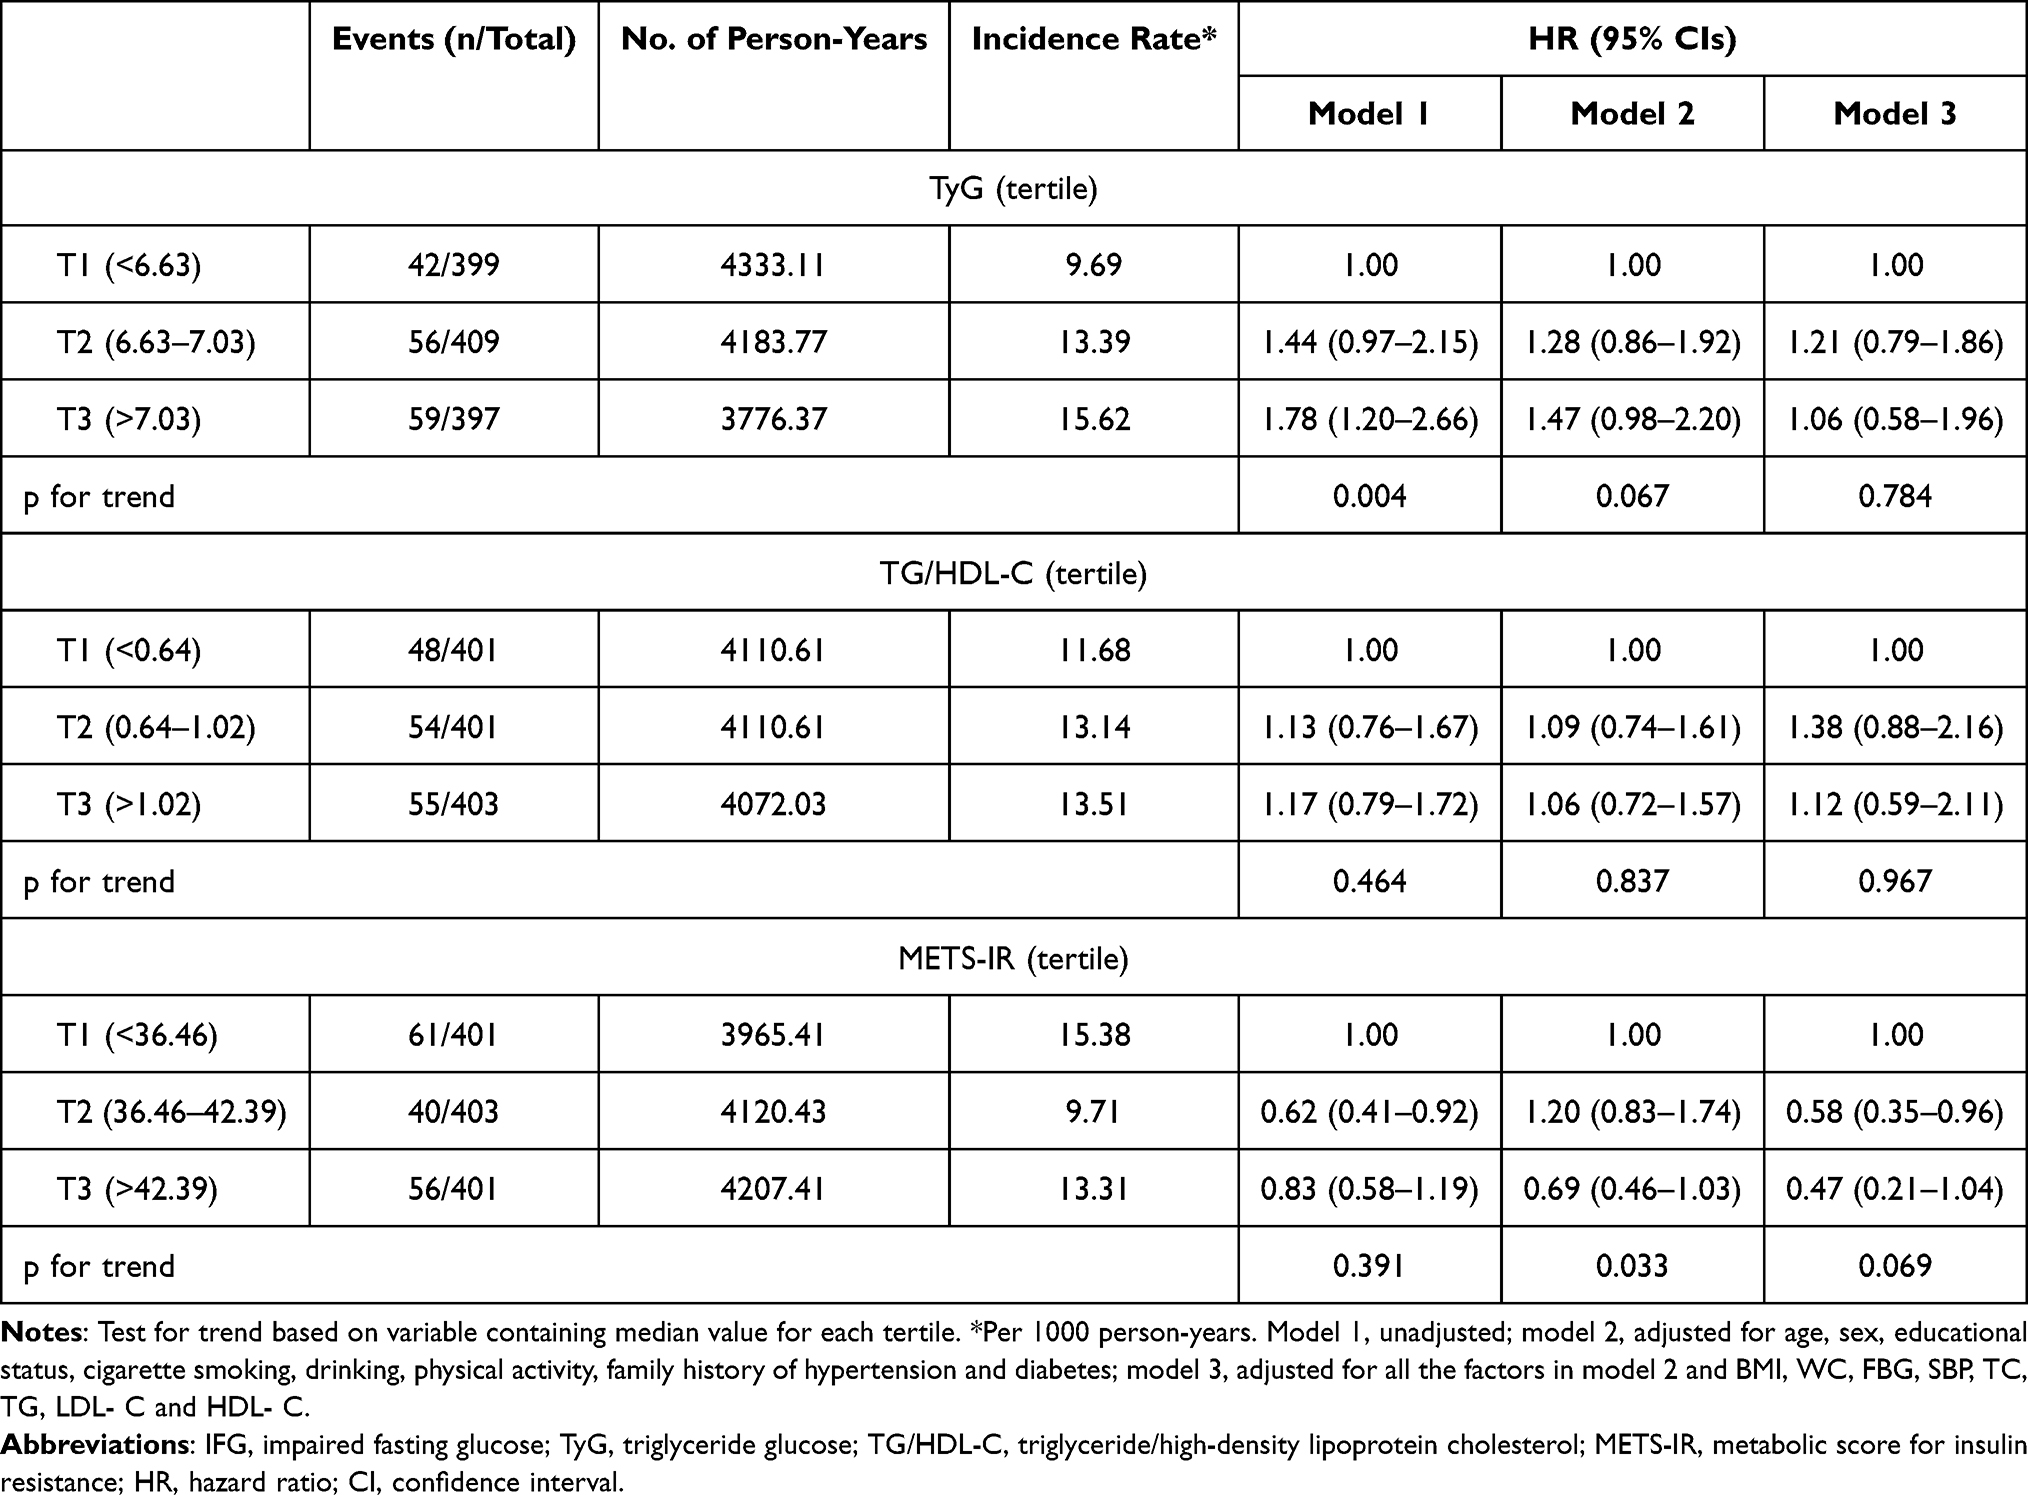 |
Table 3 Cox Proportional Hazards Regression Analysis of Risk of Incident IFG by Tertile of Baseline TyG Index, TG/HDL-C Ratio and METS-IR (n=1205) |
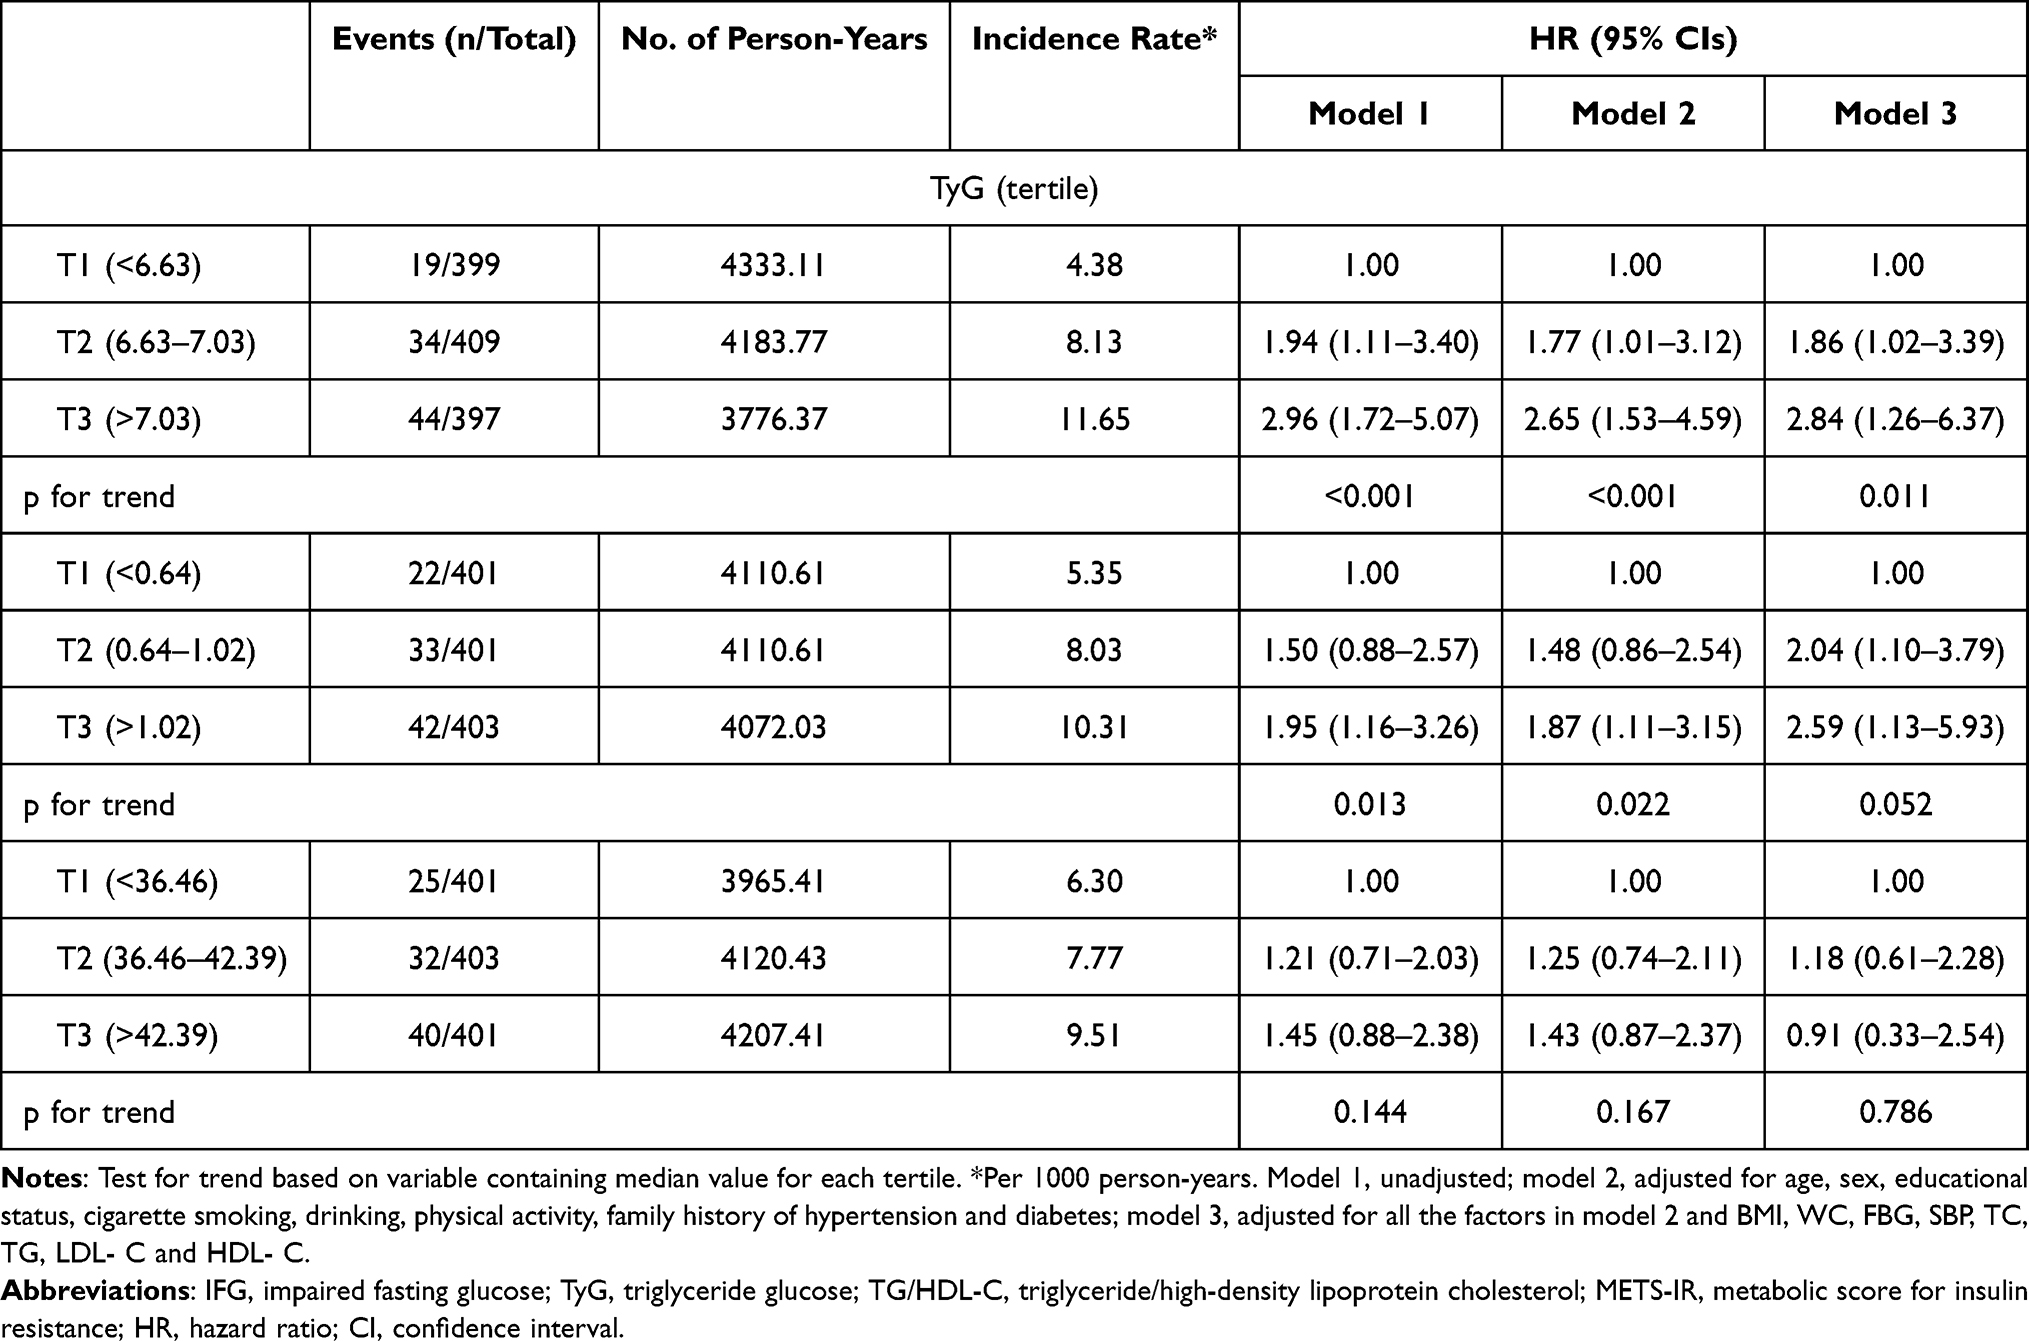 |
Table 4 Cox Proportional Hazards Regression Analysis of Risk of Incident T2DM by Tertile of Baseline TyG Index, TG/HDL-C Ratio and METS-IR (n=1205) |
Linear Relationship of the TyG Index with Risk of Incident T2DM
As the previous multivariable analysis suggested a linear correlation between the baseline TyG index and the risk of incident T2DM, restricted cubic spline curves based on the Cox regression model were used to examine the association between baseline indices and incident T2DM. The multivariate-adjusted baseline showed a linear relationship between the TyG index and the risk of incident T2DM (Figure 2).
 |
Figure 2 Linear relationship of the TyG index with risk of incident diabetes (p for linear=0.011). The model was adjusted for age, sex, educational status, cigarette smoking, drinking, physical activity, family history of hypertension and diabetes, BMI, WC, FBGSBP, TC, TG, LDL and HDL-C. Abbreviations: T2DM, type 2 diabetes mellitus; TyG, triglyceride glucose; CI, confidence interval; BMI, body mass index; WC, waist circumference; FBG, fasting blood glucose; SBP, systolic blood pressure; TC, total cholesterol; TG, triglyceride; LDL and HDL-C, low- and high-density lipoprotein cholesterol. |
Discussion
The baseline TyG index was significantly associated with a higher risk of developing T2DM in normoglycemic participants, indicating that a higher TyG index is an independent risk factor for T2DM, but this relationship did not occur between the baseline TyG index and IFG. In addition, we found that the baseline TG/HDL-C ratio and METS-IR were not associated with the risk of incident T2DM or IFG after controlling for potential confounding factors.
Our prospective study, which has a follow-up duration of 12.17 years, showed that the TyG index was associated with T2DM and had a linear relationship, which is consistent with most previous studies.14–16 A retrospective cohort study of obese participants with fasting normoglycemia showed that when participants had a BMI <25 kg/m2, the TyG index was independently associated with the incidence of T2DM after an average of 5.38 years of follow-up, which is a nearly linear relationship.22 Similarly, a prospective cohort study showed that the risk of incident T2DM increased with increasing TyG index in rural 5706 Chinese with normal weight, and the TyG index showed significant nonlinearity with T2DM risk.23 Another longitudinal cohort study of the Japanese population revealed a U-shaped association between the TyG index and incident T2DM.15 Results from a white European cohort with 4820 participants16 suggested that the TyG index was a better predictor of FPG risk than T2DM. Studies in Iranian24 and Korean populations25 reported similar results between the TyG index and incident T2DM. The reason underlying the association between the TyG index and the incidence of T2DM could be explained by the TyG index being a strong indicator of IR. In addition, a higher TyG index is independently associated with the incidence of cardiovascular disease.26 However, our study did not find a correlation between the TyG index and incident IFG.
The TG/HDL-C ratio is a feasible alternative index for HOMA-IR. Liu et al12 found a nonlinear relationship between the TG/HDL-C ratio and T2DM incidence in a retrospective cohort study in China. Other studies on Chinese populations also showed that the TG/HDL-C ratio was strongly positively related to the incidence of T2DM, which had a dose-response association.27,28 Studies in Korean adults showed that increased TG/HDL-C was significantly associated with the incidence of T2DM after 5.9 years of follow-up,29 and a similar result was found in Chinese Singaporeans.30 In American adults,31 the TG/HDL-C ratio is a risk factor for IR, IGT, and DM. This association is mainly due to its potential as a marker of IR. A previous study recruited four ethnic groups and reported that, apart from that noted in South Asian individuals, the TG/HDL-C ratio could predict IR32 in Aboriginal, Chinese, and European individuals. Our study confirmed that the TG/HDL-C ratio was not associated with IFG or T2DM, which may be because of the relatively small sample size or that the TG/HDL-C ratio is a more appropriate surrogate marker for IR in overweight and obese participants, whereas our participants’ averaged BMI was 23.53 kg/m2. Therefore, there may be limitations in its use as a reliable marker in our group; thus, further analysis with a larger sample size and weight stratification is needed.
METS-IR is a novel simple IR index that may be a vital indicator for identifying T2DM in different ethnic populations. A 2-year prospective cohort study in Mexico found that METS-IR is a novel score for screening for insulin sensitivity and that participants with incident T2DM had higher baseline METS-IR.33 In a rural Chinese population, increased METS-IR was positively associated with the risk of incident T2DM, demonstrating a significant dose response.34 The exact mechanism underlying the association between METS-IR and T2DM requires further exploration, which may be explained by FPG, TG, HDL-C, and BMI. As the glucose concentration increases, the level of reactive oxygen species in β-cells also increases, which may have toxic effects on β-cells and lead to functional impairment of islet β-cells, which, in turn, causes T2DM.34 TG, HDL-C, and BMI are indicators of obesity and are closely associated with T2DM. Our findings indicate that METS-IR is not a significant predictor of future T2DM or IFG development. This unexpected result also shows the need to further consider the role of METS-IR in increased FBG, especially in different obesity phenotypes. In addition, the close correlation between METS-IR and hypertension was only apparent in normal-weight individuals but not in overweight/obese participants, which is surprising because METS-IR calculations include BMI. In addition, some studies have found that METS-IR has a better predictive value for ischemic heart disease35 and prehypertension or hypertension among normoglycemic participants.36,37 This could help to analyze the association between METS-IR and other metabolic diseases.
Our study may provide additional insight to the association between three non-insulin-based IR indices and T2DM or IFG risk. This study has some limitations. First, we could not measure insulin or evaluate HOMA-IR in this study, but some studies have shown a good correlation between HOMA-IR and three non-insulin-based IR indices. Second, all the participants in this study were recruited from a rural population in China, and the sample size was relatively small; therefore, our results may not be generalizable to other populations. IFG and T2DM were defined according to fasting glucose levels, history of disease, or self-report at baseline and follow-up, which may partially underestimate the incidence of IFG and T2DM. And finally, there may other predictors in the onset of IFG or T2DM,38 but our study did not involve and compare the predictive value, which needed to explore in future studies.
Conclusion
The TyG index is more useful than the TG/HDL-C ratio and METS-IR for predicting T2DM in the normoglycemic population.
Abbreviations
BMI, body mass index; CI, confidence interval; DBP, diastolic blood pressure; FBG, fasting blood glucose; FPG, fasting plasma glucose; HDL-C, high-density lipoprotein cholesterol; HOMA-IR, insulin-based homeostasis model assessment index; HR, hazards ratio; IFG, impaired fasting glucose; IR, insulin resistance; LDL-C, low-density lipoprotein cholesterol; METS-IR, metabolic score for insulin resistance; OR, odds ratio; SBP, systolic blood pressure; T2DM, type 2 diabetes mellitus; TC, total cholesterol; TG, triglyceride; TG/HDL-C, triglyceride-to-high-density lipoprotein cholesterol; TyG, triglyceride-glucose; WC, waist circumference; WHtR, waist-to-height ratio.
Data Sharing Statement
The data that support the findings of this study are available from the corresponding author upon reasonable request.
Ethics Approval and Informed Consent
The study protocol was conducted in accordance with the guidelines of the Declaration of Helsinki and approved by the Medical Ethics Review Committee of the Ningxia Medical University. All participants consented to participate in the study and provided written informed consent.
Acknowledgments
We thank all the participants and staff included in this cross-sectional cohort study.
Author Contributions
YHZ and YZ conceived and designed research. XXL, YXX, YYD, WLL and QNW contributed to collect the data. XXL and YXX conducted experiments, analyzed data and drafted the manuscript. YHZ and YZ contributed to revise the paper. All authors contributed to data analysis, drafting or revising the article, have agreed on the journal to which the article will be submitted, gave final approval of the version to be published, and agree to be accountable for all aspects of the work.
Funding
This work was supported by the National Natural Science Foundation of China (grant number 81860603, 2019), the Natural Science Foundation of Ningxia Hui Autonomous Region (grant number 2020AAC03167, 2020), the Natural Science Foundation of Ningxia Province (grant number 2021AAC03128, 2021), and the university-level project of Ningxia Medical University (grant number XT2019010, 2019).
Disclosure
The authors report no conflicts of interest in this work.
References
1. Wang L, Peng W, Zhao Z., et al. Prevalence and treatment of diabetes in China, 2013–2018. JAMA. 2021;326(24):2498–2506. doi:10.1001/jama.2021.22208
2. IDF Diabetes Atlas. 10th ed. Brussels: International Diabetes Federation; 2021. Available from: https://diabetesatlas.org/.
3. Han Y, Zhang S, Chen S, Zhang J, Guo X, Yang X. Incidence and risk factors of type 2 diabetes mellitus in individuals with different fasting plasma glucose levels. Ther Adv Endocrinol Metab. 2020;11:2042018820928844. doi:10.1177/2042018820928844
4. Hashemi Madani N, Ismail-Beigi F, Poustchi H, et al. Impaired fasting glucose and major adverse cardiovascular events by hypertension and dyslipidemia status: the Golestan cohort study. BMC Cardiovasc Disord. 2020;20:113. doi:10.1186/s12872-020-01390-8
5. Rachdaoui N. Insulin: the friend and the foe in the development of type 2 diabetes mellitus. Int J Mol Sci. 2020;21(5):1770. doi:10.3390/ijms21051770
6. Kim JK. Hyperinsulinemic-euglycemic clamp to assess insulin sensitivity in vivo. Methods Mol Biol. 2009;560:221–238.
7. Matthews DR, Hosker JP, Rudenski AS, Naylor BA, Treacher DF, Turner RC. Homeostasis model assessment: insulin resistance and beta-cell function from fasting plasma glucose and insulin concentrations in man. Diabetologia. 1985;28(7):412–419. doi:10.1007/BF00280883
8. Liu XZ, Xu X, Zhu JQ, Zhao DB. Association between three non-insulin–based indexes of insulin resistance and hyperuricemia. Clin Rheumatol. 2019;38(11):3227–3233. doi:10.1007/s10067-019-04671-6
9. Thompson DS, Boyne MS, Osmond C, et al. Limitations of fasting indices in the measurement of insulin sensitivity in Afro-Caribbean adults. BMC Res Notes. 2014;7(1):98. doi:10.1186/1756-0500-7-98
10. Wang Z, Zhao L, He S. Triglyceride-glucose index as predictor for future type 2 diabetes mellitus in a Chinese population in southwest China: a 15-year prospective study. Endocrine. 2021;72(1):124–131. doi:10.1007/s12020-020-02589-7
11. Lee JW, Lim NK, Park HY. The product of fasting plasma glucose and triglycerides improves risk prediction of type 2 diabetes in middle-aged Koreans. BMC Endocr Disord. 2018;18(1):33. doi:10.1186/s12902-018-0259-x
12. Liu H, Yan S, Chen G, et al. Association of the ratio of triglycerides to high-density lipoprotein cholesterol levels with the risk of type 2 diabetes: a retrospective cohort study in Beijing. J Diabetes Res. 2021;2021:5524728. doi:10.1155/2021/5524728
13. Cai XT, Zhu Q, Liu SS, et al. Associations between the metabolic score for insulin resistance index and the risk of type 2 diabetes mellitus among non-obese adults: insights from a population-based cohort study. Int J Gen Med. 2021;14:7729–7740. doi:10.2147/IJGM.S336990
14. Liu EQ, Weng YP, Zhou AM, Zeng CL. Association between triglyceride-glucose index and type 2 diabetes mellitus in the Japanese population: a secondary analysis of a retrospective cohort study. Biomed Res Int. 2020;2020:2947067. doi:10.1155/2020/2947067
15. Xuan X, Hamaguchi M, Cao Q, et al. U-shaped association between the triglyceride-glucose index and the risk of incident diabetes in people with normal glycemic level: a population-base longitudinal cohort study. Clin Nutr. 2021;40(4):1555–1561. doi:10.1016/j.clnu.2021.02.037
16. Navarro-González D, Sánchez-íñigo L, Pastrana-Delgado J, Fernández-Montero A, Martinez JA. Triglyceride-glucose index (TyG index) in comparison with fasting plasma glucose improved diabetes prediction in patients with normal fasting glucose: the vascular-metabolic CUN cohort. Prev Med. 2016;86:99–105. doi:10.1016/j.ypmed.2016.01.022
17. Zhang Y, Qin P, Lou Y, et al. Association of TG/HDLC ratio trajectory and risk of type 2 diabetes: a retrospective cohort study in China. J Diabetes. 2020;13(5):402–412. doi:10.1111/1753-0407.13123
18. Lim TK, Lee HS, Lee YJ. Triglyceride to HDL-cholesterol ratio and the incidence risk of type 2 diabetes in community dwelling adults: a longitudinal 12-year analysis of the Korean genome and epidemiology study. Diabetes Res Clin Pract. 2020;163:108150. doi:10.1016/j.diabres.2020.108150
19. Liu H, Liu J, Liu J, Xin S, Lyu Z, Fu X. Triglyceride to high-density lipoprotein cholesterol (TG/HDL-C) ratio, a simple but effective indicator in predicting type 2 diabetes mellitus in older adults. Front Endocrinol. 2022;13:828581. doi:10.3389/fendo.2022.828581
20. Li X, Zhao Y, Jin Y, et al. Associations between serum adipocytokines and glycemic tolerance biomarkers in a rural Chinese population. PLoS One. 2017;12(8):e0182273. doi:10.1371/journal.pone.0182273
21. Balal M, Paydas S, Inal T, Demir E, Kurt C, Sertdemir Y. Validation of the Friedewald formula for the determination of low-density lipoprotein cholesterol in renal transplant recipients. Ren Fail. 2010;32(4):455–458. doi:10.3109/08860221003658266
22. Zou S, Yang C, Shen R, et al. Association between the triglyceride-glucose index and the incidence of diabetes in people with different phenotypes of obesity: a retrospective study. Front Endocrinol. 2021;12:784616. doi:10.3389/fendo.2021.784616
23. Zhang M, Wang B, Liu Y, et al. Cumulative increased risk of incident type 2 diabetes mellitus with increasing triglyceride glucose index in normal-weight people: the rural Chinese cohort study. Cardiovasc Diabetol. 2017;16(1):30. doi:10.1186/s12933-017-0514-x
24. Janghorbani M, Almasi SZ, Amini M. The product of triglycerides and glucose in comparison with fasting plasma glucose did not improve diabetes prediction. Acta Diabetol. 2015;52(4):781–788. doi:10.1007/s00592-014-0709-5
25. Lee SH, Kwon HS, Park YM, et al. Predicting the development of diabetes using the product of triglycerides and glucose: the Chungju metabolic disease cohort (CMC) study. PLoS One. 2014;9(2):e90430. doi:10.1371/journal.pone.0090430
26. Ding X, Wang X, Wu J, Zhang M, Cui M. Triglyceride-glucose index and the incidence of atherosclerotic cardiovascular diseases: a meta-analysis of cohort studies. Cardiovasc Diabetol. 2021;20(1):76. doi:10.1186/s12933-021-01268-9
27. Chen Z, Hu H, Chen M, et al. Association of triglyceride to high-density lipoprotein cholesterol ratio and incident of diabetes mellitus: a secondary retrospective analysis based on a Chinese cohort study. Lipids Health Dis. 2020;19(1):33. doi:10.1186/s12944-020-01213-x
28. Cheng C, Liu Y, Sun X, et al. Dose-response association between the triglycerides: high-density lipoprotein cholesterol ratio and type 2 diabetes mellitus risk: the rural Chinese cohort study and meta-analysis. J Diabetes. 2019;11(3):183–192. doi:10.1111/1753-0407.12836
29. Kim J, Shin SJ, Kim YS, Kang HT. Positive association between the ratio of triglycerides to high-density lipoprotein cholesterol and diabetes incidence in Korean adults. Cardiovasc Diabetol. 2021;20(1):183. doi:10.1186/s12933-021-01377-5
30. Wang YL, Koh WP, Talaei M, Yuan JM, Pan A. Association between the ratio of triglyceride to high-density lipoprotein cholesterol and incident type 2 diabetes in Singapore Chinese men and women. J Diabetes. 2017;9(7):689–698. doi:10.1111/1753-0407.12477
31. Liu Y, Gong R, Luo G, et al. Associations of triglycerides/high-density lipoprotein cholesterol ratio with insulin resistance, impaired glucose tolerance, and diabetes in American adults at different vitamin D3 levels. Front Endocrinol. 2022;12:735736. doi:10.3389/fendo.2021.735736
32. Gasevic D, Frohlich J, Mancini GB, Lear SA. The association between triglyceride to high-density-lipoprotein cholesterol ratio and insulin resistance in a multiethnic primary prevention cohort. Metabolism. 2012;61(4):583–589. doi:10.1016/j.metabol.2011.09.009
33. Bello-Chavolla OY, Almeda-Valdes P, Gomez-Velasco D, et al. METS-IR, a novel score to evaluate insulin sensitivity, is predictive of visceral adiposity and incident type 2 diabetes. Eur J Endocrinol. 2018;178(5):533–544. doi:10.1530/EJE-17-0883
34. Zhang M, Liu D, Qin P, et al. Association of metabolic score for insulin resistance and its 6-year change with incident type 2 diabetes mellitus. J Diabetes. 2021;13(9):725–734. doi:10.1111/1753-0407.13161
35. Yoon J, Jung D, Lee Y, Park B. The Metabolic Score for Insulin Resistance (METS-IR) as a predictor of incident ischemic heart disease: a longitudinal study among Korean without diabetes. J Pers Med. 2021;11(8):742. doi:10.3390/jpm11080742
36. Zhang X, Yu C, Ye R, Liu T, Chen X. Correlation between non-insulin–based insulin resistance indexes and the risk of prehypertension: a cross-sectional study. J Clin Hypertens. 2022;24:573–581. doi:10.1111/jch.14449
37. Han KY, Gu J, Wang Z, et al. Association between METS-ir and prehypertension or hypertension among normoglycemia subjects in Japan: a retrospective study. Front Endocrinol. 2022;13:851338. doi:10.3389/fendo.2022.851338
38. Xie X, Bai G, Liu H, et al. Early predictors in the onset of type 2 diabetes at different fasting blood glucose levels. Diabetes Metab Syndr Obes. 2021;14:1485–1492. doi:10.2147/DMSO.S301352
 © 2022 The Author(s). This work is published and licensed by Dove Medical Press Limited. The
full terms of this license are available at https://www.dovepress.com/terms
and incorporate the Creative Commons Attribution
- Non Commercial (unported, 3.0) License.
By accessing the work you hereby accept the Terms. Non-commercial uses of the work are permitted
without any further permission from Dove Medical Press Limited, provided the work is properly
attributed. For permission for commercial use of this work, please see paragraphs 4.2 and 5 of our Terms.
© 2022 The Author(s). This work is published and licensed by Dove Medical Press Limited. The
full terms of this license are available at https://www.dovepress.com/terms
and incorporate the Creative Commons Attribution
- Non Commercial (unported, 3.0) License.
By accessing the work you hereby accept the Terms. Non-commercial uses of the work are permitted
without any further permission from Dove Medical Press Limited, provided the work is properly
attributed. For permission for commercial use of this work, please see paragraphs 4.2 and 5 of our Terms.
Recommended articles
Linear Inverse Association Between Triglyceride Glucose-Body Mass Index and Osteoporosis in Patients with Type 2 Diabetes Mellitus: A Cross-Sectional Study
Zhou L, Zhang F, Wang Z, Kang Z
Diabetes, Metabolic Syndrome and Obesity 2026, 19:569521
Published Date: 6 January 2026