Back to Journals » Journal of Inflammation Research » Volume 17
Association of High‐Sensitivity C‐Reactive Protein and Lipoprotein‐Associated Phospholipase A2 with Metabolically Unhealthy Phenotype: A Cross Sectional Study
Authors Wang J, Yang S, Zhao L ![]()
Received 13 November 2023
Accepted for publication 28 December 2023
Published 6 January 2024 Volume 2024:17 Pages 81—90
DOI https://doi.org/10.2147/JIR.S447681
Checked for plagiarism Yes
Review by Single anonymous peer review
Peer reviewer comments 2
Editor who approved publication: Professor Ning Quan
Jiangang Wang,1,2 Saiqi Yang,1,2 Linlin Zhao1,2
1Health Management Center, The Third Xiangya Hospital, Central South University, Changsha, Hunan, 410013, People’s Republic of China; 2Health Management Research Center of Central South University, Changsha, Hunan, 410013, People’s Republic of China
Correspondence: Linlin Zhao, Email [email protected]
Objective: Whether the combination of high‐sensitivity C‐reactive protein (hs-CRP) and Lipoprotein‐associated Phospholipase A2 (Lp-PLA2) was an independent risk factor for metabolic unhealthy is unknown. This study aimed to evaluate the association between combining hs‐CRP and Lp‐PLA2 and metabolic unhealthy.
Methods: A total of 3198 participants who underwent routine health check-up examinations. The participants completed inflammation indicators (hs-CRP and Lp-PLA2) examination and physical assessments. Four phenotypes were determined according to obesity and metabolic health status. Meanwhile, the participants were divided into four groups according to the level of hs‐CRP and Lp‐PLA2. The cross-sectional association between hs‐CRP, Lp‐PLA2 and metabolic unhealthy was tested by logistic regression analysis.
Results: About 30.48%, 17.35%, 17.32% and 34.83% had MHNO, MUNO, MHO, and MUO, respectively. The combination of the hs‐CRP and Lp‐PLA2 levels was significantly correlated with metabolic unhealthy in non-obese subjects. However, in obese subjects, only hs-CRP level was significantly correlated with metabolic unhealthy.
Conclusion: The hs-CRP and Lp‐PLA2 together were significantly associated with metabolic unhealthy in non-obese subjects. hs-CRP level was significantly correlated with metabolic unhealthy in obese subjects.
Keywords: hs-CRP, Lp-PLA2, metabolically unhealthy, obese
Obesity prevalence is increasing worldwide and represents one of the greatest concerns to public health.1 However, obesity is a heterogeneous disease with different metabolic status. The majority of people with obesity are metabolically unhealthy obesity (MUO), and it is estimated that 20–30% of obese adults who remains at the level of metabolically healthy obesity (MHO).2 Currently, there is no accepted standard for defining MHO, and more than 30 different definitions have been used in various studies. In most studies, MHO was defined as having ≤2 of the following components: high systolic and diastolic blood pressures, high plasma TG concentration, low HDL-C concentration, and high fasting blood glucose. Although MHO individuals exhibit an excess body mass index (BMI), they have no other metabolic complications and have relatively normal insulin sensitivity,3 moreover, they appear to be more resistant to obesity-related comorbidities.2,4 Previous studies demonstrated that metabolic unhealthy individuals had higher cardiovascular disease (CVD) risk and all-cause mortality than that of metabolically healthy individuals irrespective of BMI.5,6 Alternatively, it is possible that MHO represent transitional phases from no obesity to obesity as a natural phenomenon, that is, MHO phenotype seems to be a transient state which is ultimately turning into MUO. Thus, they have similar risks of CVD. Understanding which factors play a role in metabolic unhealthy state is therefore great. It is possible to stop or delay the natural course of obesity at some stage of its development through control of risk factors before it becomes metabolically unhealthy. Increased oxidative stress can be one of the ways leading to obesity-related metabolic disorders.7 Recent results indicate that obesity and insulin resistance play the most important role in the relationship between metabolic syndrome and oxidative stress.8 It is worth mentioning that systemic inflammation is known to induce insulin resistance and oxidative stress.9 Significantly, metabolic healthy or metabolic unhealthy associate with different inflammatory profiles. Inflammatory status has been reported to be more favorable among metabolically healthy subjects at the same BMI in several studies.10,11 The protective mechanism of metabolic healthy obese is partly due to a reduced inflammatory response.12 In view of this, inflammation has also been incorporated as a component of metabolic unhealthy in some studies. However, different results have also been reported.13 Therefore, to what extent metabolic differences are explained by chronic inflammation among the four phenotypes is still a matter of debate. High-sensitivity C-reactive protein (hs-CRP) is a biomarker for systemic inflammation, synthesizing through the liver under stress and provides a useful indicator of chronic inflammation. Lp-PLA2 is primarily secreted by macrophages and is a specific marker of vascular inflammation. The observed Hs-CRP correlations with Lp-PLA2 are typically weak.14,15 Lp-PLA2 predicts the risk for CVD events independent and complementary to hs-CRP,16 and when both hs-CRP and Lp-PLA2 were elevated, the risk for CVD events increased.17 However, the relationship of hs‐CRP combined with Lp‐PLA2 and metabolic unhealthy is less clear. We hypothesize that the combination of hs‐CRP and Lp‐PLA2 levels was significantly associated with metabolic unhealthy. In this cross-sectional study based on health checkup participants, we compared hs‐CRP and Lp‐PLA2 levels in different metabolic status and BMI categories. The relationship between hs-CRP combined with Lp‐PLA2 and metabolic health status was further investigated in no obesity and in obesity.
Methods
Participants and Study Design
An urban and rural cross-sectional study was conducted with participants who attended routine health examinations at the Third Xiangya Hospital of Central South University located in southern China (Changsha). Previous studies have described the study population. The participants completed the inflammation indicators (hs-CRP and Lp-PLA2) examination and physical assessments between 1 January 2019 and 31 December 2021. If the subjects had more than one annual exam, we only used the first record of that year to avoid double counts. We further excluded the participants who met the following criteria (1) body mass index (BMI) ≤ 18.5 kg/m2 (n = 95); (2) a history of cancer (n = 27); (3) no available data on key variables, including fasting blood glucose (FBG), blood pressure (BP), triglyceride (TG) and high-density lipoprotein cholesterol (HDL-C) (n = 277). To prevent bias, all potential subjects meeting these criteria were included (n = 3198). The flow chart of the study is shown in Figure 1.
 |
Figure 1 Flow chart of the study. hs‐CRP+ was defined as ≥3 m g/L, hs‐CRP- was defined as <3 m g/L; Lp‐PLA2+ was defined as ≥200 ng/mL, Lp‐PLA2- was defined as <200 ng/mL. Abbreviations: hs-CRP, high‐sensitivity C‐reactive protein, Lp-PLA2, Lipoprotein‐associated Phospholipase A2; MHNO, metabolically healthy no obesity; MUNO, metabolically unhealthy no obesity; MHO, metabolically healthy obesity; MUO, metabolically unhealthy obesity; BMI, body mass index; FBG, fasting blood glucose; BP, blood pressure; TG, triglyceride; HDL-C, high-density lipoprotein cholesterol. |
The study protocols were approved by the Institutional Review Board at the Third Xiangya Hospital (No. 2019-S451). All subjects provided their written informed consent for participation in the study, and no incentives were offered to the participants.
Anthropometric Measurements and Laboratory Measurements
Anthropometric measurements and laboratory examination were conducted as previously described,18 and health-related habits and disease history were collect through self-reported health questionnaires on website (https://new.selfhealth.com.cn/#/login).19
Fasting serum samples collected in the morning from the antecubital vein. The serum Lp-PLA2 concentration was measured by lucigenin-enhanced immunochemiluminescence method according to the manufacturer’s instructions (Nanjing Norman Biological Technology Co., Ltd., China). Intra- and inter-assay coefficients of variation were <10%. The participants were categorized into 2 groups by Lp-PLA2 concentrations: high level (high Lp‐PLA2, ≥200 ng/mL) and low level (low Lp‐PLA2, <200 ng/mL). Fasting serum high-sensitive C-reactive protein (hs-CRP) levels were analysed by latex turbidimetric immunoassay (Hitachi 7600–110; Hitachi, Tokyo, Japan). The imprecision estimate for hs-CRP was <5%. The participants were categorized into 2 groups as follows: high level (high hs‐CRP, ≥3 mg/L) and low level (low hs‐CRP, <3 mg/L). Ultimately, the participants were divided into 4 groups: low hs‐CPR/low Lp‐PLA2, high hs‐CRP/low Lp‐PLA2, low hs‐CRP/high Lp‐PLA2, and high hs‐CRP/high Lp‐PLA2.
baPWV Measurements
Brachial–ankle pulse wave velocity (baPWV) was measured in a quiet, temperature-controlled room. After the participants rested for a minimum of 5 min in the supine position, an automatic waveform analyzer (BP-203 RPE III, Omron Health Medical, Dalian, China) was used to measure the baPWV according to previous study.20 In brief, the measurements were performed twice, and the average reading of the left-side and right-side assessment was thereafter calculated.
Assessment of BMI Categories and Metabolic Health Status
Obesity was defined as a BMI ≥25 kg/m2 based on Asian-specific criteria.21
Metabolic health was determined using the 2009 International Diabetes Federation (IDF)22 and the third report of the National Cholesterol Education Program Adult Treatment Panel III (NCEP-ATP III) definitions23 as in previous studies:13 blood pressure ≥130/85 mmHg or previous diagnosis of hypertension or receiving treatment for hypertension; FPG ≥5.6 mmol/L mmol/L or self-reported diabetes; reduced plasma HDL-C (<1.0 mmol/L for men and <1.3 mmol/L for women) or using lipid-lowering drugs; and elevated plasma TG (≥1.7 mmol/L) or using lipid-lowering drugs. Individuals with 0 to 2 components were identified as having metabolically healthy, and being metabolically unhealthy was determined as having 3 or more of the abnormal metabolism described above. Based on BMI and metabolic status, participants were classified into four groups: (1) metabolically healthy no obesity (MHNO), (2) metabolically unhealthy no obesity (MUNO), (3) metabolically healthy obesity (MHO), and (4) metabolically unhealthy obesity (MUO).
Statistical Analysis
Shapiro–Wilk test was used for checking if the continuous variables were normally distributed. Statistical significance for continuous variables was assessed using one-way ANOVA or nonparametric test (Kruskal–Wallis test). Categorical variables were presented as percentages and were compared using the chi‐square test. The differences of hs-CRP and LP-PLA2 among the 4 groups were visually examined using box plots. The cross-sectional relationship between hs‐CRP, Lp‐PLA2 and metabolic unhealthy was tested by logistic regression analysis. The effect sizes of statistical associations in this study were quantified by odd ratios (OR) and 95% confidence intervals (CI). Variables that were adjusted to control for confounders were adjusted in the model including age, sex, smoking, drinking, exercise, sleep, all measured at baseline. All statistical tests were two‐sided, and the significance level was set as P < 0.05. In addition, sensitivity analyses were conducted to assess the robustness of the results by rerunning all models in subjects without hypertension, diabetes, and nonalcoholic fatty liver disease (NAFLD). All comparisons were performed using SPSS 26.0 for Windows (IBM Corporation, New York, NY, USA). Missing values were imputed using multiple imputations.
Results
Characteristics Associated with a Metabolically Phenotype Among Non-Obese and Obese Individuals
A total of 3198 individuals were assessed and provided data for all parameters used to define metabolic status.47.84% of the participants were no obesity (18.5 kg/m2≤BMI<25 kg/m2), 52.16% individuals were obese (BMI≥25 kg/m2), 30.48%, 17.35%, 17.32% and 34.83% had MHNO, MUNO, MHO, and MUO, respectively. Table 1 summarizes the characteristics of the population.
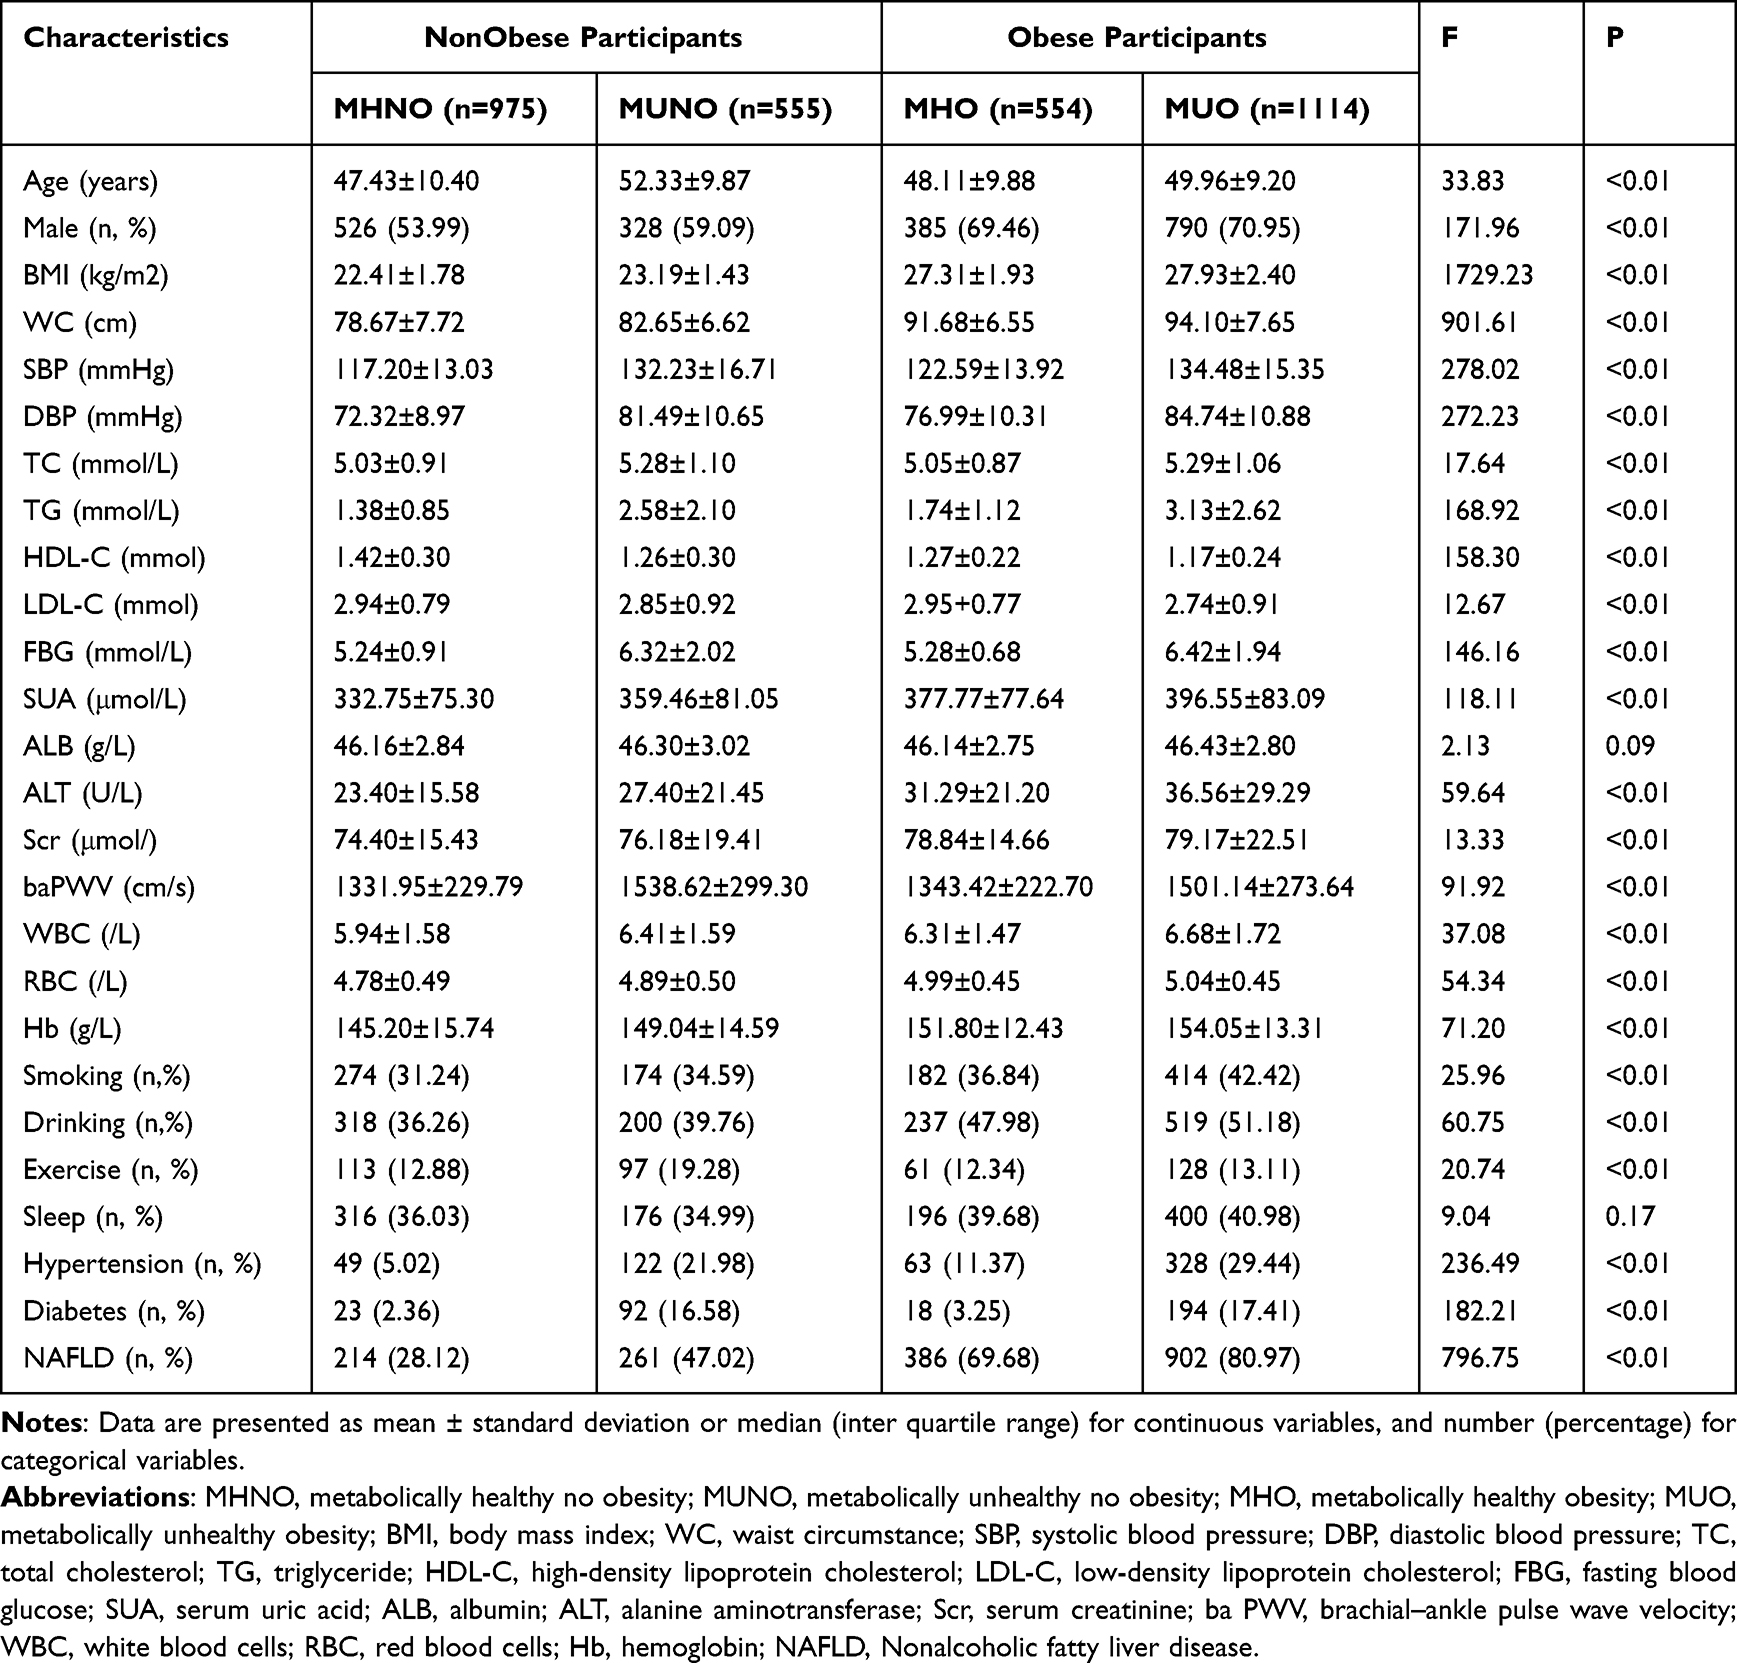 |
Table 1 Characteristics of the Study Sample |
In general, the clinical and routine laboratory indices, such as waist circumference (WC), total cholesterol (TC), serum uric acid (SUA), alanine aminotransferase (ALT), serum creatinine (Scr), brachial–ankle pulse wave velocity (baPWV), white blood cells (WBC), red blood cells (RBC), and hemoglobin (Hb) were clearly higher in metabolic unhealthy groups than those in metabolically healthy groups regardless of whether they are obese. Of the indicators, we found that WC, SUA, ALT, Scr, RBC, and Hb were higher in obese subjects (MHO group and MUO group) than those in non-obese subjects (MHNO group and MUNO group), while TC, baPWV and WBC were higher in MUNO group than those in MHO group. In terms of history of hypertension, diabetes, and Nonalcoholic fatty liver disease (NAFLD), the prevalence of NAFLD in obese subjects was significantly higher than in non-obese subjects, while the prevalence of hypertension and diabetes in MUNO group was significantly higher than in MHO group.
When the information of demographics and life styles were considered, compared with individuals with metabolic unhealthy phenotypes, individuals who were metabolic health tended to be younger and more likely to be female; they were also less likely to smoke or drink.
Missing data were excluded in these analyses, because there were few missing data (325 missing baPWV data, 348 missing smoking data, 310 missing drinking data, 347 missing exercise, and 348 missing sleep data). No significant difference was observed with baPWV (p = 1.00), smoking (p = 1.00), drinking (p = 0.63) and exercise (p = 0.74) in multiple imputation sensitivity analysis.
Profiles of Inflammation Based on BMI Categories and Metabolic Health Status
According to metabolic health status by BMI category, hs-CRP and Lp-PLA2 concentrations of the subjects are shown in Figure 2. hs-CRP and Lp-PLA2 differed significantly among the four groups (P < 0.05).
 |
Figure 2 The level of hs-CRP and LP-PLA2 in four groups. Abbreviations: hs-CRP, high‐sensitivity C‐reactive protein; Lp-PLA2, Lipoprotein‐associated Phospholipase A2; MHNO, metabolically healthy no obesity; MUNO, metabolically unhealthy no obesity; MHO, metabolically healthy obesity; MUO, metabolically unhealthy obesity. |
In non-obese subjects, post hoc LSD tests found that hs-CRP was significantly higher in metabolically unhealthy individuals compared with metabolically healthy individuals. In obese subjects, however, hs-CRP was not significantly different between metabolic healthy and unhealthy obese individuals. In addition, hs-CRP in obese and non-obese individuals showed significant differences from metabolically healthy individuals. As for Lp-PLA2, the difference between MHNO and MUO was significant.
The Distribution of hs-CRP Combined with LP-PLA2 in BMI/Metabolic Category
High hs‐CRP was defined as ≥3 m g/L; high Lp‐PLA2 was defined as ≥200 ng/mL.
As shown in Figure 3, in each group, low hs-CRP/low LP-PLA2 accounted for the majority of subjects (54.13–66.67%) and a downward trend was found in MHNO, MUNO, MHO and MUO groups. Meanwhile, there were significant differences between the MHNO and MUO, MHNO, and MUO according to Bonferroni post hoc analysis. The proportion of subjects with high hs-CRP/high LP-PLA2 exhibited an upward trend in the above four groups, increasing from 2.46% to 9.51%. Meanwhile, there were significant differences between the MHNO and MUNO group, MHNO and MHO group, MHNO and MUO group according to Bonferroni post hoc analysis. Similar trend was seen in the high hs-CRP/low LP-PLA2 group, while it was not seen in the low hs-CRP/highLP-PLA2 group.
 |
Figure 3 The distribution of hs-CRP combined with LP-PLA2 in four groups. hs‐CRP+ was defined as ≥3 m g/L, hs‐CRP- was defined as <3 m g/L; Lp‐PLA2+ was defined as ≥200 ng/mL, Lp‐PLA2- was defined as <200 ng/mL. Abbreviations: hs-CRP, high‐sensitivity C‐reactive protein; Lp-PLA2, Lipoprotein‐associated Phospholipase A2; MHNO, metabolically healthy no obesity; MUNO, metabolically unhealthy no obesity; MHO, metabolically healthy obesity; MUO, metabolically unhealthy obesity. |
Correlation Between hs‐CRP Combined with Lp‐PLA2, and Metabolic Health Status
The associations between inflammatory indexes (hs-CRP, Lp‐PLA2) and metabolic health status were further investigated in no obesity (n = 1530) and in obesity (n = 1668). As shown in Figure 4, in no obesity, taking low hs-CRP/low Lp‐PLA2 group as reference, subjects of high hs-CRP/high Lp‐PLA2 were over 2-fold the risk of developing metabolic unhealthy both in the crude model (OR = 2.67, 95% CI = 1.56–4.56) and in age, sex, smoking, drinking and exercise adjusted model (OR = 3.15, 95% CI = 1.69–5.89), and the ORs reached statistical significance (p < 0.01), whereas no such connection was found in the obese group.
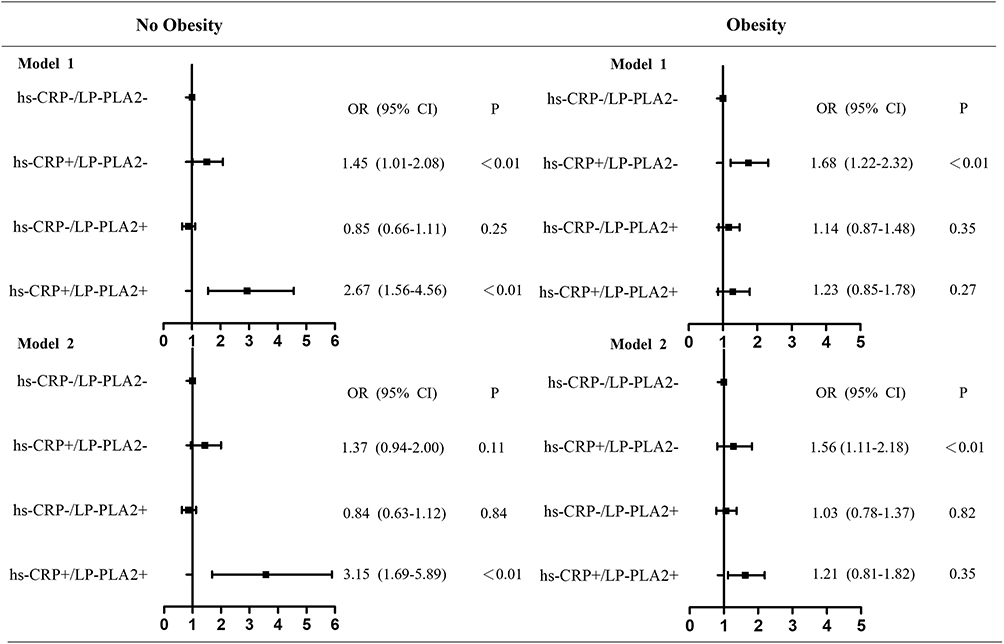 |
Figure 4 Relationship of hs-CRP combined with Lp‐PLA2 and metabolic health status in no obesity and obesity subjects. hs‐CRP+ was defined as ≥3 m g/L, hs‐CRP- was defined as <3 m g/L; Lp‐PLA2+ was defined as ≥200 ng/mL, Lp‐PLA2- was defined as <200 ng/mL. Model 1, no adjustments; Model 2, adjusted for age, sex, smoking, drinking, exercise, and sleep. Abbreviations: hs-CRP, high‐sensitivity C‐reactive protein; Lp-PLA2, Lipoprotein‐associated Phospholipase A2. |
Discussion
In this cross-sectional study based on health checkup participants, we compared the concentration of hs-CRP and LP-PLA2 in each group. In the non-obese subjects, hs-CRP was significantly higher in the MUNO group than that in the MHNO group. In obese subjects, however, hs-CRP was not significantly different between MHO group and MUO group. This result is similar to previous studies,13,24 even CRP was found decreased in MUO group in other study.25 In addition, interestingly, hs-CRP in metabolically healthy individuals was significantly elevated in the obese group than that in non-obese. However, in metabolically unhealthy subjects, there was not significantly different between MUNO group and MUO group. hs-CRP is a commonly used biomarker of systemic chronic inflammation. Both obese and metabolic unhealthy are considered independently associated with the inflammatory profile.26 This might be a probable cause of the above results observed in this study. When only one factor, obese or metabolism, was presented, a significant difference was observed between groups (MHNO vs MHO, MUNO vs MHNO), and when obese and metabolism were presented simultaneously, there was no significant difference between groups (MUNO vs MUO, MHO vs MUO). Furthermore, visceral adipose tissue is a more prominent source of inflammatory adipokines than other fat depots.27,28
In this study, we did not discriminate between overall and abdominal obesity. BMI does not capture information on body fat distribution; meanwhile, BMI cannot be used to differentiate excess fat from bone or muscle mass. This was also a possible reason for the results. Thirdly, the associations between inflammatory markers and MHO depend on the definition used.29 Therefore, the novel precise definition of MHO is necessary, fat mass and fat distribution should be considered first instead of only BMI.
As for Lp-PLA2, only the MHNO group significantly differed from the MUO group. Lp-PLA2 is the sole enzyme responsible for the hydrolysis of oxidized phospholipids (oxPL) on LDL particles in atherosclerosis plaques. Lp-PLA2 plays a significant role in the development of atherosclerotic plaque30 and is considered as a biomarker of vulnerability of atherosclerosis plaques.31 We found that there was no significant difference in the metabolic health group and metabolic unhealthy group regardless of whether the subjects were obese or no obese. The same is true as far as metabolic status is concerned. However, the difference in MHNO and MUO was significant. Thus, MUO requires special attention to Lp-PLA2 level. Recent study indicates that MUO individuals have larger visceral fat areas (VFAs), and they also have greater circulating Lp-PLA2 activity compared to MHO individuals.32 Another study suggests that subjects with a central overweight status have a greater Lp-PLA2 level than those with normal weight and a peripheral overweight status.33 The results illustrate that the association between Lp-PLA2 and different obesity indicators and the potential mechanisms deserve further investigation.
Next, we found that the combination of hs‐CRP and Lp‐PLA2 levels was significantly correlated with metabolic unhealthy in non-obese subjects, and the significant association was still present even after was still exist even after being adjusted for multi-variables, suggesting that combined hs‐CRP and Lp‐PLA2 was an independent risk factor for metabolic unhealthy in non-obese subjects. The ORs of high hs-CRP/high Lp‐PLA2 group were higher than the ORs of high hs-CRP/low Lp‐PLA2 group and low hs-CRP/high Lp‐PLA2 group, indicating the synergism of hs‐CRP and Lp‐PLA2 on metabolic unhealthy in non-obese subjects. However, in obese subjects, only hs-CRP level was significantly correlated with metabolic unhealthy with and without adjustment for age, sex, smoking, drinking, exercise, and sleep (Figure 4). The association between Lp-PLA2 mass and the risk of metabolic unhealthy failed to reach significance whether in non-obese group or in the obese group. Potential reason for this result is that Lp-PLA2 is biomarker for coronary event risk,34 as Lp-PLA2 is produced by macrophages and foam cells within atherosclerotic vulnerable plaques. Lp-PLA2 could promote modification of LDL, and the modified LDL is a key initiation step in endothelial activation and atherosclerotic-plaque rupture events.34 It is possible that a large proportion of metabolic unhealthy subjects did not have atherosclerotic vulnerable plaques.35 Additionally, Lp-PLA2 predominantly associates with LDL,30 and lowering LDL levels may have an impact on Lp-PLA2 levels. As metabolic unhealthy was defined without LDL, we also found that the LDL was significantly decreased in MUNO than MHNO (p < 0.05) and significantly decreased in MUO than MHO (p < 0.05). The above results demonstrated that hs-CRP and LP-PLA2 may have different roles in predicting metabolic unhealthy, and different BMI status should focus on different inflammatory indicators. Some studies use systemic inflammation markers such as CRP as criteria for defining metabolic unhealthy; however, we found that the correlation between hs-CRP and the risk of metabolic unhealthy did not reach significance in non-obese subjects. The hs-CRP and Lp‐PLA2 together were significantly associated with metabolic unhealthy in non-obese subjects. It prompted us that BMI should be considered when using hs-CRP as criteria for defining metabolic unhealthy.
There were several study limitations. Firstly, the study population was obtained from a physical examination population, so the generalization of the results may be limited. Secondly, hs-CRP and LP-PLA2 were determined at one time point, and they may fluctuate during the day. Finally, the cross-sectional study design limits our ability to draw cause-effect inference.
Overall, we found that the hs-CRP and Lp‐PLA2 together were significantly associated with metabolic unhealthy in non-obese subjects. hs-CRP level was significantly correlated with metabolic unhealthy in obese subjects. Our findings suggested that hs-CRP and LP-PLA2 may have different roles in predicting metabolic unhealthy, and different BMI status should focus on different inflammatory indicators.
Ethical Standards Disclosure
This study was conducted according to the guidelines laid down in the Declaration of Helsinki, and all procedures involving research study participants were approved by the Institutional Review Board at the Third Xiangya Hospital (No. 2019-S451). Written informed consent was obtained from all subjects.
Author Contributions
All authors made a significant contribution to the work reported, whether that is in the conception, study design, execution, acquisition of data, analysis and interpretation, or in all these areas; took part in drafting, revising or critically reviewing the article; gave final approval of the version to be published; have agreed on the journal to which the article has been submitted; and agree to be accountable for all aspects of the work.
Funding
This research was funded by the National Natural Science Foundation of China (No. 82174194 and 81703963).
Disclosure
The authors report no conflicts of interest in this work.
References
1. Di Angelantonio E, Bhupathiraju SN, Wormser D, et al; Global, B. M. I. M. C. Body-mass index and all-cause mortality: individual-participant-data meta-analysis of 239 prospective studies in four continents. Lancet. 2016;388(10046):776–786. doi:10.1016/S0140-6736(16)30175-1
2. Karelis AD, Brochu M, Rabasa-Lhoret R. Can we identify metabolically healthy but obese individuals (MHO)? Diabetes Metab. 2004;30(6):569–572. doi:10.1016/S1262-3636(07)70156-8
3. Smith GI, Mittendorfer B, Klein S. Metabolically healthy obesity: facts and fantasies. J Clin Invest. 2019;129(10):3978–3989. doi:10.1172/JCI129186
4. Karelis AD. Metabolically healthy but obese individuals. Lancet. 2008;372(9646):1281–1283. doi:10.1016/S0140-6736(08)61531-7
5. Lassale C, Tzoulaki I, Moons KGM, et al. Separate and combined associations of obesity and metabolic health with coronary heart disease: a pan-European case-cohort analysis. Eur Heart J. 2018;39(5):397–406. doi:10.1093/eurheartj/ehx448
6. Aung K, Lorenzo C, Hinojosa MA, Haffner SM. Risk of developing diabetes and cardiovascular disease in metabolically unhealthy normal-weight and metabolically healthy obese individuals. J Clin Endocrinol Metab. 2014;99(2):462–468. doi:10.1210/jc.2013-2832
7. Dandona P, Mohanty P, Ghanim H, et al. The suppressive effect of dietary restriction and weight loss in the obese on the generation of reactive oxygen species by leukocytes, lipid peroxidation, and protein carbonylation. J Clin Endocrinol Metab. 2001;86(1):355–362. doi:10.1210/jcem.86.1.7150
8. Jakubiak GK, Osadnik K, Lejawa M, et al. Obesity and insulin resistance is the component of the metabolic syndrome most strongly associated with oxidative stress. Antioxidants. 2021;11(1). doi:10.3390/antiox11010079
9. Chen L, Chen R, Wang H, Liang F. Mechanisms linking inflammation to insulin resistance. Int J Endocrinol. 2015;2015:508409. doi:10.1155/2015/508409
10. Ferreira FG, Reitz LK, Valmorbida A, et al. Metabolically unhealthy and overweight phenotypes are associated with increased levels of inflammatory cytokines: a population-based study. Nutrition. 2022;96:111590. doi:10.1016/j.nut.2022.111590
11. Phillips CM, Perry IJ. Does inflammation determine metabolic health status in obese and nonobese adults? J Clin Endocrinol Metab. 2013;98(10):E1610–E1619. doi:10.1210/jc.2013-2038
12. Succurro E, Marini MA, Frontoni S, et al. Insulin secretion in metabolically obese, but normal weight, and in metabolically healthy but obese individuals. Obesity. 2008;16(8):1881–1886. doi:10.1038/oby.2008.308
13. Gonzalez-Gil EM, Cadenas-Sanchez C, Santabarbara J, et al. Inflammation in metabolically healthy and metabolically abnormal adolescents: the HELENA study. Nutr Metab Cardiovasc Dis. 2018;28(1):77–83. doi:10.1016/j.numecd.2017.10.004
14. Constantinides A, de Vries R, van Leeuwen JJ, et al. Simvastatin but not bezafibrate decreases plasma lipoprotein-associated phospholipase A(2) mass in type 2 diabetes mellitus: relevance of high sensitive C-reactive protein, lipoprotein profile and low-density lipoprotein (LDL) electronegativity. Eur J Intern Med. 2012;23(7):633–638. doi:10.1016/j.ejim.2012.05.008
15. O’Donoghue M, Morrow DA, Sabatine MS, et al. Lipoprotein-associated phospholipase A2 and its association with cardiovascular outcomes in patients with acute coronary syndromes in the PROVE IT-TIMI 22 (PRavastatin Or atorVastatin Evaluation and Infection Therapy-Thrombolysis In Myocardial Infarction) trial. Circulation. 2006;113(14):1745–1752. doi:10.1161/CIRCULATIONAHA.105.612630
16. Anderson JL. Lipoprotein-associated phospholipase A2: an independent predictor of coronary artery disease events in primary and secondary prevention. Am J Cardiol. 2008;101(12A):23F–33F. doi:10.1016/j.amjcard.2008.04.015
17. Ballantyne CM, Hoogeveen RC, Bang H, et al. Lipoprotein-associated phospholipase A2, high-sensitivity C-reactive protein, and risk for incident coronary heart disease in middle-aged men and women in the Atherosclerosis Risk in Communities (ARIC) study. Circulation. 2004;109(7):837–842. doi:10.1161/01.CIR.0000116763.91992.F1
18. Zhao L, Qiu X. Higher ratio of serum uric acid to serum creatinine (SUA/SCr) increases the risk of metabolic unhealthy phenotype. Nutr Metab Cardiovasc Dis. 2023;33(10):1981–1988. doi:10.1016/j.numecd.2023.07.013
19. Wang Y, Zhu X, Chen Z, et al. Natural histories of metabolite BMI phenotypes and their impacts on cardiovascular disease risk over a decade-long follow-up. Obes Res Clin Pract. 2021;15(6):579–586. doi:10.1016/j.orcp.2021.10.002
20. Lu Y, Pechlaner R, Cai J, et al. Trajectories of age-related arterial stiffness in Chinese men and women. J Am Coll Cardiol. 2020;75(8):870–880. doi:10.1016/j.jacc.2019.12.039
21. World Health Organization. Western Pacific Region, International Association for the Study of Obesity. The Asia-Pacific Perspective. World Health Organization; 2000.
22. Alberti KG, Eckel RH, Grundy SM, et al. Harmonizing the metabolic syndrome: a joint interim statement of the international diabetes federation task force on epidemiology and prevention; National Heart, Lung, and Blood Institute; American Heart Association; World Heart Federation; International Atherosclerosis Society; and International Association for the Study of Obesity. Circulation. 2009;120(16):1640–1645. doi:10.1161/CIRCULATIONAHA.109.192644
23. Panel on Detection, Evaluation, and Treatment of High Blood Cholesterol in Adults, E. Executive summary of the third report of the National Cholesterol Education Program (NCEP) expert panel on detection, evaluation, and treatment of high blood cholesterol in adults (adult treatment panel III). JAMA. 2001;285(19):2486–2497. doi:10.1001/jama.285.19.2486
24. Cӑtoi AF, Parvu AE, Andreicut AD, et al. Metabolically healthy versus unhealthy morbidly obese: chronic inflammation, nitro-oxidative stress, and insulin resistance. Nutrients. 2018;10(9):1199. doi:10.3390/nu10091199
25. Stenzel AP, Carvalho R, Jesus P, et al. Serum antioxidant associations with metabolic characteristics in metabolically healthy and unhealthy adolescents with severe obesity: an observational study. Nutrients. 2018;10(2):150. doi:10.3390/nu10020150
26. Wildman RP, Kaplan R, Manson JE, et al. Body size phenotypes and inflammation in the women’s health initiative observational study. Obesity. 2011;19(7):1482–1491. doi:10.1038/oby.2010.332
27. Xu XJ, Gauthier MS, Hess DT, et al. Insulin sensitive and resistant obesity in humans: AMPK activity, oxidative stress, and depot-specific changes in gene expression in adipose tissue. J Lipid Res. 2012;53(4):792–801. doi:10.1194/jlr.P022905
28. Murano I, Barbatelli G, Parisani V, et al. Dead adipocytes, detected as crown-like structures, are prevalent in visceral fat depots of genetically obese mice. J Lipid Res. 2008;49(7):1562–1568. doi:10.1194/jlr.M800019-JLR200
29. Marques-Vidal P, Velho S, Waterworth D, Waeber G, Kanel VR. The association between inflammatory biomarkers and metabolically healthy obesity depends of the definition used. Eur J Clin Nutr. 2012;66(4):426–435. doi:10.1038/ejcn.2011.170
30. Dennis EA, Cao J, Hsu YH, Magrioti V, Kokotos G. Phospholipase A2 enzymes: physical structure, biological function, disease implication, chemical inhibition, and therapeutic intervention. Chem Rev. 2011;111(10):6130–6185. doi:10.1021/cr200085w
31. Bonnefont-Rousselot D. La Lp-PLA2, marqueur d’inflammation vasculaire et de vulnérabilité de la plaque d’athérosclérose [Lp-PLA2, a biomarker of vascular inflammation and vulnerability of atherosclerosis plaques]. Ann Pharm Fr. 2016;74(3):190–197. French. doi:10.1016/j.pharma.2015.09.002
32. Kim M, Yoo HJ, Ko J, Lee JH. Metabolically unhealthy overweight individuals have high lysophosphatide levels, phospholipase activity, and oxidative stress. Clin Nutr. 2020;39(4):1137–1145. doi:10.1016/j.clnu.2019.04.025
33. Chen YH, Li WC, Chen YC, et al. The correlation between lipoprotein associated phospholipase A(2) and central overweight status. Int J Immunopathol Pharmacol. 2021;35:20587384211048562. doi:10.1177/20587384211048562
34. Sarlon-Bartoli G, Boudes A, Buffat C, et al. Circulating lipoprotein-associated phospholipase A2 in high-grade carotid stenosis: a new biomarker for predicting unstable plaque. Eur J Vasc Endovasc Surg. 2012;43(2):154–159. doi:10.1016/j.ejvs.2011.10.009
35. Kolodgie FD, Burke AP, Skorija KS, et al. Lipoprotein-associated phospholipase A2 protein expression in the natural progression of human coronary atherosclerosis. Arterioscler Thromb Vasc Biol. 2006;26(11):2523–2529. doi:10.1161/01.ATV.0000244681.72738.bc
 © 2024 The Author(s). This work is published and licensed by Dove Medical Press Limited. The
full terms of this license are available at https://www.dovepress.com/terms
and incorporate the Creative Commons Attribution
- Non Commercial (unported, 3.0) License.
By accessing the work you hereby accept the Terms. Non-commercial uses of the work are permitted
without any further permission from Dove Medical Press Limited, provided the work is properly
attributed. For permission for commercial use of this work, please see paragraphs 4.2 and 5 of our Terms.
© 2024 The Author(s). This work is published and licensed by Dove Medical Press Limited. The
full terms of this license are available at https://www.dovepress.com/terms
and incorporate the Creative Commons Attribution
- Non Commercial (unported, 3.0) License.
By accessing the work you hereby accept the Terms. Non-commercial uses of the work are permitted
without any further permission from Dove Medical Press Limited, provided the work is properly
attributed. For permission for commercial use of this work, please see paragraphs 4.2 and 5 of our Terms.