")
Back to Journals » Diabetes, Metabolic Syndrome and Obesity » Volume 16
Association Between Vitamin D Levels and the Atherogenic Index of Plasma Among Chinese with Type 2 Diabetes Mellitus
Authors Ban J, Zhao X, Jia Z, Li Z, Chen S
Received 6 December 2022
Accepted for publication 14 February 2023
Published 22 February 2023 Volume 2023:16 Pages 523—531
DOI https://doi.org/10.2147/DMSO.S398161
Checked for plagiarism Yes
Review by Single anonymous peer review
Peer reviewer comments 2
Editor who approved publication: Prof. Dr. Juei-Tang Cheng
Jiangli Ban,1,2 Xuetong Zhao,3 Zhuoya Jia,2,4 Zelin Li,2,4 Shuchun Chen2,4,5
1Graduate School of Hebei North University, Zhangjiakou, People’s Republic of China; 2Department of Endocrinology, Hebei General Hospital, Shijiazhuang, People’s Republic of China; 3Baoding NO.1 Hospital, Baoding, People’s Republic of China; 4Graduate School of Hebei Medical University, Shijiazhuang, People’s Republic of China; 5Hebei Key Laboratory of Metabolic Diseases, Shijiazhuang, People’s Republic of China
Correspondence: Shuchun Chen, Department of Endocrinology, Hebei General Hospital, 348 Heping West Road, Shijiazhuang, 050051, People’s Republic of China, Tel/Fax +86 31185988406, Email [email protected]
Purpose: The relationship between atherogenic index of plasma (AIP) values and 25-hydroxyvitamin D (25[OH] D) was examined in type 2 diabetes mellitus (T2DM).
Patients and Methods: Six hundred and ninety-eight T2DM patients were included. Patients were allocated to two groups, namely, the vitamin D-deficient and non-deficient groups (threshold of 20 ng/mL). The AIP was determined as log (TG [mmol/L] / HDL-C [mmol/L]). The patients were then allocated to two further groups according to the median AIP value.
Results: AIP level in the vitamin D-deficient group was significantly higher than that in non-deficient group (P< 0.05). Patients with high AIP values had markedly reduced levels of vitamin D levels compared with those in the low-AIP group [15.89 (11.97, 20.29) VS 18.22 (13.89, 23.08), P< 0.001]. Patients in the high AIP group had a higher rate of vitamin D deficiency (73.3% VS 60.6%). It was found that AIP values were adversely and independently correlated with vitamin D levels. The AIP value was shown to independently predict vitamin D deficiency risk in T2DM patients.
Conclusion: Patients with T2DM were shown to have an increased risk of vitamin D insufficiency when their AIP levels were low. This suggests that AIP is associated with vitamin D insufficiency in Chinese patients with type 2 diabetes.
Keywords: vitamin D, diabetes mellitus, type 2 diabetes, atherogenic index of plasma
Introduction
Diabetes is a chronic metabolic condition, and it occurs more often every year. According to the Latest Chinese Diabetes Epidemiology 2020, there are 129.8 million people with diabetes in China, of which 70.4 million are men and 59.4 women1 with T2DM accounting for about 90% of overall incidence. Common complications of diabetes include cardiovascular disease, and osteoporosis, as well as diabetic nephropathy, retinopathy, and peripheral neuropathy. Vitamin D is an essential nutrient for the body’s vital activities. Along with regulating immune system function and fostering bone formation, vitamin D also controls how calcium and phosphorus are absorbed by the body. Vitamin D deficiency is prevalent in T2DM patients2 and, furthermore, adequate vitamin D levels can prevent the development of osteoporosis and fracture risk.
AIP, a new indicator of lipid binding, was defined by Dobiasova as the logarithm of the TG to HDL-C ratio.3 The AIP can be calculated from routine laboratory tests and has the advantage of being readily available. Associations between AIP have been reported with coronary artery disease, and diabetic foot and nephropathy in T2DM patients.4–6 Negative correlations between AIP and vitamin D have also been found in Non-alcoholic fatty liver disease (NAFLD).7 However, it is not known whether there is an association between vitamin D and AIP in T2DM. The purpose of this study was to investigate the relationship between AIP and serum vitamin D levels in T2DM in China, to further analyze whether AIP is an independent influencing factor of vitamin D levels.
Materials and Methods
Study Population
From September 2021 to August 2022, 698 patients were registered in the endocrinology department at Hebei General Hospital. The patients were divided into two groups: those with sufficient vitamin D levels (> 20 ng/mL) and those with deficient levels (< 20 ng/mL). The AIP was determined according to the TG and HDL-C levels, and the patients were allocated to two groups, High-AIP and Low-AIP, according to the median value. All participants were T2DM patients who met the 1999 WHO diagnostic criteria for diabetes and were aged ≥ 18 years and ≤80 years. Patients with non-T2DM diabetes, or with acute diabetes complications, or with severe hepatic and renal insufficiency, or with malignancy, or with thyroid disease, or with previous fractures, or with other diseases or with medications influencing vitamin D levels were excluded. The Hebei General Hospital’s ethics committee gave its approval before the research was conducted in accordance with the Declaration of Helsinki’s criteria. The study objectives were explained to the patients and they signed informed consent forms.
Clinical Assessment and Biochemical Measurements
Basic patient information, including age, sex, smoking, disease history, disease duration, and alcohol consumption, was obtained by questionnaire. The patients’ heights, weights, diastolic blood pressure (DBP), and systolic blood pressure (SBP) were recorded. Blood specimens were collected from subjects after overnight fasting (more than eight hours) for measurement of AST, ALT, fasting blood glucose (FBG), urea nitrogen (BUN), uric acid (UA), creatinine (Scr), GFR, total cholesterol (TC), triglyceride (TG), HDL-C, LDL-C, 25-hydroxyvitamin D, and glycated hemoglobin (HbA1c), all of which were determined by the laboratory physicians of the Hebei General Hospital using a fully automated biochemical analyzer; 25-Hydroxyvitamin D3 (25[OH]D3) levels were determined using electrochemiluminescence by a physician in the Department of Nuclear Medicine.
Calculation of Parameters
AIP= log (TG [mmol/L] / HDL-C [mmol/L]).
Body mass index (BMI) = weight (kg) / height (m)2;
Statistical Analysis
SPSS 25.0 was used for data analysis. Continuous variables were represented as means ± standard deviation (SD) if they conformed to a normal distribution, and Student’s t-test was used between-group comparisons; non-normally distributed data were presented as medians (P25, P75) and the Mann–Whitney U-test was used to compare groups. For categorical variables, data were expressed as numbers (percentages) and compared by χ2 tests. Associations between AIP and clinical indicators were evaluated by Spearman correlation analysis, linear regression was used to assess independent influencing factors, and logistic regression for the assessment of the ability of AIP to predict vitamin D deficiency. P-values <0.05 were considered statistically significant.
Results
Indicators in the Vitamin D-Deficient and Non-Deficient Groups
Of the 698 enrolled patients, 66.9% (467/698) were vitamin D-deficient. AIP values were greater in the deficient group patients (P<0.001) (Table 1 and Figure 1). There were relatively fewer males in the deficient group than in the non-deficient group. Both age and diabetes duration were lower in vitamin D-deficient patients while SBP, DBP, BMI, FBG, UA, GFR, TG, TC, and HAb1c levels were higher (P<0.05). The clinical parameters for the patients in both groups are presented in Table 1.
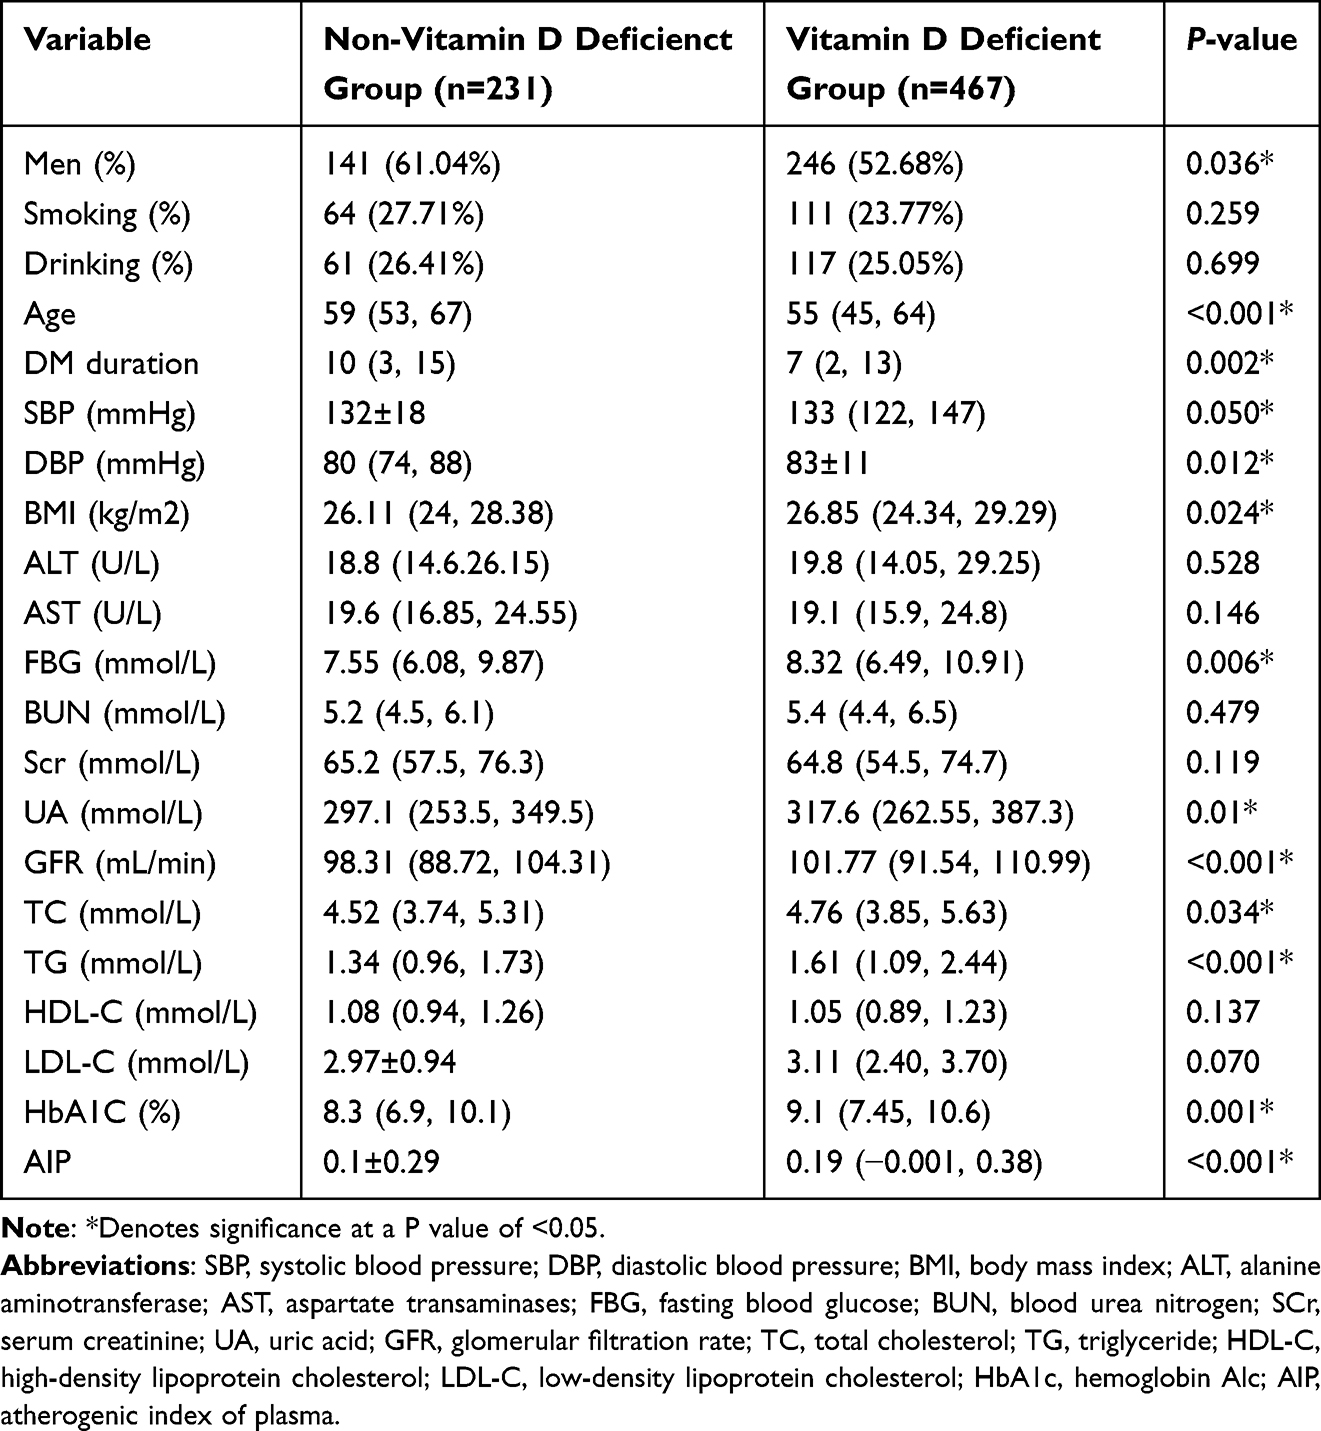 |
Table 1 Indicators in the Vitamin D-Deficient and Non-Deficient Groups |
 |
Figure 1 Comparisons of AIP between non- vitamin D deficiency and Vitamin D deficiency groups. Abbreviation: AIP, atherogenic index of plasma. Note: *Denotes significance at a P value of <0.05. |
Comparison of Indicators Between the Low-AIP and High-AIP Groups
Patients with high AIP values had markedly reduced levels of vitamin D levels compared with those in the low-AIP group [15.89 (11.97, 20.29) VS 18.22 (13.89, 23.08), P<0.001] (Figure 2), and patients in the high-AIP group were also younger. The vitamin D deficiency rate, smoking rate, SBP, DBP, BMI, ALT, FBG, TC, TG, LDL-C, and HbA1C levels were all higher in high-AIP patients while disease duration and HDL-C were lower compared with low-AIP patients (P<0.05). No differences in sex, alcohol consumption, AST, BUN, SCr, or GFR were observed between the two groups of patients (P>0.05) (Table 2).
 |
Table 2 Comparison of Indicators Between the Low-AIP and High-AIP Groups |
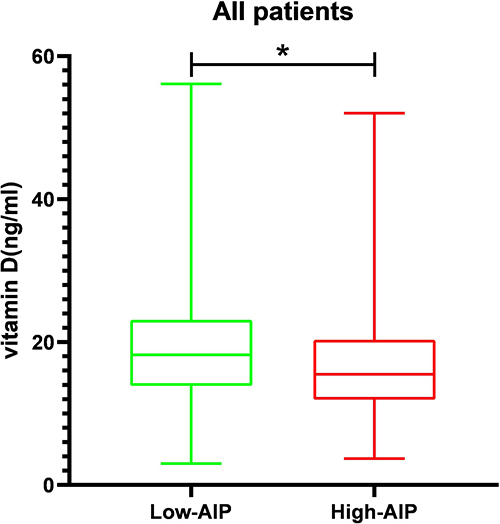 |
Figure 2 Comparisons of vitamin D levels in the Low-AIP and High- AIP groups. Abbreviation: AIP, atherogenic index of plasma. Note: *Denotes significance at a P value of <0.05. |
Association Between Vitamin D and Clinical Indicators
Vitamin D was negatively associated with AIP values (r=−0.191, P<0.001), while vitamin D levels were positively associated with age (r=0.154, P<0.001) and SCr (r=0.085, P=0.025) but negatively associated with SBP (r=−0.109, P=0.004), DBP (r=−0.098, P=0.01), BMI (r=−0.085, P=0.024), AST (r=−0.084, P=0.027), FBG (r=−0.129, P=0.001), GFR (r=−0.114, P= 0.003), TG (r=−0.1, P=0.008), TC (r=−0.192, P<0.001), LDL-C (r=−0.09, P=0.018), and HbA1c (r=- 0.177, P<0.001) (Table 3).
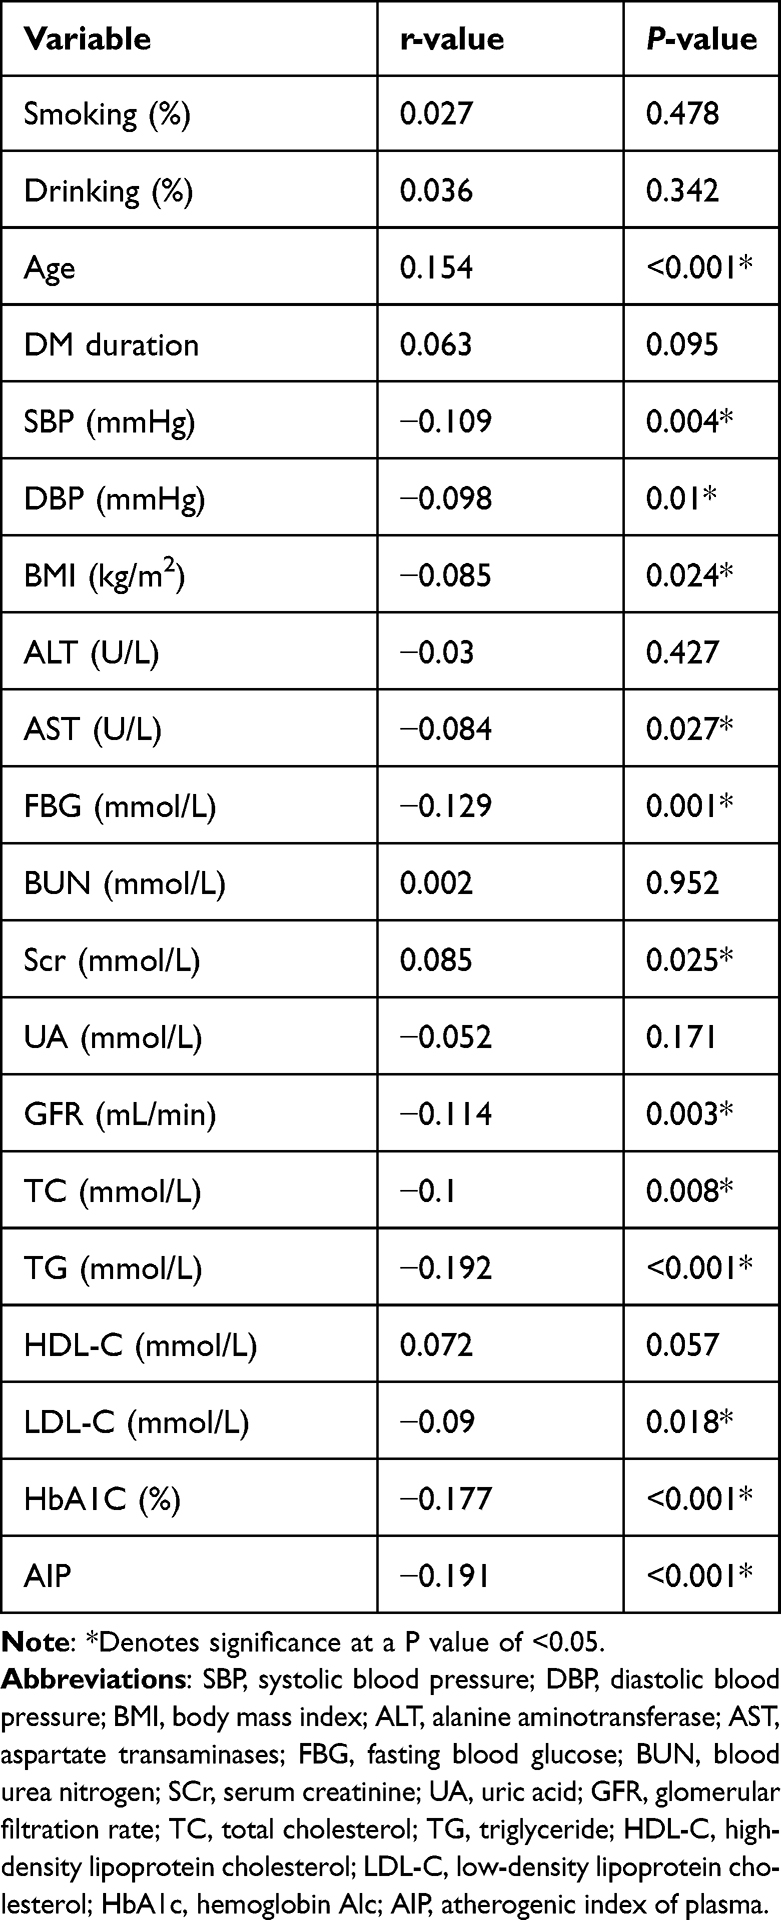 |
Table 3 Association Between Vitamin D and Clinical Indicators |
Linear Regression Shows That AIP Independently Predicts Vitamin D Deficiency
Vitamin D and AIP were negatively associated in the unadjusted Model 1 (P<0.001) while Model 2 (after adjustment for age, T2DM duration, SBP, DBP, and BMI) (P<0.001), Model 3 (after adjustment for age, T2DM duration, SBP, DBP, BMI, AST, ALT, BUN, SCr, UA, GFR, TC, TG, LDL-C, and HDL-C) (P=0.043), and Model 4 (with adjustments for age, T2DM duration, SBP, DBP, BMI, AST, ALT, BUN, SCr, UA, GFR, TC, TG, LDL-C, HDL-C, FBG, and HbA1C) (P=0.038) indicated that AIP independently influenced the vitamin D level (Table 4).
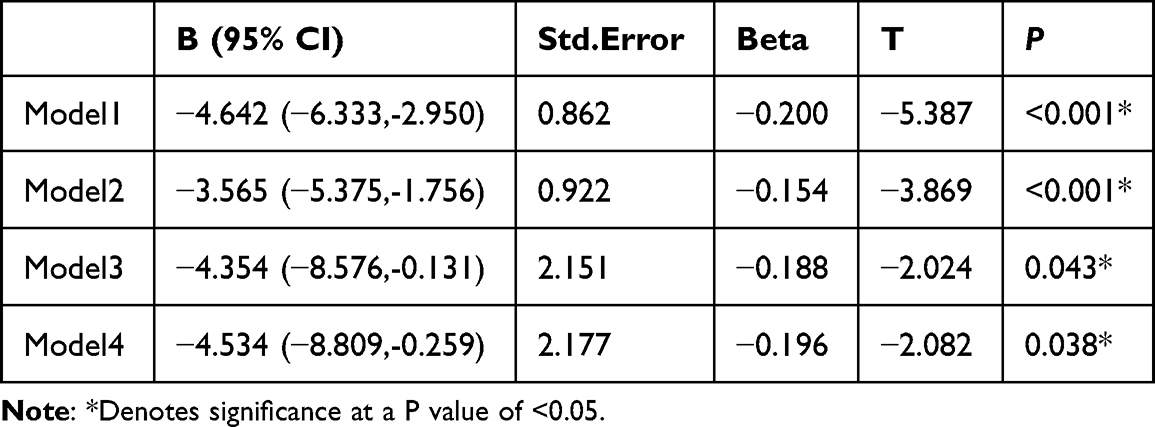 |
Table 4 Linear Regression Shows That AIP Independently Predicts Vitamin D Deficiency |
Logistic Regression Indicated an Independent Association Between AIP and Vitamin D
In this analysis, vitamin D deficiency (whether present or absent) was used as a dependent variable together with age, T2DM duration, SBP, DBP, FBG, UA, GFR, TC, and HbA1C, among others. As shown in Table 5, AIP was independently related to deficiency risk in T2DM patients [OR (95% CI) = 2.009 (1.096, 3.680), p<0.05]. Specifically, an increase of one unit in the AIP was linked to a 2.009-fold elevation of the vitamin D deficiency risk.
 |
Table 5 Logistic Regression Indicated an Independent Association Between AIP and Vitamin D |
ROC Curves Show That AIP Predicts Vitamin D Deficiency
ROC curves were used to analyze the link between T2DM and vitamin D, and showed that the AUC for AIP was 0.6, indicating that the AIP could predict the development of deficiencies in vitamin D. The sensitivity was found to be 45.6%, together with a specificity of 70.7%, a Youdon index of 0.162, and a cutoff value of 0.218 (Table 6 and Figure 3).
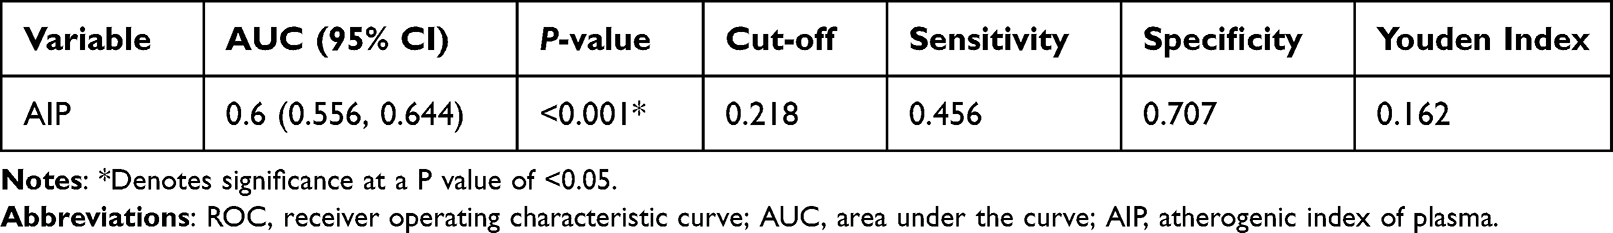 |
Table 6 ROC Curves Show That AIP Predicts Vitamin D Deficiency |
 |
Figure 3 ROC curves show that AIP predicts vitamin D deficiency. Note: *Denotes significance at a P value of <0.05. |
Discussion
The study participants were divided into deficient and non-deficient groups according to their vitamin D determinations and the clinical information of the two groups was assessed. Fewer male patients were found in the deficient group, possibly because men tend to spend more time outdoors. In addition, both fasting blood glucose and glycated hemoglobin were greater in the deficient group, which is consistent with previous findings.8 There was also more younger patients in the deficient group, as found in Zhao’s study,9 which indicated that the vitamin D level may be related to the nature of the patient’s work. The patients were grouped according to their median AIP indices and these groups were found to differ both in levels and deficiency of vitamin D. There was a negative relationship between AIP and vitamin D level in T2DM patients and, furthermore, was able to predict the development of deficiency. The critical AIP value was found to be 0.218; thus, AIP values higher than 0.218 indicate a significantly raised risk of developing vitamin D deficiency.
The European Society of Endocrinology defined serum 25 (OH)D levels <20 ng/mL as deficient.10 Deficiency in vitamin D is becoming more common as people’s living environment, clothing, diet, sunscreen use, and sun exposure hours change. A previous survey of people aged 50–70 in Beijing and Shanghai showed that 86% of people had either vitamin D insufficiency (< 30 ng/mL) or deficiency, with only 14% having normal levels. It is thought that about 1 billion people throughout the world are either vitamin D insufficient or deficient.11 While vitamin D itself does not have a physiological function, it is transformed within the body where it takes part in various biological processes. The vitamin is obtained either from the diet or through the skin, and is initially hydroxylated to 25 (OH)D in the liver by vitamin D-25-hydroxylase (25-OHase) followed by further hydroxylation in the kidney to 1,25-Dihydroxyvitamin D (1,25[OH[2D), which is then able to bind to the vitamin D receptor to fulfill its functions.12 A strong link between vitamin D levels and the development of T2DM and associated complications has been reported. In addition, deficiency in vitamin D has been related to sleep disorders and sleep deprivation, associated with reduced melatonin production13 as well as with osteoporosis, muscle pain, rickets, and even fractures,14 all of which adversely affect the quality of life. Early prediction of vitamin D deficiency is thus particularly important.
The disordered lipid metabolism associated with T2DM involves elevated TG and LDL-C together with low HDL-C. The AIP, a combined index reflecting both TG and HDL levels, has been shown to indirectly reflect the diameter size of the LDL particle and to predict the likelihood of diabetes development.3,15 The AIP has been found to be effective not only for predicting macrovascular complications of diabetes, such as cardiovascular disease,16,17 but also microvascular complications, such as nephropathy, retinopathy and peripheral neuropathy.18,19 The present study suggests that disorders of lipid metabolism are associated with vitamin D deficiency and that the AIP, as an index of the response to lipid metabolism, is strongly associated with vitamin D deficiency in T2DM in China.
This study has several strengths. First, it is the first report showing a negative relationship between AIP and vitamin D and AIP in T2DM. Second, the formula for calculating AIP is relatively simple and can be applied to routine laboratory findings. The study also has some limitations. First, as a cross-sectional investigation, direct causality could not be determined. Second, while sunlight exposure and dietary factors affect both vitamin D and blood lipid levels, these data were not available. Future studies should include outdoor exercise time and diet for in-depth analysis.
Conclusion
In summary, AIP values and vitamin D levels were found to be negatively correlated in T2DM patients. High AIP levels are thus a good clinical indicator for the identification of vitamin D deficiency, allowing early clinical intervention.
Disclosure
The authors report no conflicts of interest in this work.
References
1. Li Y, Teng D, Shi X, et al. Prevalence of diabetes recorded in mainland China using 2018 diagnostic criteria from the American Diabetes Association: national cross sectional study. BMJ. 2020;369:m997. doi:10.1136/bmj.m997
2. Inoue D. [Diabetes mellitus and osteoporosis. Role for vitamin D in glucose and energy metabolism]. Clin Calcium. 2012;22(9):1391–1397. Japanese.
3. Dobiasova M, Raslova K, Rauchova H, Vohnout B, Ptackova K, Frohlich J. Atherogenic lipoprotein profile in families with and without history of early myocardial infarction. Physiol Res. 2001;50(1):1–8.
4. Shafie A, Askary AE, Almehmadi M, et al. Association of vitamin D deficiency and vitamin D receptor genetic variants with coronary artery disease in type 2 diabetic Saudi patients. Vivo. 2022;36(3):1444–1452. doi:10.21873/invivo.12850
5. Fernandez-Juarez G, Luno J, Barrio V, et al. 25 (OH) vitamin D levels and renal disease progression in patients with type 2 diabetic nephropathy and blockade of the renin-angiotensin system. Clin J Am Soc Nephrol. 2013;8(11):1870–1876. doi:10.2215/CJN.00910113
6. Tang W, Chen L, Ma W, et al. Association between vitamin D status and diabetic foot in patients with type 2 diabetes mellitus. J Diabetes Investig. 2022;13(7):1213–1221. doi:10.1111/jdi.13776
7. Izadi A, Aliasghari F, Gargari BP, Ebrahimi S. Strong association between serum Vitamin D and vaspin levels, AIP, VAI and liver enzymes in NAFLD patients. Int J Vitam Nutr Res. 2020;90(1–2):59–66. doi:10.1024/0300-9831/a000443
8. Jia Y, Song T, Li Z, Zhou L, Chen S. The relationship between triglyceride glucose index and Vitamin D in type 2 diabetes mellitus. Diabetes Metab Syndr Obes. 2022;15:511–525. doi:10.2147/DMSO.S348845
9. Zhao X, Deng C, Li Z, Jia Y, Chen S. Monocyte/high-density lipoprotein cholesterol ratio predicts Vitamin D Deficiency in male patients with type 2 diabetes mellitus. Diabetes Metab Syndr Obes. 2022;15:2455–2466. doi:10.2147/DMSO.S376127
10. Holick MF, Binkley NC, Bischoff-Ferrari HA, et al. Evaluation, treatment, and prevention of vitamin D deficiency: an endocrine society clinical practice guideline. J Clin Endocrinol Metab. 2011;96(7):1911–1930. doi:10.1210/jc.2011-0385
11. Pfotenhauer KM, Shubrook JH. Vitamin D deficiency, its role in health and disease, and current supplementation recommendations. J Am Osteopath Assoc. 2017;117(5):301–305.
12. DeLuca HF. Overview of general physiologic features and functions of vitamin D. Am J Clin Nutr. 2004;80(6 Suppl):1689S–1696S. doi:10.1093/ajcn/80.6.1689S
13. Romano F, Muscogiuri G, Di Benedetto E, et al. Vitamin D and sleep regulation: is there a role for Vitamin D? Curr Pharm Des. 2020;26(21):2492–2496. doi:10.2174/1381612826666200310145935
14. Chakhtoura M, Bacha DS, Gharios C, et al. Vitamin D supplementation and fractures in adults: a systematic umbrella review of meta-analyses of controlled trials. J Clin Endocrinol Metab. 2022;107(3):882–898. doi:10.1210/clinem/dgab742
15. Li YW, Kao TW, Chang PK, Chen WL, Wu LW. Atherogenic index of plasma as predictors for metabolic syndrome, hypertension and diabetes mellitus in Taiwan citizens: a 9-year longitudinal study. Sci Rep. 2021;11(1):9900. doi:10.1038/s41598-021-89307-z
16. Fu L, Zhou Y, Sun J, et al. Atherogenic index of plasma is associated with major adverse cardiovascular events in patients with type 2 diabetes mellitus. Cardiovasc Diabetol. 2021;20(1):201. doi:10.1186/s12933-021-01393-5
17. Zhou K, Qin Z, Tian J, Cui K, Yan Y, Lyu S. The atherogenic index of plasma: a powerful and reliable predictor for coronary artery disease in patients with type 2 diabetes. Angiology. 2021;72(10):934–941. doi:10.1177/00033197211012129
18. Li Z, Huang Q, Sun L, Bao T, Dai Z. Atherogenic index in type 2 diabetes and its relationship with chronic microvascular complications. Int J Endocrinol. 2018;2018:1765835. doi:10.1155/2018/1765835
19. Qi L, Kang N, Chen X, Li Z, Deng C, Chen S. Predictive value of plasma atherogenic index for microalbuminuria in newly diagnosed patients with type 2 diabetes mellitus. Diabetes Metab Syndr Obes. 2022;15:1245–1252. doi:10.2147/DMSO.S359811
 © 2023 The Author(s). This work is published and licensed by Dove Medical Press Limited. The full terms of this license are available at https://www.dovepress.com/terms.php and incorporate the Creative Commons Attribution - Non Commercial (unported, v3.0) License.
By accessing the work you hereby accept the Terms. Non-commercial uses of the work are permitted without any further permission from Dove Medical Press Limited, provided the work is properly attributed. For permission for commercial use of this work, please see paragraphs 4.2 and 5 of our Terms.
© 2023 The Author(s). This work is published and licensed by Dove Medical Press Limited. The full terms of this license are available at https://www.dovepress.com/terms.php and incorporate the Creative Commons Attribution - Non Commercial (unported, v3.0) License.
By accessing the work you hereby accept the Terms. Non-commercial uses of the work are permitted without any further permission from Dove Medical Press Limited, provided the work is properly attributed. For permission for commercial use of this work, please see paragraphs 4.2 and 5 of our Terms.