Back to Journals » Diabetes, Metabolic Syndrome and Obesity » Volume 16
Association Between Visceral Fat Area and Glycated Hemoglobin in Type 2 Diabetics: A Retrospective Study
Authors Luo B ![]() , Xu W, Feng L, Chen J, Shi R, Cao H
, Xu W, Feng L, Chen J, Shi R, Cao H ![]()
Received 5 August 2023
Accepted for publication 11 October 2023
Published 23 October 2023 Volume 2023:16 Pages 3295—3301
DOI https://doi.org/10.2147/DMSO.S425166
Checked for plagiarism Yes
Review by Single anonymous peer review
Peer reviewer comments 3
Editor who approved publication: Professor Gian Paolo Fadini
Beibei Luo,1 Wenbo Xu,1 Lei Feng,2 Jingyi Chen,1 Rui Shi,3 Huiying Cao2
1Clinical Laboratory, People’s Hospital of Yuxi City, Yuxi City, Yunnan Province, People’s Republic of China; 2Clinical Laboratory, Yan’an Hospital of Kunming City, Kunming City, Yunnan Province, People’s Republic of China; 3Department of Laboratory, The Sixth Affiliated Hospital of Kunming Medical University, Yuxi City, Yunnan Province, People’s Republic of China
Correspondence: Wenbo Xu, Clinical Laboratory, People’s Hospital of Yuxi City, Yuxi City, Yunnan Province, People’s Republic of China, Email [email protected]
Introduction: Obesity is a risk factor for the development of type 2 diabetes (T2DM) as well as its associated metabolic complications. Central obesity, characterized by an increased visceral fat area (VFA), is contributed to the development of T2DM. However, the relationship between VFA and HbA1c is not particularly clear.
Methods: A total of 3173 patients with T2DM participated in the study at the Metabolic Management Center (MMC), with anthropometric and biochemical measurements recorded. To examine the association between HbA1c and VFA, fitting curves were plotted, facilitating a comprehensive observation of their relationship.
Results: HbA1c was inversely associated with VFA (β − 1.79, 95% CI − 2.34~− 1.24, P < 0.001). The fitted curve shows that VFA increased with the increase of HbA1c when it was less than 8.62%. When it was greater than 8.62%, VFA decreased as HbA1c increased. Using linear inflection point analysis, we found that its inflection point interval falls within 8.36%~8.88%.
Conclusion: VFA was positively associated with HbA1c in individuals with T2DM. Furthermore, the relationship between the two variables was an inverted U-shaped association.
Keywords: HbA1c, obesity, diabetes mellitus
Introduction
Obesity, resulting from an imbalance in energy intake and expenditure, is a significant risk factor for type 2 diabetes (T2DM) and related metabolic complications.1 Globally, approximately 13% of adults experience obesity, characterized by abnormal fat distribution, often presenting as abdominal obesity, specifically central adiposity, the most prevalent form of obesity.2–4 Central obesity, featuring an increased visceral fat area (VFA), is associated with oxidative stress and insulin resistance, contributing to the development of T2DM.5 Clinically, glycated hemoglobin (HbA1c) levels serve as diagnostic indicators for T2DM.6
Individuals with T2DM often demonstrate heightened levels of visceral adiposity. However, not all T2DM individuals exhibit significantly elevated VFA, prompting uncertainty regarding the association between HbA1c and VFA. Elevated HbA1c levels may unintentionally lead to weight loss.7 Recent studies indicated that poorly controlled diabetes is often associated with a higher body mass index (BMI) compared to well-controlled cases.8–10 Nevertheless, in diabetes complicated by pancreatic cancer,11 a decrease in BMI was observed alongside increasing HbA1c levels. It is important to note that BMI does not accurately ascertain the presence of central obesity.12
Given this premise, the study aimed to discern the relationship between VFA and HbA1c, with the goal of improving T2DM management.
Methods
Study Design and Participants
This retrospective study, conducted at the Metabolic Management Center (MMC) in People’s Hospital of Yuxi, Yunnan Province, spanned from March 2018 to August 2022 and included 4054 patients. Exclusions encompassed individuals without type 2 diabetes and those with incomplete data, resulting in a final cohort of 3173 patients for analysis (Figure 1). Baseline information encompassed lifestyle, dietary habits, demographics, discharge medications, and a comprehensive set of laboratory tests. Ethics approval was obtained from the Sixth Affiliated Hospital of Kunming Medical University (No. 2023kmykdx6f24) and conformed with the Declaration of Helsinki. Patient confidentiality was maintained, and informed consent was obtained from the ethics committee, with no collection of personal patient information.
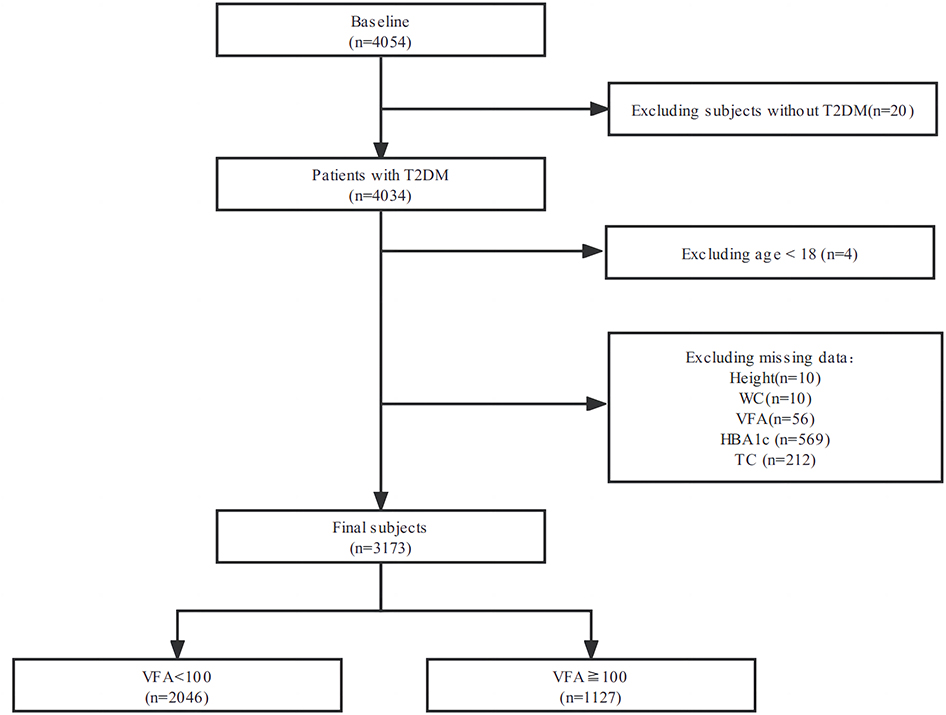 |
Figure 1 Flowchart of the study population. |
Anthropometric and Biochemical Measurements
This study obtained anthropometric data on individuals’ body dimensions, including height, weight, waist circumference (WC), hip circumference (HC), and VFA. Height and weight were measured using an intelligent ultrasonic height and weight machine (HNH-318, OMRON, China), with patients dressed in light clothing and without shoes. BMI was calculated by dividing weight (in kilograms) by the square of the height (in meters). WC was measured at the anterior iliac crest, and HC at the point of maximum circumference using a nonelastic measuring tape.
This study collected biochemical indices, including HbA1c, total cholesterol (TC), triglycerides (TG), high-density lipoprotein (HDL), and low-density lipoprotein (LDL), at the Sixth Affiliated Hospital of Kunming Medical University.
Definitions of Visceral Obesity
This study collected VFA measurements, recorded in cm², using the DUALSCAN device (HDS-2000, OMRON, China). Visceral obesity was defined as a VFA area greater than or equal to 100 cm².13
Statistical Analysis
Participants were categorized based on VFA: less than 100 cm² or greater/equal to 100 cm². Normality of data was assessed using the Shapiro–Wilk test. Descriptive statistics included mean ± standard deviation (SD), medians with interquartile ranges (IQR), or percentages. The t-test and Mann–Whitney U-test were applied for normally and non-normally distributed data, respectively. The chi-squared test was used for categorical variables. Univariate linear regression analysis explored trends between VFA and other variables. A fitting curve illustrated the relationship between HbA1c levels and VFA. Subgroup analyses were performed, stratifying by gender, BMI, and VFA to verify relationships between HbA1c levels and VFA measurements. P < 0.05 was significant. All the analyses were performed with the statistical software packages R (http://www.R-project.org, The R Foundation) and Free Statistics software version 1.7.
Results
Baseline Characteristics
In this study of 3173 patients, with a male-to-female ratio of 63.3% to 36.7%, with a mean age of 55.9 ± 11.2 years, 2046 had normal VFA and 1127 had visceral obesity. Patients with visceral obesity exhibited significantly higher age, BMI, WC, HC, TC, HDL, and TG levels compared to those with normal VFA (P < 0.05). Interestingly, HbA1c levels were lower in patients with visceral obesity (mean ± SD: 9.2 ± 2.0) than in normal patients (mean ± SD: 9.6 ± 2.6) (P < 0.05) (Table 1).
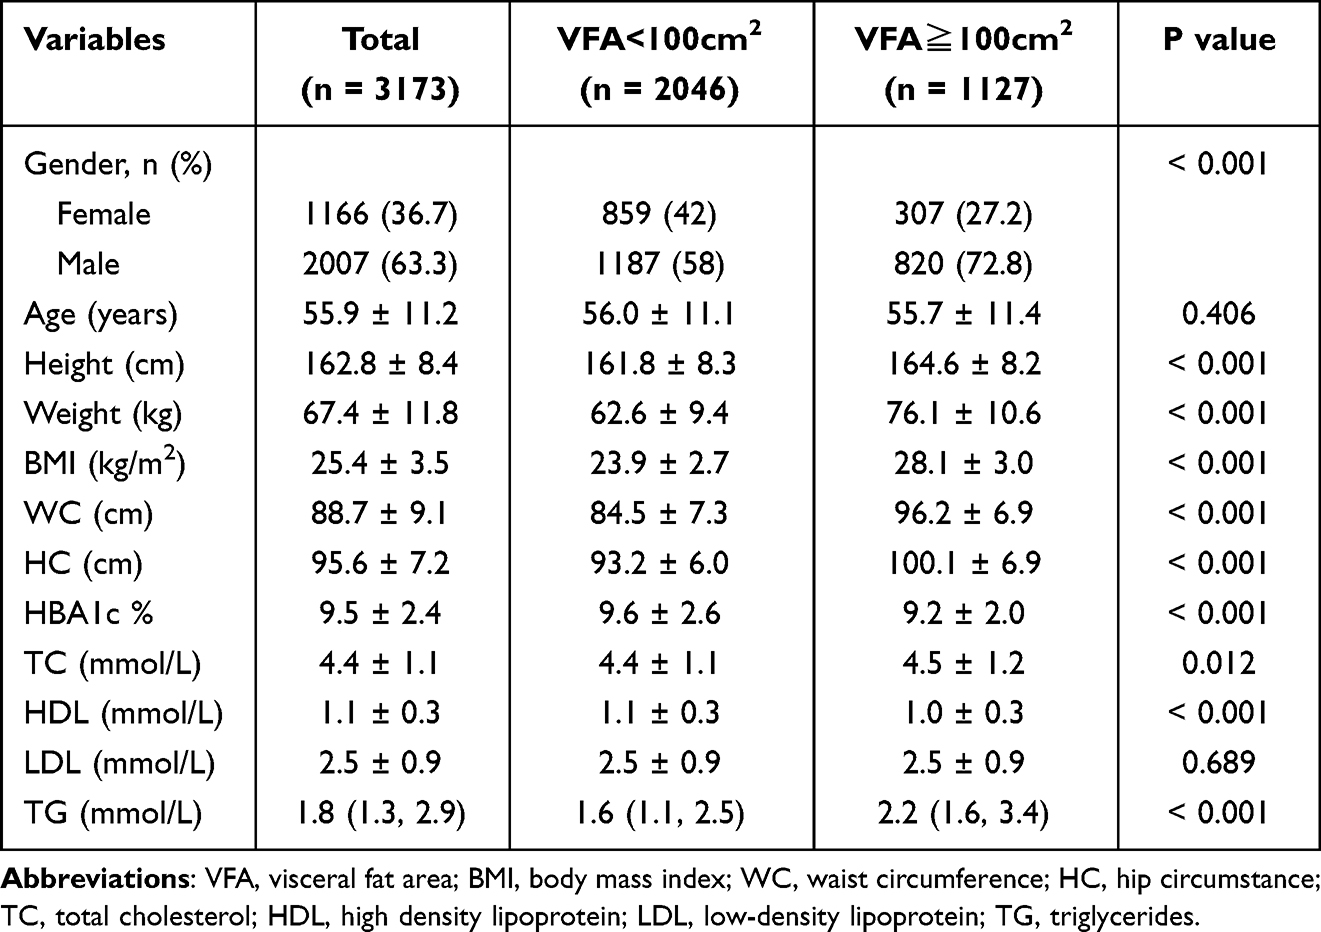 |
Table 1 Baseline Characteristics of Study Participants |
Main Outcomes
In the univariate linear regression analysis with VFA as the dependent variable, we calculated β values along with 95% confidence intervals. HbA1c was independently associated with a decreased risk for VFA (β: −1.79; 95% CI: −2.34 to −1.24; P < 0.001) (Table 2). The fitting curve indicates that for HbA1c levels below 8.62%, VFA increased with HbA1c. Conversely, when HbA1c levels were exceeded 8.62%, higher HbA1c levels were linked to smaller VFA. Linear inflection point analysis identified the inflection point for HbA1c between 8.36% and 8.88% (Figure 2).
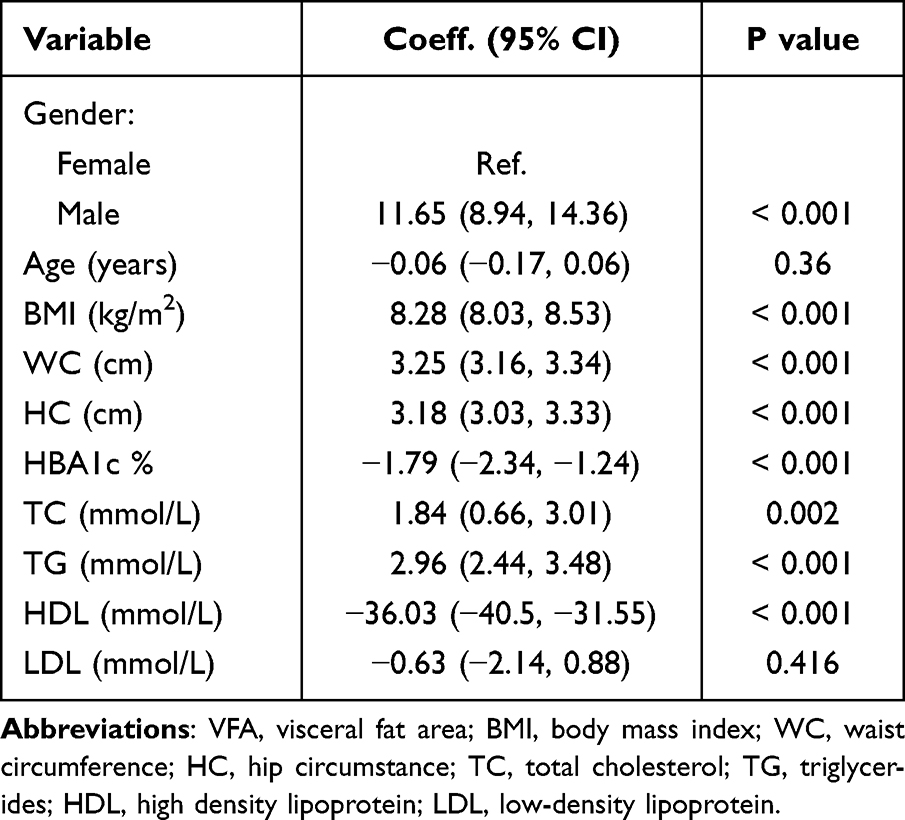 |
Table 2 Univariate Linear Regression Analysis for VFA |
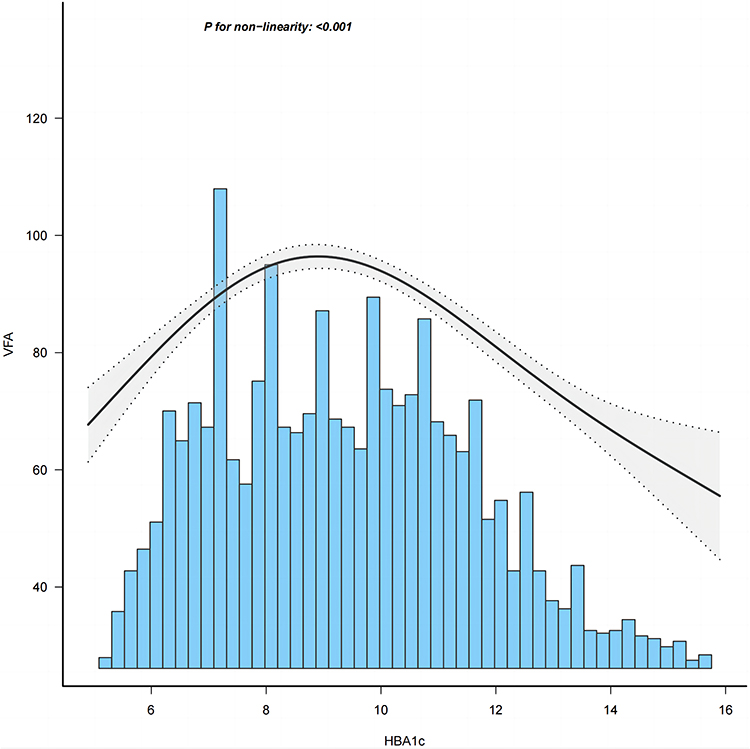 |
Figure 2 Univariate linear regression analysis for VFA and HBA1c. |
Subgroup Analysis
To examine the relationship association between HbA1c and visceral obesity, patients were categorized based on BMI and VFA levels: underweight (BMI < 18.5 kg/m2), normal weight (BMI 18.5–24.9 kg/m2), or overweight (BMI > 25 kg/m2), following an established classification system.14 VFA was grouped if it was less than 100 cm2. Subgroup analyses revealed a significant correlation between VFA and HbA1c (P < 0.001), whereas BMI did not exhibit a significant association with HbA1c (P=0.183) (Figure 3).
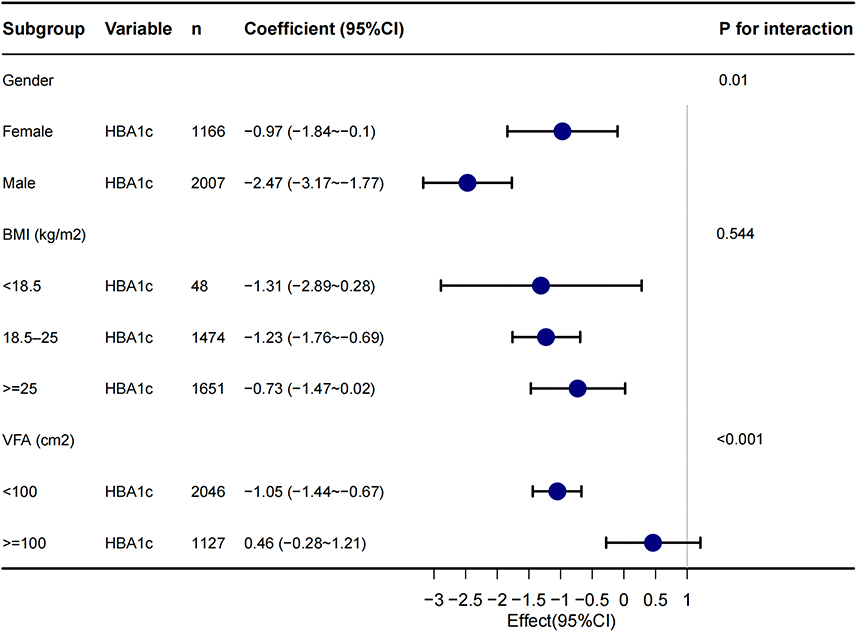 |
Figure 3 The association of subgroups and their association with HBA1c. |
Discussion
Through analyzing 3173 diabetic patients, including 2046 with normal VFA and 1127 with visceral obesity, we discovered that patients with visceral obesity exhibited lower HbA1c levels levels than their normal VFA counterparts. Notably, an inverted U-shaped relationship was identified between HbA1c levels and VFA, with the inflection point ranging between 8.36% and 8.88%.
HbA1c, reflecting the average glucose concentration over 2–3 months, thus providing a long-term indicator of glucose homeostasis.6 Utilizing HbA1c as a primary diagnostic tool for type 2 diabetes mellitus has the potential to improve diagnostic efficiency and mitigate the incidence of related complications.15 A study involving 212 nondiabetic individuals from Japan16 established a significant positive correlation between BMI and HbA1c. Similarly, another study17 reported a significantly positive correlation between BMI and HbA1c from 2012 to 2019. However, it’s important to acknowledge that obesity is not comprehensively captured by BMI. In comparison, central obesity demonstrates a stronger association with metabolic diseases. In the context of central obesity, previous research has underscored the complementary role of HbA1c tests in identifying high risk for diabetes.
HbA1c has been recognized for its close association with the chronic complications of diabetes.18–21 The relationship between HbA1c and central obesity has garnered substantial interest, with the prevailing notion suggesting a positive correlation between poorly controlled diabetes and higher body fat percentage, particularly within the visceral fat area. Surprisingly, our research indicates a reduction in visceral fat area when HbA1c levels exceed 8.63. However, the precise mechanisms underlying this relationship between central obesity and HbA1c remain elusive. A recent study22 proposes that up to 75% of diabetic patients may experience varying degrees of gastrointestinal symptoms, potentially contributing to the decline in visceral fat area among diabetic patients. Furthermore, complications, such as malignant diseases or precancerous conditions can lead to weight loss in diabetics. Further research is essential to elucidate the specific mechanisms governing the relationship between visceral fat area and HbA1c.
An advantage of this study lies in the identification an inverted U-shaped relationship between VFA and HbA1c. In addition, we explored the correlation involving sex, BMI, and central obesity. Notably, metabolic factors such as blood lipid did not exhibit an impact on VFA and HbA1c levels. The association observed, wherein HbA1c levels increased while VFA decreased, signifies inadequate control of diabetic patients. Hence, a comprehensive assessment incorporating both VFA and HbA1c levels can effectively determine the condition of diabetic patients.
However, there are some limitations in this study. Firstly, this is a retrospective study from a single center where all participants had a definite diagnosis of T2DM, and the association between VFA and HbA1c in people without T2DM is not clear. Secondly, we did not obtain other diagnostic information, especially whether the patients had other comorbidities. Therefore, it is unclear whether the decrease in VFA caused complications or if HbA1c levels were not determined. Finally, we were unable to analyze the data using Cox regression analysis to obtain the hazard ratio since we did not follow up with these patients to determine the specific changes in their VFA and HbA1c over time.
Conclusion
In summary, our study showed that VFA was independently and significantly associated with HbA1c in patients with T2DM. Additionally, an inverted U-shaped relationship was observed between VFA and HbA1c, with the inflection point ranging from 8.36% to 8.88%.
Funding
We gratefully acknowledge support from the Regional Fund Project of the National Natural Science Foundation (Serial number: 82160402).
Disclosure
The authors report no conflicts in this work.
References
1. Softic S, Meyer JG, Wang GX, et al. Dietary sugars alter hepatic fatty acid oxidation via transcriptional and post-translational modifications of mitochondrial proteins. Cell Metab. 2019;30(4):735–753.e4. doi:10.1016/j.cmet.2019.09.003
2. Di Angelantonio E, Bhupathiraju S, Wormser D, et al.; Global BMI Mortality Collaboration. Body-mass index and all-cause mortality: individual-participant-data meta-analysis of 239 prospective studies in four continents. Lancet. 2016;388(10046):776–786. doi:10.1016/S0140-6736(16)30175-1
3. Pantel H, Hwang J, Brams D, et al. Effect of incentive spirometry on postoperative hypoxemia and pulmonary complications after bariatric surgery: a randomized clinical trial. JAMA Surg. 2017;152(5):422–428. doi:10.1001/jamasurg.2016.4981
4. Saaristo T, Moilanen L, Korpi-Hyövälti E, et al. Lifestyle intervention for prevention of type 2 diabetes in primary health care: one-year follow-up of the Finnish National Diabetes Prevention Program (FIN-D2D). Diabetes Care. 2010;33(10):2146–2151. doi:10.2337/dc10-0410
5. Abraham TM, Pedley A, Massaro JM, et al. Association between visceral and subcutaneous adipose depots and incident cardiovascular disease risk factors. Circulation. 2015;132(17):1639–1647. doi:10.1161/CIRCULATIONAHA.114.015000
6. Dong PT, Lin H, Huang KC, et al. Label-free quantitation of glycated hemoglobin in single red blood cells by transient absorption microscopy and phasor analysis. Sci Adv. 2019;5(5):eaav0561. doi:10.1126/sciadv.aav0561
7. Liao WC, Chen PR, Huang CC, et al. Relationship between pancreatic cancer-associated diabetes and cachexia. J Cachexia Sarcopenia Muscle. 2020;11(4):899–908. doi:10.1002/jcsm.12553
8. Wang XL, Suzuki R, Lee K, et al. Ablation of ARNT/HIF1beta in liver alters gluconeogenesis, lipogenic gene expression, and serum ketones. Cell Metab. 2009;9(5):428–439. doi:10.1016/j.cmet.2009.04.001
9. Bharucha AE, Kudva Y, Basu A, et al. Relationship between glycemic control and gastric emptying in poorly controlled type 2 diabetes. Clin Gastroenterol Hepatol. 2015;13(3):466–476.e1. doi:10.1016/j.cgh.2014.06.034
10. Siebert J, Reiwer-Gostomska M, Mysliwska J, et al. Glycemic control influences serum angiogenin concentrations in patients with type 2 diabetes. Diabetes Care. 2010;33(8):1829–1830.
11. Lemanska A, Price CA, Jeffreys N, et al. BMI and HbA1c are metabolic markers for pancreatic cancer: matched case-control study using a UK primary care database. PLoS One. 2022;17(10):e0275369.
12. Jhee JH, Joo YS, Han SH, et al. High muscle-to-fat ratio is associated with lower risk of chronic kidney disease development. J Cachexia Sarcopenia Muscle. 2020;11(3):726–734.
13. Ko Y, Jeong H, Khang S, et al. Change of computed tomography-based body composition after adrenalectomy in patients with pheochromocytoma. Cancers. 2022;14(8):1967. doi:10.3390/cancers14081967
14. World Health Organization. Obesity: preventing and managing the global epidemic. Report of a WHO consultation. World Health Organ Tech Rep Ser. 2000;894:
15. Lu ZX, Walker KZ, O’Dea K, et al. A1C for screening and diagnosis of type 2 diabetes in routine clinical practice. Diabetes Care. 2010;33(4):817–819. doi:10.2337/dc09-1763
16. Koga M, Otsuki M, Matsumoto S, et al. Negative association of obesity and its related chronic inflammation with serum glycated albumin but not glycated hemoglobin levels. Clin Chim Acta. 2007;378(1–2):48–52. doi:10.1016/j.cca.2006.10.013
17. Boye KS, Lage MJ, Shinde S, et al. Trends in HbA1c and body mass index among individuals with type 2 diabetes: evidence from a US database 2012–2019. Diabetes Ther. 2021;12(7):2077–2087. doi:10.1007/s13300-021-01084-0
18. Wu TE, Su YW, Chen HS. Mean HbA1c and HbA1c variability are associated with differing diabetes-related complications in patients with type 2 diabetes mellitus. Diabetes Res Clin Pract. 2022;192:110069.
19. Lind M, Odén A, Fahlén M, et al. The true value of HbA1c as a predictor of diabetic complications: simulations of HbA1c variables. PLoS One. 2009;4(2):e4412. doi:10.1371/journal.pone.0004412
20. Ceriello A, Lucisano G, Prattichizzo F, et al. HbA1c variability predicts cardiovascular complications in type 2 diabetes regardless of being at glycemic target. Cardiovasc Diabetol. 2022;21(1):13. doi:10.1186/s12933-022-01445-4
21. Boye KS, Thieu VT, Lage MJ, et al. The association between sustained HbA1c control and long-term complications among individuals with type 2 diabetes: a retrospective study. Adv Ther. 2022;39(5):2208–2221. doi:10.1007/s12325-022-02106-4
22. Parkman HP, Wilson LA, Farrugia G, et al. Delayed gastric emptying associates with diabetic complications in diabetic patients with symptoms of gastroparesis. Am J Gastroenterol. 2019;114(11):1778–1794. doi:10.14309/ajg.0000000000000410
 © 2023 The Author(s). This work is published and licensed by Dove Medical Press Limited. The
full terms of this license are available at https://www.dovepress.com/terms
and incorporate the Creative Commons Attribution
- Non Commercial (unported, 3.0) License.
By accessing the work you hereby accept the Terms. Non-commercial uses of the work are permitted
without any further permission from Dove Medical Press Limited, provided the work is properly
attributed. For permission for commercial use of this work, please see paragraphs 4.2 and 5 of our Terms.
© 2023 The Author(s). This work is published and licensed by Dove Medical Press Limited. The
full terms of this license are available at https://www.dovepress.com/terms
and incorporate the Creative Commons Attribution
- Non Commercial (unported, 3.0) License.
By accessing the work you hereby accept the Terms. Non-commercial uses of the work are permitted
without any further permission from Dove Medical Press Limited, provided the work is properly
attributed. For permission for commercial use of this work, please see paragraphs 4.2 and 5 of our Terms.
Recommended articles
Association Between Obesity and COVID-19 Disease Severity in Saudi Population
Alqahtani FY, Aleanizy FS, Mohamed RAEH, Al-Maflehi N, Alrfaei BM, Almangour TA, Alkhudair N, Bawazeer G, Shamlan G, Alanazi MS
Diabetes, Metabolic Syndrome and Obesity 2022, 15:1527-1535
Published Date: 16 May 2022
Relationship of Plasma Gremlin 1 Levels with Body Adiposity and Glycemic Control in Saudi Female Type 2 Diabetes Patients
Al-Regaiey KA, Habib SS, Alshamasi AR, Alnuwaybit AF, Alwhaibi BA, Alsulais NM, Alothman AI, Alomar FM, Iqbal M
Diabetes, Metabolic Syndrome and Obesity 2022, 15:3429-3436
Published Date: 3 November 2022
Acne Comorbidities
Wang Y, Zhu M, Wu S, Zheng H
Clinical, Cosmetic and Investigational Dermatology 2022, 15:2415-2420
Published Date: 10 November 2022
An Update on the Role and Potential Molecules in Relation to Ruminococcus gnavus in Inflammatory Bowel Disease, Obesity and Diabetes Mellitus

Hong J, Fu T, Liu W, Du Y, Bu J, Wei G, Yu M, Lin Y, Min C, Lin D
Diabetes, Metabolic Syndrome and Obesity 2024, 17:1235-1248
Published Date: 11 March 2024
Metabolic Syndrome and Tendon Disease: A Comprehensive Review
Lai C, Li R, Tang W, Liu J, Duan XD, Bao D, Liu H, Fu S
Diabetes, Metabolic Syndrome and Obesity 2024, 17:1597-1609
Published Date: 9 April 2024