Back to Journals » Journal of Multidisciplinary Healthcare » Volume 17
Association Between Triglyceride-Glucose Index and Hearing Threshold Shifts of Adults in the United States: National Health and Nutrition Examination Survey, 2015–2016
Authors Pan JY, Chen Y, Lin ZH, Lv B, Chen L ![]() , Feng SY
, Feng SY ![]()
Received 10 January 2024
Accepted for publication 10 April 2024
Published 23 April 2024 Volume 2024:17 Pages 1791—1801
DOI https://doi.org/10.2147/JMDH.S454678
Checked for plagiarism Yes
Review by Single anonymous peer review
Peer reviewer comments 2
Editor who approved publication: Dr Scott Fraser
Jia-Ying Pan,1,* Yuan Chen,1,* Zhi-He Lin,1 Bo Lv,1 Lei Chen,2 Shao-Yan Feng1
1Department of Otorhinolaryngology, Head and Neck Surgery, The Fifth Affiliated Hospital of Sun Yat-sen University, Zhuhai, Guangdong, People’s Republic of China; 2Department of Neurosurgery, The Fifth Affiliated Hospital of Sun Yat-sen University, Zhuhai, Guangdong, People’s Republic of China
*These authors contributed equally to this work
Correspondence: Shao-Yan Feng, Department of Otorhinolaryngology, Head and Neck Surgery, The Fifth Affiliated Hospital of Sun Yat-sen University, No. 52, Meihua East Road, Xiangzhou District, Zhuhai, 519000, People’s Republic of China, Tel +86-13626927889, Email [email protected] Lei Chen, Department of Neurosurgery, The Fifth Affiliated Hospital of Sun Yat-sen University, Zhuhai, Guangdong, People’s Republic of China, Tel +86-13902878497, Email [email protected]; [email protected]
Objective: Sensorineural Hearing Loss (SNHL) is a representative human sensory impairment, few studies have paid attention to the correlation between the Triglyceride-Glucose (TyG) index and SNHL to date. We conducted this analysis to elucidate the correlation between the TyG index and pure tone hearing thresholds among US adults.
Methods: Our analysis included 1226 adults (age range: 20 to 69 years old) from the 2015– 2016 National Health and Nutrition Examination Survey (NHANES) data. TyG index was scored into three quartiles. Weighted univariate analysis, weighted multivariate linear regression analyses as well as smooth curve fittings evaluated the associations between TyG index and pure tone hearing thresholds.
Results: In the multiple regression analysis, the second tertile of TyG index was negatively associated with high-frequency hearing thresholds shifts. Furthermore, the non-linear relationships between TyG index and speech-frequency and high-frequency hearing thresholds were identified by smooth curve fittings. After adjusting for potential confounders, the fitted smooth curves were approximately U-shaped, and the two-segment linear regression models were constructed to calculate their inflection points.
Conclusion: Our findings suggested that the TyG index was nearly U-shaped association with speech-frequency and high-frequency hearing thresholds. These results may imply the importance of maintaining a balanced TyG index in health management.
Keywords: Sensorineural Hearing Loss, triglyceride glucose index, cross-sectional study, National Health and Nutrition Examination Survey
Introduction
Sensorineural Hearing Loss (SNHL), a representative human sensory impairment, afflicts an estimated 5% of the global population, making it a significant disabling condition.1 With its lifelong deleterious health impacts, SNHL also affects socio-economic trajectories. In the United States alone, the annual direct and indirect medical costs associated with hearing loss (HL) range between $3.3 million to $12.8 million. In the UK, the economic implications of HL-related unemployment are equally staggering, costing up to £24.8 billion annually.2 As such, the growing prevalence and substantial societal burden necessitate the prioritization of HL prevention and intervention from both medical and public health perspectives. Hence, the identification of risk factors is vital for devising effective prevention and treatment strategies.
Recently conducted studies have unveiled that inflammatory diseases, such as diabetes and cardiovascular disease, are established risk factors for HL.3 Furthermore, various components of the metabolic syndrome, including elevated blood pressure and dyslipidemia, have also demonstrated associations with HL.4 The development of HL is influenced by a combination of oxidative stress, inflammation, systemic diseases and genetic susceptibility.5,6 Up to date, some researchers found that oxidative stress and inflammation may promote the formation of free radicals in the inner ear. A substantial accumulation of free radicals can lead to damage and death of inner ear cells, resulting in SNHL.7 Despite sufficient basic research evidence to prove these risk factors of the pathogenic process, there has still been a lack of well-correlated biomarkers in SNHL disease.
Insulin resistance (IR), a primary manifestation of numerous metabolic disorders, is implicated in oxidative stress and inflammation. Homeostasis Model Assessment of Insulin Resistance (HOMA-IR) is a validated method to assess IR, which was first developed in 1985 by Matthew.8 However, HOMA-IR is difficult to implement in daily clinical practice due to the complexity and the high cost of its process. In order to better conduct quantitative analysis of IR, an important new indicator has emerged in recent years. The Triglyceride-Glucose (TyG) index has gained recognition as a new and reliable surrogate marker specific to IR.9,10 Compared to the HOMA-IR, the TyG index offers plenty of advantages, including independence from fasting insulin levels, lower costs, simpler execution, and broader applicability.11 Recent studies have substantiated the association between the TyG index and metabolic disorders, such as cardiovascular disease, diabetes mellitus, and sleep disturbances.12–14 In the latest study, Liu et assessed the association between the TyG index and hearing impairment (HI), and the research data focused on the unified analysis of conductive HI, sensorineural HI and mixed HI.15 However, we aim to further investigate the association between IR and the cochlea as well as the auditory nervous system.
Herein, this study utilizes samples from the National Health and Nutrition Examination Survey (NHANES), which recently analyzed a significant correlation between dietary inflammatory index and cardiovascular disease-related, and cancer-related mortality,16 showing excellent potential for applications. We excluded conductive or mixed hearing loss from the available audiological data to further explore the association between the TyG index and SNHL.
Methods
Study Population
National Center for Health Statistics (NCHS), NHANES aims at evaluating the health as well as nutrition status of the US population. Our study data were based on the 2015–2016 cycle of NHANES, the cycle was selected because this was the latest cycle where the audiometry and TyG index data were both available. Figure 1 describes the selection procedure of study participants. Ultimately, the study included 1226 adults.
 |
Figure 1 Flow chart of the selection. Notes: Figure 1 described the selection procedure of study participants. Audiometry examinations were performed in adults aged 20–69 years from the 2015–2016 NHANES data. Participants without complete data on hearing levels, otoscopic test, tympanogram test, or Triglyceride Glucose index were excluded, as well as participants with abnormal otoscopic results, poor-quality tympanogram results, or tympanogram with compliance of ≤ 0.3mL. Ultimately, the study included 1226 adults. |
Audiometric Measurement
The audiometry examination consists of pre-examination questions related to hearing, otoscopy, testing of the middle ear, and pure tone air conduction audiometry. Otoscopic examination utilized a Welch-Allyn otoscope (model 25020; Skaneateles Falls, NY). Tympanometry was conducted using the Micro Audiometrics Earscan Acoustic Impedance Tympanometer (Murphy, NC) within a range from −312 daPa to 200 daPa. The audiometry test was carried out in a soundproof booth using an audiometer (model AD226; Interacoustic, Assens, Denmark) with TDH-39P headphones (Telephonics Corp, Farmingdale, NY) and insert earphones (model EARTone 3A; Etymotic Research, Elk Grove Village, IL). All sections of audiometry exam were performed by trained examiners on participants in a dedicated sound-isolating room in the mobile examination center (MEC). Hearing threshold testing was conducted on both ears of participants across seven frequencies (500, 1000, 2000, 3000, 4000, 6000, and 8000 Hz).17
Definition of Sensorineural Hearing Loss (SNHL)
Sensorineural Hearing Loss (SNHL) was indicated in cases where the otoscopic examination showed normal findings and the tympanogram produced results with a peak of more than 0.3 mL. Individuals with abnormal otoscopic results, low-quality tympanogram results, or a peak response of less than 0.3 mL were not included in further analysis due to the possibility of having conductive or mixed hearing loss. Pure tone hearing thresholds included: 0.5, 1, and 2 kHz low-frequency pure tone hearing thresholds; 0.5, 1, 2, and 4 kHz speech-frequency pure tone hearing thresholds; 4, 6, and 8 kHz high-frequency pure tone hearing thresholds. Hearing loss referred to a hearing threshold of no less than 20 dB at speech-frequency pure tone hearing thresholds in the better ear.18
TyG Index Measurement
The TyG index is calculated from fasting triglyceride (TG) and Fasting Plasma Glucose (FPG), and  . An enzymatic assay measured the TG concentration and FPG under the assistance of automatic biochemistry analyzer. The Roche Modular P and Roche Cobas 6000 chemistry analyzers served for measuring the serum TG concentration. The Roche/Hitachi Cobas C 501 chemistry analyzer measured the FPG by hexokinase-mediated reaction.
Covariates
Potential covariates potentially confounding the relevance of the TyG index to the auditory threshold were concluded in a multivariate adjusted model. Covariates in the study consisted of age, gender, race/ethnicity, educational level, diabetes, hypertension, noise exposure, smoking status, C-reactive protein (CRP), high-density lipoprotein (HDL) cholesterol, insulin, total cholesterol level (TCL), glycated haemoglobin (HbA1c), and body mass index (BMI). Information of age, gender, race/ethnicity, educational level, diabetes, hypertension and smoking status came from the home interview; noise exposure data were gained from the pre-screening of the hearing test; BMI data were collected by physical examination and BMI is graded as <18.5, 18.5 to <25, 25 to <30 and ≥30 kg/m2, which corresponded to underweight group, normal weight group, overweight group and obese group. In a central laboratory in collaboration with the research center, TCL, HDL cholesterol, CRP, insulin and HbA1c were measured via conventional methods. If the participant answers “yes”, then he or she is determined to have diabetes and the “threshold” response is also considered to have diabetes;19 the participant is diagnosed with hypertension once he/she answers “yes” to the question “if a doctor or other health professional told you that you had hypertension?”;19 smoking status answers are grouped as “ever”, “now” or “never”, ie “have you ever smoked at least 100 cigarettes in your life?” and “do you currently smoke?”;19 noise exposure refers to “being exposed to noisy environment or listening to music on headphones in the last 24 hours”.20
Statistical Analysis
Based on the NCHS guideline analysis, the study estimated representative indicators for the general US population using weights from the 2015–2016 NHANES cycle (WTSC2YR). TyG indices were divided into three quartiles. Statistical differences between samples in demographics and potentially hearing-related covariate weights, grouped by of TyG index tertile were assessed (Table 1). Classification data and continuous data are in the form of percentages and mean ± standard deviation (SD), respectively. Multiple linear regression analysis was conducted to confirm the regression coefficients (β) and the 95% CI between the TyG index and the low-frequency, speech-frequency, and high-frequency PTAs (Table 2). Relevant covariates in the three regression models were adjusted. The crude model did not include any adjustment. In Model I, adjustments were made for gender and age. Model II included adjustments for all covariates in the study adjusted except HDL cholesterol. The βs and 95% CIs for hearing thresholds were analyzed for each TyG Index/age, TyG Index/sex and TyG Index/race subgroup and their interactions were estimated (Table 3). The relevance of the TyG index to auditory threshold offset was explored using curve fitting, and potential confounders were adjusted (Figure 2). Then, the threshold effect of TyG index on the auditory threshold shift, based on a smoothing plot, was tested using a two-segment linear regression model. A log-likelihood ratio test determined whether there was a threshold. Inflection point calculation relied on recursive methods and the maximum model likelihood (Table 4). A significance level of P < 0.05 was used to report statistical significance. The R statistical programming language 3.6.1 (R Statistical Computing Foundation) together with EmpowerStats software (X&Y Solutions) were utilized for the statistical analysis.
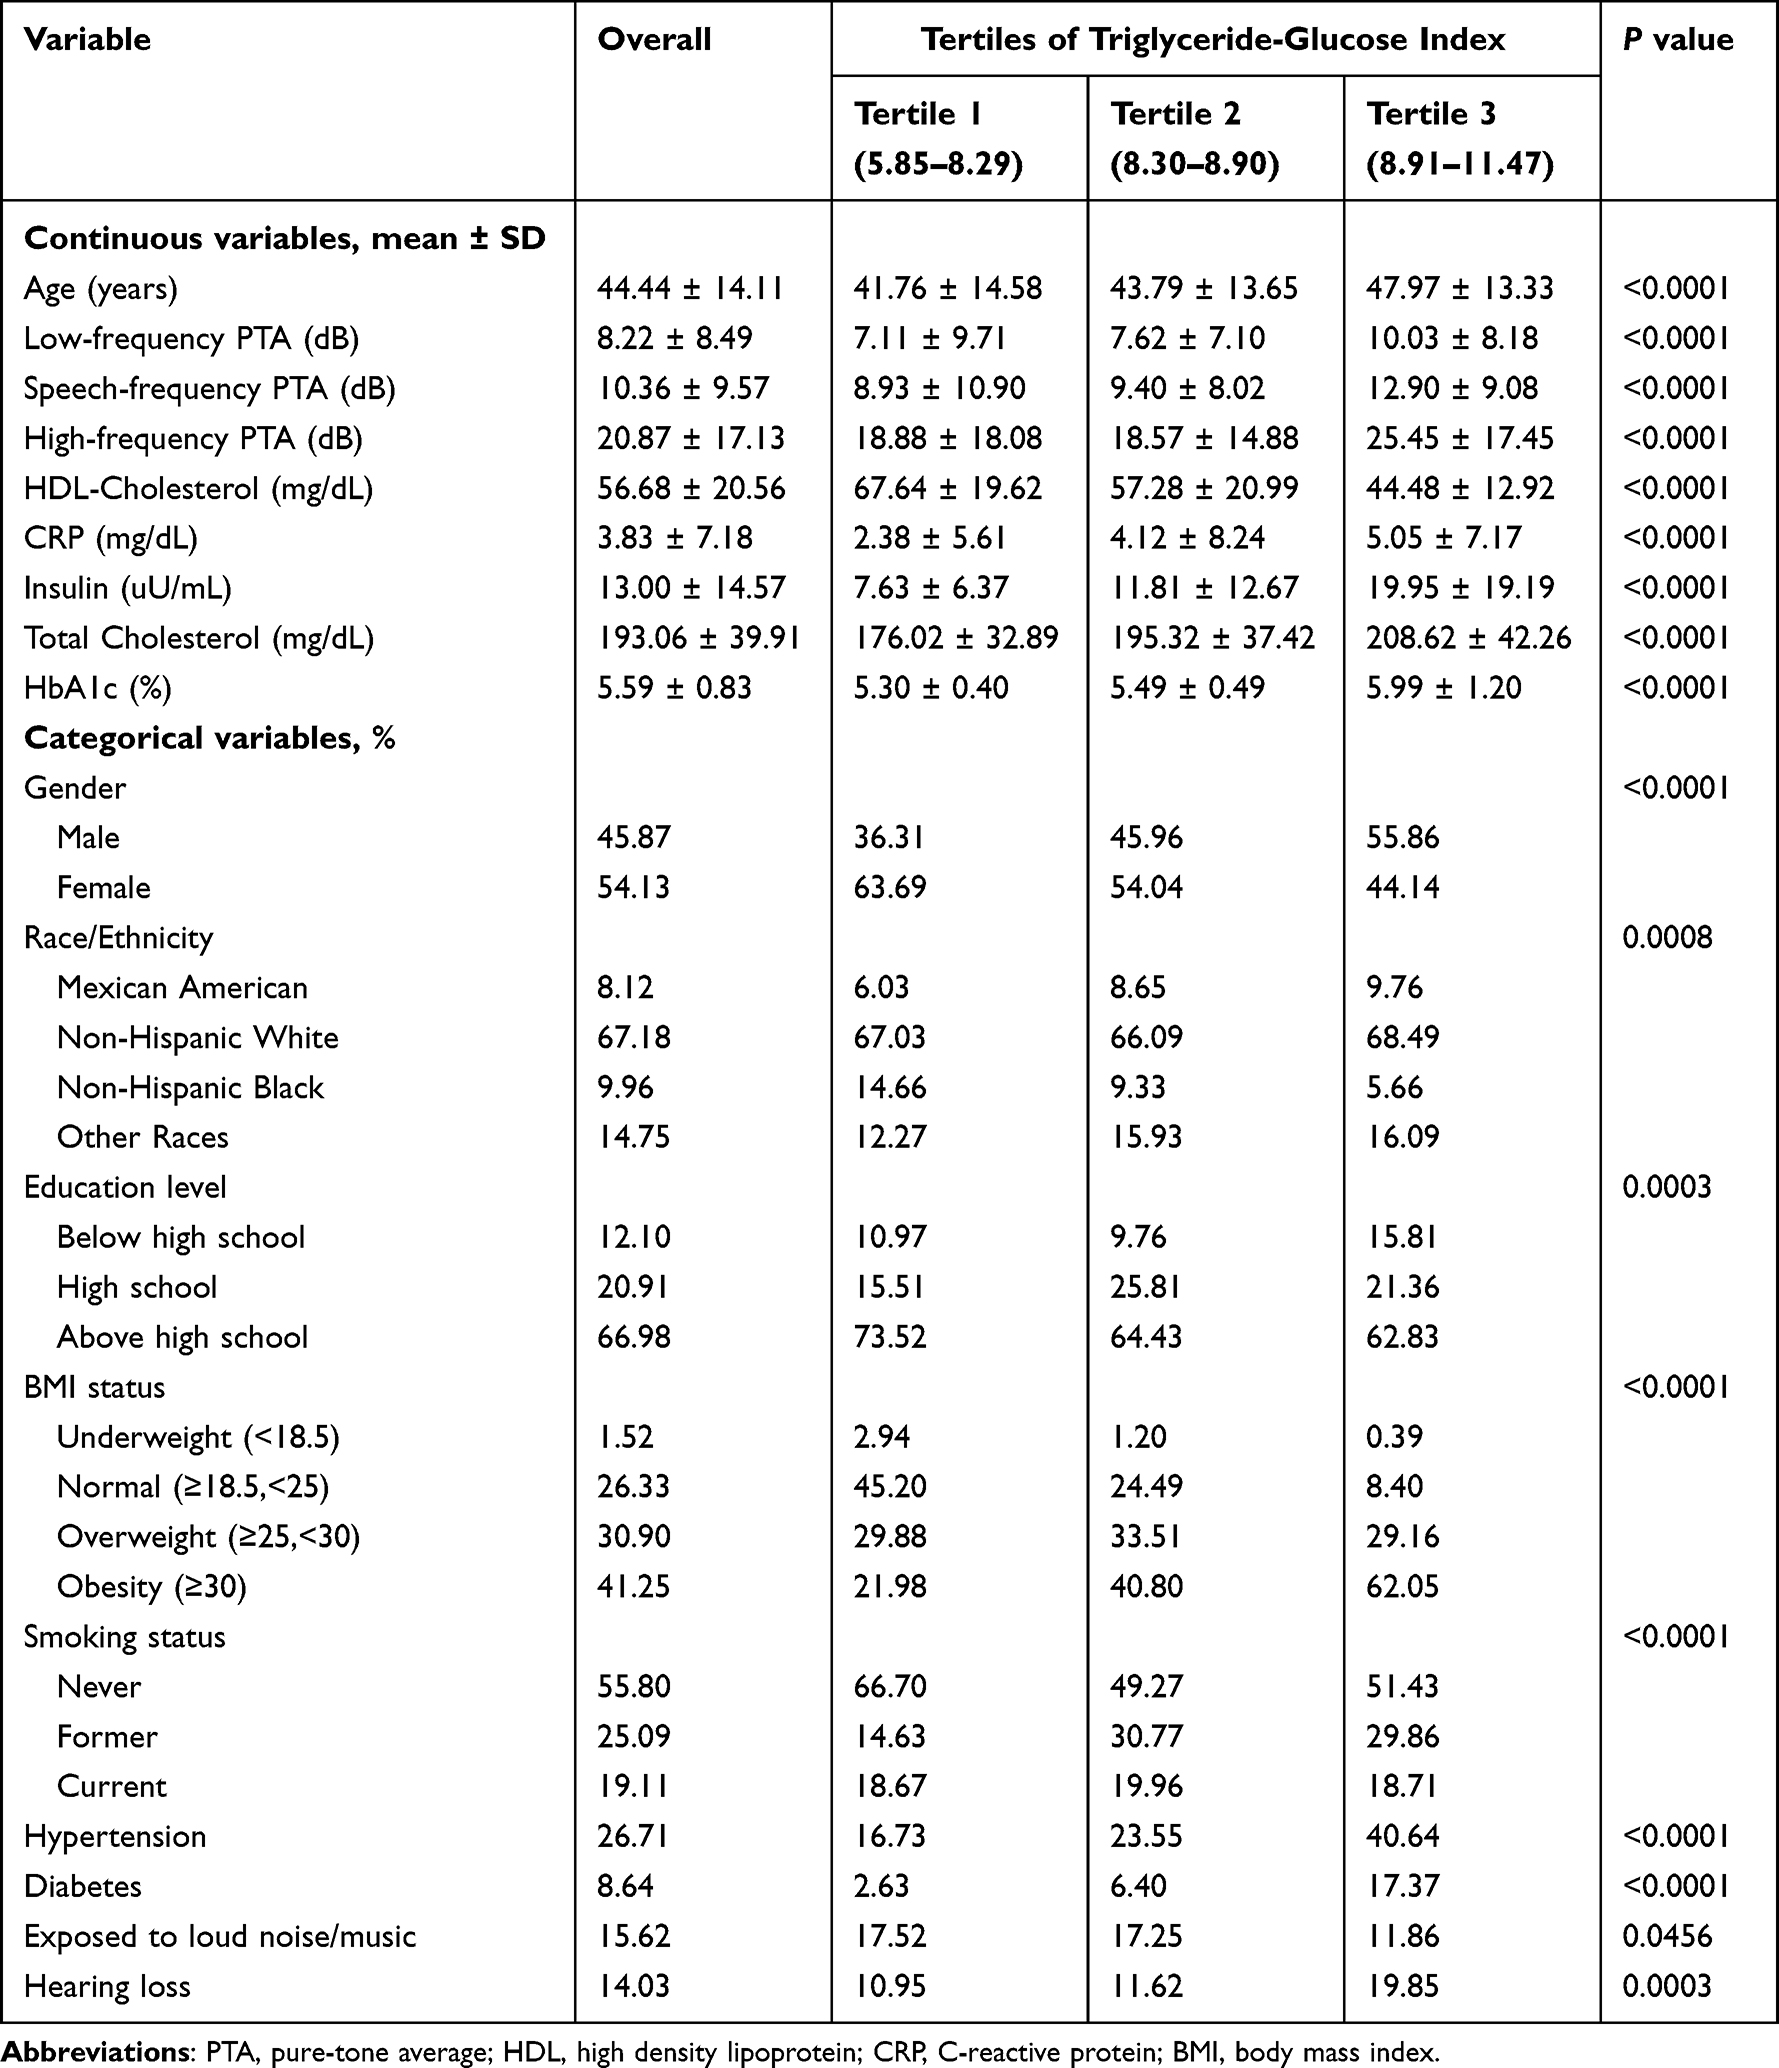 |
Table 1 The Weighted Demographic Characteristics of Study Participants |
 |
Table 2 The Univariate Analysis of Comparison of Variables in Hearing Threshold Group |
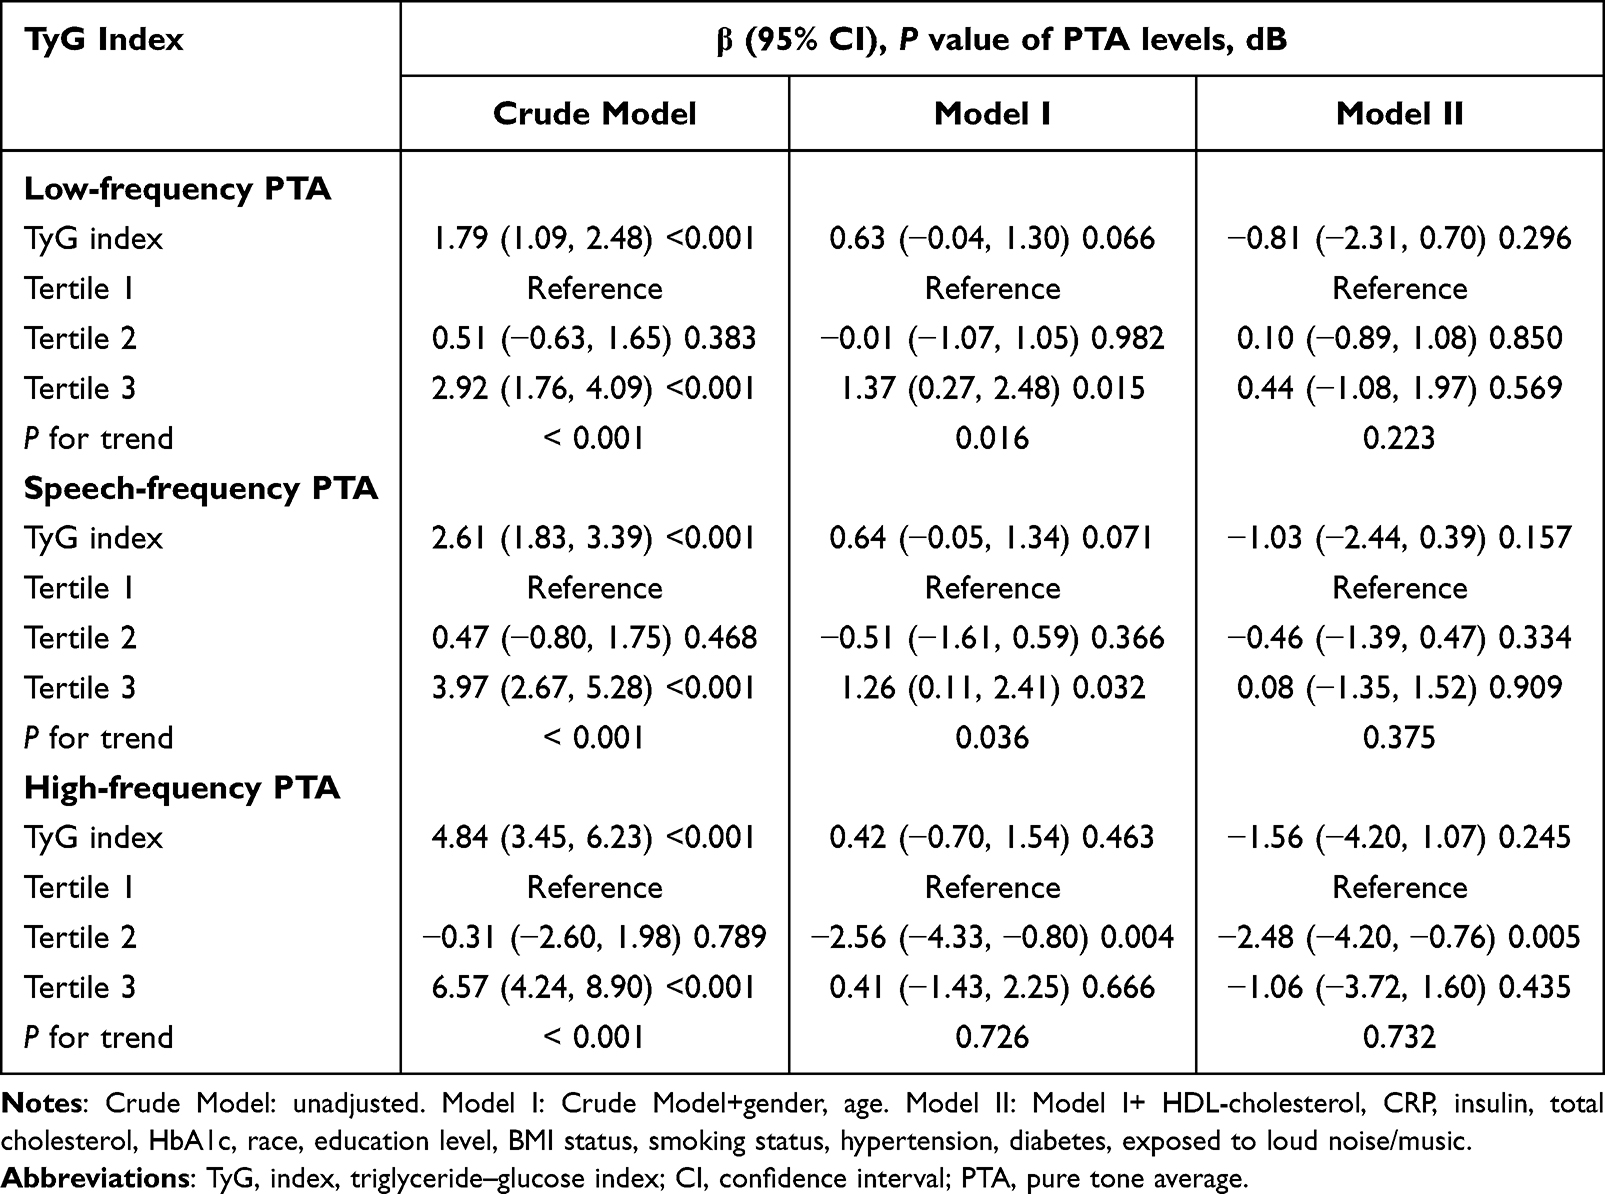 |
Table 3 Multivariable Linear Regression Models for Outcome of Hearing Thresholds |
 |
Table 4 The Results of Two-Piecewise Linear Regression Model Between TyG Index and Hearing Thresholds |
 |
Figure 2 The relationship between TyG index and hearing threshold shifts: (A) low-frequency PTA, (B) speech-frequency PTA and (C) high-frequency PTA. Abbreviations: PTA, pure tone average; TyG index, triglyceride-glucose index. Notes: Figure 2 used smooth curve fittings to explore the relationship between TyG index and hearing threshold shifts, after the adjustment of potential confounders. Finally, TyG index shows a non-linear relevance to the speech-frequency and high-frequency PTAs, but not to low-frequency PTA. The fitted smooth curves were approximately U-shaped. |
Results
Characteristics of Participants
The tertile of the TyG index is adopted for stratifying the baseline characteristics exhibited by the 1226 participants (weighted mean, age 44.44 ± 14.11 years), as shown in Table 1. In this study, 45.87% are male and 54.13% are female; 72.15% of the participants are overweight, 26.71% have hypertension and 5.94% have diabetes. The mean ± SD of the low-frequency, speech-frequency and high-frequency hearing thresholds are 8.22 ± 8.49, 10.36 ± 9.57 and 20.87 ± 17.13 dB respectively. The means ± SD for HDL-cholesterol, CRP, insulin, TC and HbA1c are 56.68 ± 20.56, 3.83 ± 7.18, 13.00 ± 14.57, 193.06 ± 39.91 and 5.59 ± 0.83 respectively; 14.03% of the participants suffer from HL. Additionally, subgroup differences in age, low-frequency, speech-frequency and high-frequency hearing thresholds, HDL-cholesterol, CRP, insulin, TC, HbA1c, gender, BMI status, hypertension, diabetes, smoking status and HL have statistical significance (P < 0.05).
Associations Between TyG Index and Hearing Threshold Shifts
A univariate analysis finds a significant association between age, gender, hypertension, diabetes, noise exposure, insulin, HbA1c and TyG index (continuous TyG index and TyG index in three quartiles) and low-frequency, speech-frequency and high-frequency hearing thresholds (P < 0.001) (Table 2). A multiple regression analysis focuses on more deeply exploring the relevance of the TyG index to hearing threshold shift. In the unadjusted model (crude model), as shown in Table 3, when the TyG index is a continuous variable, it shows an obvious relevance to low-frequency (β=1.79, 95% CI: 1.09, 2.48; P < 0.001), speech-frequency (β=2.61, 95% CI: 1.83, 3.39; P < 0.01) and high-frequency (β=4.84, 95% CI: 3.45, 6.23; P < 0.001) PTA hearing threshold shifts; In Model II, however, no correlation is seen between TyG index and low-frequency (β=−0.81, 95% CI: −2.31, 0.70; P = 0.296), speech-frequency (β=−1.03, 95% CI: −2.44, 0.39; P = 0.157) and high-frequency (β=−1.56, 95% CI: −4.20. 1.07; P = 0.245) hearing thresholds. In the case of the lowest tertile of the TyG index is the reference, the second tertile of the TyG index exhibits a negative relevance to the high-frequency(β=−2.56, 95% CI:-4.33,-0.80; P < 0.001 and β=−2.48, 95% CI:-4.20,-0.76; P < 0.001) hearing threshold shifts in both Model I and Model II. Nevertheless, the tertile of the TyG index does not show a relevance to the low-frequency, speech-frequency hearing threshold shifts in Models I and II.
Non-Linear Relationship Between TyG Index and Hearing Threshold Shifts
In the smooth curve fittings, the TyG index shows a non-linear relevance to the speech-frequency and high-frequency hearing thresholds, but not to low-frequency hearing thresholds. After adjusting for potential confounders, the fitted smooth curves were approximately U-shaped (Figure 2). The inflection point calculation relies on a two-segment linear regression model where the TyG index ratio correlates with low-frequency, speech-frequency and high-frequency hearing thresholds values of 8.14, 8.35 and 8.57, respectively. On the left side, the β-values for low-frequency, speech-frequency and high-frequency hearing thresholds are respectively −2.00 (95% CI:-4.12, 012; P = 0.0651), 1.71 (95% CI:-3.26, −017; P = 0.0297), and −2.75 (95% CI:-511, −0.39; P = 0.0228). The effect estimates corresponding to the right side are 0.81 (95% CI: −0.81, 1.81; P = 0.1085), 1.17 (95% CI: 0.16, 2.18; P = 0.0228) and 2.73 (95% CI: 0.67, 4.80; P= 0.0096) respectively. Speech-frequency and high-frequency hearing thresholds fall as the TyG index goes up until to the inflection point (8.35 and 8.57 respectively). When the TyG index exceeds the inflection point, the speech-frequency and high-frequency hearing thresholds increase with the TyG index (Table 4).
Discussion
This research conducted an analysis on a cohort of 1260 adults obtained from the NHANES database to further assess the association between the TyG index and SNHL. After correcting for confounding variables such as sex, age, race, We found that there is a U-shaped relationship between TyG index and speech-frequency and high-frequency PTAs, with inflection points of 8.35 and 8.57, respectively (as depicted in Table 4 and Figure 2). The findings suggest that a strong association between the TyG index and the sensorineural hearing thresholds.
In recent clinical practice, a novel and robust assessment of IR, known as the TyG index, has emerged. Numerous recent studies have established that an elevated TyG index is associated with elevated risks of diabetes, hypertension, and non-alcoholic fatty liver disease, and is capable of predicting the onset of cardiovascular diseases.21,22 As per our awareness, a recent epidemiological study has investigated the association between TyG index and HI.14 The findings of this study demonstrated a positive correlation between the TyG index and the risk of HI, indicating a linear association between these two variables. The difference between our research and theirs is that, when defining and calculating HL, conductive and mixed HL were excluded, focusing solely on SNHL for correlation analysis with the TyG index. Considering the ability of IR to reflect pathophysiological processes such as oxidative stress and inflammation, along with the reliable indication of IR by the TyG index, this study aims to establish a direct association between the TyG index and SNHL. This will facilitate further investigation into the impact of IR and potential metabolic disorders on both the cochlea and auditory nervous system. Subgroup analyses according to age and gender were performed and did not affect our conclusions (data not shown), so we analyzed the data as a whole.
In this investigation, the TyG index is non-linearly related to both speech-frequency and high-frequency hearing thresholds. A piecewise linear regression model assisted in identifying an inflection point at 8.35 and 8.57 for speech-frequency and high-frequency hearing thresholds, respectively. Prior to the inflection point, a negative correlation existed between the TyG index and both speech-frequency and high-frequency hearing thresholds. Conversely, a positive correlation arose when the TyG index exceeded the inflection point. In a univariate analysis, we discovered significant associations between diabetes, insulin, and HBA1c and low-frequency, speech-frequency and high-frequency hearing thresholds, a finding generally aligned with previous investigations. Three recent meta-analyses have demonstrated a close association between diabetes and Sensorineural Hearing Loss.23–25 Another cohort study based on NHANES dataset has also shown that diabetes patients might be exposed to a higher risk of hearing loss26 Further, Loprinzi et al studied the relationship between biomarkers for cardiovascular disease and hearing sensitivity with the NHANES database and ascertained a positive correlation between human insulin levels and high-frequency hearing thresholds.27 Additionally, Braffett et al recruited 1150 participants for a hearing study in the Epidemiology of Diabetes Interventions and Complications (DCCT/EDIC) and observed in follow-ups the relevance of higher HBA1c level to HL in speech and high frequencies in 2019.28 According to the systematic review of a meta-analysis in 2023, HBA1c might serve as a valuable biomarker for prognostic evaluation of SNHL.29 Thus, sufficient studies have demonstrated a significant association between SNHL and these covariates.
We found that within a certain range, a higher TyG index was positively associated with speech-frequency and high-frequency hearing thresholds. This phenomenon may be attributed to elevated blood sugar or blood lipid levels, which might be related to impairment of the insulin system and subsequently result in SNHL. Angeliki and team observed that a decrease in insulin sensitivity led to a decline in glucose uptake, accompanied by an elevation in plasma glucose and triglyceride concentrations.30 Furthermore, more and more studies have proved that hyperglycemia or hyperlipidemia is one of the key factors leading to SNHL.31–33 Previous research has established that insulin receptors, glucose transporters, and insulin signaling components exist in sensory receptors, cochlear supporting cells, stria vascularis, and spiral ligament, which implies that auditory and balance functions can be easily impacted by impaired glucose utilization.34–39 Additionally, hyperglycemia resulting from insulin resistance can instigate a range of functional pathologies, including mitochondrial DNA damage.40,41 Affected mitochondria can disrupt oxidative phosphorylation and ATP production, consequently leading to dysfunction in organ systems with high energy demands, such as the kidneys and the inner ear stria vascularis.42,43
However, a lower TyG index was also associated with an increase in speech-frequency and high-frequency hearing thresholds prior to the inflection point. Interestingly, there is indeed evidence suggesting that excessively low levels of TG or FPG may have detrimental effects on health. According to a systematic investigation together with and a meta-analysis conducted recently, low FPG (<4.0 mmol/L) reported elevated future risk of the all-cause mortality, total stroke and ischemic stroke, and primary cardiovascular diseases in people who do not have baseline diabetes or cardiovascular disease.44 It is hypothesized that these findings are possibly attributable to cellular dysfunction. Pancreatic cells, which can remarkably help to regulate and maintain glucose, amino, and lipid homeostasis,45 may manifest hypoglycemia as a sign of dysfunction, and potentially a pivotal factor in diabetes pathogenesis.46 Besides, in a prospective cohort analysis covering a large scale, low serum TG levels might heighten the hemorrhagic stroke risk in females, which could also predict the cardiogenic death in heart failure patients.47 The TyG index exhibits a non-linear relationship with the hearing threshold, which implies that inappropriate TyG index level is possibly a potential target for intervention to forestall the development of speech-frequency and high-frequency HL. In our study, particularly low and high TyG would augment speech-frequency and high-frequency hearing thresholds, thus escalating the risk of HL.48,49 These results indicate the necessity for maintaining the TyG index at an optimal level, emphasizing that a TyG index that is either too high or too low can be deleterious.
Overall, our study also has some limitations. Since the database has not been updated with the latest data, we are unable to access it. We are actively engaging with the centers for disease control and prevention (CDC) to acquire more up-to-date data in order to identify relevant indicators of SNHL. The data came from NHANES, which is methodologically standardized and robust. Participants who had abnormal otoscopy results, subpar tympanogram quality, or tympanogram compliance ≤0.3mL were excluded to circumvent the analysis of data pertaining to conductive or mixed HL. Despite certain limitations, we conducted a meticulous analysis of the association between the TyG index and SNHL by implementing enhanced statistical methodologies.
Conclusion
Based on our NHANES analysis, the TyG index was nearly U-shaped association with speech-frequency and high-frequency pure tone hearing thresholds. In a certain range, a higher TyG index was associated with the elevated hearing thresholds across speech-frequency and high-frequency. However, it is important to note that this effect might be reversed when the index falls below the certain threshold. These findings highlight the importance of maintaining a well-balanced TyG index for effective health management.
Data Sharing Statement
Data in the study could be obtained publicly on the NHANES website (www.cdc.gov/nchs/nhanes/).
Ethics Statement
The NHANES 2015–2016 was approved by the NCHS Research Ethics Review Board (Continuation of Protocol #2011-17), and acquired all the eligible participants’ informed consent.
Acknowledgments
We thank the NHANES for providing the data, without them this study would not have been possible. This manuscript is also available on ResearchSquare (https://www.researchsquare.com/article/rs-3445985/v1).
Author Contributions
All authors made a significant contribution to the work reported, whether that is in the conception, study design, execution, acquisition of data, analysis and interpretation, or in all these areas; took part in drafting, writting, or substantially revising the article; agreed on the journal to which the article will be submitted; reviewed and agreed on all versions of the article before submission; and agree to be accountable for the contents of the article.
Funding
The authors received no financial support for the research.
Disclosure
The authors declared no potential conflicts of interest with respect to the research, authorship, and/or publication of this article.
References
1. Li W, Zhao Z, Lu Z, Ruan W, Yang M, Wang D. The prevalence and global burden of hearing loss in 204 countries and territories, 1990–2019. Environ Sci Pollut Res Int. 2022;29(8):12009–12016. doi:10.1007/s11356-021-16582-8
2. Huddle MG, Goman AM, Kernizan FC, et al. The economic impact of adult hearing loss: a systematic review. JAMA Otolaryngol Head Neck Surg. 2017;143(10):1040–1048. doi:10.1001/jamaoto.2017.1243
3. Mitchell P, Gopinath B, McMahon CM, et al. Relationship of Type 2 diabetes to the prevalence, incidence and progression of age-related hearing loss. Diabet Med. 2009;26(5):483–488. doi:10.1111/j.1464-5491.2009.02710.x
4. Evans MB, Tonini R, Shope CD, et al. Dyslipidemia and auditory function. Otol Neurotol. 2006;27(5):609–614. doi:10.1097/01.mao.0000226286.19295.34
5. Verschuur CA, Dowell A, Syddall HE, et al. Markers of inflammatory status are associated with hearing threshold in older people: findings from the Hertfordshire Ageing Study. Age Ageing. 2012;41(1):92–97. doi:10.1093/ageing/afr140
6. Fujimoto C, Yamasoba T. Oxidative stresses and mitochondrial dysfunction in age-related hearing loss. Oxid Med Cell Longev. 2014;2014:582849. doi:10.1155/2014/582849
7. Le Prell CG, Gagnon PM, Bennett DC, Ohlemiller KK. Nutrient-enhanced diet reduces noise-induced damage to the inner ear and hearing loss. Transl Res. 2011;158(1):38–53. doi:10.1016/j.trsl.2011.02.006
8. Matthews DR, Hosker JP, Rudenski AS, Naylor BA, Treacher DF, Turner RC. Homeostasis model assessment: insulin resistance and beta-cell function from fasting plasma glucose and insulin concentrations in man. Diabetologia. 1985;28(7):412–419. doi:10.1007/BF00280883
9. Hong S, Han K, Park CY. The insulin resistance by triglyceride glucose index and risk for dementia: population-based study. Alzheimers Res Ther. 2021;13(1):9. doi:10.1186/s13195-020-00758-4
10. Zhu B, Wang J, Chen K, et al. A high triglyceride glucose index is more closely associated with hypertension than lipid or glycemic parameters in elderly individuals: a cross-sectional survey from the Reaction Study. Cardiovasc Diabetol. 2020;19(1):112. doi:10.1186/s12933-020-01077-6
11. Simental-Mendía LE, Rodríguez-Morán M, Guerrero-Romero F. The product of fasting glucose and triglycerides as surrogate for identifying insulin resistance in apparently healthy subjects. Metab Syndr Relat Disord. 2008;6(4):299–304. doi:10.1089/met.2008.0034
12. Pang J, Qian L, Che X, Lv P, Xu Q. TyG index is a predictor of all-cause mortality during the long-term follow-up in middle-aged and elderly with hypertension. Clin Exp Hypertens. 2023;45(1):2272581. doi:10.1080/10641963.2023.2272581
13. Zhang Q, Xiao S, Jiao X, Shen Y. The triglyceride-glucose index is a predictor for cardiovascular and all-cause mortality in CVD patients with diabetes or pre-diabetes: evidence from NHANES 2001–2018. Cardiovasc Diabetol. 2023;22(1):279. doi:10.1186/s12933-023-02030-z
14. Pei H, Li S, Su X, Lu Y, Wang Z, Wu S. Association between triglyceride glucose index and sleep disorders: results from the NHANES 2005–2008. BMC Psychiatry. 2023;23(1):156. doi:10.1186/s12888-022-04434-9
15. Liu L, Qin M, Ji J, Wang W. Correlation between hearing impairment and the Triglyceride Glucose Index: based on a national cross-sectional study. Front Endocrinol. 2023;14:1216718. doi:10.3389/fendo.2023.1216718
16. Gao Y, Wang Y, Zhang D, Wu T, Li Q. The relationship between dietary inflammatory index and all-cause, cardiovascular disease-related, and cancer-related mortality. J Multidiscip Healthc. 2023;16:2543–2556. doi:10.2147/JMDH.S423558
17. Su BM, Chan DK. Prevalence of hearing loss in US children and adolescents: findings from NHANES 1988–2010. JAMA Otolaryngol Head Neck Surg. 2017;143(9):920–927. doi:10.1001/jamaoto.2017.0953
18. Chadha S, Kamenov K, Cieza A. The world report on hearing, 2021. Bull World Health Organ. 2021;99(4):242–242A. doi:10.2471/BLT.21.285643
19. Szeto B, Valentini C, Lalwani AK. Low vitamin D status is associated with hearing loss in the elderly: a cross-sectional study. Am J Clin Nutr. 2021;113(2):456–466. doi:10.1093/ajcn/nqaa310
20. Ding N, Park SK. Perfluoroalkyl substances exposure and hearing impairment in US adults. Environ Res. 2020;187:109686. doi:10.1016/j.envres.2020.109686
21. Tai S, Fu L, Zhang N, et al. Association of the cumulative triglyceride-glucose index with major adverse cardiovascular events in patients with type 2 diabetes. Cardiovasc Diabetol. 2022;21(1):161. doi:10.1186/s12933-022-01599-1
22. Yu X, Wang L, Zhang W, et al. Fasting triglycerides and glucose index is more suitable for the identification of metabolically unhealthy individuals in the Chinese adult population: a nationwide study. J Diabetes Investig. 2019;10(4):1050–1058. doi:10.1111/jdi.12975
23. Samocha-Bonet D, Wu B, Ryugo DK. Diabetes mellitus and hearing loss: a review. Ageing Res Rev. 2021;71:101423. doi:10.1016/j.arr.2021.101423
24. Mittal R, McKenna K, Keith G, Lemos JRN, Mittal J, Hirani K. A systematic review of the association of Type I diabetes with sensorineural hearing loss. PLoS One. 2024;19(2):e0298457. doi:10.1371/journal.pone.0298457
25. Gioacchini FM, Pisani D, Viola P, et al. Diabetes mellitus and hearing loss: a complex relationship. Medicina. 2023;59(2):269. doi:10.3390/medicina59020269
26. Bainbridge KE, Cheng YJ, Cowie CC. Potential mediators of diabetes-related hearing impairment in the US population: National Health and Nutrition Examination Survey 1999–2004. Diabetes Care. 2010;33(4):811–816. doi:10.2337/dc09-1193
27. Loprinzi PD, Joyner C. Relationship between objectively measured physical activity, cardiovascular disease biomarkers, and hearing sensitivity using data from the National Health and Nutrition Examination Survey 2003–2006. Am J Audiol. 2017;26(2):163–169. doi:10.1044/2017_AJA-16-0057
28. Braffett BH, Lorenzi GM, Cowie CC, et al. Risk factors for hearing impairment in type 1 diabetes. Endocr Pract. 2019;25(12):1243–1254. doi:10.4158/EP-2019-0193
29. Niknazar S, Bazgir N, Shafaei V, Abbaszadeh HA, Zali A, Asghar Peyvandi A. Assessment of prognostic biomarkers in sudden sensorineural hearing loss: a systematic review and meta-analysis. Clin Biochem. 2023;121–122:110684. doi:10.1016/j.clinbiochem.2023.110684
30. Angelidi AM, Filippaios A, Mantzoros CS. Severe insulin resistance syndromes. J Clin Invest. 2021;131(4):e142245. doi:10.1172/JCI142245
31. Akcay G, Danısman B, Basaranlar G, Guzel P, Derin N, Derin AT. The effect of increase in blood glucose level on hearing loss. Braz J Otorhinolaryngol. 2022;88(Suppl 3):S95–S102. doi:10.1016/j.bjorl.2022.06.003
32. Nguyen PTT, Song H, Kim B, et al. Age-related hearing loss was accelerated by apoptosis of spiral ganglion and stria vascularis cells in ApoE KO mice with hyperglycemia and hyperlipidemia. Front Neurol. 2022;13:1016654. doi:10.3389/fneur.2022.1016654
33. Song I, Kim M, Choi H, et al. Hydrophilic and lipophilic statin use and risk of hearing loss in hyperlipidemia using a Common Data Model: multicenter cohort study. Sci Rep. 2023;13(1):12373. doi:10.1038/s41598-023-39316-x
34. Agrawal Y, Carey JP, Della Santina CC, Schubert MC, Minor LB. Diabetes, vestibular dysfunction, and falls: analyses from the National Health and Nutrition Examination Survey. Otol Neurotol. 2010;31(9):1445–1450. doi:10.1097/MAO.0b013e3181f2f035
35. Degerman E, Rauch U, Lindberg S, Caye-Thomasen P, Hultgårdh A, Magnusson M. Expression of insulin signalling components in the sensory epithelium of the human saccule. Cell Tissue Res. 2013;352(3):469–478. doi:10.1007/s00441-013-1614-x
36. Edamatsu M, Kondo Y, Ando M. Multiple expression of glucose transporters in the lateral wall of the cochlear duct studied by quantitative real-time PCR assay. Neurosci Lett. 2011;490(1):72–77. doi:10.1016/j.neulet.2010.12.029
37. Huerzeler N, Petkovic V, Sekulic-Jablanovic M, Kucharava K, Wright MB, Bodmer D. Insulin receptor and glucose transporters in the mammalian cochlea. Audiol Neurootol. 2019;24(2):65–76. doi:10.1159/000499561
38. Murillo-Cuesta S, Camarero G, González-Rodríguez A, et al. Insulin receptor substrate 2 (IRS2)-deficient mice show sensorineural hearing loss that is delayed by concomitant protein tyrosine phosphatase 1B (PTP1B) loss of function. Mol Med. 2012;18(1):260–269. doi:10.2119/molmed.2011.00328
39. Yamahara K, Yamamoto N, Nakagawa T, Ito J. Insulin-like growth factor 1: a novel treatment for the protection or regeneration of cochlear hair cells. Hear Res. 2015;330(Pt A):2–9. doi:10.1016/j.heares.2015.04.009
40. Kowluru RA, Kowluru A, Mishra M, Kumar B. Oxidative stress and epigenetic modifications in the pathogenesis of diabetic retinopathy. Prog Retin Eye Res. 2015;48:40–61. doi:10.1016/j.preteyeres.2015.05.001
41. Wang XB, Cui NH, Liu X, Liu X. Mitochondrial 8-hydroxy-2’-deoxyguanosine and coronary artery disease in patients with type 2 diabetes mellitus. Cardiovasc Diabetol. 2020;19(1):22. doi:10.1186/s12933-020-00998-6
42. Rabøl R, Boushel R, Dela F. Mitochondrial oxidative function and type 2 diabetes. Appl Physiol Nutr Metab. 2006;31(6):675–683. doi:10.1139/h06-071
43. Wei PZ, Szeto CC. Mitochondrial dysfunction in diabetic kidney disease. Clin Chim Acta. 2019;496:108–116. doi:10.1016/j.cca.2019.07.005
44. Liao HW, Saver J, Yeh HC, et al. Low fasting glucose and future risks of major adverse outcomes in people without baseline diabetes or cardiovascular disease: a systematic review and meta-analysis. BMJ Open. 2019;9(7):e026010. doi:10.1136/bmjopen-2018-026010
45. Kozdag G, Ertas G, Emre E, et al. Low serum triglyceride levels as predictors of cardiac death in heart failure patients. Tex Heart Inst J. 2013;40(5):521–528.
46. Hædersdal S, Andersen A, Knop FK, Vilsbøll T. Revisiting the role of glucagon in health, diabetes mellitus and other metabolic diseases. Nat Rev Endocrinol. 2023;19(6):321–335. doi:10.1038/s41574-023-00817-4
47. Rist PM, Buring JE, Ridker PM, Kase CS, Kurth T, Rexrode KM. Lipid levels and the risk of hemorrhagic stroke among women. Neurology. 2019;92(19):e2286–e2294. doi:10.1212/WNL.0000000000007454
48. Capozzi ME, D’Alessio DA, Campbell JE. The past, present, and future physiology and pharmacology of glucagon. Cell Metab. 2022;34(11):1654–1674. doi:10.1016/j.cmet.2022.10.001
49. Wang Z, Qian H, Zhong S, Gu T, Xu M, Yang Q. The relationship between triglyceride-glucose index and albuminuria in United States adults. Front Endocrinol. 2023;14:1215055. doi:10.3389/fendo.2023.1215055
 © 2024 The Author(s). This work is published and licensed by Dove Medical Press Limited. The
full terms of this license are available at https://www.dovepress.com/terms
and incorporate the Creative Commons Attribution
- Non Commercial (unported, 3.0) License.
By accessing the work you hereby accept the Terms. Non-commercial uses of the work are permitted
without any further permission from Dove Medical Press Limited, provided the work is properly
attributed. For permission for commercial use of this work, please see paragraphs 4.2 and 5 of our Terms.
© 2024 The Author(s). This work is published and licensed by Dove Medical Press Limited. The
full terms of this license are available at https://www.dovepress.com/terms
and incorporate the Creative Commons Attribution
- Non Commercial (unported, 3.0) License.
By accessing the work you hereby accept the Terms. Non-commercial uses of the work are permitted
without any further permission from Dove Medical Press Limited, provided the work is properly
attributed. For permission for commercial use of this work, please see paragraphs 4.2 and 5 of our Terms.
Recommended articles
Association Between Composite Dietary Antioxidant Index and Endometriosis from NHANES 2001–2006: A Cross-Sectional Study
Xu X, Wu H, Liu Y
International Journal of Women's Health 2024, 16:1845-1854
Published Date: 5 November 2024