
Back to Journals » Journal of Multidisciplinary Healthcare » Volume 18
Association Between Triglyceride and Incident Diabetes Mellitus: A Secondary Retrospective Analysis Based on a Chinese Cohort Study
Authors Peng H, Wang B, Yang W, Jia R, Luo Y, Chen W
Received 5 December 2024
Accepted for publication 13 March 2025
Published 28 March 2025 Volume 2025:18 Pages 1779—1790
DOI https://doi.org/10.2147/JMDH.S510549
Checked for plagiarism Yes
Review by Single anonymous peer review
Peer reviewer comments 2
Editor who approved publication: Dr David C. Mohr
Hui Peng, Bin Wang, Wei Yang, Rui Jia, Youlian Luo, Weifeng Chen
Department of General Practice, Shenzhen second People’s Hospital (The First Affiliated of Shenzhen University), Shenzhen, Guangdong, 518000, People’s Republic of China
Correspondence: Weifeng Chen, Email [email protected]
Background: The association between triglyceride(TG) levels and the risk of diabetes mellitus (DM) continues to be a subject of considerable interest and debate within the scientific community. To date, there has been a lack of studies specifically examining this relationship within the Chinese population. This study seeks to elucidate the correlation between TG levels and the incidence of DM among the Chinese demographic.
Methods: This study constitutes a secondary analysis of a retrospective cohort investigation comprising 202,888 Chinese participants who were free of DM at baseline and were subsequently followed from 2010 to 2016. Cox regression method and sensitivity analyses were used to examine the relationship between TG levels and DM. To examine the potential non-linear relationship between TG levels and the incidence of DM, Cox proportional hazards regression incorporating cubic spline functions and smooth curve fitting was employed. Additionally, a two-piece Cox proportional hazards regression model was utilized to identify the inflection point at which TG levels influence the risk of developing DM.
Results: In participants with DM, baseline TG levels were elevated. After adjusting for confounding variables, baseline TG levels were positively associated with incident DM. (HR:1.25,95% CI:1.21– 1.30,P< 0.001). In addition, we conducted sensitivity analyses to ensure the results were robust. There was a 88% increase in DM risk from the top TG tertile to the bottom TG tertile.Our research discovered a significant link between TG and DM when TG levels were below 1.27 mmol/L (HR:2.35, 95% CI: 1.95– 2.83,P < 0.001).
Conclusion: This study shows that TG was positively and non-linearly associated with the risk of DM after adjusting for other confounding factors.Below 1.27 mmol/L, increasing TG levels greatly heighten the risk of DM, whereas above this level, the risk is lower.
Keywords: triglycerides, incident diabetes mellitus, Chinese, positive relationship, secondary retrospective analysis
Introduction
Diabetes mellitus (DM) is a complex disease that involves lifestyle factors and genetic predisposition.1 In accordance with estimates from the International Diabetes Federation, the prevalence of DM in the world is based on age will increase to 10.2% by 2030 and 10.9% by 2045.2 Among the most prevalent chronic diseases, DM has placed a considerable economic burden on patients and their countries.3 It is estimated that the global cost of DM was approximately 1.3 trillion USD in 2015, and this cost is expected to rise to 2.1 trillion USD by 2030.4
There is a link between DM and dyslipidemia, a condition in which the triglyceride (TG) are high and the high-density lipoprotein cholesterol (HDL-C) is low.5,6 Empirical studies have demonstrated a correlation between insulin resistance and elevated TG levels.7 The intricate mechanisms underlying the association between TG and insulin resistance encompass multiple pathways. TG undergo hydrolysis into glycerol and free fatty acids (FFAs) via the action of lipase. Increased TG concentrations are associated with an enhanced flux of FFAs from adipose tissue to the liver, a critical factor in the development of hepatic insulin resistance.8 Elevated plasma FFAs disrupt insulin signaling by interfering with the cascade that links insulin receptors to glucose transporters.9 This disruption is particularly pronounced in skeletal muscle, where the accumulation of intramyocellular lipids is linked to insulin resistance.10 Moreover, elevated TG levels are associated with increased inflammatory markers, such as C-reactive protein, which independently predict insulin resistance.11,12
Furthermore, researchers have identified that participants with elevated TG levels exhibit a significantly higher likelihood of developing incident DM compared to those with lower TG levels.13 However, contrary to what was reported in prospective studies of Caucasian and Swedish males and a white population in France, high TG levels were not associated with DM when conventional risk factors were adjusted for.1,14,15 The relationship between TG levels and DM risk remains a contentious topic in the literature, and it is uncertain whether TG levels are linked to DM risk in the Chinese population. Consequently, by analyzing a publicly available Chinese health database, we aim to investigate the potential association between TG levels and the incidence of DM in the Chinese population.
As part of this study, we used previously published data to analyze secondary data. There was a study done in that paper that examined the relationship between body mass index (BMI) and DM incidence.16 In the secondary analysis, TG was treated as an independent variable, while outcome variable and other covariates remained the same.
Methods
Study Population and Design
The study design used in this research is a secondary analysis of an existing dataset. The original study was a retrospective cohort study, and the data from this study were publicly available in Dryad’s Digital Repository (https://doi.org/10.5061/dryad.ft8750v).16,17 For the current analysis, we utilized this existing dataset to explore the relationship between TG and DM risk. The initial study cohort included 685,277 participants in China, who were at least 20 years old and had at least 2 visits between 2010 and 2016. The follow-up period began after the first health examination in 2010 and ended either when diabetes was diagnosed or on 31 December 2016, whichever occurred first. According to Chen’s study design, these individuals were excluded from this retrospective cohort study because they met the following criteria at baseline: (1) diabetic diagnosis at baseline, (2) Less than two-year follow-up subjects, (3) unknown DM status at follow-up, (4) no available height and weight value, (5) no available information on gender, (6) no available value of fasting plasma glucose (FPG), (7) Indicator of extreme body mass (BMI) value (BMI<15 kg/m2 or BMI>55 kg/m2).16 Thus, the meticulous exclusion process resulted in a original dataset of 211,833 participants.
For this secondary analysis, we further narrowed down the original cohort by removing 8945 participants without TG values (no available TG, or TG > 4.5 mmol/l), resulting in a total of 202,888 participants (Figure 1).
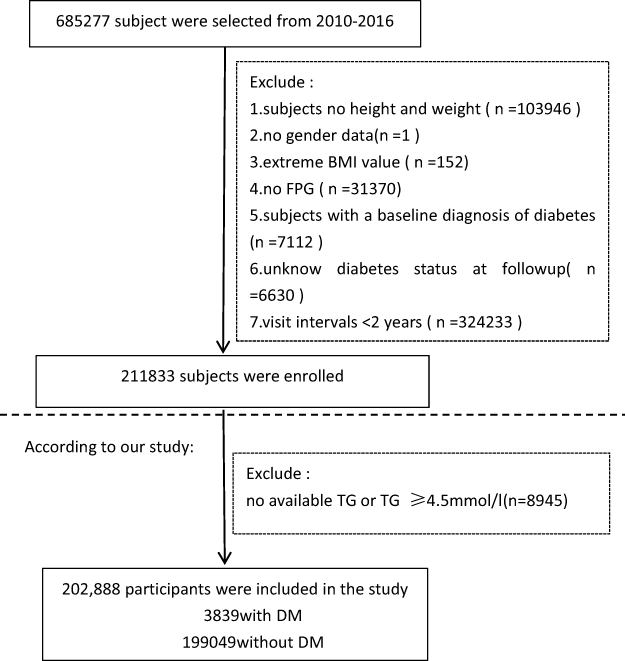 |
Figure 1 Flowchart of participant selection and exclusion criteria. Abbreviations: BMI, body mass index; FBG, fasting blood glucose; TG, triglyceride; DM, diabetes mellitus. |
In addition, Other indicators such as demographics (age, gender):, lifestyle (smoking and drinking status), history of chronic diseases (family history of diabetes) and laboratory tests [body mass index (BMI), systolic blood pressure (SBP), diastolic blood pressure (DBP), fasting plasma glucose (FPG), TG, low-density lipoprotein cholesterol (LDL-C), high-density lipoprotein cholesterol (HDL-C); aspartate aminotransferase (AST), alanine aminotransferase (ALT), blood urea nitrogen (BUN), and serum creatinine (SCR)], were also detailed measured in the previous studies. Based on the original dataset, normoglycemia was defined as a fasting FPG level < 7.00 mmol/L. Smoking status was categorized as 1 (current smoker), 2 (ever smoker), or 3 (never smoker). Drinking status was categorized as 1 (current drinker), 2 (ever drinker), or 3 (never drinker). In the original research, it was documented how the retrospective cohort study was designed.16
This study was exempted from ethical review by the Ethics Committee of Shanghai Tenth People’s Hospital as it involved analysis of pre-existing, anonymized data from the Dryad repository. All original data collection procedures were conducted in accordance with the Declaration of Helsinki and approved by the original authors’ institutional ethics committee.16
Diagnosis of DM and Measurement of TG Levels
The diagnosis of incident DM was established in accordance with the 1999 World Health Organization (WHO) criteria, which specify a fasting plasma glucose (FPG) level of ≥ 7.00 mmol/L or self-reported DM during the follow-up period. Participants were censored at the date of DM diagnosis or at the final visit, whichever occurred first.
Fasting venous blood samples were collected after a minimum fasting period of 10 hours at each visit. Serum TG level and total cholesterol levels were quantified using an autoanalyzer (Beckman 5800). Plasma glucose levels were assessed using the glucose oxidase method on the same autoanalyzer.16
Statistical Analysis
An advanced method of dealing with missing values, multiple imputation (MI), was performed using IBM SPSS Statistics (Version 27). Statistical significance was determined by a P-value of < 0.05 using EmpowerStats software (http://www.empowerstats.com/cn/, X&Y Solutions, Inc., Boston, MA, USA).
The TG level were categorized into tertiles for analytical purposes: tertile 1 (0.03–0.83 mmol/L), tertile 2 (0.84–1.38 mmol/L), and tertile 3 (1.39–4.49 mmol/L). Continuous variables exhibiting a normal distribution were reported as mean ± standard deviation, whereas variables with a skewed distribution were presented as median (interquartile range). Categorical variables were expressed as percentages. To compare baseline characteristics across the three tertiles, statistical tests were selected based on the distribution and type of variables. For continuous variables, one-way analysis of variance (ANOVA) was employed for normally distributed data, while the Kruskal–Wallis test was utilized for data that did not follow a normal distribution. The chi-square test was applied to evaluate differences in proportions for categorical variables across the groups.
The Kaplan-Meier method was applied to compare survival and cumulative event rates across TG tertiles. The influence of TG levels on the risk of DM was evaluated using univariate Cox regression analysis. To further elucidate the association and the robustness of test results, multivariate Cox regression analysis was performed with the following models: the Crude model (no adjustments), Model 1 (adjusted for age and gender), Model 2 (adjusted for age, gender, BMI, SBP, DBP, FPG, LDL-C,AST, ALT, BUN, and SCR), and Model 3 (adjusted for age, gender, BMI, SBP, DBP, FPG, HDL-C, LDL-C,AST, ALT, BUN, SCR, smoking and drinking status, and family history of diabetes).
To control for potential confounding factors, total cholesterol (TC) was excluded from the final models due to significant multicollinearity (variance inflation factor [VIF] > 5) identified through VIF analysis (Supplementary Table S1). The VIF values for all remaining variables were below 5, indicating no significant multicollinearity issues. To further test the robustness of our findings, we analyzed the dataset prior to imputation, and the results demonstrated consistent effect estimates, as presented in Supplementary Table S2. These findings underscore the reliability of the analyses conducted.
To explore the potential nonlinear relationship between TG levels and incident DM, we employed Cox proportional hazards regression with cubic spline functions and smooth curve fitting. A recursive algorithm was implemented to identify inflection points, which was followed by the construction of two-segment Cox proportional hazards regression models to independently analyze the data on either side of the inflection points. The log-likelihood ratio test was employed to determine the optimal model for the association between TG levels and the incidence of DM.
Results
The Baseline Characteristics of Participants
At baseline, 202,888 subjects with normoglycemia were included (mean age 42.14 years old, 54.37% male, 45.63% female). The participants were divided into subgroups based on their TG tertiles (0.03–0.83, 0.84–1.38, 1.39–4.49). As shown in Table 1, baseline characteristics of the subjects are grouped according to their TG tertiles. Subjects with a higher TG were usually male, older and showed higher DBP, SBP, BMI, FPG, LDL, TC, AST, ALT, BUN, and SCr levels, but lower HDL-C levels (all P < 0.05). Participants with missing DBP, SBP, TC, HDL-C, LDL, ALT, AST, BUN, and SCR were 23, 24, 1, 87, 841, 86, 715, 1602, 117, 498, 18253, and 9256. Furthermore, there were missing data regarding smoking and drinking statuses 145443 and 145443.
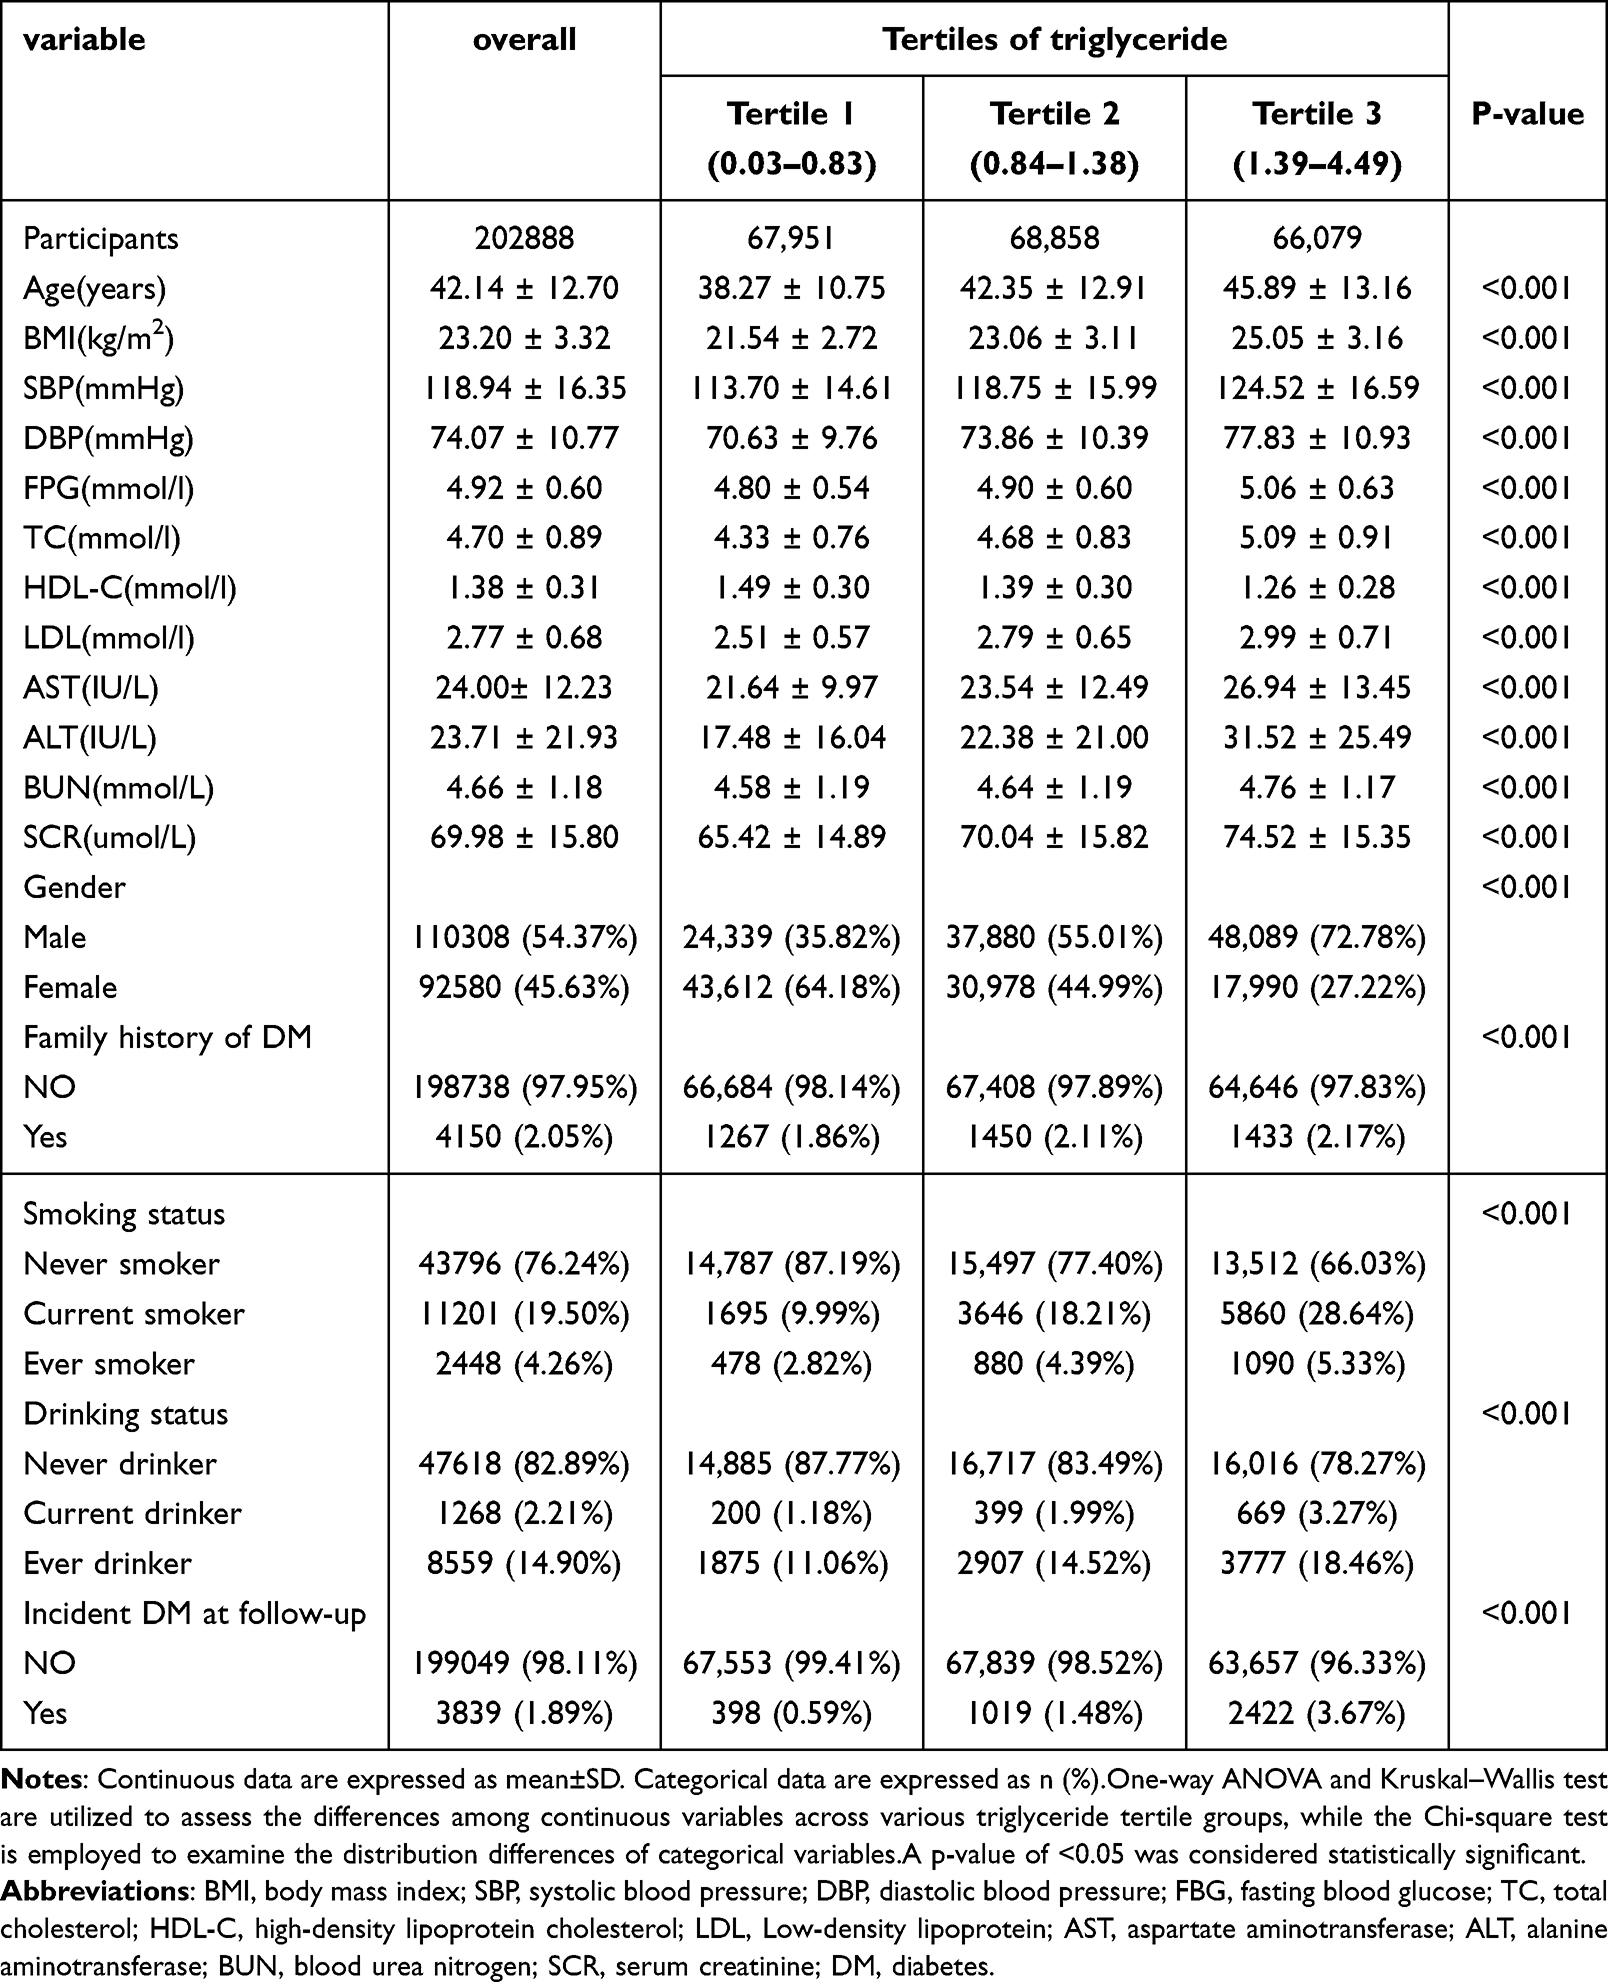 |
Table 1 The Demographic Characteristics of Study Participants |
Univariate Analysis
In Table 2, we present the results of the univariate analysis. Based on the univariate analysis, the incidence of DM was positively related to age, BMI, DBP, SBP, TC, TG, LDL, FPG, SCR, BUN, drinking and smoking status, and family history of diabetes. In addition, there is a negative correlation between HDL-C and DM incidence. The incidence of DM is significantly lower in women than in men.
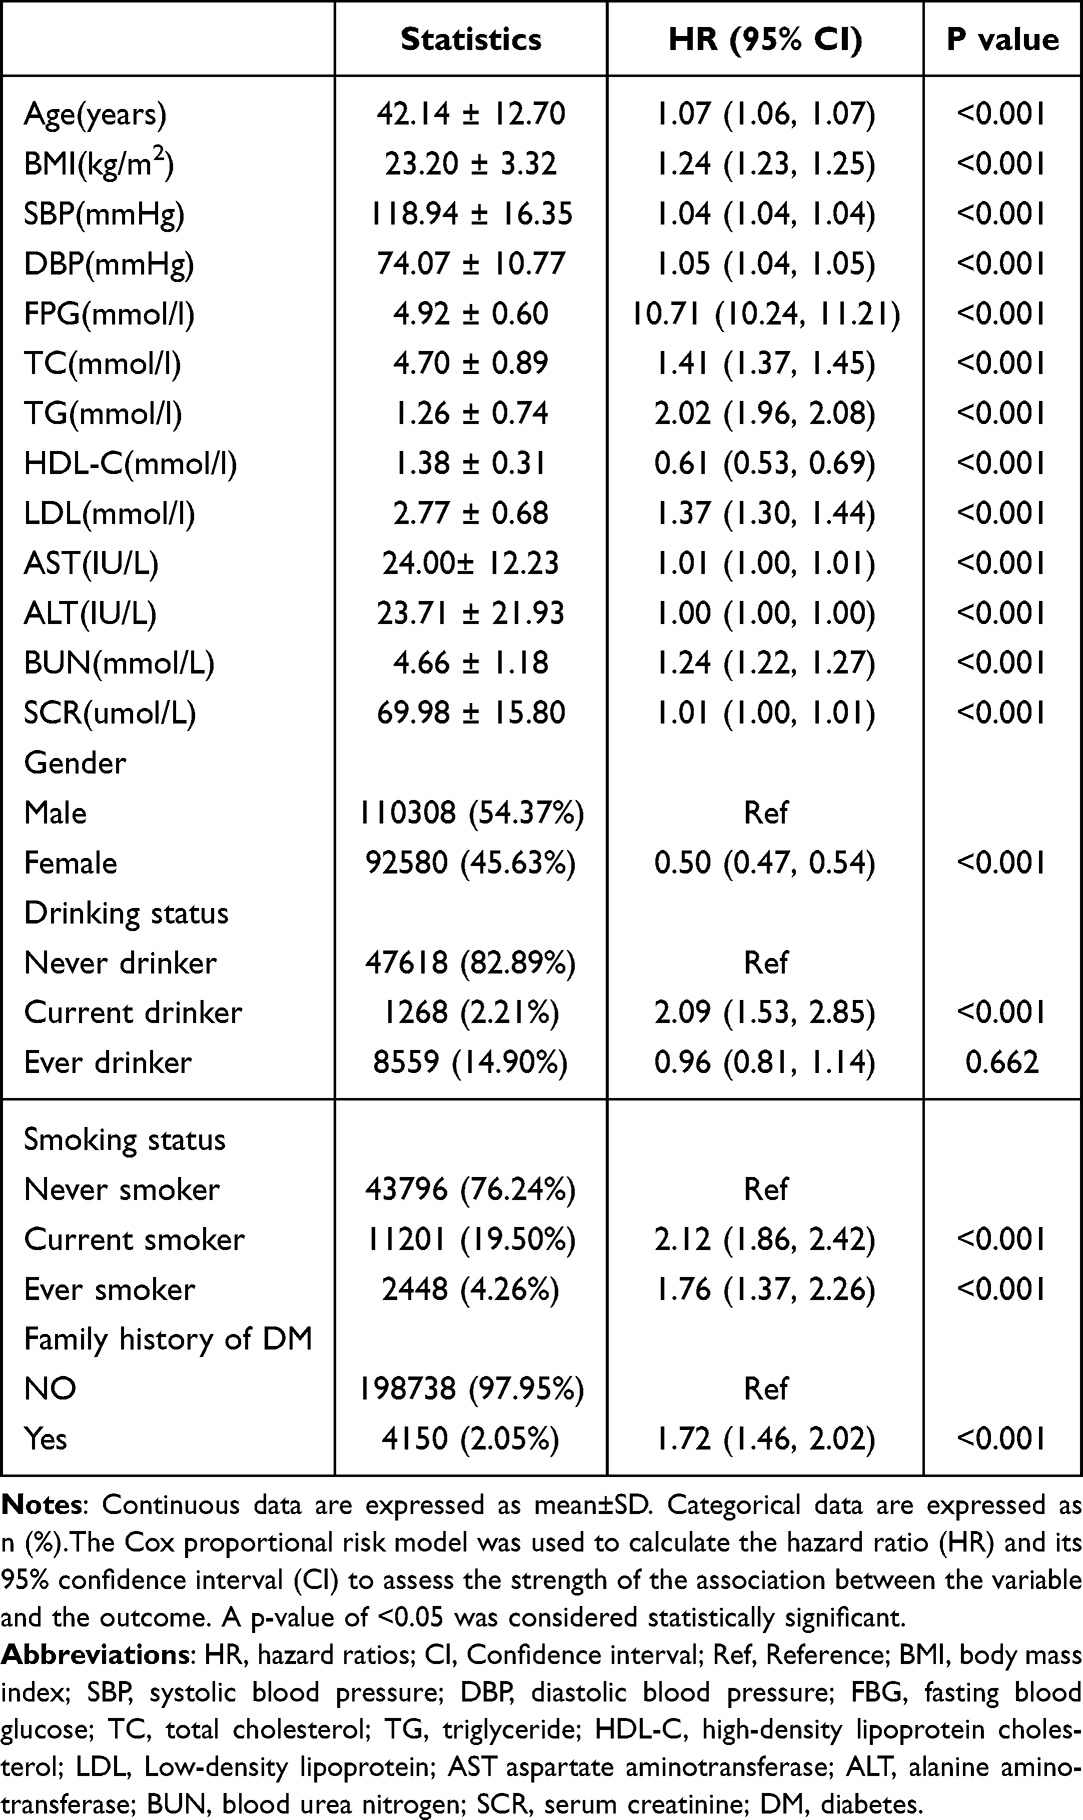 |
Table 2 The Results of Univariate Analysis |
In Figure 2, Kaplan-Meier curves were shown stratified by TG category for DM incident risk. Among the three TG groups, there was a significant difference in the DM incident risk (p < 0.001). With increasing TG, the cumulative DM incident risk increased too.
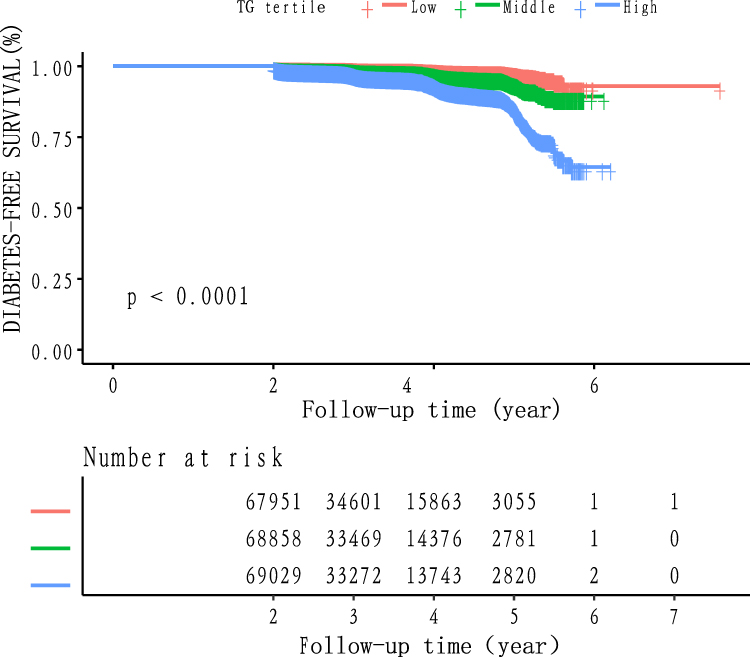 |
Figure 2 Kaplan–Meier event-free survival curve. Kaplan–Meier analysis of incident diabetes-free survival based on TG groups (log-rank, p < 0.0001). |
The Multivariate Analysis of TG With DM Risk
Cox proportional hazard regression models with crude and adjusted estimates were used to evaluate the associations between TG and DM incidence (Table 3). After excluding TC due to multicollinearity, the relationship between TG levels and incident DM remained significant. Unadjusted model results showed that TG levels are associated with DM risk (HR=2.02, 95% CI: 1.96 to 2.08, P<0.001). In model I (adjusted gender, age), the result still existed (HR: 1.69, 95% CI: 1.64 to 1.75, P<0.001). As a result of adjusting for age, gender, BMI, SBP, DBP, FPG, HDL-C, LDL, AST, ALT, BUN, SCR in the model 2, the connection was detectable (HR=1.26, 95% CI: 1.22 to 1.31, P<0.001). Furthermore, after adjusting for age, gender, BMI, SBP, DBP, FPG, HDL-C, LDL, AST, ALT, BUN, SCR, smoking and drinking status, family history of diabetes, the connection could also be detected (HR: 1.25, 95% CI: 1.21 to 1.30, P<0.001). We also considered TG as a categorical variable (tertiles) for the purpose of sensitivity analysis. It was found that DM risk increased by 88% from the top tertile to the bottom tertile in the model 3, and that there was a significant trend across the tertiles (P for trend< 0.001). The TG can be considered an independent risk factor for DM because its positive correlation with DM can be observed.
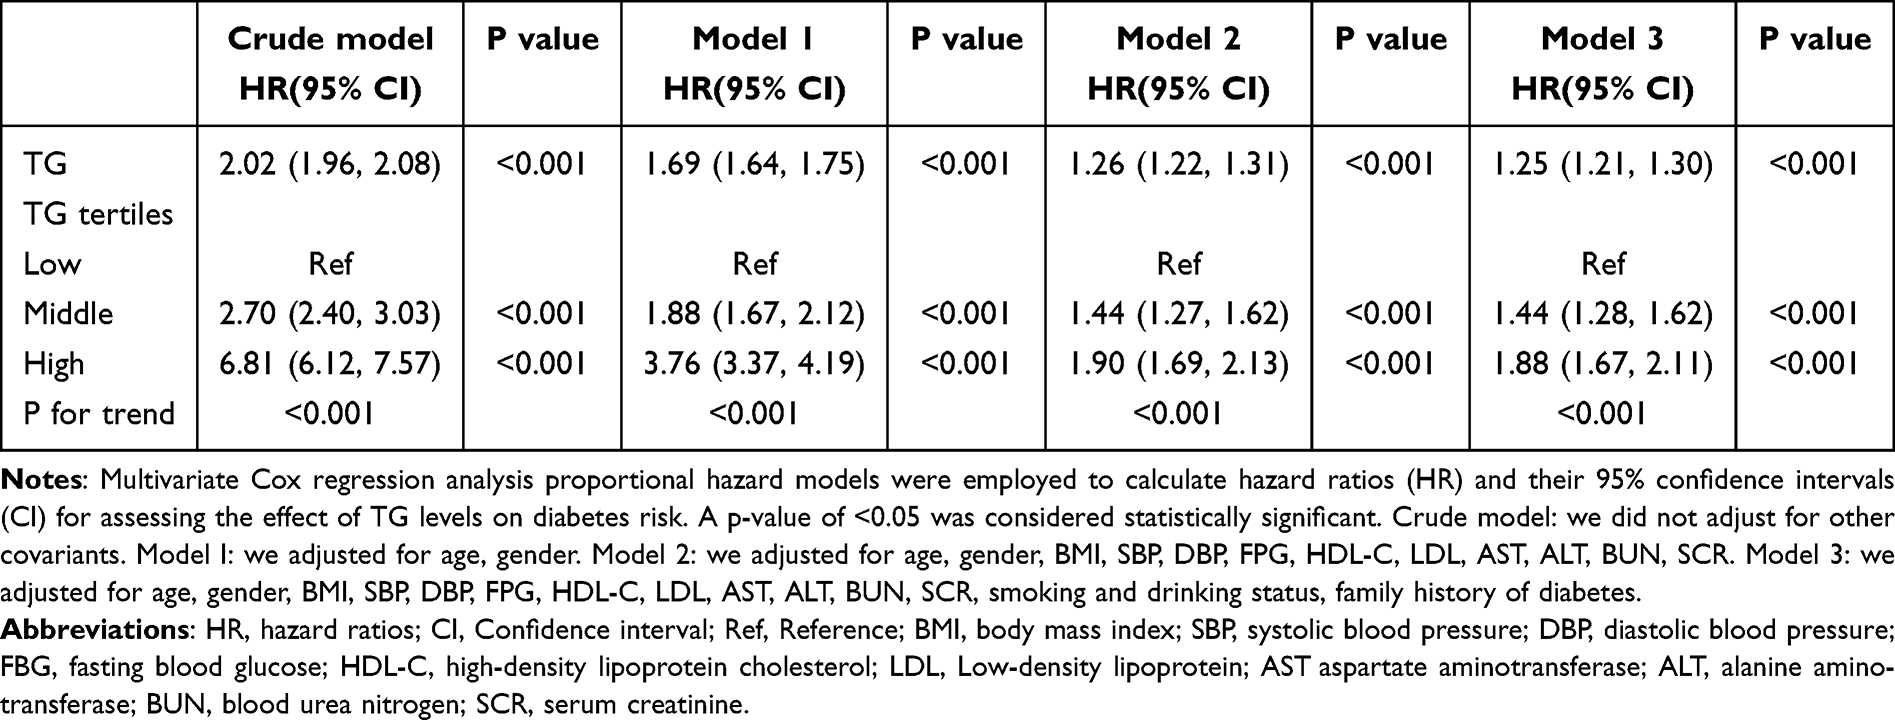 |
Table 3 Regression Analysis of the Association Between TG Levels and DM |
The Relationship Between TG Levels and Incident DM
After fitting smoothing splines, the relationship between TG and DM incidence was non-linear (Figure 3). A positive relationship was observed between TG and DM incidence (HR:1.25,95% CI:1.21–1.30, P<0.001). Based on a two-piecewise linear regression model, TG’s inflection point was 1.27 (Log likelihood ratio test P < 0.001). We found a positive relationship between TG and DM incidence on the left of the inflection point (HR:2.35, 95% CI:1.95–2.83,P < 0.001), but a weak positive relationship on the right (HR: 1.14, 95% CI: 1.09–1.19, P < 0.001) (Table 4).
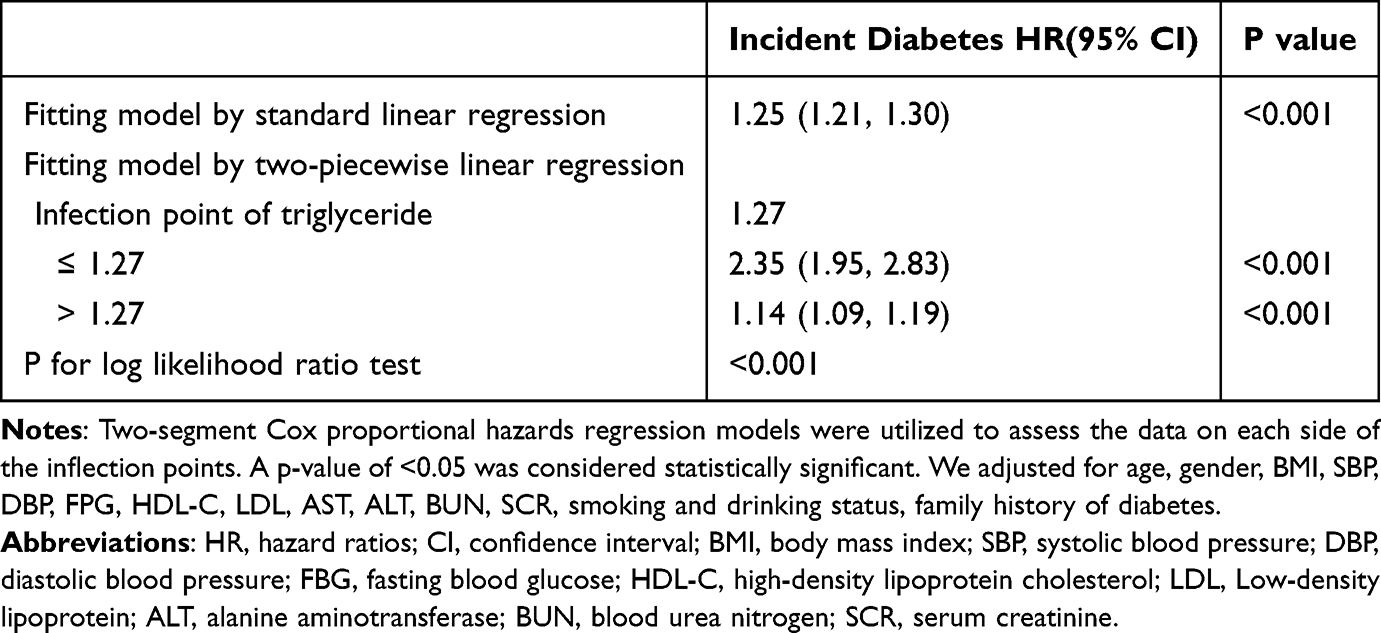 |
Table 4 Threshold Effect Analysis of TG Levels on DM on Using Two-Piecewise Linear Regression |
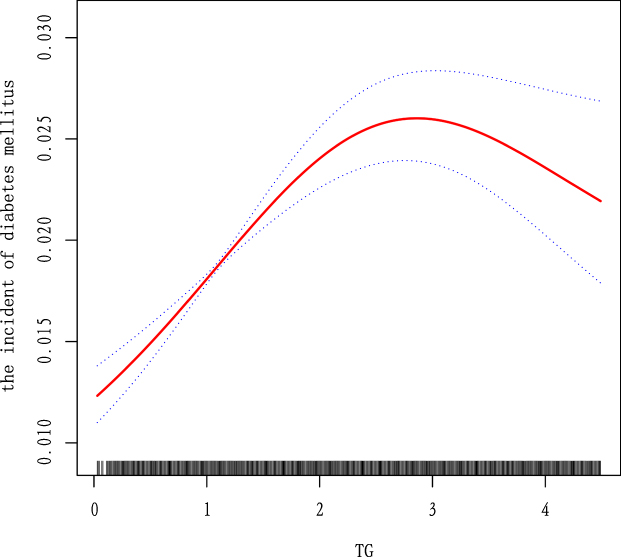 |
Figure 3 The relationship between continuous TG levels and incident DM. A nonlinear relationship between them was detected after adjusting for age, gender, BMI, SBP, DBP, FPG, HDL-C, LDL, AST, ALT, BUN, SCR, smoking and drinking status, family history of diabetes. Abbreviations: BMI, body mass index; SBP, systolic blood pressure; DBP, diastolic blood pressure; FBG, fasting blood glucose; HDL-C, high-density lipoprotein cholesterol; LDL, Low-density lipoprotein; AST, aspartate aminotransferase; ALT, alanine aminotransferase; BUN, blood urea nitrogen; SCR serum creatinine. |
Discussion
In this longitudinal cohort study, the TG was examined in relation to incident DM among Chinese adults, and we found that it was positively correlated and independent of other covariates in incident DM. Additionally, we found that the effect sizes at the inflection point had different trends on the left and right [left (HR:2.35, 95% CI: 1.95–2.83,P < 0.001); right (1.14, 95% CI: 1.09–1.19, P < 0.001)].
Based on our current understanding, there is a contentious issue regarding TG levels and the risk of DM. Several long-term studies from Norway, Taiwan, and Japan have consistently confirmed that high TG level is a major risk factor for DM.18 This is further supported by a 9-year longitudinal study in Japan, which indicated that having high TG level and being obese are independent risk factors for DM.19 Additionally, according to a study in Asian-Indian men with prediabetes, hypertriglyceridaemic waist phenotype is associated with incident DM, suggesting abdominal fat accumulation may contribute to DM in these men.20 Furthermore, a study in Thais found a positive relationship between high TG level and incident DM, consistent across different subgroups.21 Moreover, participants with persistent high TG levels had a 1.58-fold higher risk of DM according to the Kangbuk Samsung Health Study.22 However, after controlling for conventional DM risk factors, prospective studies investigating Caucasian and Swedish cohorts of men as well as a white population in France found no connection between high TG levels and DM.1,14,15 The results of our study indicated a positive correlation between TG and diabetes risk, which is in agreement with the majority of prior studies. Previous research has indicated that the association between high TG levels and DM risk may differ across ethnic groups. Our study provides evidence of a significant positive correlation between TG levels and DM risk within the Chinese population. This finding is consistent with the majority of prior studies conducted in Asian populations, including those from Taiwan, Japan, and Thailand, which have consistently identified high TG levels as a significant risk factor for DM. Moreover, the robustness of our results was verified through sensitivity analyses. A significant positive correlation between TG levels and DM risk was observed both prior to data interpolation and after addressing the issue of collinearity.
The relationship between TG levels and DM is complex. Some studies have highlighted the role of cellular mechanisms of insulin resistance.23 Among people with obesity-related insulin resistance and DM, intracellular TG levels are strongly associated with insulin resistance.24 Meanwhile, several studies have demonstrated that DM is characterized by insulin resistance caused by defective muscle glycogen synthesis.23 Additionally, the association of TG with skeletal muscle TG content and defects in fatty acid metabolism in DM and obesity has been explored.25
During TG metabolism, TG are hydrolyzed into glycerol and FFAs. Ectopic lipid deposition occurs when the capacity of adipose tissue to safely store excess fatty acids is exceeded.26,27 The accumulation of FFAs in the liver is particularly harmful, as it can lead to non-alcoholic fatty liver disease (NAFLD), a condition closely associated with insulin resistance.28 In people with NAFLD, the buildup of TG and FFAs in the liver is frequently linked to heightened oxidative stress and inflammation, which further disrupt insulin signaling.29,30 Additionally, the function of microRNAs (miRNAs) in modulating the effects of FFAs on insulin resistance has gained attention.31,32 Saturated fatty acids have been found to increase the levels of certain miRNAs, like miR-96, which in turn negatively affect insulin signaling by targeting crucial elements of the insulin signaling pathway, such as insulin receptor substrate proteins.33 This suggests that dietary FFAs could affect gene expression and post-transcriptional regulation, adding complexity to the link between fat consumption and insulin sensitivity.
Furthermore, the connection between TG levels and DM is linked to the creation and release of very low density lipoprotein particles (VLDL).34 The role of hepatic ABC transporters in regulating VLDL-TG production has been highlighted, emphasizing the significance of hepatic function in lipid metabolism and its implications for DM.35 Furthermore, alterations in the composition of VLDL subfractions have been observed in DM, with lower concentrations of apolipoprotein C-III-containing large and small VLDL particles associated with DM, while high TG level itself was linked to an increase of apolipoprotein C III-containing VLDL particles.36 Related studies showed that insulin resistance has been found to increase the concentration of large VLDL and is associated with mean VLDL size.37 Furthermore, studies have demonstrated that larger VLDL size and smaller HDL particles are independently associated with an increased risk of DM in individuals with insulin resistance.38 These studies collectively provide insights into the multifaceted mechanisms linking TG to DM, encompassing cellular, hepatic, and metabolic pathways.
At present, both domestic and international clinical guidelines advocate for maintaining TG levels below 1.7 mmol/L, with clinical practice typically refraining from administering pharmacological interventions to patients who fall below this threshold. Intriguingly, our findings suggest a nonlinear relationship between TG levels and DM risk. Overall, TG levels have a positive correlation with the risk of DM. Results reveals that TG levels below 1.27 mmol/L are associated with a significantly elevated risk of DM. We guess that at low TG concentrations, TG may decompose into FFAs, which subsequently contribute to insulin resistance by disrupting insulin signaling pathways and promoting ectopic fat deposition. However, a notable limitation of this study is its reliance on baseline TG data, which does not account for dynamic changes during follow-up. Consequently, future research should incorporate dynamic TG monitoring, assessments of FFA levels, and multi-omics data to more thoroughly elucidate the relationship between TG levels and DM risk. However, when TG levels exceed 1.27 mmol/L, the risk of DM is actually lower than when levels are below this threshold. It is possible that the decline in the higher risk ratio is impacted by factors such as lipid-lowering therapy, since some individuals might have received this treatment during the follow-up. The observed plateau in DM risk at higher TG levels may reflect unmeasured confounding factors. For instance, individuals with elevated baseline TG levels are more likely to receive lipid-lowering therapies (e.g, fibrates) or lifestyle interventions during follow-up. These interventions not only reduce TG levels but may also improve insulin sensitivity and mitigate DM. For example, fibrates have been shown to lower TG levels while potentially improving glucose metabolism.39 However, our study utilized baseline TG data only, and detailed information on treatments or behavioral changes during follow-up was unavailable. Consequently, the attenuated association in the high TG stratum might result from these unmeasured interventions counteracting the pro-diabetic effects of elevated TG levels. To clarify these dynamics, future studies should incorporate serial TG measurements and longitudinal data on treatments, lifestyle changes, and metabolic markers. Still, the overall results indicate that TG are positively related to DM in the Chinese population.
Our study has several strengths. First, we demonstrated that triglyceride (TG) levels are independently associated with an increased risk of diabetes, highlighting TG as a key predictive marker in the Chinese population. Second, we identified a nonlinear relationship between TG levels and diabetes risk, with a significant inflection point at 1.27 mmol/L, providing new evidence for lipid control strategies. Third, the robustness of our results was confirmed through multiple imputation for missing data and sensitivity analyses, including pre-imputation assessments and adjustments for confounding factors, ensuring the stability and reliability of our findings.
It is important to note, however, that some limitations may exist. First, the relatively small sample size may limit the generalizability of our findings. However, the statistically significant results after rigorous adjustment for confounders underscores the robustness of our primary conclusions. Second, although we adjusted for a comprehensive set of covariates (age, gender, BMI, SBP, DBP, FPG, HDL-C, LDL, AST, ALT, BUN, SCR, smoking and drinking status, family history of diabetes), residual confounding due to unmeasured factors (eg, dietary habits, physical activity, or genetic predispositions) cannot be entirely ruled out. Third, while multiple imputation was employed to address missing data, potential bias may persist if the data were not missing completely at random. Future studies with larger, more diverse populations, longitudinal designs, and detailed measurements of lifestyle and genetic factors are warranted to validate and extend our findings. These limitations notwithstanding, our analysis strengthens the evidence linking triglyceride levels to incident diabetes, even after accounting for key metabolic and demographic confounders.
Conclusions
This study shows that TG was positively and non-linearly associated with the risk of DM after adjusting for other confounding factors. Below 1.27 mmol/L, increasing TG levels greatly heighten the risk of DM, whereas above this level, the risk is lower.
Abbreviations
TG, triglycerides; DM, diabetes mellitus; WHO, World Health Organization; FFAs, Free fatty acids; NAFLD, non-alcoholic fatty liver disease; AST, aspartate aminotransferase; ALT, alanine aminotransferase; BMI, body mass index; SBP, systolic blood pressure; DBP, diastolic blood pressure; FBG:fasting blood glucose; HDL-C, high-density lipoprotein cholesterol; TC, total cholesterol; LDL, Low-density lipoprotein; BUN, blood urea nitrogen; SCR, serum creatinine; VLDLs, Very low-density lipoprotein particles; ANOVA: one-way analysis of variance; VIF: variance inflation factor.
Data Sharing Statement
Publicly available datasets were analyzed in this study. This data can be found here: Chen et al,16 https://doi.org/10.5061/dryad.ft8750v.
Ethics Approval and Consent to Participate
This study was approved by the Rich Healthcare Group Review Board, and the information was retrieved retrospectively.
Author Contributions
All authors made a significant contribution to the work reported, whether that is in the conception, study design, execution, acquisition of data, analysis and interpretation, or in all these areas; took part in drafting, revising or critically reviewing the article; gave final approval of the version to be published; have agreed on the journal to which the article has been submitted; and agree to be accountable for all aspects of the work.
Funding
This work was supported by Shenzhen Science and technology planning project (No. JCYJ20230807115302006).
Disclosure
The authors declare that they have no competing interests.
References
1. Von Eckardstein A, Schulte H, Assmann G. Risk for diabetes mellitus in middle-aged caucasian male participants of the PROCAM Study: implications for the definition of impaired fasting glucose by the American diabetes association. J Clin Endocrinol Metab. 2000;85(9):3101–3108. doi:10.1210/jcem.85.9.6773
2. Saeedi P, Petersohn I, Salpea P, et al. Global and regional diabetes prevalence estimates for 2019 and projections for 2030 and 2045: results from the international diabetes federation diabetes atlas, 9th edition. Diabetes Res Clin Pract. 2019;157:107843. doi:10.1016/j.diabres.2019.107843
3. American Diabetes Association. Economic Costs of Diabetes in the U.S. in 2017. DIABETES CARE. 2018;41(5):917–928. doi:10.2337/dci18-0007
4. Bommer C, Sagalova V, Heesemann E, et al. Global economic burden of diabetes in adults: projections from 2015 to 2030. DIABETES CARE. 2018;41(5):963–970. doi:10.2337/dc17-1962
5. Quispe R, Manalac RJ, Faridi KF, et al. Relationship of the triglyceride to high-density lipoprotein cholesterol (TG/HDL-C) ratio to the remainder of the lipid profile: the very large database of lipids-4 (VLDL-4) study. ATHEROSCLEROSIS. 2015;242(1):243–250. doi:10.1016/j.atherosclerosis.2015.06.057
6. Yan Y, Ma R, Zhang J, et al. Association of insulin resistance with glucose and lipid metabolism: ethnic heterogeneity in far western China. Mediators Inflammation. 2016;2016:1–8. doi:10.1155/2016/3825037
7. Kostovski M, Simeonovski V, Mironska K, Tasic V, Gucev Z. Metabolic profiles in obese children and adolescents with insulin resistance. Open Access Maced J Med Sci. 2018;6(3):511–518. doi:10.3889/oamjms.2018.097
8. Simental-Mendía LE, Rodríguez-Morán M, Guerrero-Romero F. The product of fasting glucose and triglycerides as surrogate for identifying insulin resistance in apparently healthy subjects. METAB SYNDR RELAT D. 2008;6(4):299–304. doi:10.1089/met.2008.0034
9. Boden G, Cheung P, Stein TP, Kresge K, Mozzoli M. FFA cause hepatic insulin resistance by inhibiting insulin suppression of glycogenolysis. AM J PHYSIOL-ENDOC M. 2002;283(1):E12–9.
10. Savage DB, Watson L, Carr K, et al. Accumulation of saturated intramyocellular lipid is associated with insulin resistance. J LIPID RES. 2019;60(7):1323–1332. doi:10.1194/jlr.M091942
11. Wang Y. Higher fasting triglyceride predicts higher risks of diabetes mortality in US adults. LIPIDS HEALTH DIS. 2021;20(1):181. doi:10.1186/s12944-021-01614-6
12. Sattar N, Gaw A, Scherbakova O, et al. Metabolic syndrome with and without C-reactive protein as a predictor of coronary heart disease and diabetes in the West of Scotland coronary prevention study. CIRCULATION. 2003;108(4):414–419. doi:10.1161/01.CIR.0000080897.52664.94
13. Riediger ND, Clark K, Lukianchuk V, Roulette J, Bruce S. Fasting triglycerides as a predictor of incident diabetes, insulin resistance and β-cell function in a Canadian First Nation. INT J CIRCUMPOL HEAL. 2017;76(1):1310444. doi:10.1080/22423982.2017.1310444
14. Charles MA, Fontbonne A, Thibult N, Warnet J, Rosselin GE, Eschwege E. Risk Factors for NIDDM in white population: Paris prospective study. DIABETES. 1991;40(7):796–799. doi:10.2337/diab.40.7.796
15. Ohlson LO, Larsson B, Bj Rntorp P, et al. Risk factors for Type 2 (non-insulin-dependent) diabetes mellitus. Thirteen and one-half years of follow-up of the participants in a study of Swedish men born in 1913. DIABETOLOGIA. 1988;31(11):798–805. doi:10.1007/BF00277480
16. Chen Y, Zhang X, Yuan J, et al. Association of body mass index and age with incident diabetes in Chinese adults: a population-based cohort study. BMJ OPEN. 2018;8(9):e21768. doi:10.1136/bmjopen-2018-021768
17. Chen YEA. Data From: Association of Body Mass Index and Age With Incident Diabetes in Chinese Adults: A Population-Based Cohort Study [Dataset]. Dryad; 2018. doi:10.5061/dryad.ft8750v
18. Lee S, Chun K, Lee S, Kim D. Does abdominal obesity accelerate the effect of hypertriglyceridemia on impaired fasting glucose? YONSEI MED J. 2010;51(3):360. doi:10.3349/ymj.2010.51.3.360
19. Nonoyama Y, Yamamoto M, Oba S, et al. Effect of hypertriglyceridemia in dyslipidemia‐induced impaired glucose tolerance and sex differences in dietary features associated with hypertriglyceridemia among the Japanese population: the Gifu Diabetes Study. J DIABETES INVEST. 2021;12(5):771–780. doi:10.1111/jdi.13398
20. Ram J, Snehalatha C, Nanditha A, et al. Hypertriglyceridaemic waist phenotype as a simple predictive marker of incident diabetes in Asian‐Indian men with prediabetes. DIABETIC MED. 2014;31(12):1542–1549. doi:10.1111/dme.12517
21. Charoensri S, Turnsaket S, Pongchaiyakul C. Hypertriglyceridemia as an Independent Predictor for Ten-Year Incidence of Diabetes in Thais. VASC HEALTH RISK MAN. 2021;17:519–525. doi:10.2147/VHRM.S326500
22. Kwon YH, Kim SK, Cho JH, et al. The association between persistent hypertriglyceridemia and the risk of diabetes development: the Kangbuk Samsung health study. Endocrinol Metab. 2018;33(1):55–61. doi:10.3803/EnM.2018.33.1.55
23. Shulman GI. Cellular mechanisms of insulin resistance. J CLIN INVEST. 2000;106(2):171–176. doi:10.1172/JCI10583
24. Goodpaster BH, Kelley DE. Skeletal muscle triglyceride: marker or mediator of obesity-induced insulin resistance in type 2 diabetes mellitus? Curr Diab Rep. 2002;2(3):216–222. doi:10.1007/s11892-002-0086-2
25. Kelley DE, Goodpaster BH. Skeletal muscle triglyceride. Diabetes Care. 2001;24(5):933–941. doi:10.2337/diacare.24.5.933
26. Karpe F, Dickmann JR, Frayn KN. Fatty acids, obesity, and insulin resistance: time for a reevaluation. DIABETES. 2011;60(10):2441–2449. doi:10.2337/db11-0425
27. Sears B, Perry ML. The role of fatty acids in insulin resistance. LIPIDS HEALTH DIS. 2015;14(1). doi:10.1186/s12944-015-0123-1
28. Cohen JC, Horton JD, Hobbs HH. Human fatty liver disease: old questions and new insights. Science. 2011;332(6037):1519–1523. doi:10.1126/science.1204265
29. Smith GI, Shankaran M, Yoshino M, et al. Insulin resistance drives hepatic de novo lipogenesis in nonalcoholic fatty liver disease. J CLIN INVEST. 2020;130(3):1453–1460. doi:10.1172/JCI134165
30. Longato L, Tong M, Wands JR, Suzanne MDLM. High fat diet induced hepatic steatosis and insulin resistance: role of dysregulated ceramide metabolism. HEPATOL RES. 2011;42(4):412–427. doi:10.1111/j.1872-034X.2011.00934.x
31. Park SY, Jeong HJ, Yang WM, Lee W. Implications of microRNAs in the pathogenesis of diabetes. Arch Pharm Res. 2013;36(2):154–166. doi:10.1007/s12272-013-0017-6
32. Hennessy E, O’Driscoll L. Molecular medicine of microRNAs: structure, function and implications for diabetes. Expert Rev Mol Med. 2008;10:e24.
33. Yang WM, Min K, Son Y, Park SW, Lee W. Data on the Expression and Insulin-Stimulated Phosphorylation of IRS-1 by miR-96 in L6-GLUT4myc Myocytes. DATA BRIEF. 2017;15:728–732. doi:10.1016/j.dib.2017.10.054
34. Adiels M, Taskinen MR, Packard CJ, et al. Overproduction of Large VLDL particles is driven by increased liver fat content in man. DIABETOLOGIA. 2006;49(4):755–765. doi:10.1007/s00125-005-0125-z
35. Englyst NA, Taube JM, Aitman TJ, Baglin T, Byrne CD. A novel role for CD36 in VLDL-enhanced platelet activation. DIABETES. 2003;52(5):1248–1255. doi:10.2337/diabetes.52.5.1248
36. Taskinen MR. Diabetic dyslipidaemia: from basic research to clinical practice*. Diabetologia. 2003;46(6):733–749. doi:10.1007/s00125-003-1111-y
37. Jiang ZG, Mackey RH, Jensen MK, et al. Associations of insulin resistance, inflammation and liver synthetic function with very low-density lipoprotein. The Cardiovascular Health Study METABOLISM. 2016.
38. Mora S, Otvos JD, Rosenson RS, Pradhan AD, Buring JE, Ridker PM. Lipoprotein particle size and concentration by nuclear magnetic resonance and incident type 2 diabetes in women. DIABETES. 2010;59(5):1153–1160. doi:10.2337/db09-1114
39. Simental-Mendía LE, Simental-Mendía M, Sánchez-García A, et al. Effect of fibrates on glycemic parameters: a systematic review and meta-analysis of randomized placebo-controlled trials. PHARMACOL RES. 2018;132:232–241. doi:10.1016/j.phrs.2017.12.030
 © 2025 The Author(s). This work is published and licensed by Dove Medical Press Limited. The
full terms of this license are available at https://www.dovepress.com/terms
and incorporate the Creative Commons Attribution
- Non Commercial (unported, 4.0) License.
By accessing the work you hereby accept the Terms. Non-commercial uses of the work are permitted
without any further permission from Dove Medical Press Limited, provided the work is properly
attributed. For permission for commercial use of this work, please see paragraphs 4.2 and 5 of our Terms.
© 2025 The Author(s). This work is published and licensed by Dove Medical Press Limited. The
full terms of this license are available at https://www.dovepress.com/terms
and incorporate the Creative Commons Attribution
- Non Commercial (unported, 4.0) License.
By accessing the work you hereby accept the Terms. Non-commercial uses of the work are permitted
without any further permission from Dove Medical Press Limited, provided the work is properly
attributed. For permission for commercial use of this work, please see paragraphs 4.2 and 5 of our Terms.