Back to Journals » Diabetes, Metabolic Syndrome and Obesity » Volume 14
Association Between Thyroid Hormone Levels and Advanced Liver Fibrosis in Patients with Type 2 Diabetes Mellitus and Non-Alcoholic Fatty Liver Disease
Authors Du J ![]() , Chai S
, Chai S ![]() , Zhao X, Sun J
, Zhao X, Sun J ![]() , Zhang X, Huo L
, Zhang X, Huo L
Received 30 March 2021
Accepted for publication 11 May 2021
Published 26 May 2021 Volume 2021:14 Pages 2399—2406
DOI https://doi.org/10.2147/DMSO.S313503
Checked for plagiarism Yes
Review by Single anonymous peer review
Peer reviewer comments 2
Editor who approved publication: Professor Ming-Hui Zou
Jing Du,1 Sanbao Chai,1 Xin Zhao,1 Jianbin Sun,1 Xiaomei Zhang,1 Lili Huo2
1Department of Endocrinology, Peking University International Hospital, Beijing, People’s Republic of China; 2Department of Endocrinology, Beijing Jishuitan Hospital, Beijing, People’s Republic of China
Correspondence: Xiaomei Zhang
Department of Endocrinology, Peking University International Hospital, No. 1 Life Garden Road Zhongguancun Life Science Garden Changping District Tel/Fax +86-10-69006105
Email [email protected]
Purpose: To evaluate the effects of serum thyroid hormone levels on advanced liver fibrosis in cases with NAFLD (non-alcoholic fatty liver disease) and T2DM (type 2 diabetes mellitus).
Patients and Methods: A total of 1422 cases with T2DM who were admitted to Peking University International Hospital between December 2014 and October 2019 were retrospectively analyzed. Standard anthropometry as well as clinical and laboratory evaluation were performed on all patients. Abdominal ultrasonography was performed to diagnose NAFLD. NFS (NAFLD fibrosis score) was used to identify advanced fibrosis in patients with T2DM and NAFLD.
Results: In cases with T2DM and NAFLD, the serum FT3 level in cases with advanced fibrosis was lower than that in those without advanced fibrosis (4.79± 0.89 vs 4.28± 1.19, P < 0.05), and significant difference was not found in serum levels of FT4 and TSH between cases with advanced fibrosis and those without advanced fibrosis (P > 0.05). The incidence of advanced fibrosis declined as the rise of serum FT3 levels (P trend < 0.05). Besides, FT3 (OR, 0.492; 95% CI, 0.384– 0.631) was noted as a factor influencing advanced fibrosis in cases with T2DM and NAFLD (P< 0.05).
Conclusion: In cases with T2DM and NAFLD, the incidence of advanced fibrosis is negatively correlated with serum FT3 levels, and a low FT3 level is an independent risk factor of advanced fibrosis.
Keywords: diabetes mellitus, advanced fibrosis, thyroid hormone, non-alcoholic fatty liver disease
Introduction
In recent years, the incidence of NAFLD (non-alcoholic fatty liver disease) and T2DM (type 2 diabetes mellitus) has increased globally, which have imposed a huge burden on society and human health due to the rapid rise in unhealthy lifestyles and obesity. NAFLD and T2DM can interact with each other through common mechanisms, such as IR (insulin resistance) and obesity.1 The incidence of NAFLD is reported to be 25.2% or so globally,2 whereas the prevalence of NAFLD in patients with T2DM is more than 2-fold higher than that in the general population, which is about 55.5%.3
Previous systematic reviews and meta-analyses have shown that all-cause mortality, liver-related mortality, and liver transplantation rate significantly elevated in patients with NAFLD.4,5 T2DM is not only one of the most important risk factors for NAFLD, but also strongly associated with the risk of advanced fibrosis.6,7 It has been reported that cases with NAFLD and T2DM are more likely to develop into advanced fibrosis, with a prevalence of 17.02%.3 Therefore, it is highly essential to further monitor the progression of NAFLD in patients with T2DM. The gold standard for the diagnosis of hepatic fibrosis is liver biopsy, an invasive examination, which may cause complications, such as bleeding, infection. In recent years, numerous noninvasive scoring systems have been established to identify advanced fibrosis associated with NAFLD, such as NFS (NAFLD fibrosis score), FIB-4 (fibrosis 4 score), ELF (European Liver Fibrosis), APRI (aspartate aminotransferase-to-platelet ratio Index). NFS > 0.676 for advanced fibrosis has a high accuracy, with PPV (positive predictive value) of 90%, which is most often used in clinical practice.8
Thyroid hormones (TH) have prominent effects on hepatic lipid metabolism. Previous studies reported that serum thyroid hormone levels were inversely correlated with the occurrence of NAFLD,9 and a recent Mendelian randomization study revealed the causal relationship between hypothyroidism and NAFLD firstly.10 In addition, it was found that low TH levels increased the occurrence and progression of liver fibrosis.11,12 However, there are a limited number of studies on the relationship between TH levels and advanced liver fibrosis in patients with NAFLD and T2DM. In our research, the potential association of TH levels with advanced fibrosis in cases with T2DM and NAFLD was analyzed.
Patients and Methods
Subjects
Cases with T2DM who were admitted to the Endocrinology Department of Peking University International Hospital from December 2014 to October 2019 were retrospectively analyzed. DM (diabetes mellitus) was defined as FPG (fasting plasma glucose) ≥ 7.0 mmol/L and/or 2hPG (2-hour plasma glucose) value of ≥ 11.1 mmol/L in a 75 g OGTT (oral glucose tolerance test), according to the WHO (World Health Organization) criteria in 1999. Inclusion criteria: (1) adults (age ≥ 18 years old); (2) fatty liver diagnosed by ultrasonography (the increasing echogenicity of the liver parenchyma appears brighter than that of renal cortex, and posterior attenuation).13 Exclusion criteria: (1) cases with gestational diabetes, a special type of DM, or type 1 DM; (2) cases with excessive alcohol consumption (> 30g/day for men and > 20g/day for women); (3) cases with secondary causes of liver steatosis, such as viral hepatitis, autoimmune hepatitis, Wilson disease, hemochromatosis; (4) administration of drugs that may lead to fatty liver disease (eg, glucocorticoids, synthetic estrogen, valproate); (5) administration of drugs influencing serum TH levels, such as MMI (methimazole), PTU (propylthiouracil), and levothyroxine, amiodarone; (6) cases with serious diseases that can affect serum TH levels, such as acute diabetic complications (eg, ketoacidosis, hyperglycemic hyperosmolar status), severe infections, acute heart failure, severe liver or kidney diseases. Finally, a total of 1422 cases (886 men and 536 women) with complete data were included in this study.
Examination
Demographic and clinical data (age, gender, medical history, and drinking history, etc.) were recorded, and anthropometric parameters, including blood pressure, body weight, height, and WC (waist circumference), were harvested. BMI (body mass index) was defined as weight (kg)/square of height (m2).
After the case was fasted for 10 hours, venous blood was drawn, and the following parameters were determined, including the levels of TG (triglyceride), GGT (γ-glutamyl transferase), HbA1c (glycosylated hemoglobin), HDL-C (high-density lipoprotein cholesterol), FPG (fasting plasma glucose), FINS (fasting insulin), AST (aspartate aminotransferase), ALT (alanine aminotransferase), LDL-C (low-density lipoprotein cholesterol), ALB (albumin), TC (total cholesterol), Scr (serum creatinine) and whole blood count. The serum levels of FT3 (triiodothyronine), TSH (thyroid stimulating hormone) and FT4 (thyroxine) were detected by using Roche Cobas Elesys 601 analyzer (Roche, Basel, Switzerland). HOMA-IR (Homeostatic model assessment for insulin resistance) was calculated: HOMA-IR = FPG (mmol/L) × FINS (mIU/L)/22.5.
Abdominal ultrasonography was performed by experienced and trained sonographers using Philips iU Elite Color Doppler Ultrasound System (Philips Healthcare, Eindhoven, the Netherlands) with a probe frequency of 1–5 MHz. In the present study, NFS was used to determine advanced fibrosis in patients with NAFLD and T2DM. NFS was calculated: NFS = −1.675+0.037× age (years) + 0.094 × BMI (kg/m2) + 1.13 × impaired fasting glucose (IFG)/DM (yes =1, no =0) + 0.99 × AST/ALT ratio - 0.013 × platelet (×109/L) - 0.66 × ALB (g/dL). Advanced fibrosis was confirmed as NFS > 0.676, and excluded as NFS < −1.455.14
Statistical Analysis
In this study, we used SPSS 20.0 software (provided by IBM, Armonk, NY, USA). Normality was assessed with the Shapiro–Wilk test. Categorical data were expressed as absolute numbers and percentages. Continuous data were expressed as mean ± standard deviation or median (Q1, Q3). To compare the differences between the two groups, Chi-square test, Mann–Whitney U-test or independent t-test was employed if appropriate. Trend was analyzed using Logistic regression analysis. Univariate logistic regression (Model 1) and multivariate logistic regression (Model 2: adjusted for sex; Model 3: adjusted for sex, WC, SBP, TC, TG, HOMA-IR and Scr) were used to analyze the associations between TH levels and advanced fibrosis. Variables (age, BMI, platelets, ALT, albumin, and AST) for calculation of NFS were excluded from the analysis. P < 0.05 indicated significant differences.
Results
Demographic and Clinical Characteristics of the Cases
Herein, 1422 T2DM patients were enrolled, which were classified into two groups. There were 586 cases without NAFLD, and 836 cases with NAFLD. Based on NFS, 836 cases with T2DM and NAFLD were divided into three subgroups, including 81 with advanced fibrosis (NFS > 0.676) and 174 without advanced fibrosis (NFS < −1.455).
NAFLD was found in 58.8% of T2DM cases. Comparison with the T2DM cases without NAFLD, the T2DM cases with NAFLD showed higher BMI, WC, HbA1c, FPG, HOMA-IR, ALT, AST, GGT, TG, TC, FIB-4 and APRI, but lower average age, HDL-C, and FT3 (P < 0.05). Significant difference was not found in the proportion of male, and the levels of SBP, DBP, FINS, PLT, ALB, LDL-C, Scr, TSH and FT4 between the two groups (P > 0.05) (Table 1).
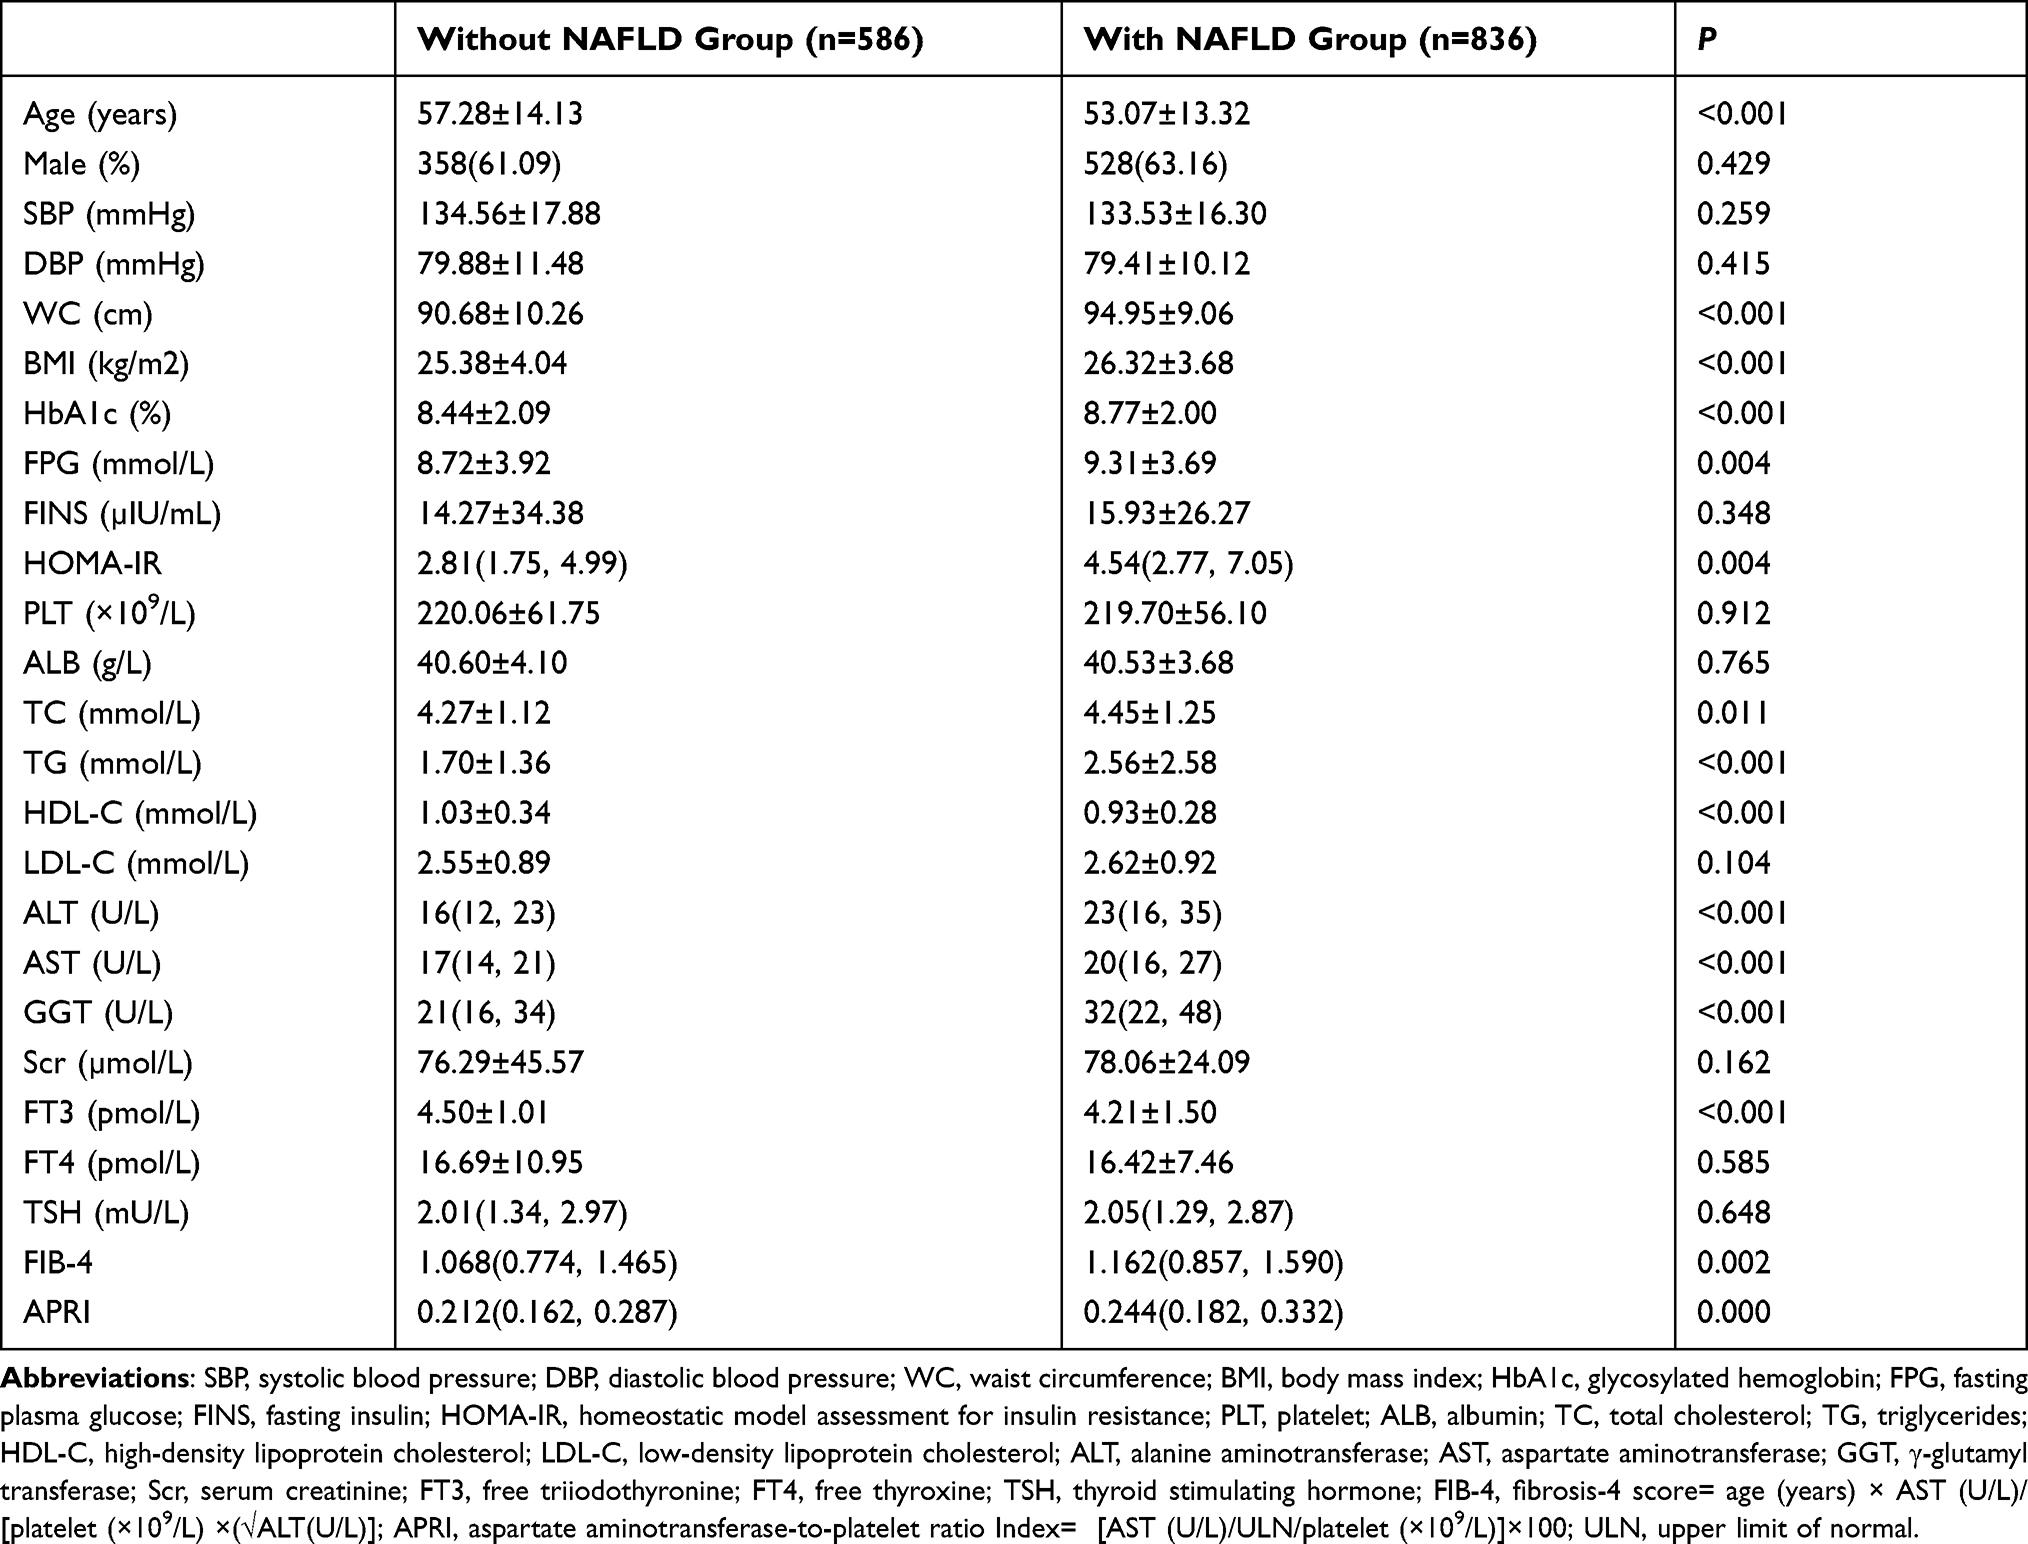 |
Table 1 Characteristics of T2DM Cases with and without NAFLD |
Among cases with NAFLD and T2DM, the incidence of advanced fibrosis was 9.7%. The average age, the proportion of male, BMI, and the levers of SBP, DBP, WC and Scr in cases with advanced fibrosis were higher than those in cases without advanced fibrosis. Nevertheless, the levels of HbA1c, ALT, GGT, TC, TG, PLT, ALB and FT3 in cases with advanced fibrosis were lower compared to cases without advanced fibrosis (P < 0.05). There were no significant differences on the levels of FPG, FINS, HOMA-IR, HDL-C, LDL-C, AST, FT4, and TSH between the two subgroups (P > 0.05) (Table 2).
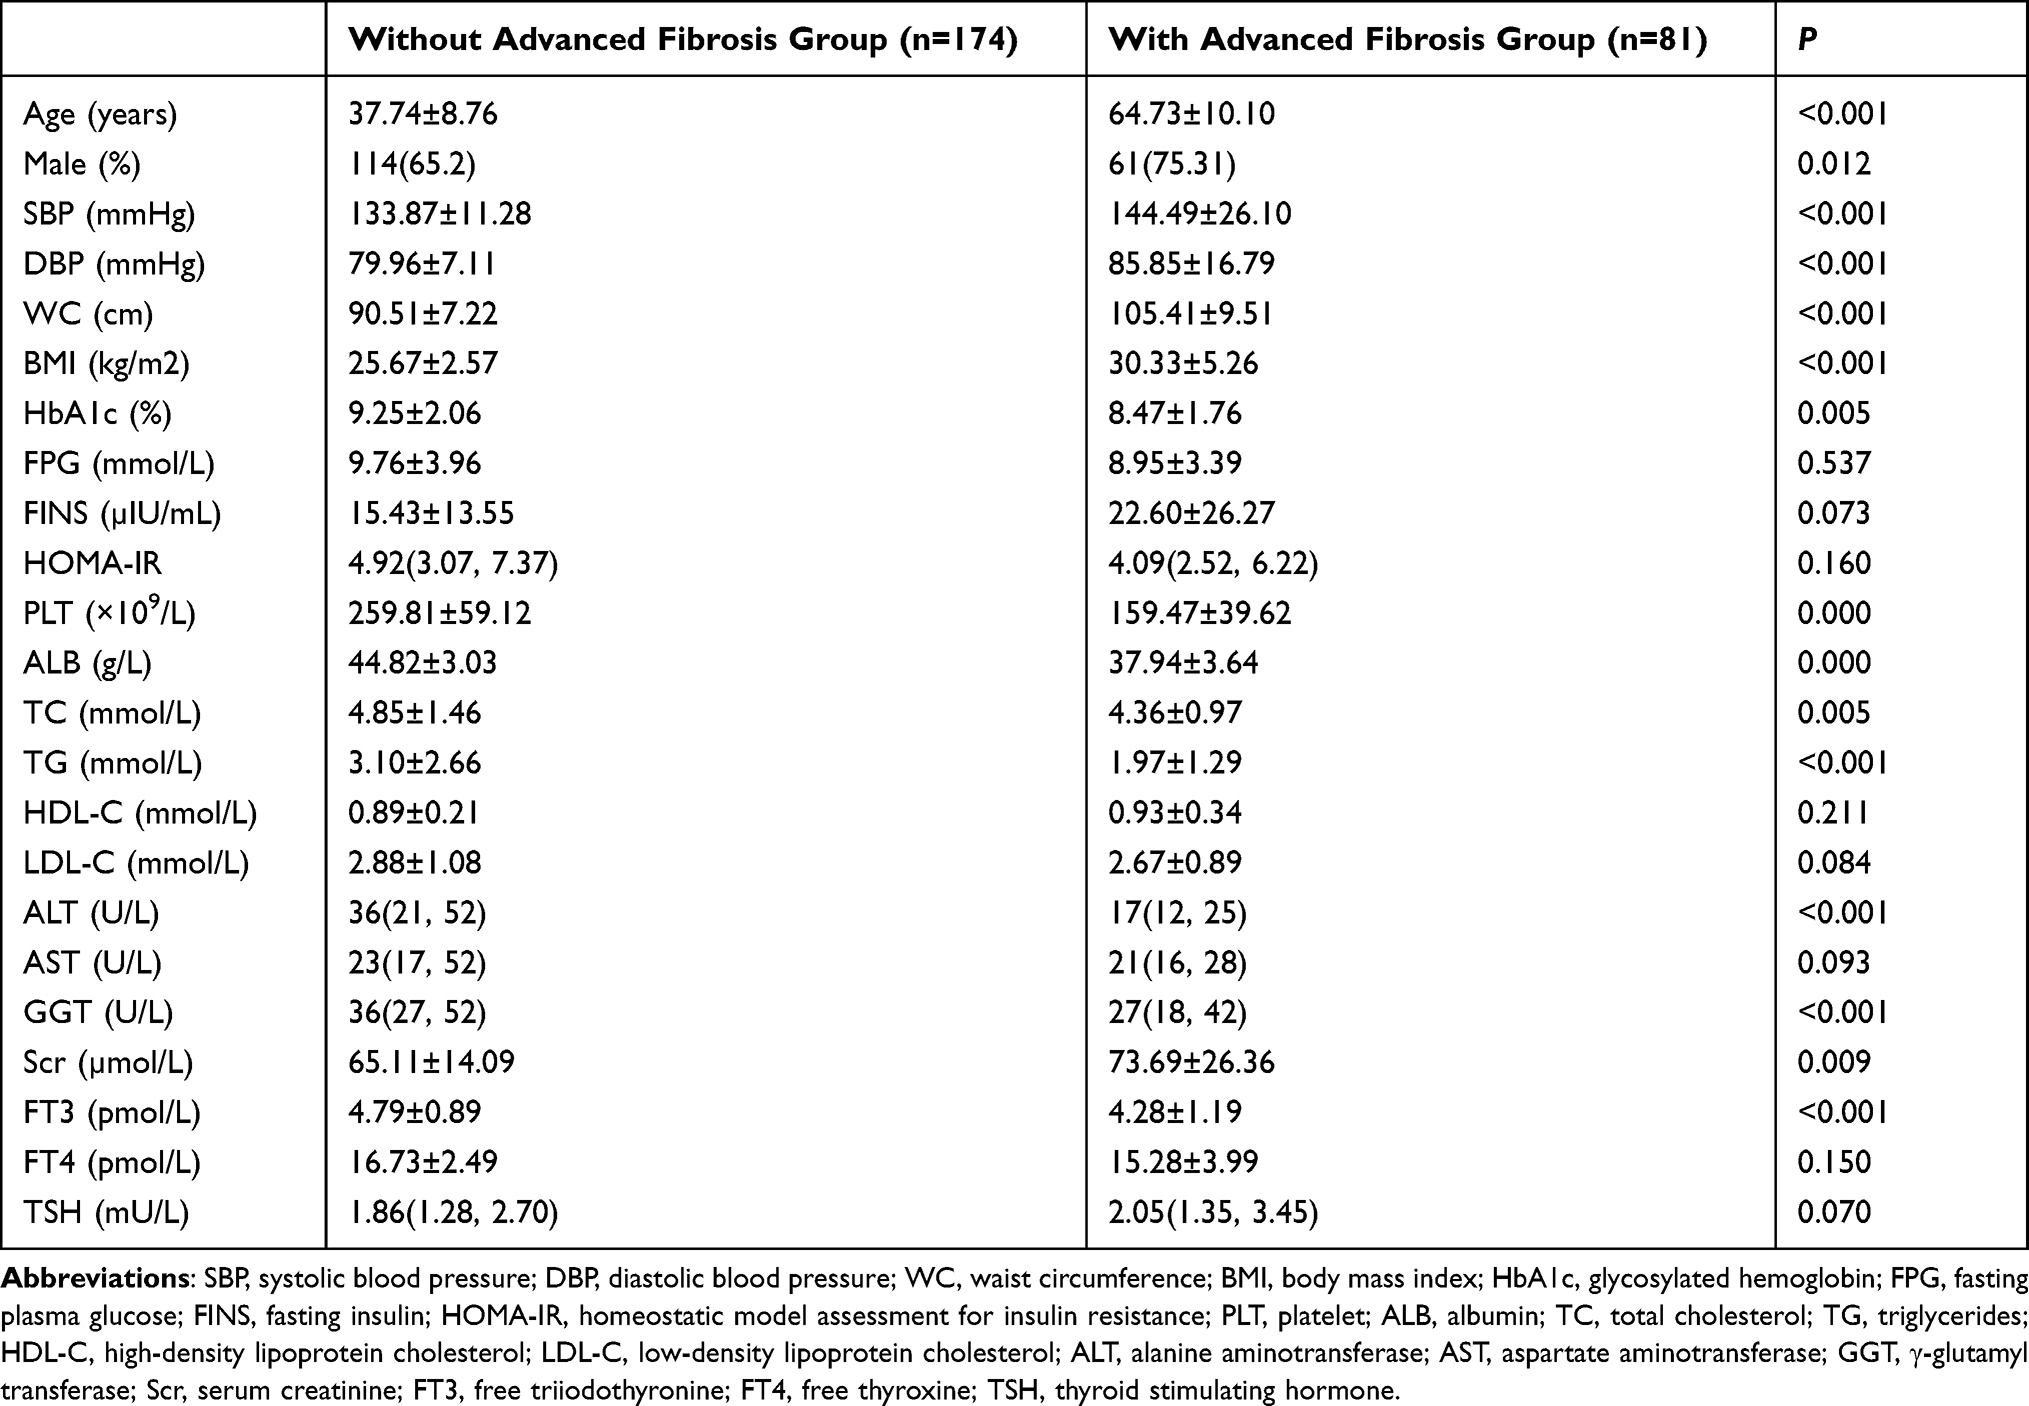 |
Table 2 Characteristics of T2DM Cases with and without NAFLD-Related Advanced Fibrosis Estimated by NFS |
Prevalence of Advanced Fibrosis in Cases with Different TH Levels
Based on TH levels, we divided the cases with T2DM and NAFLD into 4 groups. The incidence of advanced fibrosis in cases which had FT3 levels of < 4.0, 4.0~4.4, 4.4 ~4.8, and > 4.8 pmol/L was 16.67%, 9.95%, 9.05%, and 5.18%, respectively. The incidence of advanced fibrosis declined with the increase of serum FT3 levels (P trend < 0.05). The difference in the incidence of advanced fibrosis in cases with different levels of FT4 and TSH was not significant (P trend > 0.05) (Table 3).
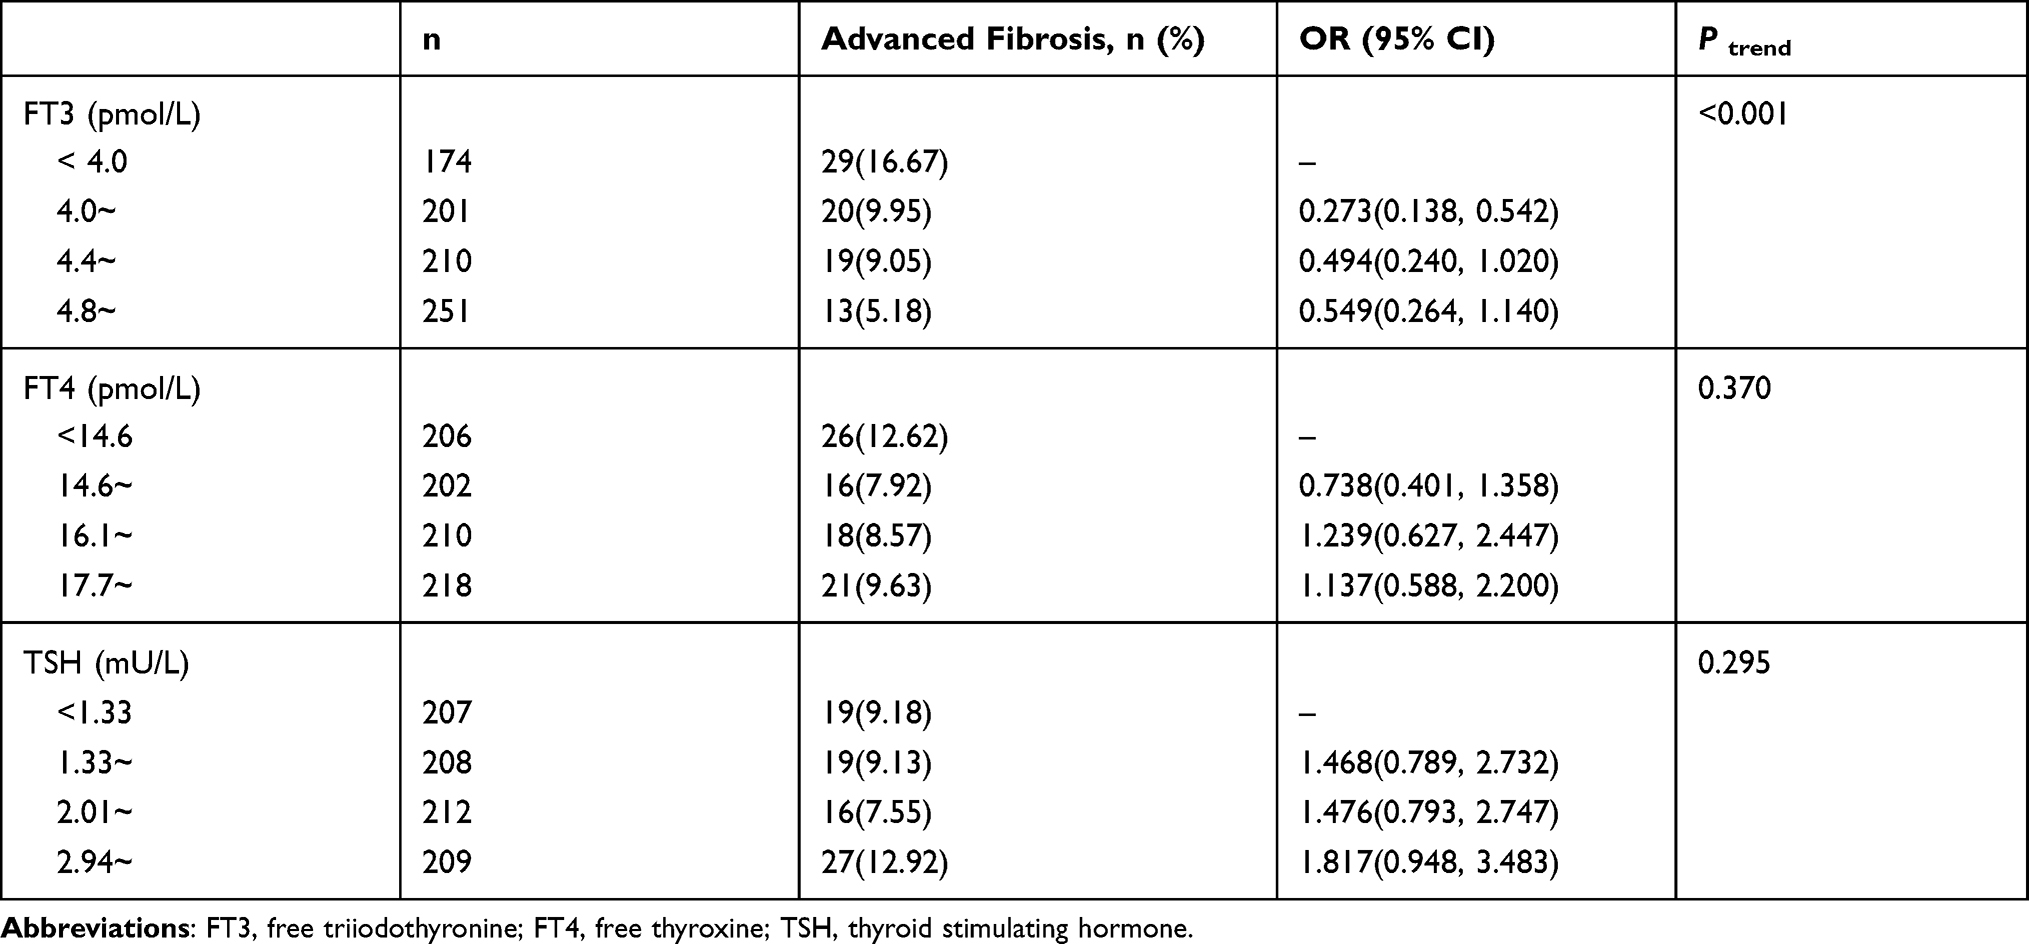 |
Table 3 Prevalence of Advanced Fibrosis in Cases with Different TH Levels |
Association of TH Levels with the Incidence of Advanced Fibrosis
It was found that FT3 was a factor influencing advanced fibrosis of NAFLD cases with T2DM in all models (P <0.05) (Table 4). FT4 and TSH were not associated with advanced fibrosis (P > 0.05).
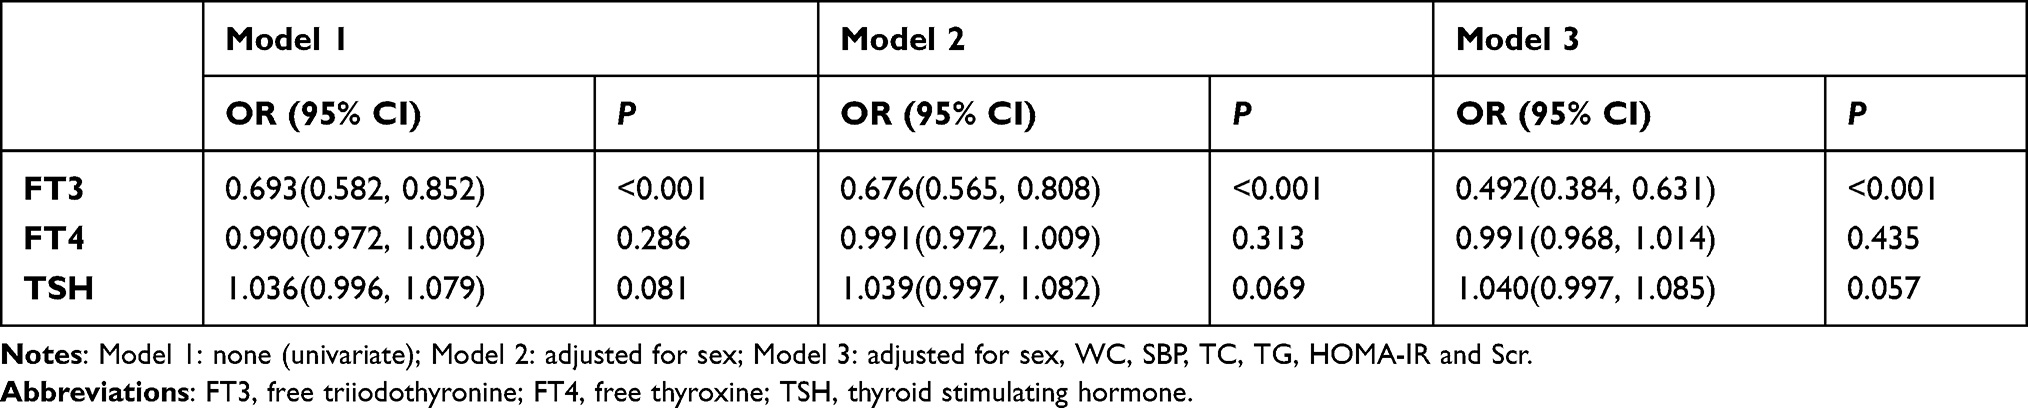 |
Table 4 Association of TH Levels with the Incidence of Advanced Fibrosis |
Discussion
As a common liver disease, NAFLD is closely related to DM and obesity. It spans a spectrum of histopathological abnormalities, including non-alcoholic steatosis, NASH (non-alcoholic steatohepatitis), cirrhosis, and liver cancer.15 T2DM is an important risk factor for NAFLD, and T2DM patients with NAFLD are more likely to have other components of the metabolic syndrome, eg, hypertension, obesity, and hyperlipidemia.16 In our research, the incidence of NAFLD in T2DM cases was 58.8%, which was close to 52.89% reported in East Asia.3 Our findings revealed that T2DM patients with NAFLD had higher BMI, WC, HbA1c, FPG, HOMA-IR, ALT, AST, TG, GGT, and TC levels compared to T2DM patients without NAFLD, indicating the IR was more severe, and obesity, metabolic disorders, and liver injury were more common in patients with NAFLD. In addition, T2DM raises the risk of NASH and liver fibrosis.17 The outcomes of cases with NAFLD and T2DM are worse with the occurrence and progression of liver fibrosis, involving liver-related mortality (eg, cirrhosis, end-stage liver disease, hepatocellular carcinoma), cardiovascular-related mortality, and all-cause mortality.4,5,8 Preventing the development and progression of liver fibrosis is highly significant to reduce the incidence of adverse outcomes. To date, the mechanistic pathways underlying the progression of NAFLD-related advanced fibrosis have not been fully understood.18,19 It is well known that THs are critical regulators of hepatic lipid homeostasis.20–22 Therefore, many recently conducted studies have concentrated on the association of TH levels with NAFLD-related advanced fibrosis. In our research, it was revealed that the incidence of advanced fibrosis was negatively associated with serum FT3 levels in a dose-dependent manner, which was consistent with the results reported by Manka et al11. The findings of the current research showed that the prevalence of advanced fibrosis is not related to the levels of FT4 and TSH. On the contrary, Bano et al23 and Kim et al12 pointed out that the risk of liver fibrosis was raised in cases with lower FT4 levels and higher TSH levels. The discrepancies may be related to the different study populations and diagnostic criteria for NAFLD-related advanced fibrosis. Additionally, the serum level of FT3 was not examined in these two studies.
The present research suggested that the level of FT3 in cases with advanced fibrosis was lower than that in cases without advanced fibrosis. After adjustment for sex, WC, SBP, TC, TG, HOMA-IR and Scr, the association between FT3 levels and advanced fibrosis remained statistically significant. Even though FT3 is not used as often in daily practice, it seems that a low FT3 level is an independent risk factor for advanced fibrosis in patients with NAFLD and T2DM. The mechanism of FT3-mediated effects on advanced fibrosis still remains elusive. T3 works by binding to nuclear TR (thyroid hormone receptors) α and TRβ. Most actions of T3 in the liver are mediated by TRβ, which is involved in the regulation of cellular metabolism and differentiation.24 FT3, which is a biologically active form of thyroid hormone, through binding to TRβ of liver cells, reduces intrahepatic triglycerides and cholesterol content,25 improves insulin sensitivity, decreases inflammation and oxidation stress, restores mitochondrial function of liver cells,26 and antagonizes TGF-β-mediated responses27 to prevent the occurrence and progression of liver fibrosis. TGF-β is a cytokine that plays a key role in pathological processes such as fibrosis and cancer by activating SMAD transcription factors. Alonso-Merino et al27 found that mice lacking TR had raised hepatic expressions of profibrotic genes Col1a1 and Tgfβ1, and exhibited spontaneously increased collagen fibers (a pathological change in the early stage of liver cirrhosis) deposition in the liver. In addition, the administration of T3 to mice could alleviate liver fibrosis caused carbon tetrachloride (CCL4). This study confirmed that T3 could antagonize TGF-β/SMAD-mediated liver fibrosis by reducing SMAD phosphorylation, decreasing SMAD binding elements which were responsive to TGF-β, repressing activation of TGF-β target promoters and preventing interaction between SMAD4, SMAD3 and the receptors. Furthermore, Iannucci et al28 demonstrated that the administration of T3 (0.25 µg/kg/d) to rats fed high-fat diet not only reduced hepatic TG, but also prevented the generation of toxic lipid species (eg, ceramides), which could induce mitochondrial dysfunction resulting in the increasing production of ROS (reactive oxygen species). ROS plays a very important role in activating stellate cells of liver that participate in fibrogenesis. Harrison et al29 reported that, in patients with NASH confirmed by biopsy (fibrosis stages 1–3), Resmetirom (MGL-3196, a TRβ agonist) reduced hepatic fat, the levels of liver enzymes and biomarkers associated with inflammation and fibrosis after 12-week and 36-week treatment. Therefore, when the serum level of FT3 decreases, the protective mechanisms of FT3 in liver are attenuated, which may facilitate the occurrence and progression of liver fibrosis.30 The serum level of FT3 is regulated by the TSH level. Previous studies have shown that the TSH level increases with age.31 In this study, the results showed that the mean age of cases with advanced fibrosis was higher compared to those without advanced fibrosis (P < 0.05); the levels of TSH in cases with advanced fibrosis were higher compared to those without advanced fibrosis, but the difference was not statistically significant (P > 0.05), and logistic regression showed that TSH was not associated with advanced fibrosis. Moreover, some previous studies found that the risk of liver fibrosis was related to a higher FT3 level.32,33 These results are not completely consistent. Therefore, it is highly essential to further investigate the relationship of TH levels with liver fibrosis related to NAFLD, and clarify the effects of TH on NASH and advanced fibrosis among the patients with NAFLD and T2DM.
There are some limitations in the current study. First, we use NFS to evaluate advanced fibrosis in cases with T2DM and NAFLD, which is less accurate than liver biopsy. Second, a causal relationship between TH levels and advanced fibrosis cannot be found due to the cross-sectional nature of the study.
Conclusion
In summary, in cases with NAFLD and T2DM, the prevalence of advanced fibrosis is negatively correlated with serum FT3 levels, and a low FT3 level is an independent risk factor for advanced fibrosis. Clinically, monitoring serum FT3 levels may be of great significance for the prediction of advanced fibrosis. Moreover, these patients should be referred to hepatologists for further diagnostic evaluation and treatment.
Data Sharing Statement
The data that support the findings of this study are available from the corresponding author upon reasonable request.
Ethics Approval and Informed Consent
This is an observational and retrospective study with no potential damage to the subjects. The individual identifiable information and privacy of the subjects were not involved in the study. The study protocol was approved by the Ethics Committee of Peking University International Hospital [2021-002(BMR)], and it was sanctioned that the informed consent of the participant was not necessarily required. All procedures were performed in accordance with the Declaration of Helsinki.
Disclosure
The authors report no conflicts of interest in this work.
References
1. Mantovani A, Byrne CD, Bonora E, Targher G. Nonalcoholic fatty liver disease and risk of incident type 2 diabetes: a meta-analysis. Diabetes Care. 2018;41(2):372–382. doi:10.2337/dc17-1902
2. Younossi ZM, Koenig AB, Abdelatif D, Fazel Y, Henry L, Wymer M. Global epidemiology of nonalcoholic fatty liver disease-Meta-analytic assessment of prevalence, incidence, and outcomes. Hepatology. 2016;64(1):73–84. doi:10.1002/hep.28431
3. Younossi ZM, Golabi P, de Avila L, et al. The global epidemiology of NAFLD and NASH in patients with type 2 diabetes: a systematic review and meta-analysis. J Hepatol. 2019;71(4):793–801. doi:10.1016/j.jhep.2019.06.021
4. Dulai PS, Singh S, Patel J, et al. Increased risk of mortality by fibrosis stage in nonalcoholic fatty liver disease: systematic review and meta-analysis. Hepatology. 2017;65(5):1557–1565. doi:10.1002/hep.29085
5. Taylor RS, Taylor RJ, Bayliss S, et al. Association between fibrosis stage and outcomes of patients with nonalcoholic fatty liver disease: a systematic review and meta-analysis. Gastroenterology. 2020;158(6):1611–1625. doi:10.1053/j.gastro.2020.01.043
6. Leite NC, Villela-Nogueira CA, Pannain VL, et al. Histopathological stages of nonalcoholic fatty liver disease in type 2 diabetes: prevalences and correlated factors. Liver Int. 2011;31(5):700–706. doi:10.1111/j.1478-3231.2011.02482.x
7. Loomba R, Abraham M, Unalp A, et al. Association between diabetes, family history of diabetes, and risk of nonalcoholic steatohepatitis and fibrosis. Hepatology. 2012;56(3):943–951. doi:10.1002/hep.25772
8. Chalasani N, Younossi Z, Lavine JE, et al. The diagnosis and management of nonalcoholic fatty liver disease: practice guidance from the American Association for the Study of Liver Diseases. Hepatology. 2018;67(1):328–357.
9. Mantovani A, Nascimbeni F, Lonardo A, et al. Association between primary hypothyroidism and nonalcoholic fatty liver disease: a systematic review and meta-analysis. Thyroid. 2018;28(10):1270–1284. doi:10.1089/thy.2018.0257
10. Qiu S, Cao P, Guo Y, Lu H, Hu Y. Exploring the causality between hypothyroidism and non-alcoholic fatty liver: a Mendelian Randomization Study. Front Cell Dev Biol. 2021;9:643582. doi:10.3389/fcell.2021.643582
11. Manka P, Bechmann L, Best J, et al. Low free triiodothyronine is associated with advanced fibrosis in patients at high risk for nonalcoholic steatohepatitis. Dig Dis Sci. 2019;64(8):2351–2358. doi:10.1007/s10620-019-05687-3
12. Kim D, Yoo ER, Li AA, et al. Low-normal thyroid function is associated with advanced fibrosis among adults in the United States. Clin Gastroenterol Hepatol. 2019;17(11):2379–2381. doi:10.1016/j.cgh.2018.11.024
13. Jian-gao F. Chinese Liver Disease Association. Guidelines for management of nonalcoholic fatty liver disease: an updated and revised edition. Chin j Hepatol. 2010;18(3):163–166.
14. Paul A, Jason MH, Giulio M, et al. The NAFLD fibrosis score: a noninvasive system that identifies liver fibrosis in patients with NAFLD. Hepatology. 2007;45(4).
15. Rinella ME. Nonalcoholic fatty liver disease: a systematic review. JAMA. 2015;313(22):2263–2273. doi:10.1001/jama.2015.5370
16. Bril F, Cusi K. Management of nonalcoholic fatty liver disease in patients with type 2 diabetes: a call to action. Diabetes Care. 2017;40(3):419–430. doi:10.2337/dc16-1787
17. Lee YH, Cho Y, Lee BW, et al. Nonalcoholic fatty liver disease in diabetes. part i: epidemiology and diagnosis. Diabetes Metab J. 2019;43(1):31–45. doi:10.4093/dmj.2019.0011
18. Marra F, Svegliati-Baroni G. Lipotoxicity and the gut-liver axis in NASH pathogenesis. J Hepatol. 2018;68(2):280–295. doi:10.1016/j.jhep.2017.11.014
19. Ipsen DH, Lykkesfeldt J, Tveden-Nyborg P. Molecular mechanisms of hepatic lipid accumulation in non-alcoholic fatty liver disease. Cell Mol Life Sci. 2018;75(18):3313–3327.
20. Mullur R, Liu YY, Brent GA. Thyroid hormone regulation of metabolism. Physiol Rev. 2014;94(2):355–382. doi:10.1152/physrev.00030.2013
21. Sinha RA, Bruinstroop E, Singh BK, Yen PM. Nonalcoholic fatty liver disease and hypercholesterolemia: roles of thyroid hormones, metabolites, and agonists. Thyroid. 2019;29(9):1173–1191. doi:10.1089/thy.2018.0664
22. Sinha RA, Singh BK, Yen PM. Direct effects of thyroid hormones on hepatic lipid metabolism. Nat Rev Endocrinol. 2018;14(5):259–269. doi:10.1038/nrendo.2018.10
23. Bano A, Chaker L, Plompen EP, et al. Thyroid function and the risk of nonalcoholic fatty liver disease: the Rotterdam Study. J Clin Endocrinol Metab. 2016;101(8):3204–3211. doi:10.1210/jc.2016-1300
24. Pascual A, Aranda A. Thyroid hormone receptors, cell growth and differentiation. Biochim Biophys Acta. 2013;1830(7):3908–3916. doi:10.1016/j.bbagen.2012.03.012
25. Perra A, Simbula G, Simbula M, et al. Thyroid hormone (T3) and TRbeta agonist GC-1 inhibit/reverse nonalcoholic fatty liver in rats. FASEB J. 2008;22(8):2981–2989. doi:10.1096/fj.08-108464
26. Sinha RA, Yen PM. Thyroid hormone-mediated autophagy and mitochondrial turnover in NAFLD. Cell Biosci. 2016;6:46. doi:10.1186/s13578-016-0113-7
27. Alonso-Merino E, Martin OR, Ruiz-Llorente L, et al. Thyroid hormones inhibit TGF-beta signaling and attenuate fibrotic responses. Proc Natl Acad Sci U S A. 2016;113(24):E3451–E3460. doi:10.1073/pnas.1506113113
28. Iannucci LF, Cioffi F, Senese R, et al. Metabolomic analysis shows differential hepatic effects of T2 and T3 in rats after short-term feeding with high fat diet. Sci Rep. 2017;7(1):2023. doi:10.1038/s41598-017-02205-1
29. Harrison SA, Bashir MR, Guy CD, et al. Resmetirom (MGL-3196) for the treatment of non-alcoholic steatohepatitis: a multicentre, randomised, double-blind, placebo-controlled, Phase 2 trial. Lancet. 2019;394(10213):2012–2024. doi:10.1016/S0140-6736(19)32517-6
30. Chaurasia B, Summers SA. Ceramides - Lipotoxic Inducers of Metabolic Disorders. Trends Endocrinol Metab. 2015;26(10):538–550. doi:10.1016/j.tem.2015.07.006
31. Spencer CA, Hollowell JG, Kazarosyan M, Braverman LE. National Health and Nutrition Examination Survey III thyroid-stimulating hormone (TSH)-thyroperoxidase antibody relationships demonstrate that TSH upper reference limits may be skewed by occult thyroid dysfunction. J Clin Endocrinol Metab. 2007;92(11):4236–4240. doi:10.1210/jc.2007-0287
32. Pan YW, Tsai MC, Yang YJ, Chen MY, Chen SY, Chou YY. The relationship between nonalcoholic fatty liver disease and pediatric congenital hypothyroidism patients. Kaohsiung J Med Sci. 2019;35(12):778–786. doi:10.1002/kjm2.12118
33. Chen P, Hou X, Wei L, et al. Free triiodothyronine is associated with the occurrence and remission of nonalcoholic fatty liver disease in euthyroid women. Eur J Clin Invest. 2019;49(4):e13070. doi:10.1111/eci.13070
 © 2021 The Author(s). This work is published and licensed by Dove Medical Press Limited. The
full terms of this license are available at https://www.dovepress.com/terms
and incorporate the Creative Commons Attribution
- Non Commercial (unported, 3.0) License.
By accessing the work you hereby accept the Terms. Non-commercial uses of the work are permitted
without any further permission from Dove Medical Press Limited, provided the work is properly
attributed. For permission for commercial use of this work, please see paragraphs 4.2 and 5 of our Terms.
© 2021 The Author(s). This work is published and licensed by Dove Medical Press Limited. The
full terms of this license are available at https://www.dovepress.com/terms
and incorporate the Creative Commons Attribution
- Non Commercial (unported, 3.0) License.
By accessing the work you hereby accept the Terms. Non-commercial uses of the work are permitted
without any further permission from Dove Medical Press Limited, provided the work is properly
attributed. For permission for commercial use of this work, please see paragraphs 4.2 and 5 of our Terms.