Back to Journals » International Journal of General Medicine » Volume 14
Association Between the Central Venous Pressure and All-Cause Mortality in Critically Ill Patients with Acute Kidney Injury
Authors Huang A, Liao L ![]() , Pan L, Pinhu L
, Pan L, Pinhu L
Received 6 September 2021
Accepted for publication 26 October 2021
Published 10 November 2021 Volume 2021:14 Pages 8019—8027
DOI https://doi.org/10.2147/IJGM.S331686
Checked for plagiarism Yes
Review by Single anonymous peer review
Peer reviewer comments 2
Editor who approved publication: Dr Scott Fraser
Aifang Huang,1 Lin Liao,2 Ling Pan,1 Liao Pinhu3
1Renal Division, Department of Medicine, First Affiliated Hospital of Guangxi Medical University, Nanning, Guangxi Zhuang Autonomous Region, 530021, People’s Republic of China; 2Department of Clinical Laboratory, First Affiliated Hospital of Guangxi Medical University, Nanning, Guangxi Zhuang Autonomous Region, 530021, People’s Republic of China; 3Department of Emergency, First Affiliated Hospital of Guangxi Medical University, Nanning, Guangxi Zhuang Autonomous Region, 530021, People’s Republic of China
Correspondence: Liao Pinhu
Department of Emergency, First Affiliated Hospital of Guangxi Medical University, Nanning, 530021, Guangxi Zhuang Autonomous Region, People’s Republic of China
Tel +867712806099
Email [email protected]
Purpose: Elevated central venous pressure (CVP) plays an important role in the occurrence of acute kidney injury (AKI) and it is also independently associated with the prognosis of critically ill patients. However, the effect of CVP on critically ill AKI patients remains unclear. In this study, we analyzed the relationship between CVP and all-cause mortality of critically ill patients with AKI.
Patients and Methods: The clinical data of patients in intensive care unit (ICU) were retrieved from the Medical Information Mart for Intensive Care III (MIMIC-III) database and retrospectively analyzed. The all-cause mortality for up to 90 days was the main observed outcome. We used the minimum CVP value obtained during the first 72 hours after ICU admission for our analysis and patients were grouped according to this parameter. Patients were also analyzed after being further divided according to stages 1, 2 and 3 of AKI. Multiple Cox regression and Kaplan–Meier analyses were used to explore the association between CVP measurements and death of ICU patients with AKI.
Results: A total of 1986 ICU patients with AKI were studied. A total of 527 (26.5%) patients died by day 90. The high CVP group (patients with ≥ 10 mmHg) had the lowest 90-day survival rate (P =0.001 by log rank test) when according to Kaplan–Meier analysis. By using Cox regression analysis, high CVP was found to be linked to an increase in mortality (CVP ≥ 10 mmHg versus ≤ 5 mmHg, HR, 1.336, 95% CI, 1.064 to 1.677, P trend=0.014). Furthermore, when using in a multivariate Cox regression analysis with CVP as a continuous variable, the higher CVP levels were still an independent risk factor for 90-day all-cause mortality (per 1 mmHg increase, HR, 1.031, 95% CI, 1.013– 1.049, P=0.001). In subgroup analysis, a similar trend was observed in patients with AKI stages 2 and 3.
Conclusion: The minimum CVP level during the first 72h after ICU admission was positively associated with mortality in critically ill patients with AKI and this more marked in cases with severe AKI.
Keywords: intensive care, kidney disease, 72h CVP value, Kaplan–Meier curve, Cox regression analysis, AKI stage
Introduction
Acute kidney injury (AKI) is a common complication in intensive care unit (ICU) patients, and the mortality of critically ill patients with AKI is much higher than those without AKI.1–3 Additionally, critically ill patients with AKI always need renal replacement therapy because of the loss of renal function and even survivors will often progress to chronic kidney disease (CKD). These cases often require maintenance dialysis or eventual transplantation, which is costly and may result in significantly higher mortality when compared with patients without AKI.4–6 Therefore, finding an ideal predictor for the development of AKI and identifying patients at high risk of poor outcomes and taking timely and reasonable measures are crucial for the well-being of those concerned. Despite many efforts and a few successes, challenges still exist.7,8
Studies show that hemodynamic alterations play an important role in the pathophysiology of AKI.9 Central venous pressure (CVP) is one of the most commonly used hemodynamic parameters in ICU patients. Investigations in recent years have pointed out that higher CVP values could lead to an increase occurrence of AKI and higher mortality in critically ill patients.10 However, the effect of CVP on the death of critically ill patients with AKI is still unclear. In particular, the relationship between the minimum CVP value and the death of ICU AKI patients is rarely reported. We attempted to use the Medical Information Mart for Intensive Care III (MIMIC-III) database to retrospectively analyze the correlation between CVP and the 90-day all-cause death in critically ill patients with AKI. We especially explored whether the lowest CVP value obtained during the first 72 hours after ICU admission was related to the death of AKI patients in the ICU.
Materials and Methods
Data Source
We extracted data from the MIMIC-III database, which is a public and freely available intensive care unit (ICU) database that recorded important information of more than 50,000 adult admissions to ICUs in the Beth Israel Deaconess Medical Center in Boston from 2001 to 2012. The establishment of the MIMIC-III database was approved by the Institutional Review Boards both of Beth Israel Deaconess Medical Center (Boston, MA) and the Massachusetts Institute of Technology (Cambridge, MA). Since the present study did not impact clinical care and all protected health information was deidentified in the database, informed consent was not required.11 In order to obtain permission of access to the database, we enrolled onto the National Institute of Health’s web-based course and completed the required course, passed the Protecting Human Research Participants examination and then obtained a certificate (no. 30165505).
Inclusion and Exclusion Criteria
All patients in the database were screened. The inclusion criteria in this study were as follows: (1) adults (≥18 years of age) at time of ICU admission, with complete medical records available including CVP measurement records during the first 72 hours after ICU admission and (2) AKI was diagnosed within the first 48 hours of ICU admission. For patients with multiple ICU stays, only data related to the first ICU admission were considered. AKI was defined and staged according to the Kidney Disease: Improving Global Outcomes (KDIGO) criteria.12 The specific criteria for diagnosis of AKI were as follows: an increase in the serum creatinine (SCr) to ≥1.5 times baseline must have occurred within the prior 7 days; or an increase in SCr to ≥0.3 mg/dL within 48 hours; or urine volume <0.5mL/kg/h for 6 hours or more. In the present study, the first measurement of SCr after ICU admission was used as the baseline value.13 Moreover, AKI staging was based on both SCr levels and urine output during the first 48h after ICU admission.
Patients who met the following criteria were excluded: 1) individuals younger than 18 years old, 2) discharged or died within 72h after ICU admission, 3) no available CVP measurement obtained within 72h after ICU admission and 4) more than 5% of the potential risk variables for death were missing.
Data Extraction
We used Structured Query Language (SQL) with PostgreSQL tools (version 9.6) to extract the data from the MIMIC-III database. We extracted the minimum CVP measurements obtained during the first 72 h after ICU admission as the primary exposure. Other variables included age, gender, ethnicity, admission type, vital signs, AKI stage, comorbidities, scoring systems and laboratory parameters. Comorbidities included malignancy, sepsis, acute respiratory distress syndrome (ARDS), congestive heart failure (CHF), cardiac arrhythmias, pulmonary circulation disease, hypertension, valvular disease, chronic renal failure and chronic liver disease. We collected all comorbidities on the basis of the recorded International Classification of Diseases, 9th revision (ICD-9) codes in the MIMIC-III database.
Sepsis was defined as life-threatening organ dysfunction caused by a dysregulated host response to infection (sepsis 3.0).14 Scoring systems included the simplified acute physiology score II (SAPSII) and the sequential organ failure assessment (SOFA) score. Laboratory parameters included white blood cell (WBC) counts as well as hemoglobin, creatinine, blood urea nitrogen (BUN), chloride, potassium and lactate levels. Scoring system data and laboratory parameters were obtained within 24 hours after admission to the ICU. Additionally, we extracted data on fluid input, urine output and fluid balance of first 24h after admission as well as use of vasopressors, mechanical ventilation, renal replacement therapy and length of ICU stay and hospitalization. Studies have suggested that a CVP≥10 mmHg indicates poor prognosis, while a CVP ≤ 5 mmHg has better fluid responsiveness.15–17 On the basis of these previous studies, the enrolled cases were divided into three groups based on the minimum CVP values obtained during the first 72h after ICU admission: the low, middle and high CVP groups that registered measurements of ≤5, 6–9 and 10 mmHg, respectively.
Patient Outcome
The primary outcome was all-cause 90-day mortality after ICU admission. The secondary outcomes included use of vasopressors, mechanical ventilation, renal replacement therapy and length of ICU stay and hospitalization. For some patients, who died outside the hospital, mortality data were extracted from the Social Security Death Index.
Statistical Analysis
Continuous data were tested for normality or non-normalized distribution using the Kolmogorov–Smirnov test. All numerical data were presented as means ± standard deviations (SDs) and compared using the analysis of variance for normally distributed data. Non-normally distributed data were presented as medians and compared using the Kruskal–Wallis test. Categorical data were summarized as proportions and compared using Chi-square test. Multiple Cox regression analysis was used to explore the associations between CVP measurements and death of ICU patients with AKI. Survival analysis using Kaplan–Meier (K-M) curves was used to analyze the difference between survival rates and survival curves based on the different levels of CVP. Statistical analyses were performed using SPSS 22.0 software (SPSS, IBM, NY, US.) Statistical significance was defined as P<0.05.
Results
Baseline Characteristics
After screening, data of a total of 1986 critically ill patients with AKI with a median age of 67.6 years were included in this analysis as illustrated in Figure 1. Among the enrolled patients, 58.4% were males and 73.9% were classed as white.
 |
Figure 1 Flow diagram of the patients included in this study. Abbreviations: MIMIC III, Multiparameter Intelligent Monitoring in Intensive Care Database III; CVP, central venous pressure; ICU, intensive care unit. |
Baseline characteristics of patients were divided according to CVP measurements and are presented in Table 1 with 1040 (52.4%), 580 (29.2%) and 366 patients (19.4%) included in the low, middle and high CVP groups, respectively. According to the kidney disease: improving global outcomes (KDIGO) guidelines, patients at AKI stages 1, 2 and 3 accounted for 20.2%, 42.6% and 37.2% of all the patients, respectively. Patients in the high CVP group tended to be younger, had the highest rate of AKI stage 3 (50.0%) cases and were more likely to be complicated with sepsis, congestive heart failure and cardiac arrhythmias. Moreover, these patients had higher SOFA and SAPSII scores as well as increased levels of creatinine and blood urea nitrogen (BUN) together with reduced chloride ions and urine output (Table 1).
 |
Table 1 Baseline Characteristics of Patient Groups Divided According to Their CVP Measurements |
Comparisons Between the Death and Survival Groups During the Study Period
During the study period, 527 (26.5%) patients had died by day 90. Based on patient deaths within 90 days, patients were placed into either a non-survivor or a survivor group. In the 90-day death group, the parameters of age, CVP, SOFA score, SAPSII score, creatinine, hemoglobin, lactate and BUN were significantly higher, while mean artery pressure (MAP) and urine output as well as potassium and chloride levels were significantly lower compared with those in the survivor group. The non-survivors were more likely to be admitted as emergency admissions, to develop AKI stage 3 and to have more comorbidities. However, there were no differences in ethnicity and fluid balance as well as platelet and WBC counts. The likelihood of ARDS, pulmonary circulation disease and hypertension was also not different between non-survivors and survivors.
Association Between CVP Values and Outcomes in All Patients and Subgroups
By using the K-M analysis, as shown in Figure 2, the 90-day survival rate was seen to be the lowest in the high CVP group (P=0.001 by log rank test for trend). A higher minimum CVP level (CVP ≥10 mmHg versus CVP ≤5 mmHg) during the first 72 hours after ICU admission was found to be a significant predictor of 90-day mortality by both univariate and multivariate Cox regression analyses. These were adjusted for age, gender, admission type, AKI stage, malignancy, sepsis, congestive heart failure, cardiac arrhythmias, valve-associated disease, chronic renal disease, chronic liver disease, SOFA score, SAPSII score, MAP, lactate, creatinine, hemoglobin, chloride and potassium (Table 2). Furthermore, a multivariate Cox regression analysis using CVP as a continuous variable showed that per 1 mmHg increase in CVP also raised the odds of mortality (Figure 3). We also conducted Cox regression analysis across subgroups of AKI stages 1, 2 and 3. There was a significant association between CVP levels and mortality in patients with AKI stages 2 and 3, while no significant effect of CVP on mortality was seen in patients with AKI stage 1 (Table 2 and Figure 3).
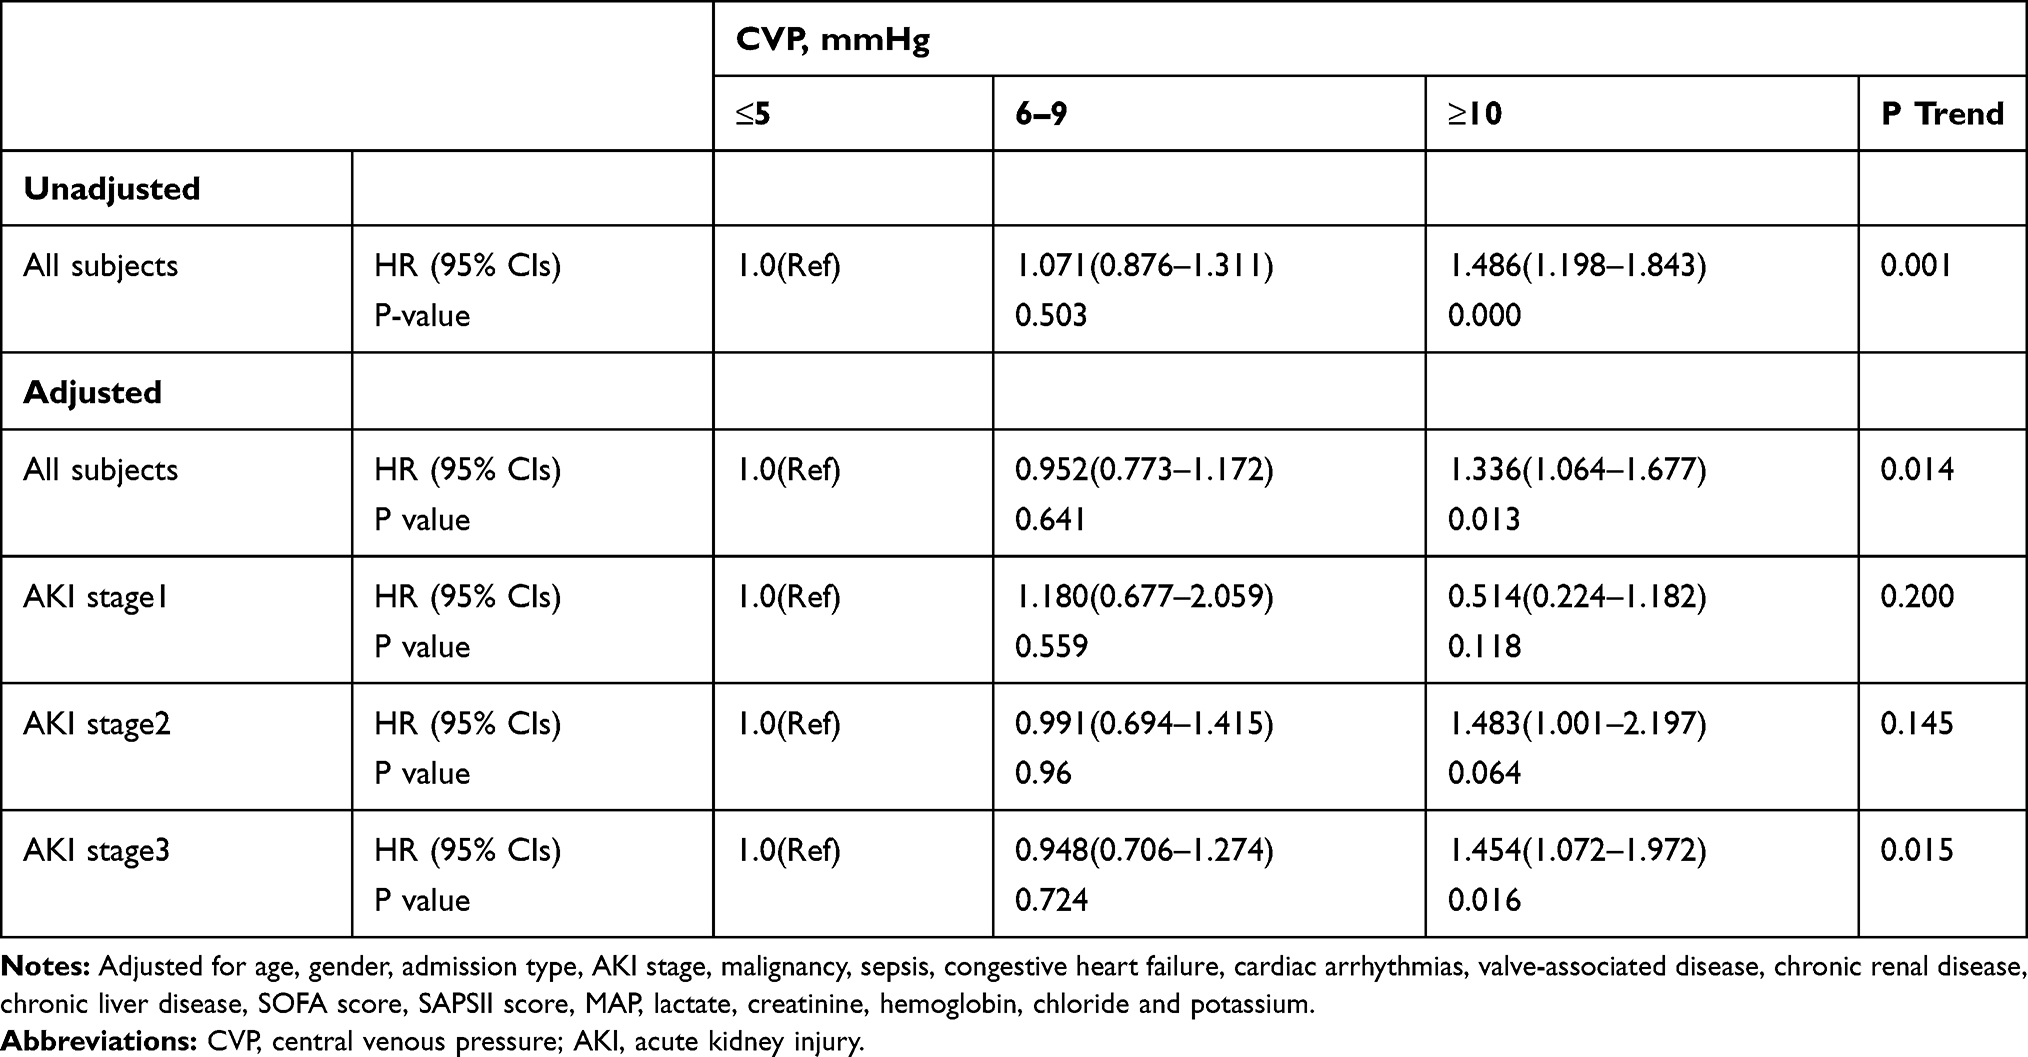 |
Table 2 HRs (95% CIs) for Mortality Across Groups of CVP in All Subjects and Subgroups |
 |
Figure 2 Kaplan–Meier survival curves of the patients in the three CVP groups. |
 |
Figure 3 A forest plot of the association between CVP measurements (per 1mm Hg increase) and 90-day mortality in all subjects and subgroups. Abbreviations: CVP, central venous pressure; AKI, acute kidney injury. Notes: Adjusted for age, gender, admission type, AKI stage, malignancy, sepsis, congestive heart failure, cardiac arrhythmias, valve-associated disease, chronic renal disease, chronic liver disease, SOFA score, SAPSII score, MAP, lactate, creatinine, hemoglobin, chloride and potassium. |
Besides the primary outcome, a worse secondary outcome also presented in the high CVP group. This group had a higher rate of vasopressors use, renal replacement therapy and the patients had longer periods of stay in the ICU as well as in the hospital (Table 1).
Discussion
The results of our study indicate that the minimum CVP levels during first 72 hours after ICU admission is an independent predictor of mortality in critically ill patients with AKI when using CVP both as a categorical and a continuous variable. Further investigations on the use of vasopressors, mechanical ventilation, renal replacement therapy and length of ICU stay and hospitalization also demonstrated that higher CVP level was associated with poor ICU outcomes for critically ill patients with AKI. To our knowledge, our study is the first to find that CVP was independently associated with poor prognosis in critically ill patients with AKI and the first to report that, per 1 mmHg increase in CVP increases the odds of mortality. Dynamic monitoring of CVP during the first 72h after ICU admission and being aware of the minimum CVP level appear to be important parameters for assessing the prognosis of patients.
CVP is a measurement of the pressure within the superior vena cava or right atrium. In 1959, CVP was first found to be related to the decrease of blood volume after thoracotomy.18 Subsequently, it was regarded as an index to evaluate the cardiac preload and it was used to guide fluid therapy.19 However, with more extensive clinical applications and in-depth clinical research, CVP was found to be influenced by many factors and had a poor value in predicting volume status and fluid responsiveness.20–22 Using CVP as a predictor of blood volume or fluid responsiveness was not only false but was also potentially dangerous. According to Guyton’s venous reflux theory, cardiac output equals venous reflux, which depends on the pressure gradient between the mean systematic filling pressure (MSFP) and CVP. Therefore, CVP is the main reverse pressure hindering venous return.23 In addition, the microcirculatory perfusion depends on the pressure gradient between the inflow and outflow pressures and CVP is an important determinant of the latter. An abnormal increase of CVP can further aggravate the capillary perfusion disorder, thus leading to AKI and other serious consequences.24
Previous studies on patients with sepsis, cardiac surgery and those who were critically ill showed that increased CVP can not only increase the occurrence of AKI but may also lead to liver, lung and microcirculation damage and eventually increases mortality.17,25–27 This study shows the highest mortality in patients who had high CVP (CVP≥10mmHg). The mean CVP of the patients in this group was at least 10 mmHg, and the duration for observations was a minimum of 3 days. This suggested that a longer duration of high CVP was related to the poor prognosis which is consistent with the findings of a previous study.17 Considering the influence of CVP on venous return and capillary perfusion, lower CVP levels may be associated with better tissue perfusion, fluid responsiveness and outcome for the patients. A systematic analysis found that about two-thirds of the patients in a lower CVP subgroup (mean/median<8 mmHg) responded to fluid therapy, while the opposite (1/3) was observed in those in a higher CVP subgroup (mean/median>12 mmHg), although the individual CVP values for predicting fluid responsiveness were relatively low.28
Recent studies indicated that normal CVP values are usually very low and close to 0.10,29,30 Wang et al also found that septic shock patients whose CVP had dropped to below 8 mmHg during a 7-day period, had a higher survival rate.26 Chen et al suggested that the optimal CVP measurements should be personalized and kept as low as possible.31 However, it is not clear how low the CVP needs to be in critically ill patients with AKI. The results of the present research demonstrated that per 1 mmHg increase in lowest the CVP value during the first 72 hours after ICU admission increased the odds of all-cause mortality during a 90-day period by 3.1%. This indicated that a lower CVP was associated with better outcome in critically ill patients with AKI. This finding is consistent with the previous study.
The results of subgroup analysis showed that CVP had no significant effect on mortality in critically ill patients complicated with AKI stage 1. Considering that ICU patients with AKI stage 1 had milder kidney disease with more urine output and are easier to achieve fluid balance, this may attenuate the effect of CVP on mortality and do not present significant difference to patients without AKI. Otherwise, a small number of the patients in the middle and high CVP groups with AKI stage 1 may also affect the observed results. Further studies involving more patients are essential to confirm these findings.
Several limitations in this study should be acknowledged. Firstly, our study is a single-center retrospective analysis and our results must be confirmed in a prospective and multicenter cohort. Secondly, only patients diagnosed with AKI within 48 hours and having CVP measurements taken during the first 72 hours after ICU admission were included, which may have therefore reduced the number of patients and led to a form of selection bias. Furthermore, because most of the patients registered in the database, were lacking of pre-admission SCr measurements, we used the admission SCr as the reference values for creatinine, which this may also have resulted in selection bias.32 Thirdly, the present study is a retrospective study based on the database, differences for patients with pre-, post- and renal AKI could not be evaluated, which should be supplemented in a future prospective. Fourthly, including some risk factors which might increase morbidity and mortality among patients with AKI such as malignancy and sepsis and performing adjusted analysis to confirm the relationship between CVP during the first 72 h after ICU admission and poor outcomes were advantageous to our study.33 However, it may be that some other confounding risk factors correlated with organ damage or adverse outcomes, which would have affected our results, were not included in the present study. Finally, as this was not an interventional study, further studies should be performed to find out the range at which CVP should be controlled to, in order to improve the prognosis of ICU patients with AKI.
Conclusion
In this study, we showed a positive correlation between the minimum CVP measurement obtained during the first 72 hours after ICU admission and 90-day all-cause mortality. CVP proved to be an independent predictor of short-term mortality for critically ill patients with AKI, and this effect was even more marked in severe AKI patients.
Acknowledgments
This study was supported by the Nature and Science Foundation of China (No. 82060022), the Scientific Research and Technological Development Program of Guangxi (No. GuiKeGong 1598011-6) and the Open Project of Guangxi Key Laboratory of Precision Medicine in Cardio-cerebrovascular Diseases Control and Prevention (GXXNXG202103). The authors are grateful to Dr Dev Sooranna of Imperial College London for English language edits of the manuscript.
Disclosure
The authors report no conflicts of interest in this work.
References
1. White LE, Hassoun HT, Bihorac A, et al. Acute kidney injury is surprisingly common and a powerful predictor of mortality in surgical sepsis. J Trauma Acute Care Surg. 2013;75(3):432–438. doi:10.1097/TA.0b013e31829de6cd
2. Hoste EAJ, Bagshaw SM, Bellomo R, et al. Epidemiology of acute kidney injury in critically ill patients: the multinational AKI-EPI study. Intensive Care Med. 2015;41(8):1411–1423. doi:10.1007/s00134-015-3934-7
3. Hofhuis JGM, van Stel HF, Schrijvers AJ, et al. The effect of acute kidney injury on long-term health-related quality of life: a prospective follow-up study. Crit Care (London, England). 2013;17(1):R17. doi:10.1186/cc12491
4. Chertow GM, Burdick E, Honour M, et al. Acute kidney injury, mortality, length of stay, and costs in hospitalized patients. J Am Soc Nephrol. 2005;16(11):3365–3370. doi:10.1681/ASN.2004090740
5. Gupta S, Coca SG, Chan L, et al. AKI treated with renal replacement therapy in critically ill patients with COVID-19. J Am Soc Nephrol. 2021;32(1):161–176. doi:10.1681/ASN.2020060897
6. Coca SG, Singanamala S, Parikh CR. Chronic kidney disease after acute kidney injury: a systematic review and meta-analysis. Kidney Int. 2012;81(5):442–448. doi:10.1038/ki.2011.379
7. Zuk A, Bonventre JV. Acute kidney injury. Annu Rev Med. 2016;67:293–307. doi:10.1146/annurev-med-050214-013407
8. Zhang WR, Parikh CR. Biomarkers of acute and chronic kidney disease. Annu Rev Physiol. 2019;81:309–333. doi:10.1146/annurev-physiol-020518-114605
9. Kellum JA, Prowle JR. Paradigms of acute kidney injury in the intensive care setting. Nat Rev Nephrol. 2018;14(4):217–230. doi:10.1038/nrneph.2017.184
10. Chen CY, Zhou Y, Wang P, et al. Elevated central venous pressure is associated with increased mortality and acute kidney injury in critically ill patients: a meta-analysis. Crit Care. 2020;24(1):80. doi:10.1186/s13054-020-2770-5
11. Johnson AEW, Pollard TJ, Shen L, et al. MIMIC-III, a freely accessible critical care database. Sci Data. 2016;3:1. doi:10.1038/sdata.2016.35
12. Kellum JA, Lameire N. Diagnosis, evaluation, and management of acute kidney injury: a KDIGO summary (Part 1). Crit Care (London, England). 2013;17(1):204. doi:10.1186/cc11454
13. Lin K, Hu Y, Kong G, et al. Predicting in-hospital mortality of patients with acute kidney injury in the ICU using random forest model. Int J Med Inform. 2019;125:55–61. doi:10.1016/j.ijmedinf.2019.02.002
14. Shankar-Hari M, Phillips GS, Levy ML, et al. Developing a new definition and assessing new clinical criteria for septic shock: for the third international consensus definitions for sepsis and septic shock (Sepsis-3). JAMA. 2016;315(8):775–787. doi:10.1001/jama.2016.0289
15. Chen XK, et al. [Effects of central venous pressure on acute kidney injury in septic shock]. Zhonghua Yi Xue Za Zhi. 2011;91(19):1323–1327. Chinese.
16. Magder S, Bafaqeeh F. The clinical role of central venous pressure measurements. J Intensive Care Med. 2007;22(1):44–51. doi:10.1177/0885066606295303
17. Li DK, Wang XT, Liu DW. Association between elevated central venous pressure and outcomes in critically ill patients. Ann Intensive Care. 2017;7(1):83. doi:10.1186/s13613-017-0306-1
18. Hughes RE, Magovern GJ. The relationship between right atrial pressure and blood volume. AMA Arch Surg. 1959;79(2):238–243. doi:10.1001/archsurg.1959.04320080074009
19. De Backer D, Vincent JL. Should we measure the central venous pressure to guide fluid management? Ten answers to 10 questions. Crit Care. 2018;22(1):43. doi:10.1186/s13054-018-1959-3
20. Marik PE, Baram M, Vahid B. Does central venous pressure predict fluid responsiveness? A systematic review of the literature and the tale of seven mares. Chest. 2008;134(1):172–178. doi:10.1378/chest.07-2331
21. Gelman S. Venous function and central venous pressure: a physiologic story. Anesthesiology. 2008;108(4):735–748. doi:10.1097/ALN.0b013e3181672607
22. Wang X, Chen H, Liu D, et al. The correlation between CVP-derived parameters and the prognosis of critically ill patients. J Crit Care. 2017;40:257–264. doi:10.1016/j.jcrc.2017.03.011
23. Magder S. Bench-to-bedside review: an approach to hemodynamic monitoring–Guyton at the bedside. Crit Care. 2012;16(5):236. doi:10.1186/cc11395
24. Morelli A, De Backer D. The ten principles behind arterial pressure. Intensive Care Med. 2018;44(6):911–914. doi:10.1007/s00134-017-4888-8
25. Beaubien-Souligny W, Benkreira A, Robillard P, et al. Alterations in portal vein flow and intrarenal venous flow are associated with acute kidney injury after cardiac surgery: a prospective observational cohort study. J Am Heart Assoc. 2018;7(19):e009961. doi:10.1161/JAHA.118.009961
26. Wang X, Yao B, Liu D-W, et al. Central venous pressure dropped early is associated with organ function and prognosis in septic shock patients. Shock. 2015;44(5):426–430. doi:10.1097/SHK.0000000000000445
27. Chen KP, Cavender S, Lee J, et al. Peripheral edema, central venous pressure, and risk of AKI in critical illness. Clin J Am Soc Nephrol. 2016;11(4):602–608. doi:10.2215/CJN.08080715
28. Eskesen TG, Wetterslev M, Perner A. Systematic review including re-analyses of 1148 individual data sets of central venous pressure as a predictor of fluid responsiveness. Intensive Care Med. 2016;42(3):324–332. doi:10.1007/s00134-015-4168-4
29. Pinsky MR, Kellum JA, Bellomo R. Central venous pressure is a stopping rule, not a target of fluid resuscitation. Crit Care Resusc. 2014;16(4):245–246.
30. Pinsky MR. Functional hemodynamic monitoring. Crit Care Clin. 2015;31(1):89–111. doi:10.1016/j.ccc.2014.08.005
31. Chen X, Wang X, Honore PM, et al. Renal failure in critically ill patients, beware of applying (central venous) pressure on the kidney. Ann Intensive Care. 2018;8(1):91. doi:10.1186/s13613-018-0439-x
32. Pickup L, Loutradis C, Law JP, et al. The effect of admission and pre-admission serum creatinine as baseline to assess incidence and outcomes of acute kidney injury in acute medical admissions. Nephrol Dial Transplant. 2021. doi:10.1093/ndt/gfaa333
33. Zarjou A, Agarwal A. Sepsis and acute kidney injury. J Am Soc Nephrol. 2011;22(6):999–1006. doi:10.1681/ASN.2010050484
 © 2021 The Author(s). This work is published and licensed by Dove Medical Press Limited. The
full terms of this license are available at https://www.dovepress.com/terms
and incorporate the Creative Commons Attribution
- Non Commercial (unported, 3.0) License.
By accessing the work you hereby accept the Terms. Non-commercial uses of the work are permitted
without any further permission from Dove Medical Press Limited, provided the work is properly
attributed. For permission for commercial use of this work, please see paragraphs 4.2 and 5 of our Terms.
© 2021 The Author(s). This work is published and licensed by Dove Medical Press Limited. The
full terms of this license are available at https://www.dovepress.com/terms
and incorporate the Creative Commons Attribution
- Non Commercial (unported, 3.0) License.
By accessing the work you hereby accept the Terms. Non-commercial uses of the work are permitted
without any further permission from Dove Medical Press Limited, provided the work is properly
attributed. For permission for commercial use of this work, please see paragraphs 4.2 and 5 of our Terms.