Back to Journals » Nature and Science of Sleep » Volume 15
Association Between Sleep Duration and Stroke in Different Status of Metabolic Syndrome: A Cross-Sectional Study in Shanghai Adult Residents
Authors Wu H, Zheng Y, Liu DN, Liu XX, Yang QD, Su QY, Wang YQ, Wang YZ, La XN, Shi Y, Fu C
Received 15 February 2023
Accepted for publication 9 July 2023
Published 9 August 2023 Volume 2023:15 Pages 639—652
DOI https://doi.org/10.2147/NSS.S408669
Checked for plagiarism Yes
Review by Single anonymous peer review
Peer reviewer comments 2
Editor who approved publication: Prof. Dr. Ahmed BaHammam
Han Wu,* Yang Zheng,* Dan-Ni Liu, Xiao-Xia Liu, Qun-Di Yang, Qiu-Yun Su, Ying-Quan Wang, Yu-Zhuo Wang, Xue-Na La, Yan Shi,* Chen Fu*
Division of Noncommunicable Diseases and Injury, Shanghai Municipal Center for Disease Control and Prevention, Shanghai, People’s Republic of China
*These authors contributed equally to this work
Correspondence: Yan Shi; Chen Fu, Tel +86-21-62758710, Email [email protected]; [email protected]
Purpose: This study aimed to investigate the relationship between sleep duration (SD) and stroke, and examine the effects of SD on stroke with or without metabolic syndrome (Mets) and its components among the adult residents in Shanghai, China.
Participants and Methods: A total of 20,245 participants (51.72% male, mean age 44.66 years) were included from Shanghai Chronic Disease and Risk Factors Surveillance (SCDRFS) in 2017. The weighted logistic regressions were performed to examine the associations between SD and stroke in different status of Mets and its components.
Results: The mean SD was 7.51± 0.03 h/d. After adjusting for all the potential factors, SD< 6 h/d (OR=1.73, 95% CI: 1.35– 2.20) or ≥ 10 h/d (OR=1.66, 95% CI: 1.08– 2.57) was significantly positively associated with stoke in the total participants; moreover, in the non-Mets group, only SD< 6 h/d (OR=1.77, 95% CI: 1.19, 2.64) significantly increased the risk of stroke; while, in the Mets group, SD< 6 h/d (OR=1.80, 95% CI:1.17– 2.76) and ≥ 10 h/d (OR=1.97, 95% CI: 1.00– 3.88) both had a positive significantly association with stoke. In addition, the effects of SD< 6 h/d on stroke were more pronounced among those with high WC (OR=2.24, 95% CI: 1.40– 3.58) and high TG (OR=2.60, 95% CI: 1.86– 3.62), and the effects of SD≥ 10 h/d on stroke were more evident among those with high TG (OR=2.28, 95% CI: 1.02– 5.08) and high FBG (OR=2.58, 95% CI: 1.30– 5.10).
Conclusion: Both short and long SD were significantly positively associated with stroke in the total participants, and the associations were stronger in the Mets group; conversely, in the non-Mets group, only short SD was significantly positively associated with stroke, and no significant association was observed between long SD and stroke. Therefore, more precise sleep measures may be needed to prevent stroke according to the different status of Mets.
Keywords: sleep duration, metabolic syndrome, stroke, Shanghai
Introduction
Stroke is defined as a neurological deficit attributed to an acute focal injury of the central nervous system (CNS) by a vascular cause,1 and is characterized by rapid onset, high mortality, and high recurrence rate. Currently, stroke has been a major public health concern due to its health, economic and social burden in China. Global Burden of Disease (GBD) 2019 reported that there were 3.94 million new stroke cases, 28.76 million current stroke cases, 2.19 million deaths and 45.95 million disability-adjusted life-years (DALYs) caused by stroke in China.2 The growing evidence suggests that the occurrence and development of stroke are closely related with multifactorial origin rather than the traditional single risk factor, such as obesity, hypertension, diabetes mellitus, hyperlipidemia, smoking, alcohol drinking, and so on,3–5 of which sleep is also an important factor that cannot be ignored and attracts ever-growing attention among researches or policy makers in recent years.
Sleep, a basic physiological need of human, occupies nearly one-third of our life and plays a vital role on health maintenance. However, the sleep duration (SD) status is poor among Chinese, and thus may need to be improved.6 In recent years, with the rapid development of internet technology and electronic devices, SD has decreased as time went by among Chinese; moreover, both insufficient SD and excessive SD coexist in those population. According to the data from China Health and Nutrition Survey (CHNS), the average SD of the subjects (mean age, 46.72 years) decreased from 8.24 h/d in 2004 to 7.81 h/d in 2015; and the participants with SD <6 h/d and ≥8 h/d accounted for 12.8% and 20.0%, respectively.7
The association between SD and stroke was analyzed in the previous studies, while the results remain inconsistent.4,8–11 Some studies reported a J-shaped,4,10,12,13 whereas other results showed a U-shaped5,8,9 or null11 relationship between SD and stroke. The inconsistency may be explained by the metabolic disorders, for instance obesity, hypertension, diabetes mellitus, hyperlipidemia, and metabolic syndrome (Mets).4,14–17 Mets is characterized by a cluster of risk factors composed of raised blood pressure (BP), raised triglycerides (TG), lowered high-density lipoprotein cholesterol (HDL-C), raised fasting glucose (FBG), and central obesity for cardiovascular disease and type 2 diabetes mellitus,18 which can reflect the overall metabolic levels of body. Some insights indicated that SD had a different association with stroke among those with or without Mets and its components, but the results were also inconsistent4,17,19; thus, the associations between SD and stoke with different status of Mets and its components remain to be elucidated. However, to date, the above related studies are scare, especially in Shanghai adult residents, which is a super city with highly developed economics and a fast-paced life in China.
Therefore, we aimed to study the association between SD and stroke in a cross-sectional study of 20,245 Shanghai residents aged 18 years and above. Furthermore, we further investigated the effects of SD on stroke in different status of Mets, as well as its components.
Methods
Data Source
The present study used data from the Shanghai Chronic Disease and Risk Factors Surveillance (SCDRFS) programme in 2017. According to the World Health Organization (WHO) STEPS Instrument20 and China Chronic Disease and Risk Factors Surveillance (CCDRFS) programme design,21 the SCDRFS was designed and organized by the Shanghai Municipal Center for Disease Control and Prevention (SCDC) to investigate the epidemic status and main risk factors of chronic non-communicable diseases (NCDs) in Shanghai ordinarily adult residents. So far, four filed surveys have been carried out in 2007, 2010, 2013, and 2017, respectively. For the SCDRFS-2017 in the present study, the adopted multistage stratified random sampling method is shown in Figure 1. The SCDRFS-2017 combined the questionnaire survey, physical examinations, and laboratory tests. The questionnaire survey incorporated the basic characteristics, and the NCDs’ prevalent states and main risk factors by the face-to-face interview. Physical examinations included the measurements of the height, weight, waist circumference (WC), and BP. The laboratory tests measured FBG and blood lipid. Overall, 23,346 adults were invited, of whom 20,616 completed the survey with an average response rate of 88.31%. After excluding those participants with missing data, a total of 20,245 adults were included in the study's final analysis. All the data were collected by the trained investigators from community health service centers. All the participants signed the consent forms after they were informed of the purpose and demands of the survey. The survey protocol was approved by the ethics committee of the SCDC (No. 2016–10).
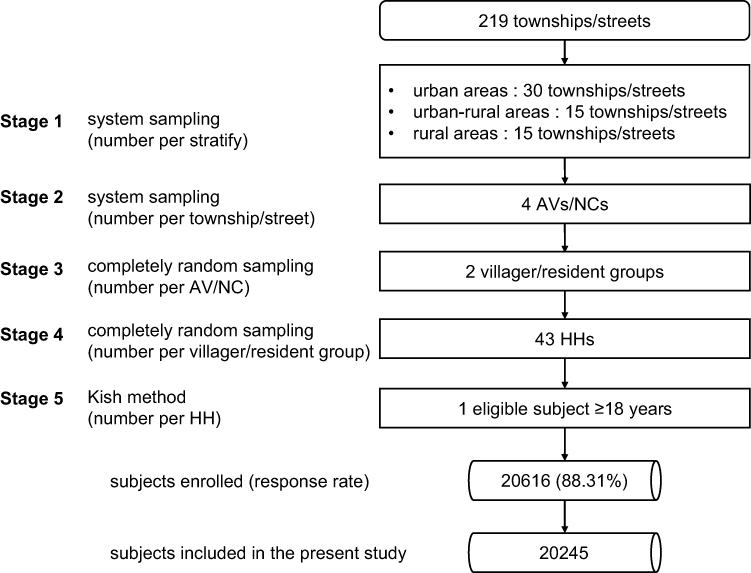 |
Figure 1 Sampling frame of the Shanghai Chronic Disease and Risk Factor Surveillance in 2017. Urban areas: the population with non-agricultural household registration accounted for >70% and the permanent urban agricultural migrant population accounted for ≤35%; urban–rural areas: the population with non-agricultural household registration accounted for >70% and the permanent urban agricultural migrant population accounted for >35%; rural areas: the population with non-agricultural household registration accounted for ≤70%. Abbreviations: AV, administrative village; NC, neighborhood committees; HH, household. |
Definition of SD, Mets, and Stroke
The data of SD and stroke were collected by the participants’ self-report. The SD was calculated according to the question: “How much do you sleep usually in a day?”, and the SD was divided into five groups: <6, 6–7.9, 8–8.9, 9–9.9, ≥10 h/d. The stroke was defined by this question: “Have you ever been diagnosed with stroke by the doctors from the township health centers/community health service centers or above medical institutions?”, the participants could answer “Yes” (the stroke group) or “No” (the non-stroke group). Mets was determined as the presence of at least three of the five components according to the modified criteria for Chinese people jointly proposed by the International Diabetes Federation (IDF), National Heart, Lung, and Blood Institute (NHLBI), and the other institutions in 2009.18 The criteria are as follows: (1) Elevated WC: males ≥85 cm; females ≥80 cm; (2) Elevated TG (drug treatment for elevated TG is an alternate indicator): ≥1.7 mmol/L; (3) Reduced HDL-C (drug treatment for reduced HDL-C is an alternate indicator): males <1.0mmol/L; females <1.3 mmol/L; (4) Elevated BP (antihypertensive drug treatment in a patient with a history of hypertension is an alternate indicator): systolic ≥130 and/or diastolic ≥85 mmHg; (5) Elevated FBG (drug treatment of elevated glucose is an alternate indicator): ≥100 mg/dL.18 The participants were categorized into the non-Mets group (<3) and Mets group (≥3) according to the number of the Mets components.
Covariates Assessment
For the present study, the covariates of interest included sociodemographic, behavioral, and health characteristics. The sociodemographic characteristics used in the present study were gender (male, female), age group (18–44, 45–59, 60–74, ≥75), education (primary school and lower, junior and senior middle, college middle school and higher), occupation (employment and unemployment), and marriage (living alone: never married, separated, divorced, and widowed; married), and urbanization (rural, urban–rural, urban).
Of the behavioral characteristics, smoking was categorized into current smoking and current non-smoking. Alcohol status (“Yes” or “No”)/tea drinking (“Yes” or “No”) were defined by asking whether the participants drank alcohol/tea in the past year. Physical activity was determined according to the Global Physical Activity Questionnaire (GPAQ) designed by the WHO.22 Physical activity per week (MET-minute/week) was calculated based on the data of the types, intensity, frequency, and time of physical activity of the participants in the past 7 days. Participants were further divided into three activity intensity groups (low, medium, and high levels).23 Four major dietary patterns were identified by using dietary data based on the Food Frequency Questionnaire (FFQ), which we labeled the “Fruit juice & pork pattern”, “Tuber & high-protein pattern”, “Dairy & egg & fruit pattern”, and “Grain & vegetable pattern”.
The health characteristics included family history (“Yes” or “No”), total cholesterol (TC), low-density lipoprotein cholesterol (LDL-C), and body mass index (BMI). The professionals measured the participants’ body height, weight, TC, and LDL-C by using the standardized methods. BMI was calculated as body weight (kg) divided by body height squared (m2).
Statistical Analysis
The participants’ general characteristics are expressed as weighted means (standard errors) for the continuous variables and numbers (weighted%) for the categorical variables. Considering the natural structure of the population, weight calculation was conducted in the present study. The final weigh value equals the product values of the multistage sampling, non-response, and post-stratification weights; and post-stratification weight was constructed based on the data of Shanghai permanent population in 2016. Rao-Scott Chi-square tests were performed to identify the significant differences in the general characteristics, the SD distributions, and the prevalence of the Mets or its components. The weighted logistic regressions were performed to examine the associations between SD and stroke in different status of Mets and its components. All the above analyses accounted for complex sampling design consisting of stratification, clustering, and sample weights. Restricted cubic splines (RCS) were adopted to examine the shape of the dose–response association and linearity between SD and stroke risk in the multivariable logistic regression models. We kept five knots (located at 5th, 25th, 50th, 75th, and 95th) and set the median SD (7 h/d) as the reference. SAS macro program %RCS_Reg for curve fitting was developed by Desquilbet and Mariotti.24 All statistical tests were two-sided, and significantly difference was considered at p<0.05. Statistical analyses were performed using SAS 9.4 (SAS Institute, Cary, NC, USA).
Results
Participant General Characteristics
General Characteristics of the Participant Stratified by Mets/Stroke
The participants (n=20,245, mean age 44.66 years) in the study included 8214 (51.72%) males and 12,031 (48.28%) females. The proportions of the total participants aged 18–44, 45–59, 60–74, and ≥75 years were 53.56%, 25.58%, 13.47%, and 7.40%, respectively. Of the total study population, 1098 (2.38%) participants had suffered a stroke. The characteristics of age, education, occupation, family history, BMI, and dietary pattern were significantly associated with stroke. Participants who were older or retired were more likely to report stroke than not reporting. People who had lower education levels, family history, higher BMI, and a weaker tendency to follow fruit juice and pork pattern were more likely to have a stroke (Table 1).
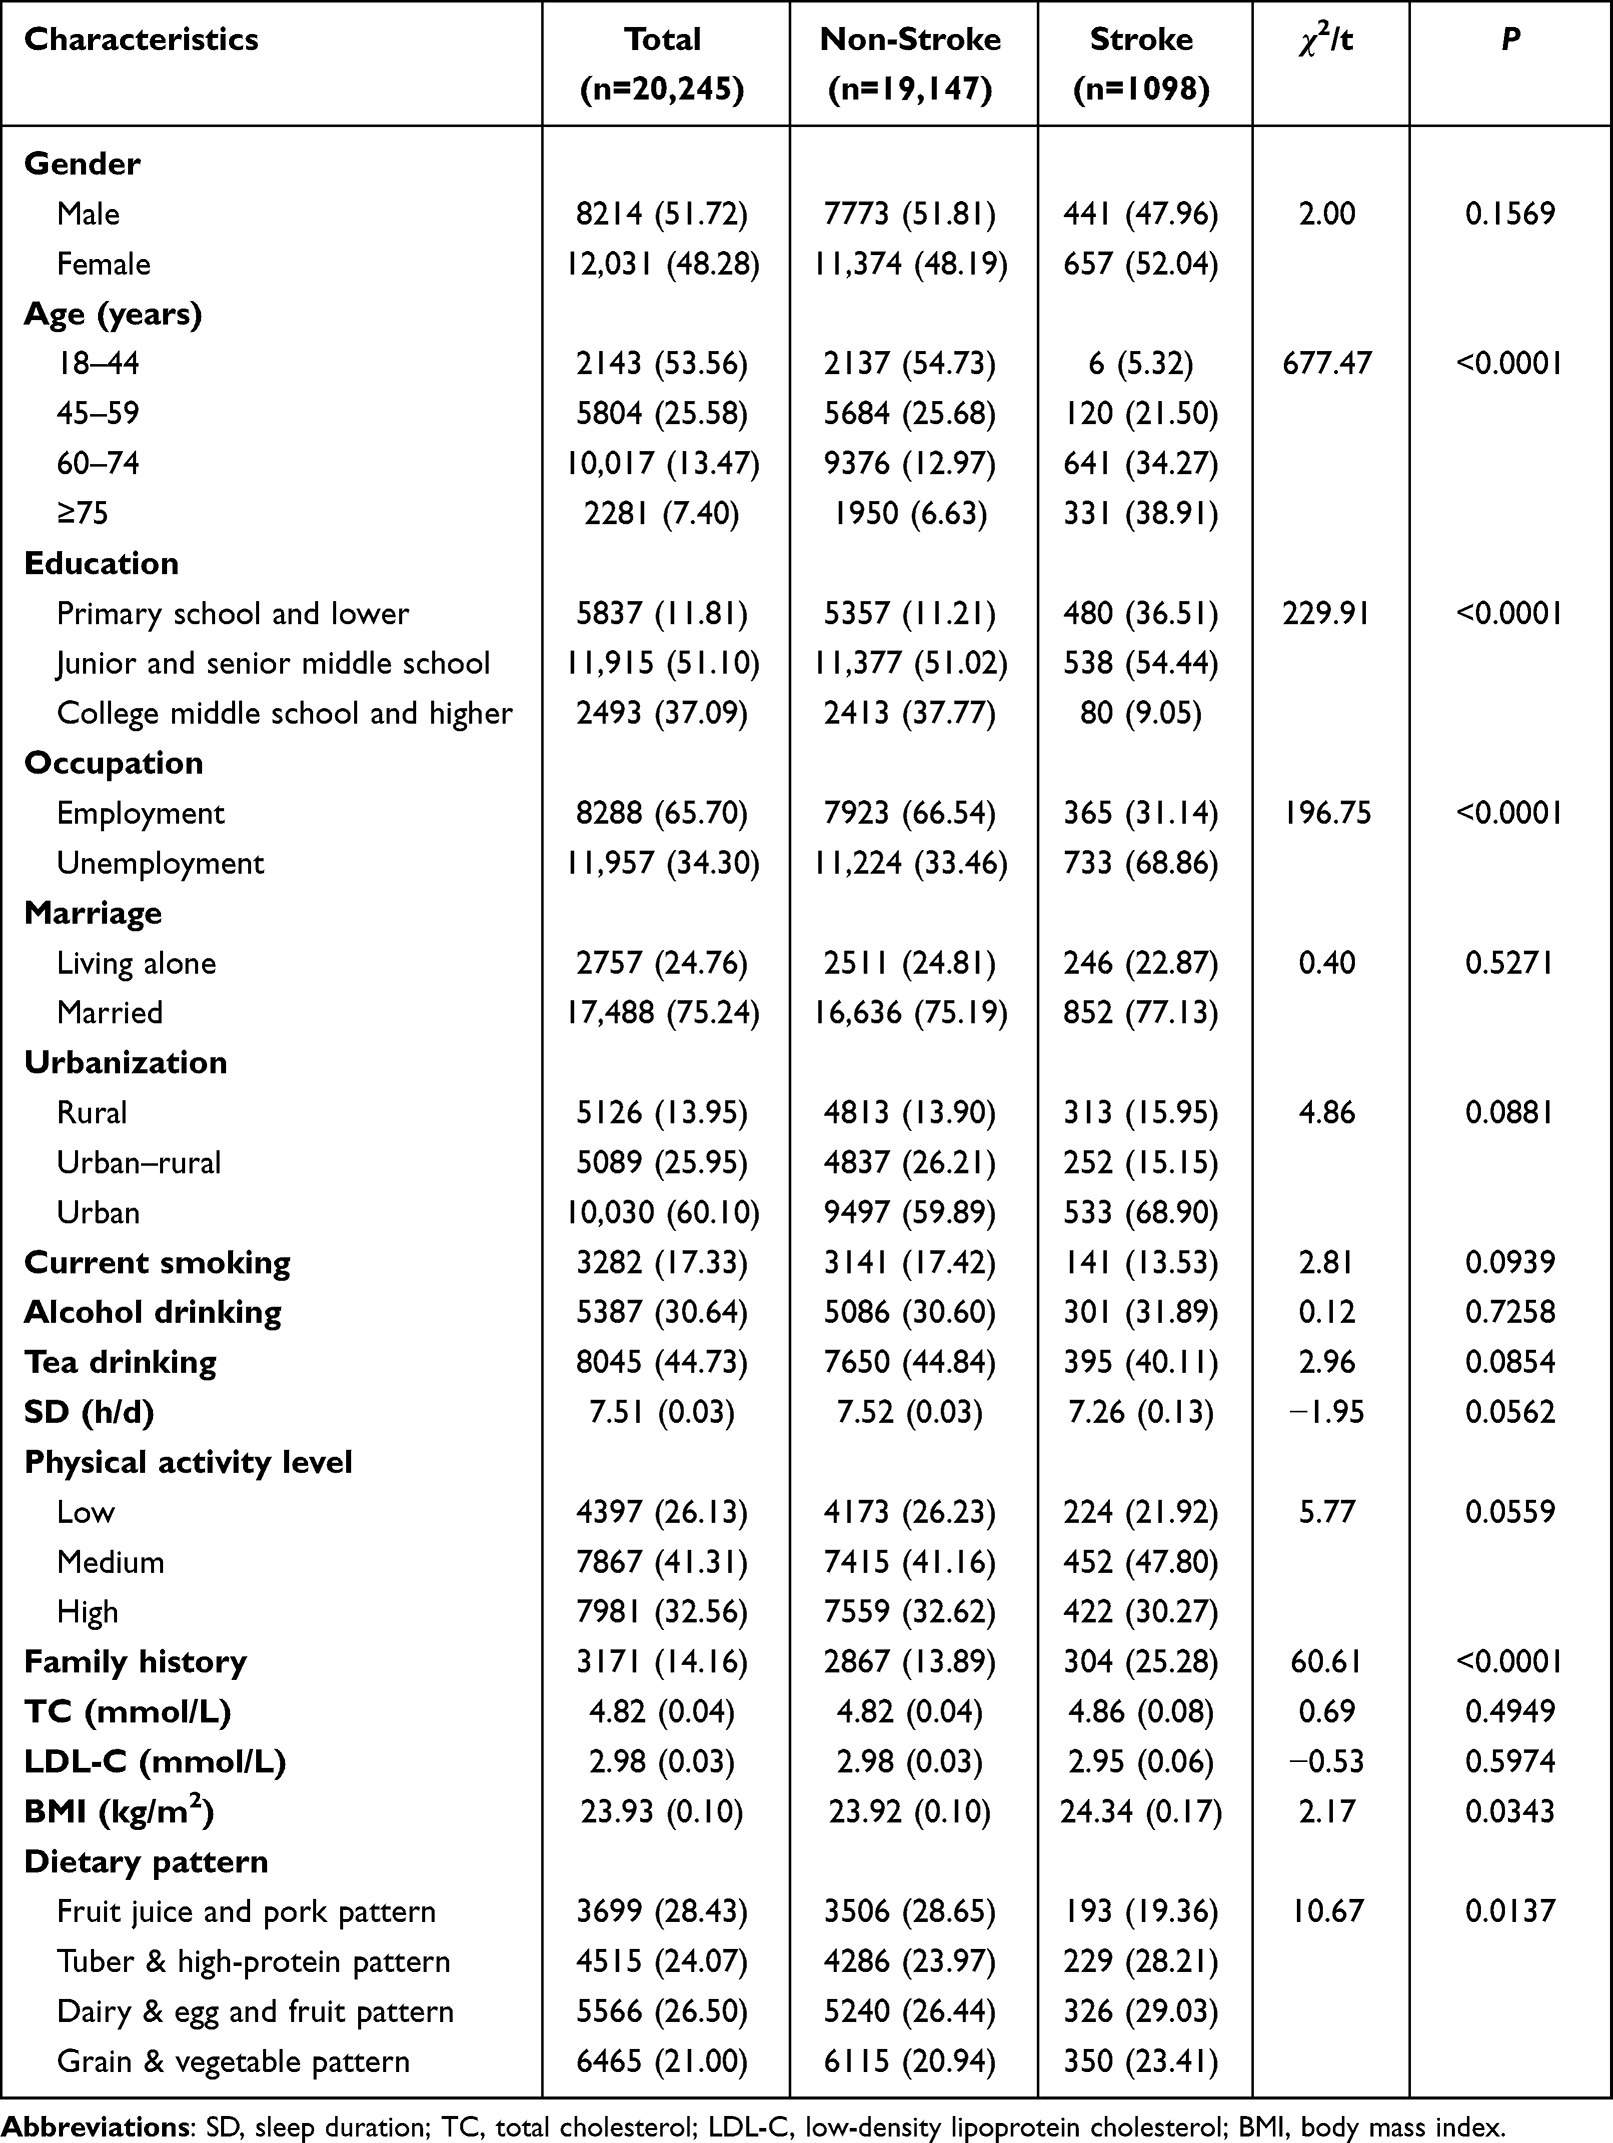 |
Table 1 General Characteristics of the Study Population Stratified by Stroke [n (Weighted %), Mean (SE)] |
General characteristics of the study population stratified by Mets and stroke are shown in Table 2. There were 11,178 (65.06%) participants without Mets and 9067 (34.94%) participants with Mets in the study, respectively. Of the participants without Mets, 420 (1.45%) had stoke, while in those with Mets, 678 (4.09%) had stroke. For those without Mets, age, education, occupation, urbanization, SD, family history, and dietary pattern showed significant associations with stroke; and for those who had Mets, gender, age, education, occupation, physical activity level, family history, and BMI were significantly associated with stroke.
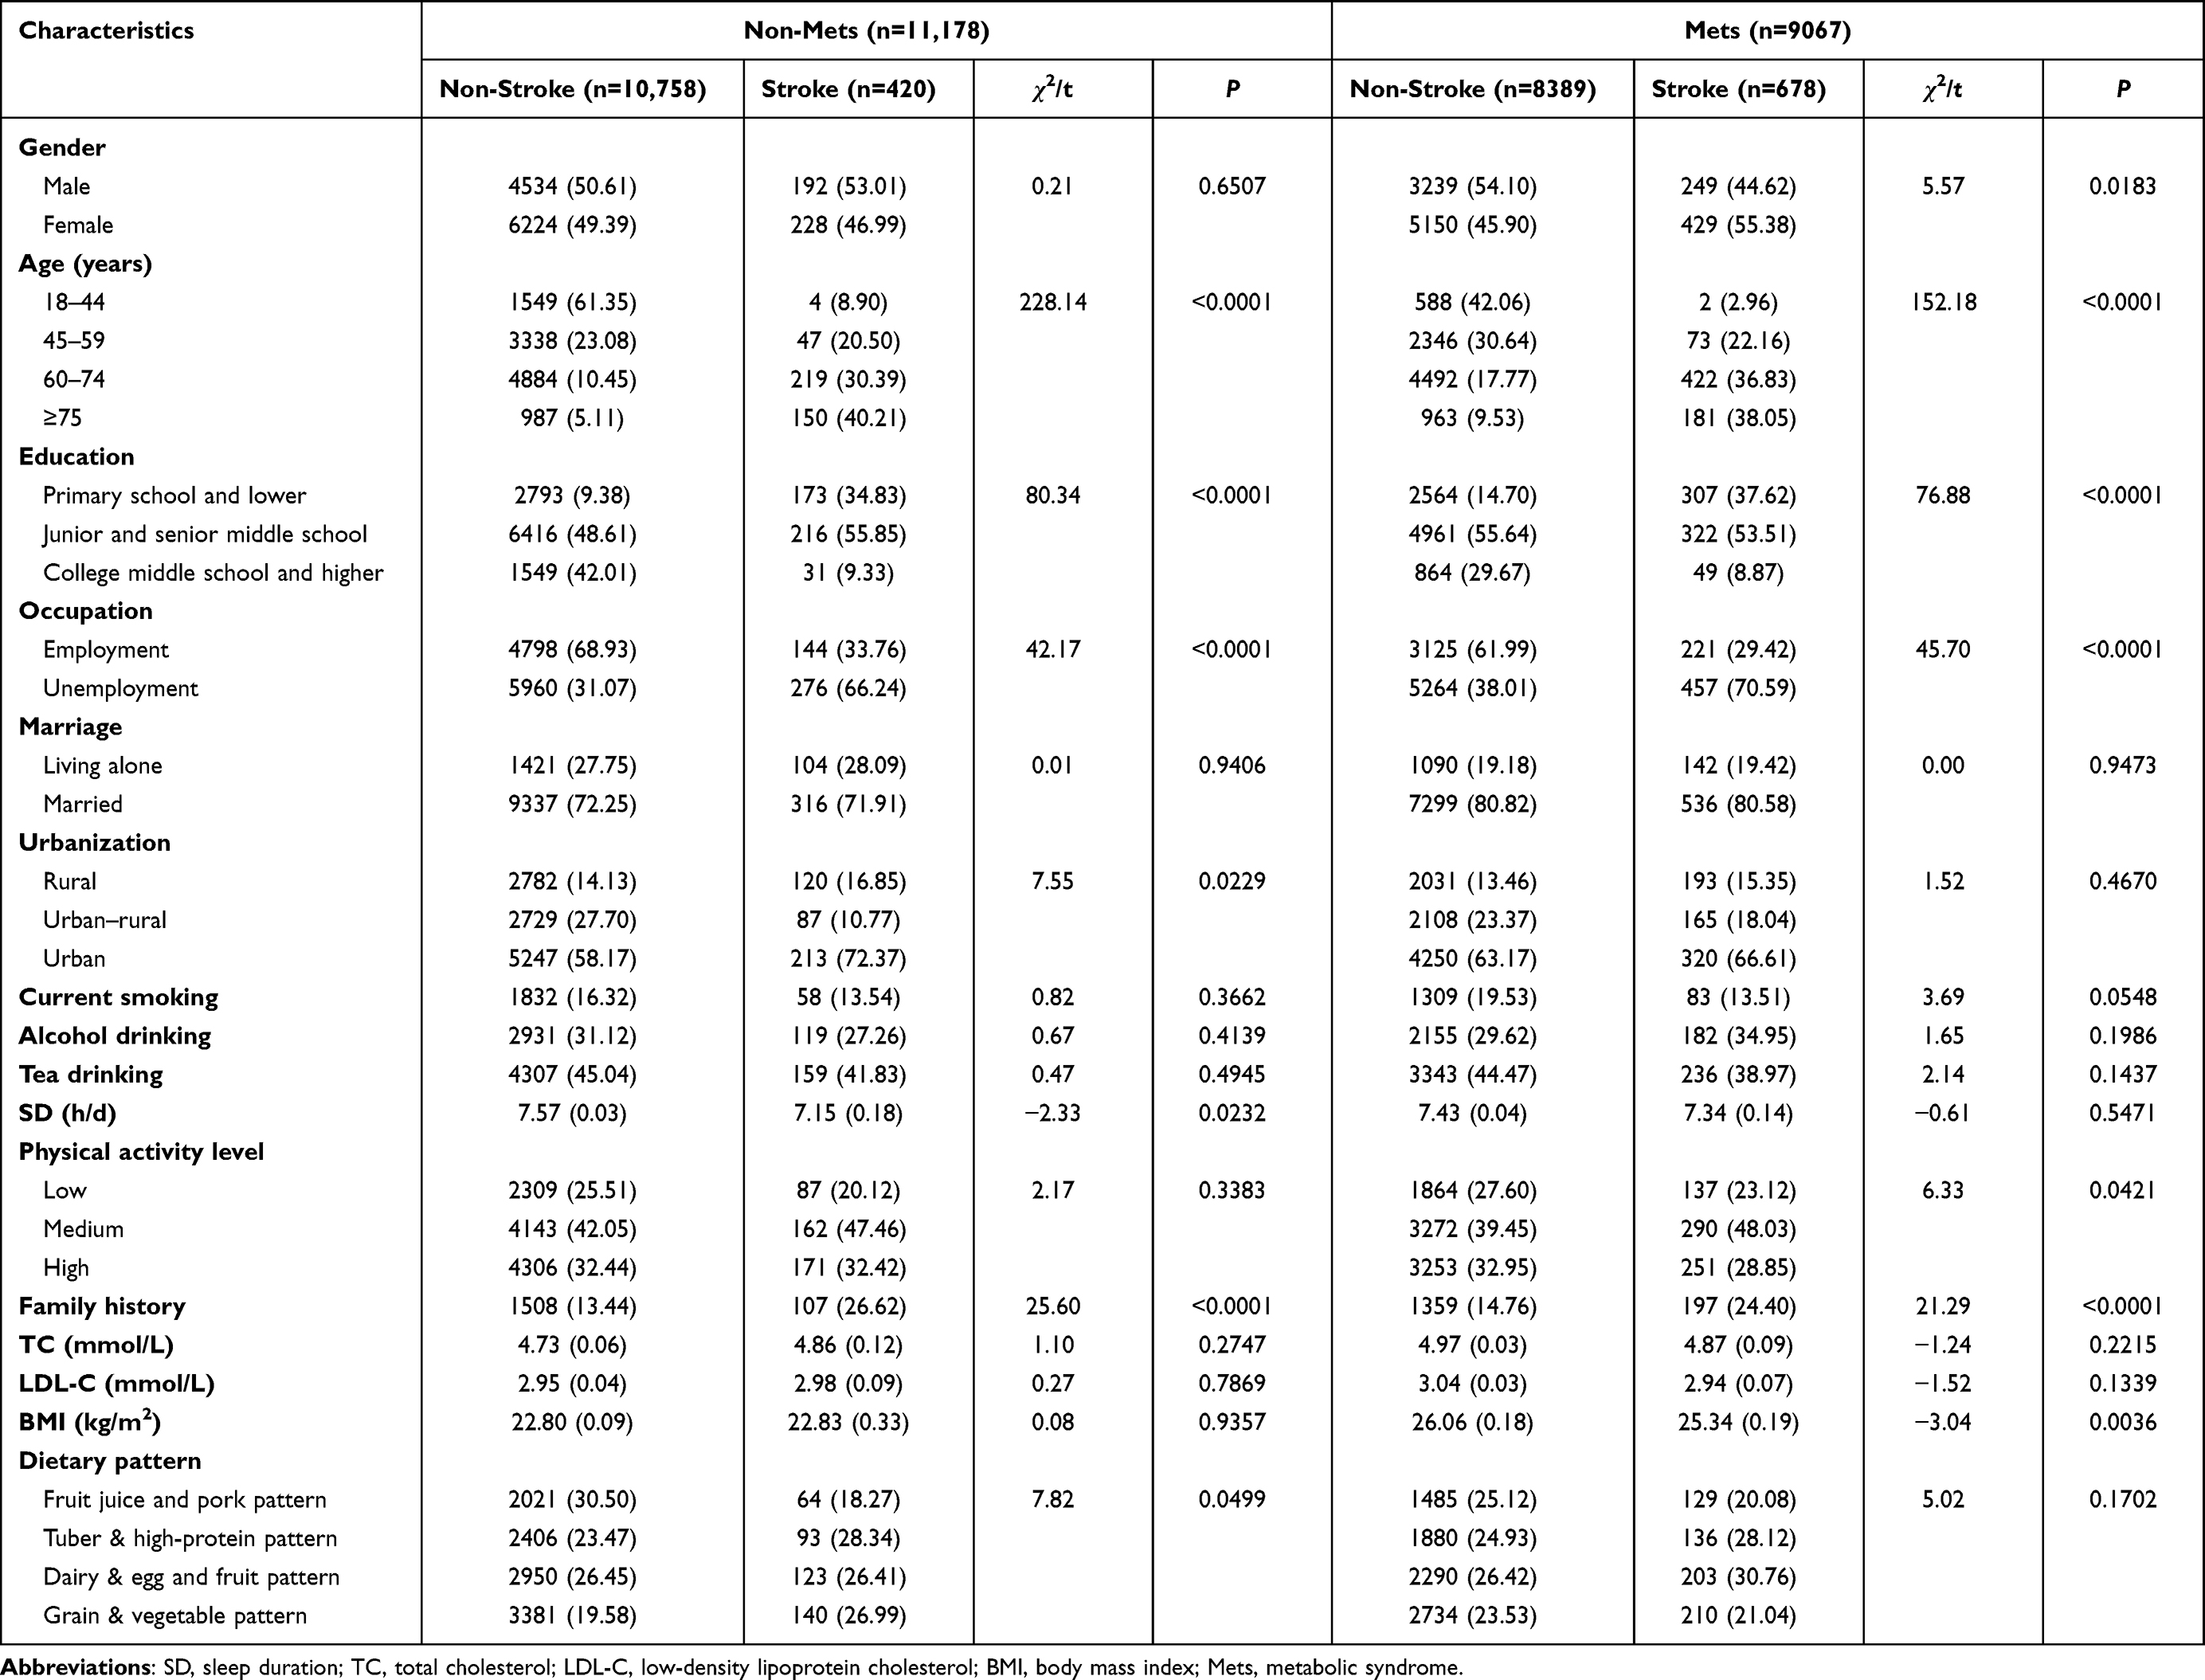 |
Table 2 General Characteristics of the Study Population Stratified by Mets and Stroke [n (Weighted %), Mean (SE)] |
The Distribution of SD
Figure 2 depicts the distribution of SD among the study population. Of the total study population, the participants with SD<6, 6–7.9, 8–8.9, 9–9.9, and >10 h/d accounted for 4.96%, 41.83%, 40.40%, 6.97%, and 5.83%, respectively. Compared with the non-stroke group, those with stroke were more likely to sleep less or more. Similarly, for both non-Mets group and Mets group, the study population with stroke tended to have a shorter or longer SD.
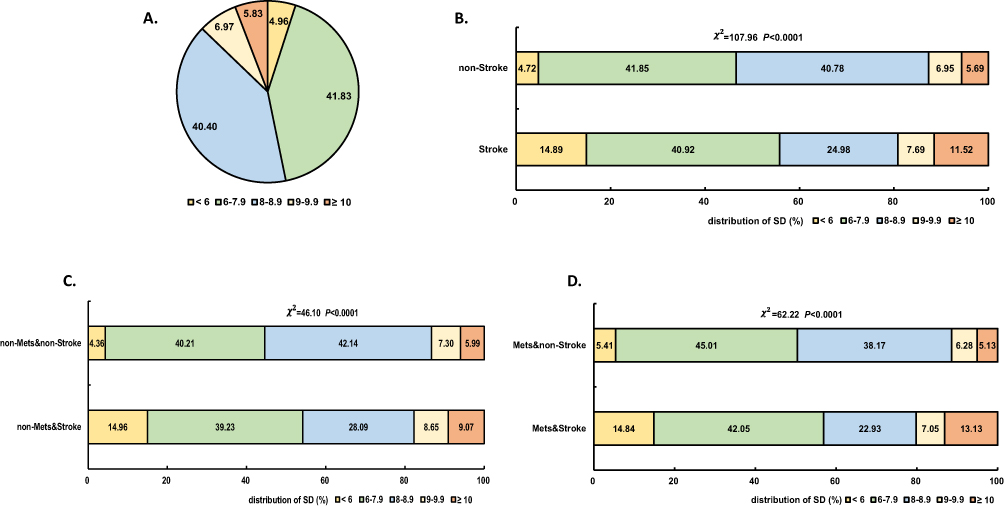 |
Figure 2 The distribution of SD among the study population; (A) for the total participants, (B) for the participants stratified by stroke, (C) for the non-Mets group stratified by stroke, (D) for the Mets group stratified by stroke. Abbreviations: SD, sleep duration; Mets, metabolic syndrome. |
The Prevalence of Mets and Its Components
The distribution of Mets and its components among the study population is illustrated in Figure 3. Of the total participants, the overall prevalence of Mets, high WC, high TG, low HDL-C, high BP, and high FBG were 34.94%, 53.99%, 35.31%, 33.70%, 45.73%, 23.66%, respectively. The stroke group presented a significantly higher prevalence of Mets (60.19% vs 34.33%), high WC (64.62% vs 53.73%), high TG (46.47% vs 35.04%), low HDL-C (43.82% vs 33.45%), high BP (85.29% vs 44.76%), and high FBG (47.52% vs 23.08%) than the non-stroke group. For both non-Mets group and Mets group, the prevalence of high BP and high FBG were significantly diverse among those categorized by stroke; whereas, there were only significant differences in the prevalence of low HDL-C among those classified by stroke in the non-Mets group.
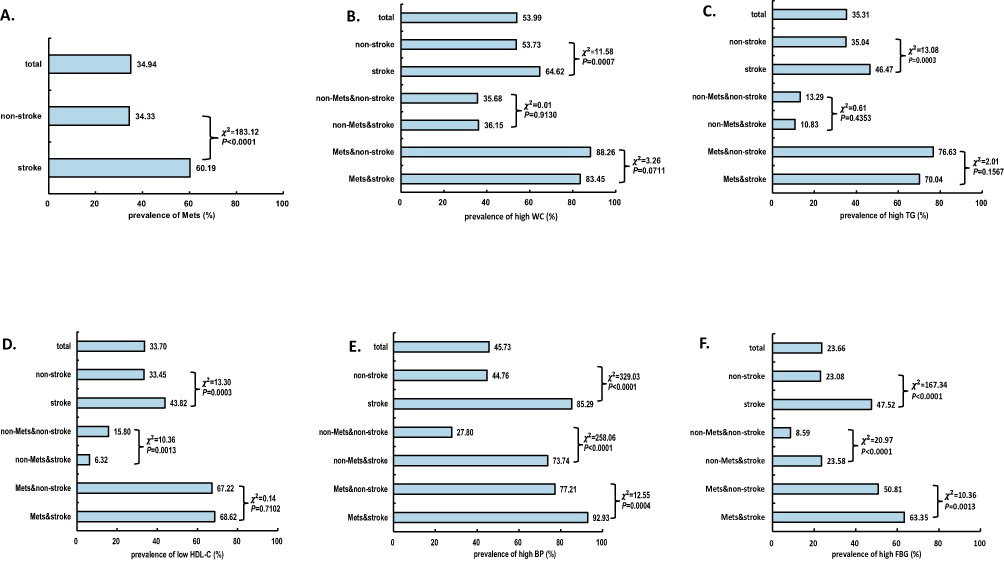 |
Figure 3 The distribution of Mets and its components among the study population. (A) Mets, (B) high WC, (C) high TG, (D) low HDL-C, (E) high BP, and (F) high FBG. Abbreviations: WC, waist circumference; TG, triglyceride; HDL-C, high-density lipoprotein cholesterol; BP, blood pressure; FBG, fasting blood glucose; Mets, metabolic syndrome. |
The Association of SD with Stroke in Mets
The association of SD with stroke in the study population is shown in Figure 4. Multivariate analyses, which controlled for all the potential factors indicated that SD<6 h/d (OR=1.73, 95% CI: 1.35–2.20) or ≥10 h/d (OR=1.66, 95% CI: 1.08–2.57), were significantly positively associated with stoke in the total study population compared to SD=6–7.9; moreover, in the non-Mets group, SD<6 h/d (OR=1.77, 95% CI:1.19–2.64) significantly increased the risk of stroke, while this relationship was not observed between SD≥10 h/d and stroke; besides, in the Mets group, SD<6 h/d (OR=1.80, 95% CI:1.17–2.76) or ≥10 h/d (OR=1.97, 95% CI:1.00–3.88) both had a positive significantly association with stoke.
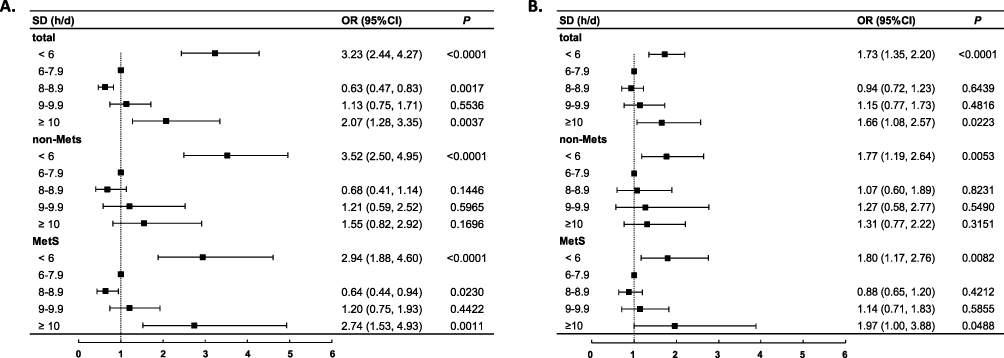 |
Figure 4 Association of SD with stroke in the study population. (A) crude model. (B) adjusted with gender, age, education, occupation, marriage, urbanization, smoking, alcohol drinking, tea drinking, physical activity level, family history, TC, LDL-C, BMI, dietary pattern. Abbreviations: SD, sleep duration; TC, total cholesterol; LDL-C, low-density lipoprotein cholesterol; BMI, body mass index; Mets, metabolic syndrome; OR, odds ratio; CI, confidence interval. |
RCS analysis showed significant association of SD with stroke in the total population, the non-Mets group, and the Mets group (P-overall association <0.0001, P-nonlinearity association <0.0001). Among the above three groups, the dose–response relationship between SD and stroke followed a U shape, indicating that when SD was relatively low, there was a significantly negative association between SD and stroke; in addition, when SD exceeded 7 h/d, the risk of stroke increased significantly (Figure 5).
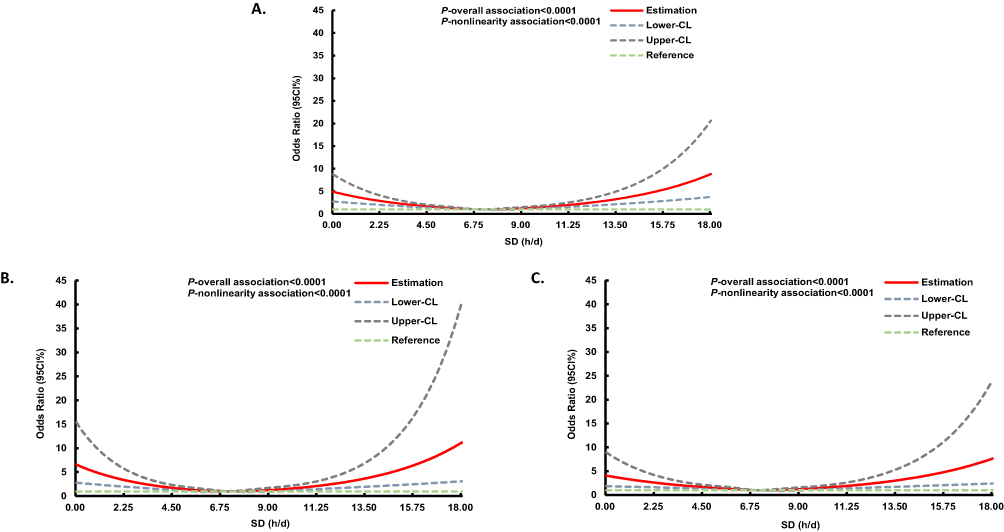 |
Figure 5 Multivariable-adjusted ORs and 95CI% for risk of stroke according to SD with 5 knot restricted cubic spline (the reference SD=7 h/d). (A) the total study population, (B) the non-Mets group, (C) the Mets group; Models were adjusted with gender, age, education, occupation, marriage, urbanization, smoking, alcohol drinking, tea drinking, physical activity level, family history, TC, LDL-C, BMI, dietary pattern. Abbreviations: SD, sleep duration; TC, total cholesterol; LDL-C, low-density lipoprotein cholesterol; BMI, body mass index; Mets, metabolic syndrome; OR, odds ratio; CI, confidence interval. |
The Association of SD with Stroke in Mets Components
Table 3 shows the associations of SD with stroke in the study population in Mets components. After adjustment for covariates, there were significantly positive correlations of SD <6 h/d with stroke in the groups of high WC (OR=2.24, 95% CI: 1.40–3.58), high TG (OR=2.60, 95% CI: 1.86–3.62), low HDL-C (OR=1.98, 95% CI: 1.23–3.19), high BP (OR=1.60, 95% CI: 1.12–2.30), and high FBG (OR=1.60, 95% CI: 1.10, 2.32); meanwhile, SD ≥10 h/d significantly increased the risk of stroke of participants with high WC (OR=1.96, 95% CI: 1.09–3.52), high TG (OR=2.28, 95% CI: 1.02–5.08), high BP (OR=1.95, 95% CI: 1.20–3.17), and high FBG (OR=2.58, 95% CI: 1.30–5.10).
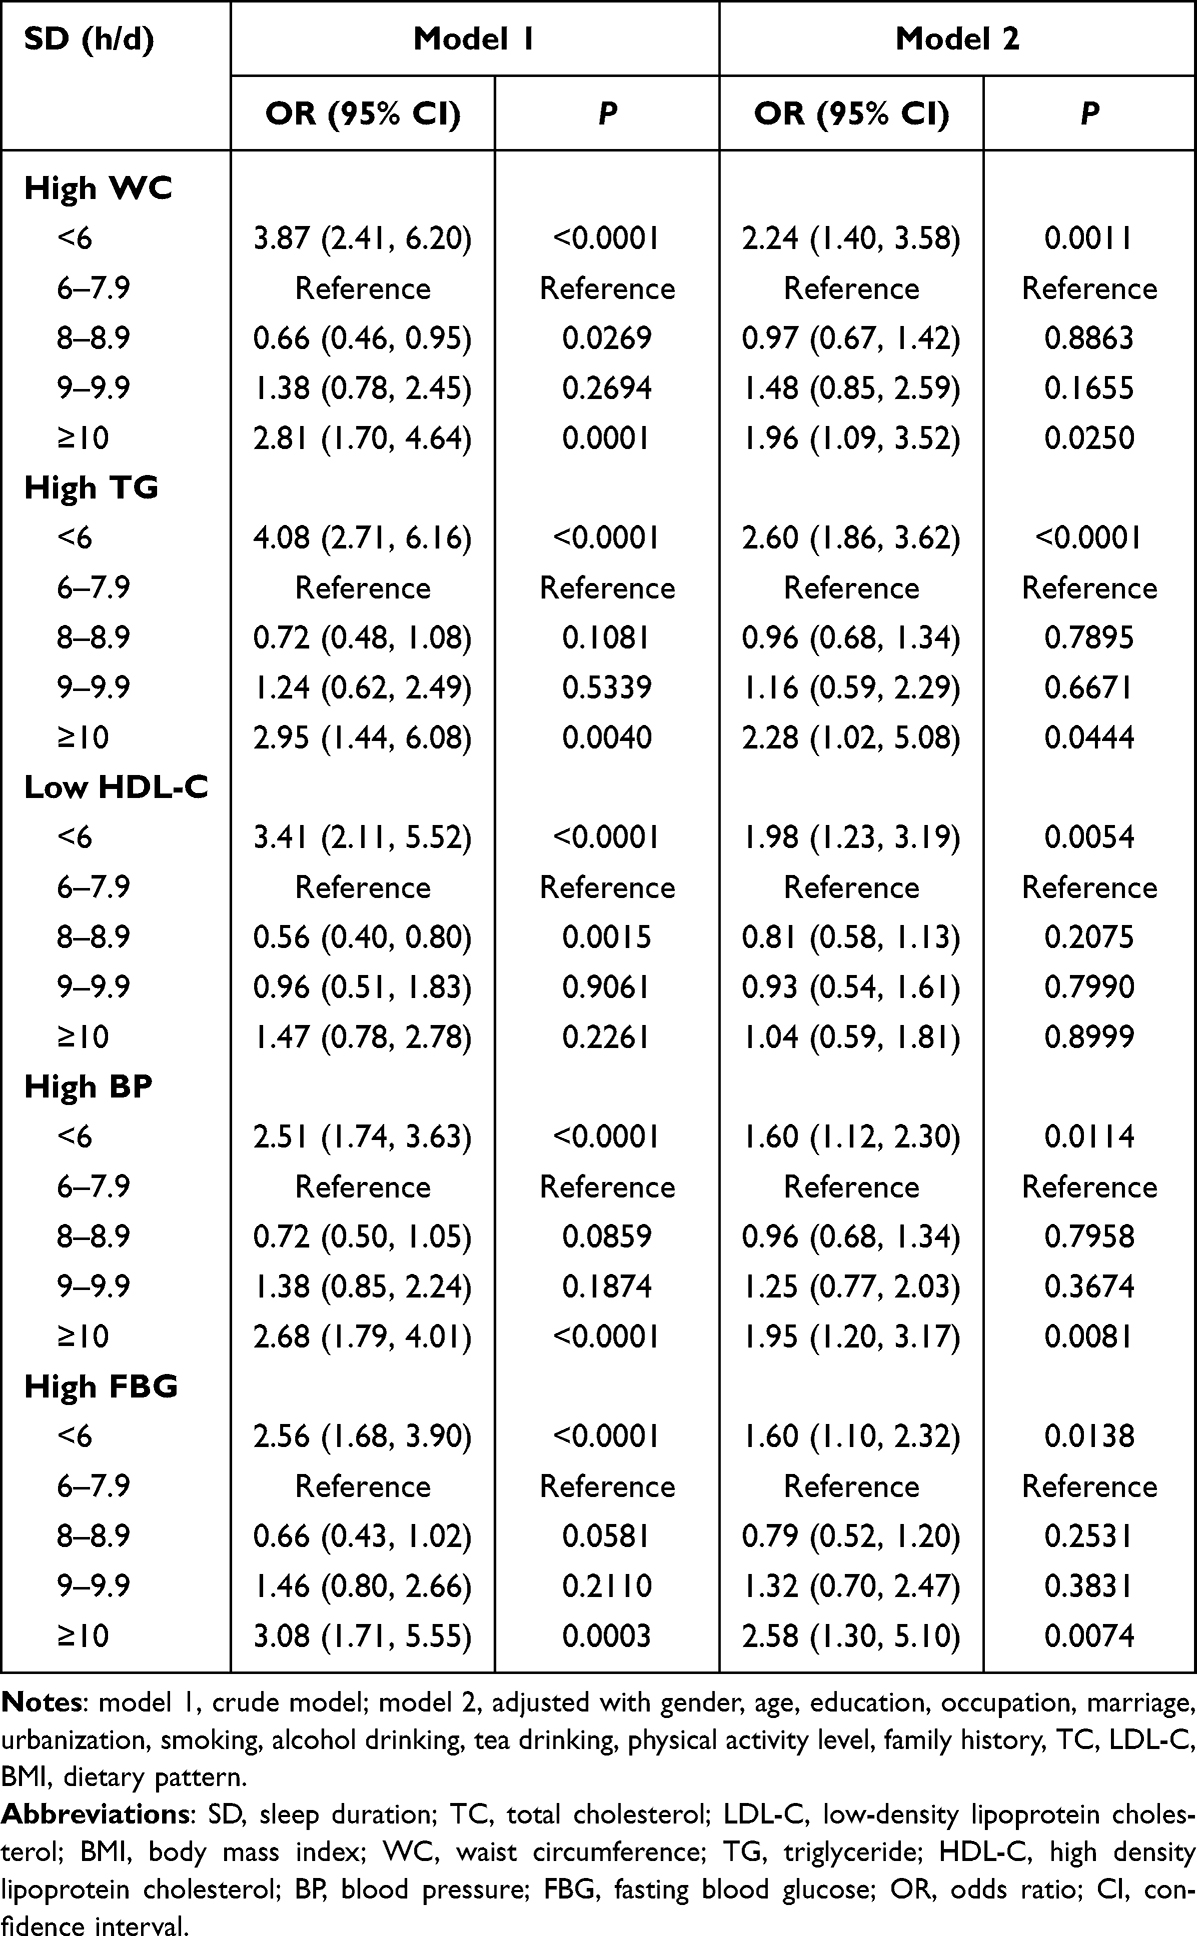 |
Table 3 Association of SD with Stroke in the Study Population in Mets Components |
Discussion
In this study, we found that SD had a significant association with stroke, and the effects were different among Mets and its components. In the non-Mets group, only short SD (<6 h/d) was significantly positively linked to stroke; while, in the Mets group, both short SD (<6 h/d) and long SD (≥10 h/d) significantly increased stroke risks. The metabolic level of the participants may play an important role in the relationship between SD and stroke. Furthermore, a U shape of the association between SD and stroke was observed in those with or without Mets. In addition, the effects of SD on stroke were different in Mets components, which were more pronounced in those with high WC and high TG for short SD (<6 h/d), more evident in those with high TG and high FBG for long SD (≥10 h/d).
The associations between SD and stroke in the participants with or without Mets were inconclusive. The present study result was partially consistent with the previous studies.4,17,19 For example, one retrospective study of 8968 Chinese participants had reported that long SD (>9 h/d) significantly increased the risk of stroke in individuals with Mets, while no significant association was observed between short SD (<6 h/d) and stroke; furthermore, SD had no significant association with stroke in the study population without Mets.17 In addition, the present study showed a U-shaped association between SD and stroke, which indicated that individuals with short or long SD had a significant higher stroke risk. The result was also partially consistent with the previous studies. Some studies also reported a U-shaped relationship between SD and stroke,5,8,9 while other studies reported a J-shaped association.4,10,12,13 Our finding suggests that choosing optimal SD can contribute to decreasing the possibility of having stroke. The discrepancy in results may be partially explained by the differences of study samples, SD classifications, Mets assessments and so on.
The present study suggested associations between SD and stroke from a cross-section study, which only indicated correlativity rather than causality between exposure and outcome. In the present study, short SD (<6 h/d) was significantly positively associated with stroke regardless of the status of Mets, while long SD (≥10 h/d) only showed a significantly positively correlation with stroke in the Mets group; and these conclusions did not totally support the results from some Mendelian randomization (MR) analyses,25–28 which leverage genetic variants as instrument variables to provide unconfounded estimates and causal inferences between exposure and outcome.28 For instance, a previous study found suggestive evidence that per doubling of genetic liability for short SD (≤6 h/d) was associated with a modest increase in risk of large artery stroke (LAS) and little evidence for causal effects of long SD (≥9 h/d) on any ischemic stroke subtype was observed.26 Additionally, another recent MR study in UK Biobank showed no evidence on the adverse causal effects of having a genetically predicted short SD (≤6 h/d) or long SD (≥9 h/d) on ischemic stroke.28 However, the aforementioned MR studies mostly focused on European ancestry, and scarcely paid attention on Chinese residents; therefore, more experimental studies or MR studies are needed in future to identify the causal effects of SD on stroke in Chinese.
The underlying biologic mechanisms between SD and stroke are not well understood, which might be partially explained as follows: firstly, inflammation may be one possible potential biological pathway, as one previous study showed that sleep deprivation could cause endothelial dysfunction, increased markers of vascular/systemic oxidative stress, and inflammation;29 also, other related studies demonstrated that long SD was also significantly associated with increased biomarkers of inflammatory such as C-reactive protein (CRP) and interleukin-10 (IL-10).30,31 Secondly, the unreasonable SD could lead to metabolic level changes,32,33 which may be accounted for the development of stroke. Several studies showed that short SD might increase plasma cortisol levels by overactivation of the sympathetic activity and the hypothalamic-pituitary-adrenal (HPA) axis,17,34,35 which could increase blood pressure, potentially result in hypertension. In addition, the previous research showed that short SD was significantly with reduced leptin and elevated ghrelin that may lead to increased appetite,36 increased caloric intake,37,38 overeating unhealthy foods,39 and reduced physical activity due to fatigue,40 which possibly result in obesity. Short SD was also associated with higher levels of endocannabinoids41 and reduced insulin sensitivity42,43 that suggesting ß-cell dysfunction and thus, diabetes. Besides, short SD was also significantly associated with dyslipidemia,44,45 which because short SD could increase consumption of high saturated fat foods by reducing leptin and elevating ghrelin and increase lipolysis by elevated catecholamine secretion due to the overactivation of the sympathetic activity.36,45,46 However, the mechanism of long SD on stroke has been less investigated. Some studies showed that long SD was often accompanied by less physical activity and more sedentary activity,47 which are significantly related with stroke;48 in addition, depression caused by long SD may result in stroke.49,50 Future studies are required to explore the potential mechanism of long SD on stroke. These above factors had been confirmed by many studies that they could promote the occurrence and development of stroke.51–54 Our study also verified the related results that the magnitude of the association between SD and stroke was significantly higher in the participants with Mets compared to those without Mets.
The present study had several strengths. First of all, the present study explored the relationship between SD and stroke among the participants with Mets or its components, which provided new evidence for this issue considered rarely in the previous studies. Moreover, as a result of scientific sampling methods, the participants from SCDRFS-2017 is the representative of the Shanghai residents; in addition, quality control schemes/networks and trained teams of professional investigators could make our dataset true and reliable. Finally, a wide range of factors that may act as confounders or modifiers were taken into account in investigating the relationship between SD and stroke.
However, some limitations also should be acknowledged. Firstly, due to the cross-sectional nature of the present study, the causal relationship between SD and stroke cannot be clarified, thus further epidemiological studies are needed to provide conclusive evidences. Secondly, SD was determined by the self-report questionnaire of individuals rather than polysomnography, which is a golden standard for objective assessment of sleep quantity. Although self-report may lead to perceptual bias, it is still a convenient and most frequently used method to assess SD in a large population.4,55,56 Thirdly, we collected information on total SD per day instead of distinguishing between SD at night and midday napping, which could limit further investigation into the joint and separate effects of SD on stroke. Finally, stroke subtypes consisting of ischemic stroke and hemorrhagic stroke had different pathophysiological characteristics,57 while many missing values of stroke subtypes included in our data render us unable to explore whether SD had a different relationship with stroke subtypes.
Conclusion
Our study revealed that SD had a significant association with stroke, and the effects were different among Mets and its components. In the non-Mets group, only short SD (<6 h/d) had a significant relationship with stroke; while in the Mets group, both short SD (<6 h/d) and long SD (≥10 h/d) were significantly associated with stroke. Moreover, the effects of short SD (<6 h/d) and long SD (≥10 h/d) on stroke were more evident in those with high TG among the components of Mets. Our findings highlight that optimal SD plays an important role in stroke prevention and promote that more precise interventions may be needed to prevent stroke among the population with different metabolic levels.
Abbreviations
CNS, central nervous system; GBD, Global Burden of Disease; DALYs, disability-adjusted life-years; SD, sleep duration; CHNS, China Health and Nutrition Survey; Mets, metabolic syndrome; BP, blood pressure; TG, triglycerides; HDL-C, high-density lipoprotein cholesterol; FBG, fasting glucose; SCDRFS, Shanghai Chronic Disease and Risk Factors Surveillance; WHO, World Health Organization; CCDRFS, China Chronic Disease and Risk Factors Surveillance; SCDC, Shanghai Municipal Center for Disease Control and Prevention; NCDs, chronic non-communicable diseases; WC, waist circumference; IDF, International Diabetes Federation; NHLBI, National Heart, Lung, and Blood Institute; GPAQ, Global Physical Activity Questionnaire; FFQ, Food Frequency Questionnaire; TC, total cholesterol; LDL-C, low-density lipoprotein cholesterol; BMI, body mass index; CRP, C-reactive protein; IL-10, interleukin-10; HPA, hypothalamic-pituitary-adrenal.
Data Sharing Statement
The data used in this study are available on request from the corresponding authors. The data are not publicly available due to availability restrictions reported in the informed consent signed by all participants.
Ethics Approval and Informed Consent
All participants signed the consent forms after they were informed of the purpose and demands of the survey. The Ethics Committee of Shanghai Municipal Center for Disease Control and Prevention approved the study protocol (No.2016-10).
Acknowledgments
We thank the research grants from Shanghai Municipal Health Commission and Shanghai Medical and Health Development Foundation (1. Shanghai Municipal Health Commission Youth Projects [No. 20204Y0195]; 2. New Star in Medical Circle of Shanghai – Public Health Leader Project [No. 202199]; 3. The Shanghai New Three-year Action Plan for Public Health [No. GWV-10.1-XK16]). We appreciate all participants and researchers who participated in this study.
Author Contributions
All authors made a significant contribution to the work reported, whether that is in the conception, study design, execution, acquisition of data, analysis and interpretation, or in all these areas; took part in drafting, revising or critically reviewing the article; have agreed on the journal to which the article has been submitted; reviewed and agreed on all versions of the article before submission, during revision, the final version accepted for publication, and any significant changes introduced at the proofing stage; and agree to take responsibility and be accountable for the contents of the article.
Funding
This study was financially supported by the Shanghai Municipal Health Commission and Shanghai Medical and Health Development Foundation (1. Shanghai Municipal Health Commission Youth Projects [No. 20204Y0195]; 2. New Star in Medical Circle of Shanghai – Public Health Leader Project [No. 202199]); 3. The Shanghai New Three-year Action Plan for Public Health (No. GWV-10.1-XK16).
Disclosure
The authors declare no conflicts of interest in this work.
References
1. Sacco RL, Kasner SE, Broderick JP, et al. An updated definition of stroke for the 21st century: a statement for healthcare professionals from the American Heart Association/American Stroke Association. Stroke. 2013;44(7):2064–2089. doi:10.1161/STR.0b013e318296aeca
2. Institute for Health Metrics and Evaluation. GBD results tool; 2020. Available from: https://vizhub.healthdata.org/gbd-results/.
3. Boehme AK, Esenwa C, Elkind MS. Stroke risk factors, genetics, and prevention. Circ Res. 2017;120(3):472–495. doi:10.1161/CIRCRESAHA.116.308398
4. Zhou L, Yu K, Yang L, et al. Sleep duration, midday napping, and sleep quality and incident stroke: the Dongfeng-Tongji cohort. Neurology. 2020;94(4):e345–e356. doi:10.1212/WNL.0000000000008739
5. Chen JC, Brunner RL, Ren H, et al. Sleep duration and risk of ischemic stroke in postmenopausal women. Stroke. 2008;39(12):3185–3192. doi:10.1161/STROKEAHA.108.521773
6. Feng X, Liu Q, Li Y, Zhao F, Chang H, Lyu J. Longitudinal study of the relationship between sleep duration and hypertension in Chinese adult residents (CHNS 2004–2011). Sleep Med. 2019;58:88–92. doi:10.1016/j.sleep.2019.01.006
7. Fang J, Wen Z, Ouyang J, Wang H. Modeling the change trajectory of sleep duration and its associated factors: based on an 11-year longitudinal survey in China. BMC Public Health. 2021;21(1):1963. doi:10.1186/s12889-021-12017-8
8. Ji A, Lou H, Lou P, et al. Interactive effect of sleep duration and sleep quality on risk of stroke: an 8-year follow-up study in China. Sci Rep. 2020;10(1):8690. doi:10.1038/s41598-020-65611-y
9. Yin J, Jin X, Shan Z, et al. Relationship of sleep duration with all-cause mortality and cardiovascular events: a systematic review and dose-response meta-analysis of prospective cohort studies. J Am Heart Assoc. 2017;6(9). doi:10.1161/JAHA.117.005947.
10. Leng Y, Cappuccio FP, Wainwright NW, et al. Sleep duration and risk of fatal and nonfatal stroke: a prospective study and meta-analysis. Neurology. 2015;84(11):1072–1079. doi:10.1212/WNL.0000000000001371
11. Westerlund A, Bellocco R, Sundström J, Adami HO, Åkerstedt T, Trolle Lagerros Y. Sleep characteristics and cardiovascular events in a large Swedish cohort. Eur J Epidemiol. 2013;28(6):463–473. doi:10.1007/s10654-013-9802-2
12. He Q, Sun H, Wu X, et al. Sleep duration and risk of stroke: a dose-response meta-analysis of prospective cohort studies. Sleep Med. 2017;32:66–74. doi:10.1016/j.sleep.2016.12.012
13. RetirementLi W, Wang D, Cao S, et al. Sleep duration and risk of stroke events and stroke mortality: a systematic review and meta-analysis of prospective cohort studies. Int J Cardiol. 2016;223:870–876. doi:10.1016/j.ijcard.2016.08.302
14. Ruiter Petrov ME, Letter AJ, Howard VJ, Kleindorfer D. Self-reported sleep duration in relation to incident stroke symptoms: nuances by body mass and race from the REGARDS study. J Stroke Cerebrovasc Dis. 2014;23(2):e123–132. doi:10.1016/j.jstrokecerebrovasdis.2013.09.009
15. Eguchi K, Hoshide S, Ishikawa S, Shimada K, Kario K. Short sleep duration is an independent predictor of stroke events in elderly hypertensive patients. J Am Soc Hypertens. 2010;4(5):255–262. doi:10.1016/j.jash.2010.09.001
16. Akinseye OA, Ojike NI, Akinseye LI, Dhandapany PS, Pandi-Perumal SR. Association of sleep duration with stroke in diabetic patients: analysis of the National Health Interview Survey. J Stroke Cerebrovasc Dis. 2016;25(3):650–655. doi:10.1016/j.jstrokecerebrovasdis.2015.11.023
17. Ye Y, Zhang L, Wang A, et al. Association of sleep duration with stroke, myocardial infarction, and tumors in a Chinese population with metabolic syndrome: a retrospective study. Lipids Health Dis. 2020;19(1):155. doi:10.1186/s12944-020-01328-1
18. Alberti KG, Eckel RH, Grundy SM, et al. Harmonizing the metabolic syndrome: a joint interim statement of the International Diabetes Federation Task Force on Epidemiology and Prevention; National Heart, Lung, and Blood Institute; American Heart Association; World Heart Federation; International Atherosclerosis Society; and International Association for the Study of Obesity. Circulation. 2009;120(16):1640–1645. doi:10.1161/CIRCULATIONAHA.109.192644
19. Fang Y, He Y, Huang Y, et al. Sleep duration, daytime napping, and risk of incident stroke: nuances by metabolic syndrome from the China health and retirement longitudinal study. Front Cardiovasc Med. 2022;9:976537. doi:10.3389/fcvm.2022.976537
20. World Health Organization. Standard STEPS instrument; 2020. Available from: https://www.who.int/publications/m/item/standard-steps-instrument.
21. Wang L, Zhou B, Zhao Z, et al. Body-mass index and obesity in urban and rural China: findings from consecutive nationally representative surveys during 2004–18. Lancet. 2021;398(10294):53–63. doi:10.1016/S0140-6736(21)00798-4
22. Armstrong T, Bull F. Development of the Global Physical Activity Questionnaire (GPAQ). J Public Health. 2006;14(2):66–70. doi:10.1007/s10389-006-0024-x
23. Chu AH, Ng SH, Koh D, Müller-Riemenschneider F. Reliability and validity of the self- and interviewer-administered versions of the Global Physical Activity Questionnaire (GPAQ). PLoS One. 2015;10(9):e0136944. doi:10.1371/journal.pone.0136944
24. Desquilbet L, Mariotti F. Dose-response analyses using restricted cubic spline functions in public health research. Stat Med. 2010;29(9):1037–1057. doi:10.1002/sim.3841
25. Jia Y, Guo D, Sun L, et al. Self-reported daytime napping, daytime sleepiness, and other sleep phenotypes in the development of cardiometabolic diseases: a Mendelian randomization study. Eur J Prev Cardiol. 2022;29(15):1982–1991. doi:10.1093/eurjpc/zwac123
26. Cai H, Liang J, Liu Z, et al. Causal effects of sleep traits on ischemic stroke and its subtypes: a Mendelian Randomization Study. Nat Sci Sleep. 2020;12:783–790. doi:10.2147/NSS.S265946
27. Titova OE, Michaëlsson K, Larsson SC. Sleep duration and stroke: prospective cohort study and Mendelian randomization analysis. Stroke. 2020;51(11):3279–3285. doi:10.1161/STROKEAHA.120.029902
28. Ai S, Zhang J, Zhao G, et al. Causal associations of short and long sleep durations with 12 cardiovascular diseases: linear and nonlinear Mendelian randomization analyses in UK Biobank. Eur Heart J. 2021;42(34):3349–3357. doi:10.1093/eurheartj/ehab170
29. Kröller-Schön S, Daiber A, Steven S, et al. Crucial role for Nox2 and sleep deprivation in aircraft noise-induced vascular and cerebral oxidative stress, inflammation, and gene regulation. Eur Heart J. 2018;39(38):3528–3539. doi:10.1093/eurheartj/ehy333
30. Patel SR, Zhu X, Storfer-Isser A, et al. Sleep duration and biomarkers of inflammation. Sleep. 2009;32(2):200–204. doi:10.1093/sleep/32.2.200
31. Pak VM, Paul S, Swieboda D, Balthazar MS, Wharton W. Sleep duration and biomarkers of inflammation in African American and white participants with a parental history of Alzheimer’s disease. Alzheimers Dement. 2022;8(1):e12332.
32. Syauqy A, Hsu CY, Rau HH, Kurniawan AL, Chao JC. Association of sleep duration and insomnia symptoms with components of metabolic syndrome and inflammation in middle-aged and older adults with metabolic syndrome in Taiwan. Nutrients. 2019;11(8):1848. doi:10.3390/nu11081848
33. Smiley A, King D, Bidulescu A. The association between sleep duration and metabolic syndrome: the NHANES 2013/2014. Nutrients. 2019;11(11):2582. doi:10.3390/nu11112582
34. Wang Y, Mei H, Jiang YR, et al. Relationship between duration of sleep and hypertension in adults: a meta-analysis. J Clin Sleep Med. 2015;11(9):1047–1056. doi:10.5664/jcsm.5024
35. Ceïde ME, Pandey A, Ravenell J, Donat M, Ogedegbe G, Jean-Louis G. Associations of short sleep and shift work status with hypertension among Black and White Americans. Int J Hypertens. 2015;2015:697275. doi:10.1155/2015/697275
36. Taheri S, Lin L, Austin D, Young T, Mignot E. Short sleep duration is associated with reduced leptin, elevated ghrelin, and increased body mass index. PLoS Med. 2004;1(3):e62. doi:10.1371/journal.pmed.0010062
37. Chaput JP. Sleep patterns, diet quality and energy balance. Physiol Behav. 2014;134:86–91. doi:10.1016/j.physbeh.2013.09.006
38. Brondel L, Romer MA, Nougues PM, Touyarou P, Davenne D. Acute partial sleep deprivation increases food intake in healthy men. Am J Clin Nutr. 2010;91(6):1550–1559. doi:10.3945/ajcn.2009.28523
39. St-Onge MP, Wolfe S, Sy M, Shechter A, Hirsch J. Sleep restriction increases the neuronal response to unhealthy food in normal-weight individuals. Int J Obes. 2014;38(3):411–416. doi:10.1038/ijo.2013.114
40. Ogilvie RP, Patel SR. The epidemiology of sleep and obesity. Sleep Health. 2017;3(5):383–388. doi:10.1016/j.sleh.2017.07.013
41. Gruden G, Barutta F, Kunos G, Pacher P. Role of the endocannabinoid system in diabetes and diabetic complications. Br J Pharmacol. 2016;173(7):1116–1127. doi:10.1111/bph.13226
42. Zhu B, Shi C, Park CG, Zhao X, Reutrakul S. Effects of sleep restriction on metabolism-related parameters in healthy adults: a comprehensive review and meta-analysis of randomized controlled trials. Sleep Med Rev. 2019;45:18–30. doi:10.1016/j.smrv.2019.02.002
43. van Dijk D, Balkau B, Segrestin B, et al. Associations between sleep duration and sleep debt with insulin sensitivity and insulin secretion in the EGIR-RISC Study. Diabetes Metab. 2019;45(4):375–381. doi:10.1016/j.diabet.2018.11.001
44. Deng HB, Tam T, Zee BC, et al. Short sleep duration increases metabolic impact in healthy adults: a population-based cohort study. Sleep. 2017;40(10). doi:10.1093/sleep/zsx130.
45. Lin CL, Tsai YH, Yeh MC. The relationship between insomnia with short sleep duration is associated with hypercholesterolemia: a cross-sectional study. J Adv Nurs. 2016;72(2):339–347. doi:10.1111/jan.12844
46. Mullington JM, Chan JL, Van Dongen HP, et al. Sleep loss reduces diurnal rhythm amplitude of leptin in healthy men. J Neuroendocrinol. 2003;15(9):851–854. doi:10.1046/j.1365-2826.2003.01069.x
47. Vogel O, Niederer D, Wilke J, El-Rajab I, Vogt L. Habitual physical activity and sleep duration in institutionalized older adults. Front Neurol. 2021;12:706340. doi:10.3389/fneur.2021.706340
48. Wendel-Vos GC, Schuit AJ, Feskens EJ, et al. Physical activity and stroke. A meta-analysis of observational data. Int J Epidemiol. 2004;33(4):787–798. doi:10.1093/ije/dyh168
49. Patel SR, Malhotra A, Gottlieb DJ, White DP, Hu FB. Correlates of long sleep duration. Sleep. 2006;29(7):881–889. doi:10.1093/sleep/29.7.881
50. Hamano T, Li X, Lönn SL, et al. Depression, stroke and gender: evidence of a stronger association in men. J Neurol Neurosurg Psychiatry. 2015;86(3):319–323. doi:10.1136/jnnp-2014-307616
51. Zhang F, Liu L, Zhang C, Ji S, Mei Z, Li T. Association of metabolic syndrome and its components with risk of stroke recurrence and mortality: a meta-analysis. Neurology. 2021;97(7):e695–e705. doi:10.1212/WNL.0000000000012415
52. Alloubani A, Saleh A, Abdelhafiz I. Hypertension and diabetes mellitus as a predictive risk factors for stroke. Diabetes Metab Syndr. 2018;12(4):577–584. doi:10.1016/j.dsx.2018.03.009
53. Lu Y, Hajifathalian K, Ezzati M, Woodward M, Rimm EB, Danaei G. Metabolic mediators of the effects of body-mass index, overweight, and obesity on coronary heart disease and stroke: a pooled analysis of 97 prospective cohorts with 1.8 million participants. Lancet. 2014;383(9921):970–983.
54. Wadström BN, Wulff AB, Pedersen KM, Jensen GB, Nordestgaard BG. Elevated remnant cholesterol increases the risk of peripheral artery disease, myocardial infarction, and ischaemic stroke: a cohort-based study. Eur Heart J. 2022;43(34):3258–3269. doi:10.1093/eurheartj/ehab705
55. Amagai Y, Ishikawa S, Gotoh T, Kayaba K, Nakamura Y, Kajii E. Sleep duration and incidence of cardiovascular events in a Japanese population: the Jichi Medical School cohort study. J Epidemiol. 2010;20(2):106–110. doi:10.2188/jea.JE20090053
56. Petrov ME, Howard G, Grandner MA, Kleindorfer D, Molano JR, Howard VJ. Sleep duration and risk of incident stroke by age, sex, and race: the REGARDS study. Neurology. 2018;91(18):e1702–e1709. doi:10.1212/WNL.0000000000006424
57. Campbell BCV, Khatri P. Stroke. Lancet. 2020;396(10244):129–142. doi:10.1016/S0140-6736(20)31179-X
 © 2023 The Author(s). This work is published and licensed by Dove Medical Press Limited. The
full terms of this license are available at https://www.dovepress.com/terms
and incorporate the Creative Commons Attribution
- Non Commercial (unported, 3.0) License.
By accessing the work you hereby accept the Terms. Non-commercial uses of the work are permitted
without any further permission from Dove Medical Press Limited, provided the work is properly
attributed. For permission for commercial use of this work, please see paragraphs 4.2 and 5 of our Terms.
© 2023 The Author(s). This work is published and licensed by Dove Medical Press Limited. The
full terms of this license are available at https://www.dovepress.com/terms
and incorporate the Creative Commons Attribution
- Non Commercial (unported, 3.0) License.
By accessing the work you hereby accept the Terms. Non-commercial uses of the work are permitted
without any further permission from Dove Medical Press Limited, provided the work is properly
attributed. For permission for commercial use of this work, please see paragraphs 4.2 and 5 of our Terms.
Recommended articles
The Association Between Short Sleep Duration and Metabolic Syndrome: A Case-Control Study
Elshoeibi AM, Akomolafe A, Al-Khulaifi A, Metwally O, Al-Khayarin R, Al Abiad AR, Al-Naemi L, Chivese T, Farooqui H
Diabetes, Metabolic Syndrome and Obesity 2023, 16:4157-4167
Published Date: 20 December 2023
Interaction of Triglyceride-Glucose Index and Metabolic Syndrome with Risk of Incident Stroke Among Middle-Aged and Older Chinese Adults
Li H, Tang T, Xiong L, Yin Y, Dai B
Journal of Multidisciplinary Healthcare 2025, 18:947-955
Published Date: 18 February 2025
Persisting Short or Long Sleep Duration Predicts Post-Stroke Depression One year After Stroke and Transient Ischemic Attack
Hu Y, Zuo L, Pan Y, Yan H, Wang Y, Zhao X
Nature and Science of Sleep 2025, 17:1507-1519
Published Date: 27 June 2025