Back to Journals » Diabetes, Metabolic Syndrome and Obesity » Volume 16
Association Between Sensitivity to Thyroid Hormones and Metabolic Dysfunction-Associated Fatty Liver Disease in Euthyroid Subjects: A Cross-Sectional Study
Authors Liu H, Xing Y, Nie Q, Li Z, Meng C, Ma H
Received 24 May 2023
Accepted for publication 3 July 2023
Published 19 July 2023 Volume 2023:16 Pages 2153—2163
DOI https://doi.org/10.2147/DMSO.S420872
Checked for plagiarism Yes
Review by Single anonymous peer review
Peer reviewer comments 3
Editor who approved publication: Prof. Dr. Juei-Tang Cheng
Huanxin Liu,1 Yuling Xing,2 Qian Nie,1 Zhong Li,3 Cuiqiao Meng,1 Huijuan Ma2,4
1Health Examination Center, Hebei General Hospital, Shijiazhuang, Hebei, 050051, People’s Republic of China; 2Department of Endocrinology, Hebei General Hospital, Shijiazhuang, Hebei, 050051, People’s Republic of China; 3Department of General Surgery, Shijiazhuang People’s Hospital, Shijiazhuang, 050011, People’s Republic of China; 4Key Laboratory of Metabolic Disease in Hebei Province, Hebei General Hospital, Shijiazhuang, Hebei, 050051, People’s Republic of China
Correspondence: Huijuan Ma, Department of Endocrinology, Hebei General Hospital, Shijiazhuang, 050051, People’s Republic of China, Tel +86 18032838686, Email [email protected]
Objective: Thyroid hormones (THs) exert instrumental effects in regulating lipids metabolism. Whereas, research investigating the relationship between sensitivity indices to THs and metabolic dysfunction-associated fatty liver disease (MAFLD) have contradicted this. This study was designed to approach the correlation between sensitivity indices to THs and MAFLD in euthyroid subjects.
Methods: An overall sample of 6356 euthyroid participants were enrolled in a Chinese hospital. Free triiodothyronine to free thyroxine ratio (FT3/FT4), thyrotropin triiodothyronine resistance index (TT3RI), thyrotropin thyroxine resistance index (TT4RI), thyroid stimulating hormone index (TSHI) and thyroid feedback quantile-based indices (TFQIFT3 and TFQIFT4) were collected as sensitivity indicators to THs. Participants were split into two groups based on whether they suffered with MAFLD or not. And participants were categorized into quartiles based on sensitivity indicators to THs. The effects of sensitivity indices to THs on MAFLD were analyzed using regression analysis. Bootstrap was performed to assess the mediation effect of triglyceride glucose (TyG) index on the relationship between sensitivity parameters to THs and MAFLD.
Results: The incidence of MAFLD in euthyroid subjects was 34.47%. As FT3/FT4, TT3RI and TFQIFT3 levels rose, so did the MAFLD prevalence. After adjustment for confounders, logistic regression analyses indicated that the high-level FT3/FT4 and TFQIFT3 still remained risk factors for MAFLD. The relevance of FT3/FT4 and MAFLD was stronger among those whose age ≤ 40 years and had non-visceral obesity. And the interrelation between TFQIFT3 and MAFLD was stronger in subjects whose age ≤ 40 years. Mediation analyses suggested that TyG index had a noteworthy indirect impact on the relationship between FT3/FT4, TFQIFT3 and MAFLD.
Conclusion: Increased FT3/FT4 and TFQIFT3 were significantly related to MAFLD prevalence in populations with normal thyroid function. TyG index partly mediated the relevance between FT3/FT4, TFQIFT3 and MAFLD.
Keywords: thyroid hormone sensitivity, metabolic dysfunction-associated fatty liver disease, triglyceride glucose index, mediation effect
A Letter to the Editor has been published for this article.
A Response to Letter by Dr Han has been published for this article.
Introduction
Metabolic dysfunction-associated fatty liver disease (MAFLD) is a multisystem disorder, defined as the presence of fatty degeneration of the liver besides one of the following three criteria, namely racial adjusted overweight/obesity, type 2 diabetes mellitus (T2DM) or the disturbance of metabolism.1 The clinical epidemiology research has demonstrated that the worldwide morbidity of MAFLD was approximately 25.0%.2 And the incidence rate of MAFLD exceeded 50% in individuals who are overweight or obese.3 Accumulating evidence suggested that MAFLD patients had more significant cirrhosis and hepatic cellular cancer (HCC) compared to non-alcoholic fatty liver disease (NAFLD) patients.4,5 Besides, numerous previous studies found that MAFLD was correlated with greater rates of overweight,3 glucose dysregulation,6 atrial fibrillation,6 cardiovascular diseases (CVD) mortality7 and all-cause mortality.8,9 The prevalence of MAFLD has led to a continuous increase of the social medical burden. Therefore, better awareness of the underlying hazard factors for MAFLD contributes to improving preventive and therapeutic measures.
Thyroid hormones (THs) have been suggested to interact on liver lipid homeostasis through a set of processes, including stimulating the entry of free fatty acids (FFA) into the liver for esterification to triacylglycerol (TG) and increasing mitochondrial β-oxidation of fatty acids to affect liver lipid accumulation.10,11 Impaired lipid metabolism and hepatic steatosis were shown in both subclinical and clinical hypothyroidism patients.12,13 The effect of THs on hepatic steatosis still existed despite changes within the norm but the results were not entirely consistent.14–17 Furthermore, THs individually might not be enough to comprehensively expound thyroid gland status. Based on this situation, thyroid hormone sensitivity indicators were presented, which better reflected thyroid homeostasis.18–20 Laclaustra et al18 proposed thyroid feedback quantile-based index (TFQI), namely central sensitivity to THs, which could be used to evaluate the reaction of hypophysis to THs. Studies demonstrated that TFQI, thyroid-stimulating hormone index (TSHI), as well as thyrotrophic thyroxine resistance index (TT4RI) levels were correlated with metabolic syndrome (Mets), advanced hepatic fibrosis and other diseases in populations with euthyroidism.20–23 Additionally, as a peripheral sensitivity index to THs, free triiodothyronine to free thyroxine (FT3/FT4) could predict NAFLD independent of metabolic indicators in euthyroid subjects.24,25 At present, large-sample studies on the effects of sensitivity indices to THs on MAFLD were limited. This study aimed to gain insight into correlations between sensitivity indices to THs and MAFLD in euthyroid populations.
Materials and Methods
Study Subjects
The research protocol was carried out on the basis of the Helsinki Declaration with authorization of the Hebei General Hospital Ethics Committee. The data were collected from the Hebei Health Examination Center from January 1, 2020, to December 31, 2020. All subjects were screened and assessed based on inclusion criteria and exclusion criteria. And each participant has completed informed consent.
The euthyroid adult subjects were eligible for inclusion in this research. Exclusion requirements were as followings: (1) Those with a medical history of thyroid dysfunction or medical treatment that might affect thyroid gland function (n = 483). (2) Malignant tumors, severe hepatic and renal dysfunction, hypothalamus and pituitary disease (n = 131). (3) Pregnant or lactating women (n = 22). (4) Incomplete data (n = 604).
Data Collection and Measures
At the time of enrollment, the detailed variables were gathered, involving sex, age, body mass index (BMI), waist circumference (WC). Standard measurement of blood pressure was conducted, including systolic blood pressure (SBP) and diastolic blood pressure (DBP). The venous blood of the subjects was taken on an empty stomach on the next morning. Serum biochemicals were determined, which included serum uric acid (SUA), serum creatinine (Scr), TG, high density lipoprotein cholesterol (HDL-C), low density lipoprotein cholesterol (LDL-C), total cholesterol (TC), aminotransferase (AST), alanine aminotransferase (ALT), free triiodothyronine (FT3), free thyroxine (FT4), triiodothyronine (TT3), and tetraiodothyronine (TT4), TSH, fasting plasma glucose (FPG) and blood urea nitrogen (BUN). The fatty liver was diagnosed according to the findings of liver ultrasound, which was performed by trained technicians.
Diagnostic Criteria of MAFLD
MAFLD was diagnosed on the basis of abdominal ultrasound-diagnosed liver steatosis, combining with one of three standard factors below, that is, overweight/obesity, T2DM, or metabolism disorder. Metabolism disorder was recognised as having two or more lipid disorder indicators: WC ≥90 cm for male, and ≥80 cm for female; blood pressure (BP) ≥130/85 mmHg or step-down medication therapy; TG ≥1.70 mmol/L or taking lipid-lowering agents; HDL-C <1.0 mmol/L for male and <1.3 mmol/L for female or specific medication therapy; pre-diabetes (FPG; 5.6–6.9 mmol/L). We did not evaluate serum insulin and hypersensitive C-reactive protein (hsCRP) due to the lack of these data.1
Calculations of Sensitivity Indices to THs and Triglyceride Glucose (TyG) Index
 . For FT3/FT4, the higher values stand for higher peripheral sensitivity to THs.


 27 The lower levels of TT3RI, TT4RI and TSHI expressed higher central TH activity.

 18 TFQIFT3 and TFQIFT4 ranged from −1 to 1, which reflected the central sensitivity to THs. For TFQIFT3 and TFQIFT4, negative values represented higher sensitivity to THs, conversely positive values represented lower sensitivity.25

Statistical Analysis
SPSS 23.0 statistic software was adopted for statistic analysis. If the quantitative information were normally distributed, the results were represented by average ± standard bias, and independent samples t-test was taken to compare between two sets of data. We expressed by the median (interquartile range) for continuous skewness distribution data, and the Mann–Whitney U-test was applied to compare between two sets of data. The counting data were represented as [n (%)], groups were measured through the use of chi-square test. Multivariate logistic regressions were utilized to evaluate the impact of sensitivity indices to THs on MAFLD status. Mediation analyses were applied to explored the mediators in the connection between sensitivity indicators to THs and MAFLD. There were significant differences when P-values <0.05. The subgroup analyses were taken to estimate the robustness of outcomes.
Results
Comparison of Basic Features Between MAFLD and Non-MAFLD Group
Data from 6356 euthyroid subjects were taken for the research with a mean age of 47.04 ± 12.19 years old, which included 2904 (45.69%) males and 3452 (54.31%) females. The detection rate of MAFLD was 34.47% (2191/6356) (Figure 1). Comparing with non-MAFLD cases, the MAFLD participants showed greater levels of FT3, FT3/FT4, TT3RI, TFQIFT3, age, WC, BMI, SBP, DBP, BUN, SUA, Scr, AST and ALT, as well as worse metabolism property, including higher TC, TG, LDL-C, FPG, TyG index, and lower HDL-C (P<0.05). The levels of FT4, TSH, TT4RI, TSHI as well as TFQIFT4 had no statistical difference between the MAFLD and non-MAFLD groups (P>0.05) (Table 1).
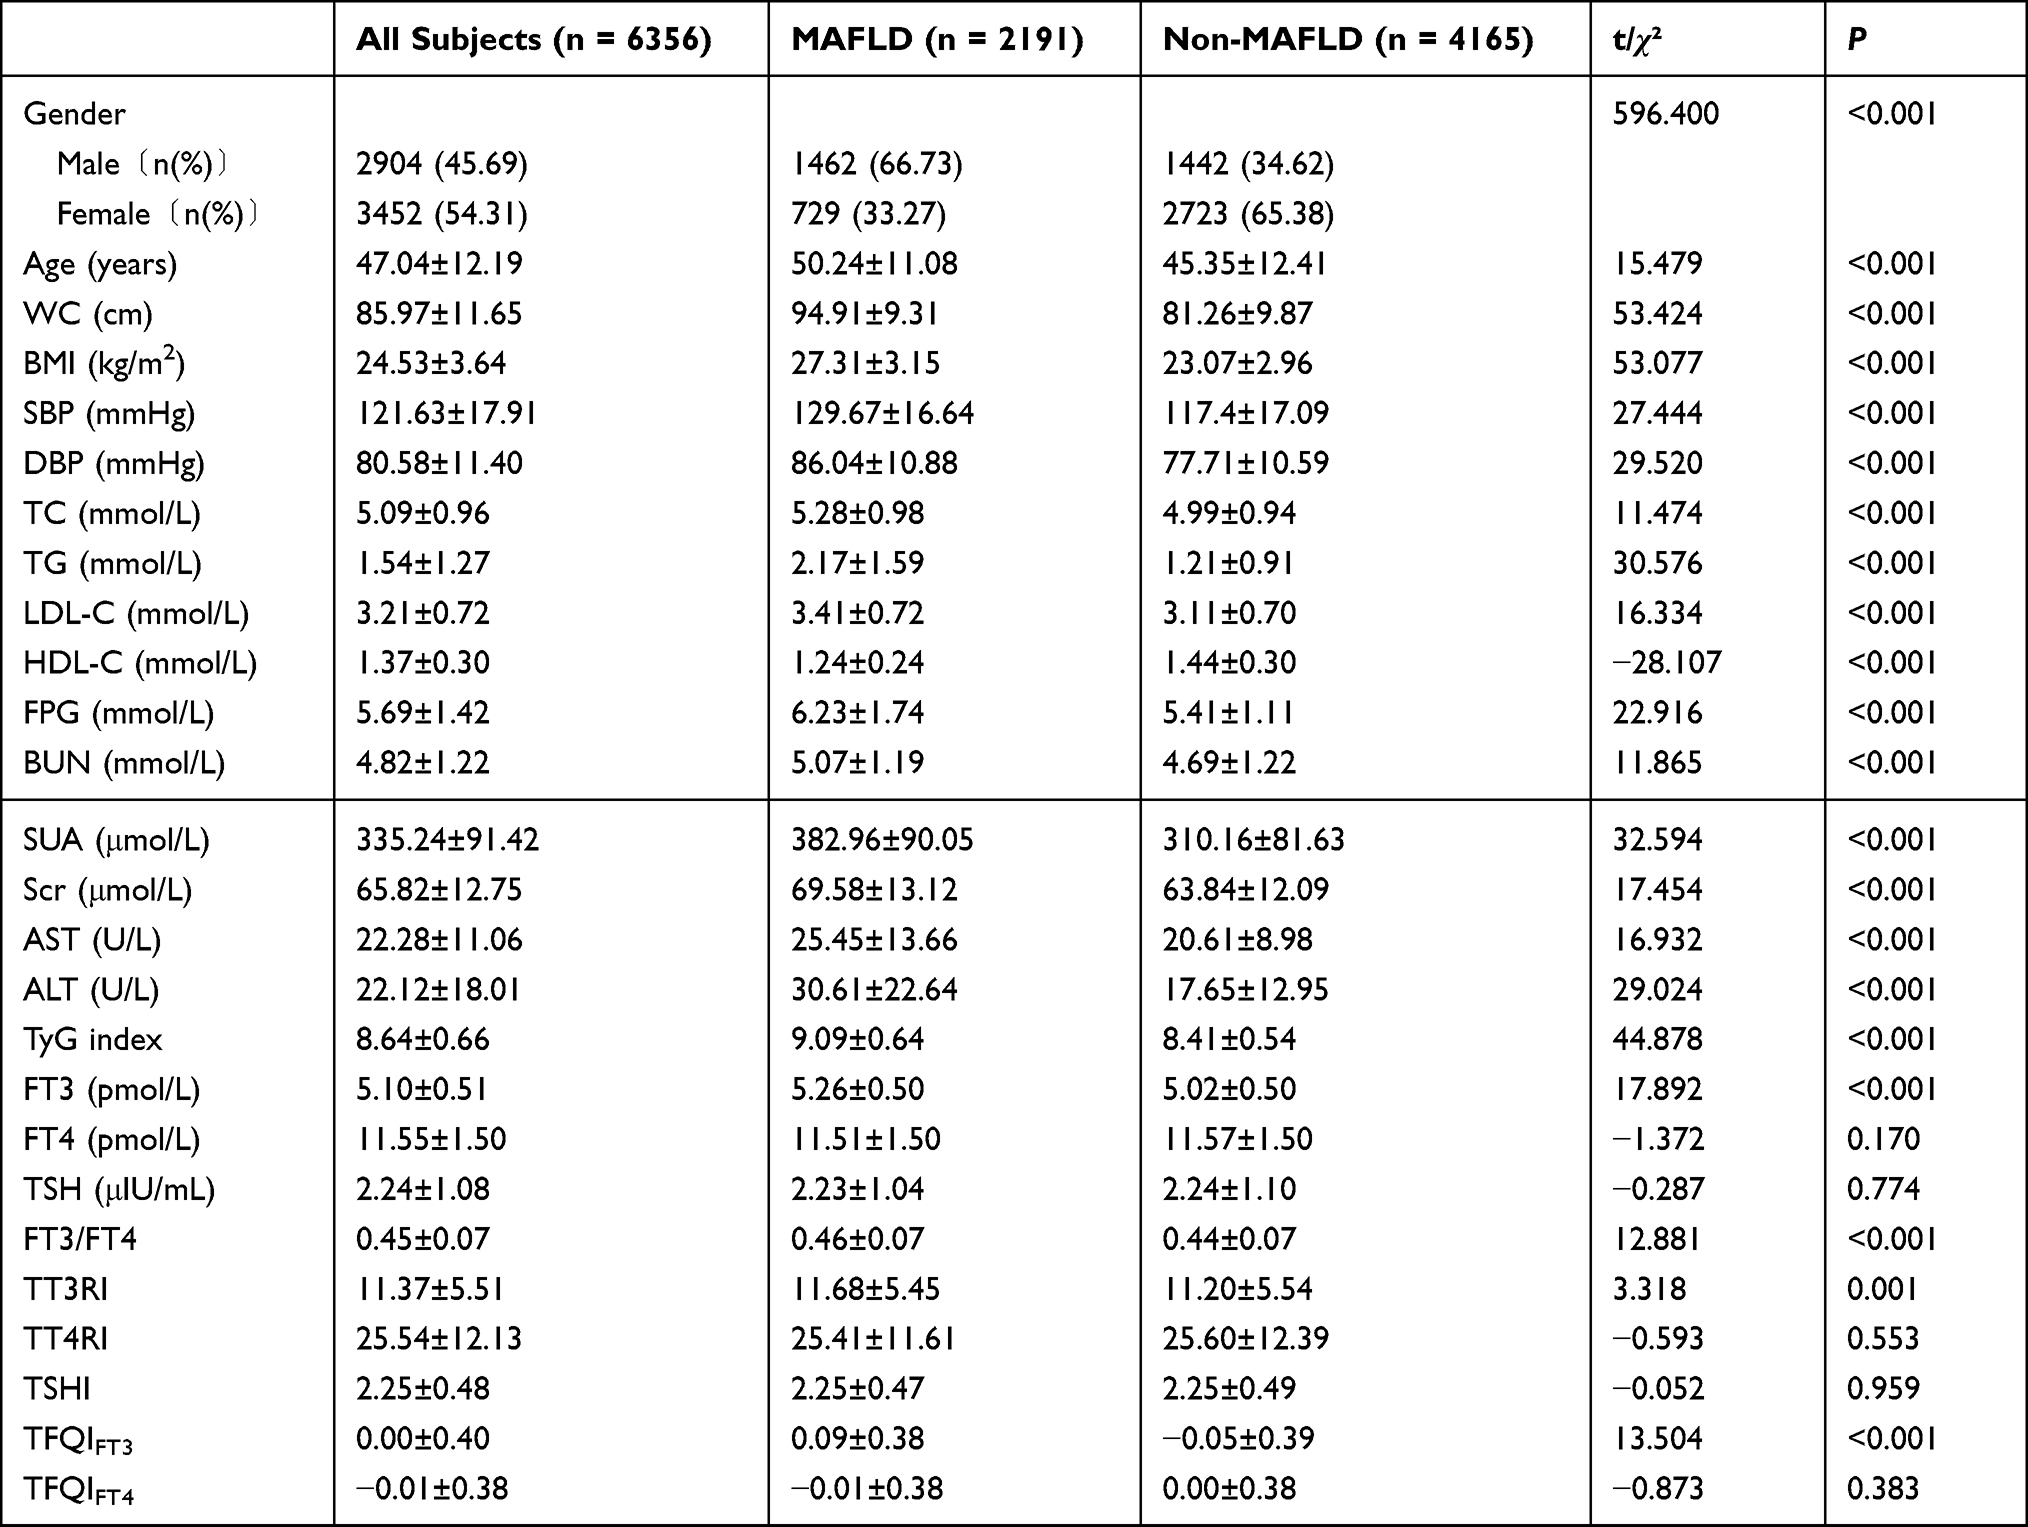 |
Table 1 Comparison of Basic Demographic Characteristics of MAFLD and Non-MAFLD Population |
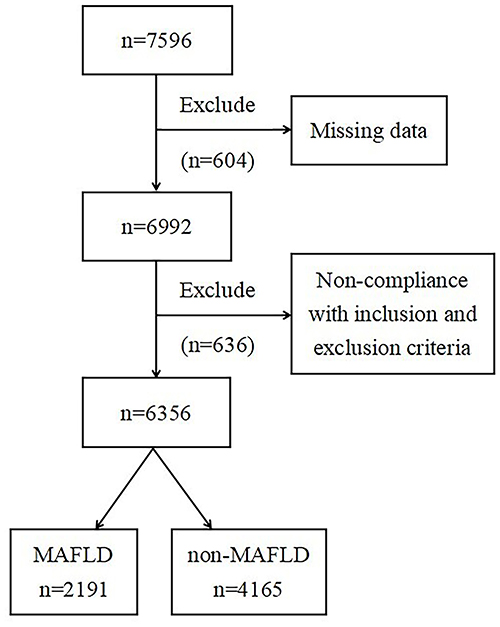 |
Figure 1 Flowchart of the inclusion and exclusion of participants. |
Correlations Between Sensitivity Indices to THs Levels and Prevalence Rate of MAFLD
Examinees were classified as four groups (Q1-Q4) in accordance with the quartile range of the sensitivity indicators to THs. By comparing MAFLD prevalence in the Q1-Q4 groups, it was observed that MAFLD prevalence statistically significantly increased with an increase in FT3/FT4, TT3RI and TFQIFT3 (P<0.05). And the incidence rate of MAFLD was highest in the fourth group for FT3/FT4, TT3RI and TFQIFT3 (Figure 2).
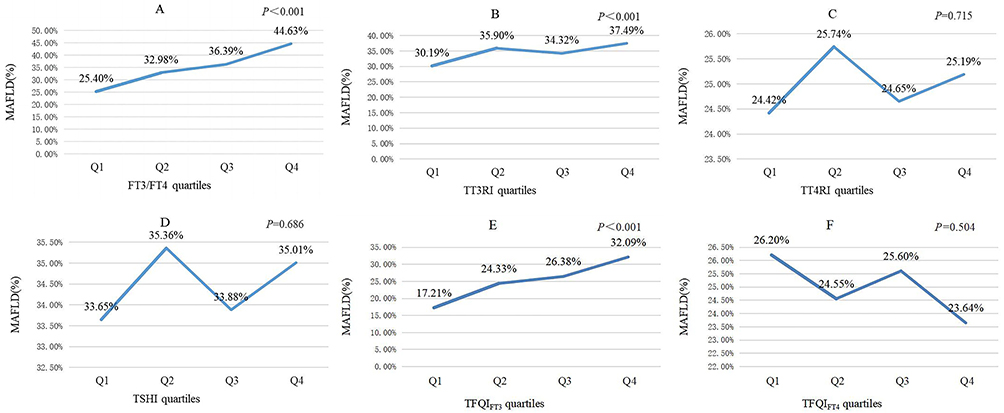 |
Figure 2 Comparisons of prevalence rate of MAFLD according to sensitivity to thyroid hormones quartiles (A) FT3/FT4 quartiles, (B) TT3RI quartiles, (C) TT4RI quartiles, (D) TSHI quartiles, (E) TFQIFT3 quartiles, (F) TFQIFT4 quartiles. |
Multivariable Regression Analyses of Relationship Between Sensitivity Indices to THs and MAFLD Prevalence
In multivariable regression analyses, FT3/FT4, TT3RI and TFQIFT3 were highly correlated with MAFLD in both model 1 and model 2. The relevance of FT3/FT4, TFQIFT3 and MAFLD remained available after adjustment for age, sex, WC, BMI, blood pressure, TC, TG, LDL-C, HDL-C, fasting blood glucose, BUN, SUA, Scr, AST and ALT. And the odds ratio in comparing MAFLD with non-MAFLD was 11.810 (95% CI 4.148~33.628, P<0.001) for FT3/FT4 and 1.395 (95% CI 1.161~1.676, P<0.001) for TFQIFT3 (model 3). Nevertheless, the relevances were not discovered between TT3RI, TT4RI, TSHI, TFQIFT4 and MAFLD after adjustment for the above confounding factors (Table 2).
 |
Table 2 Relationship Between Sensitivity Indices to Thyroid Hormones and MAFLD Prevalence in Different Models |
The sensitivity indices to THs were explored as categorical variables (quartiles) to guarantee the robustness of results. The results suggested the significantly positively graded correlations between FT3/FT4, TFQIFT3 and MAFLD risk. After adjustment for the above confounding factors, the high-levels of TFQIFT3 and FT3/FT4 were still discovered to be risk factors for MAFLD. Moreover, the fourth group for FT3/FT4 (OR 1.533; 95% CI 1.250~1.879; P<0.001) and TFQIFT3 (OR 1.521; 95% CI 1.239~1.866; P<0.001) had the greatest risk of MAFLD. And the Q2 group (OR 1.239; 95% CI 1.014~1.513; P=0.036) and Q4 group (OR 1.268; 95% CI 1.037~1.549; P=0.021) but not the Q3 group for TT3RI had higher MAFLD risk in comparison with the first group after controlling for confounders. However, no graded positive correlation between TT3RI quartiles and MAFLD risk was found (Table 3). Consistently, the relevance was not discovered between TT4RI, TSHI, TFQIFT4 and MAFLD incidence after adjusting for confounders (all P>0.05, Figure 3).
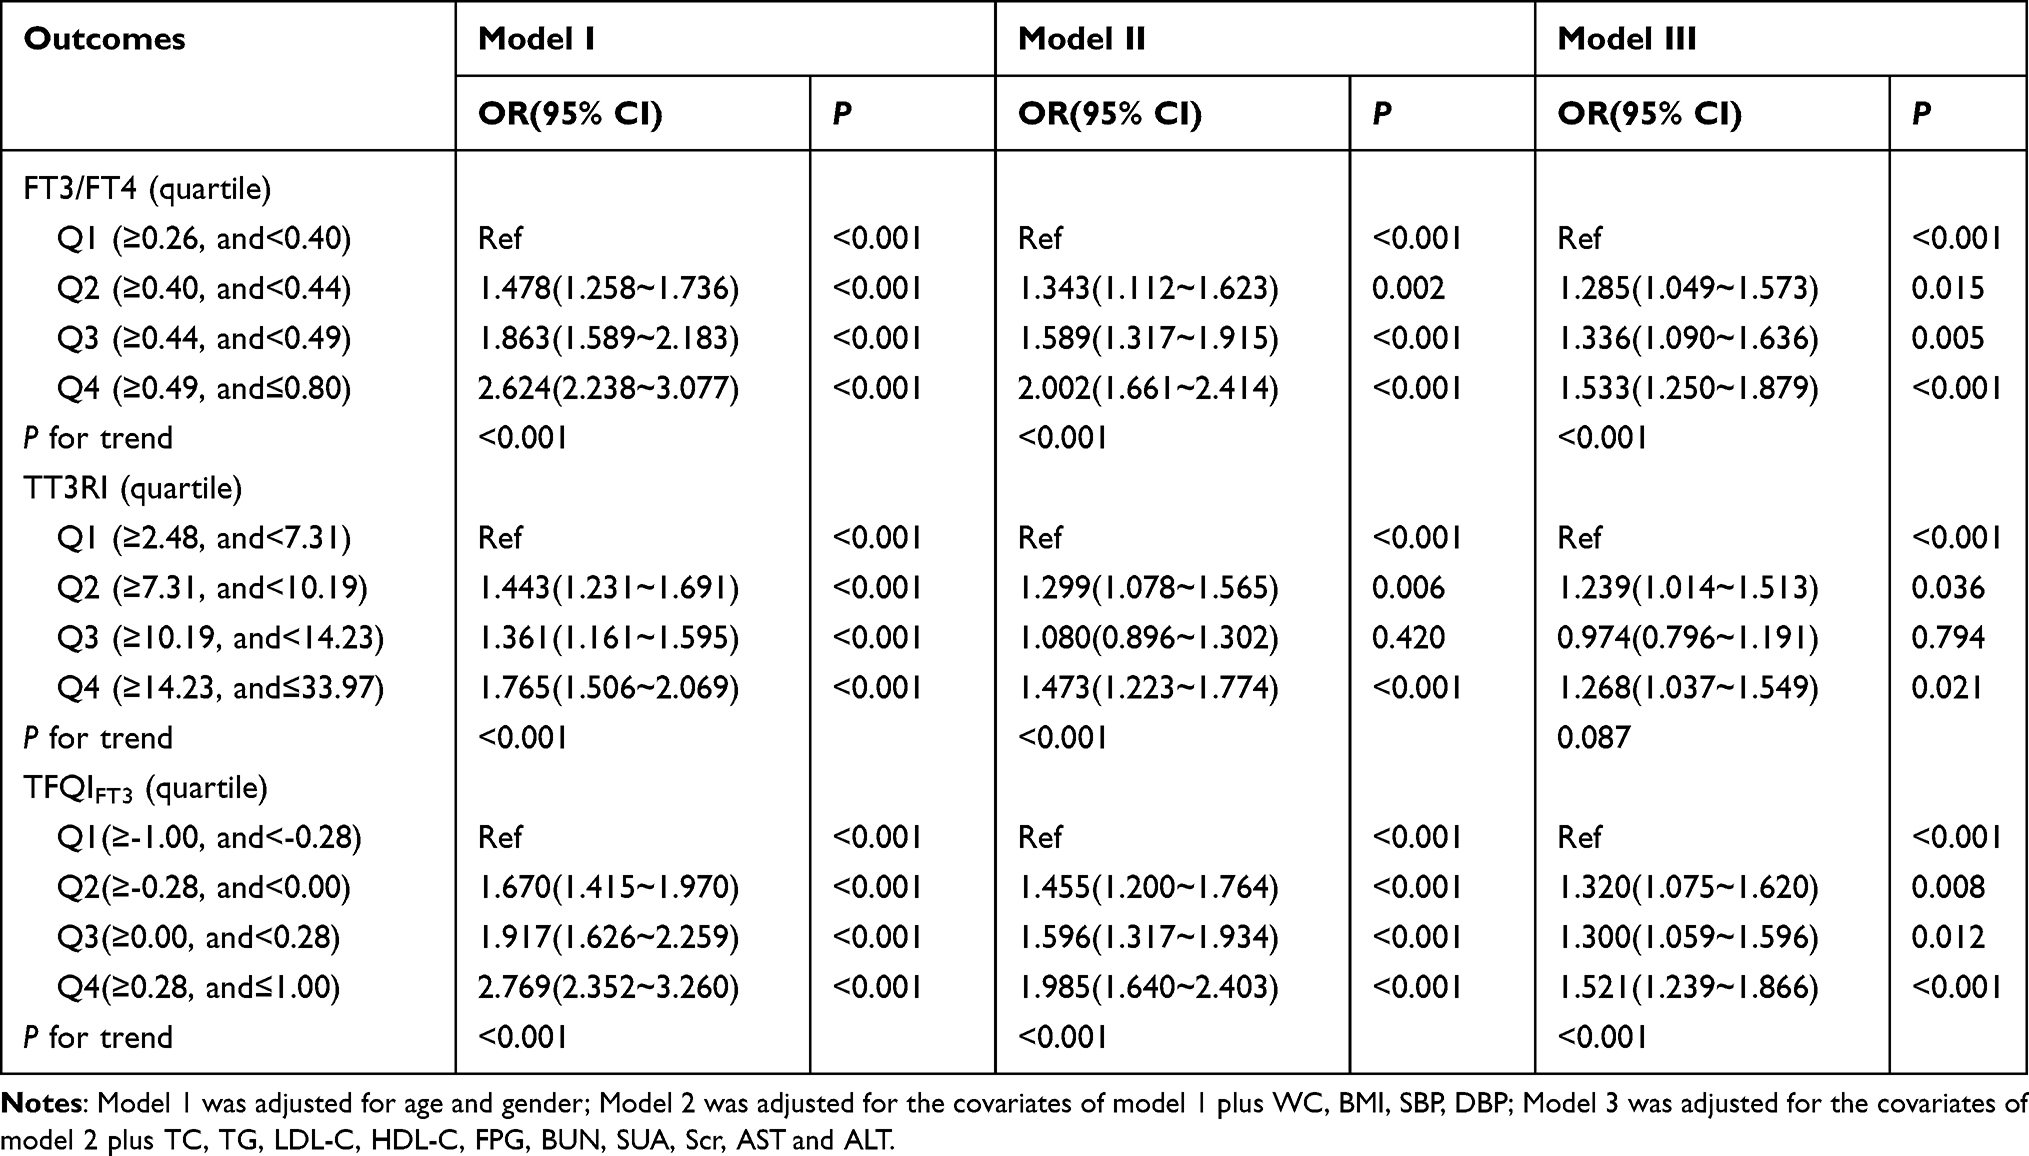 |
Table 3 Logistic Regression Analysis of FT3/FT4, TT3RI and TFQIFT3 Quartiles for the Risk of MAFLD |
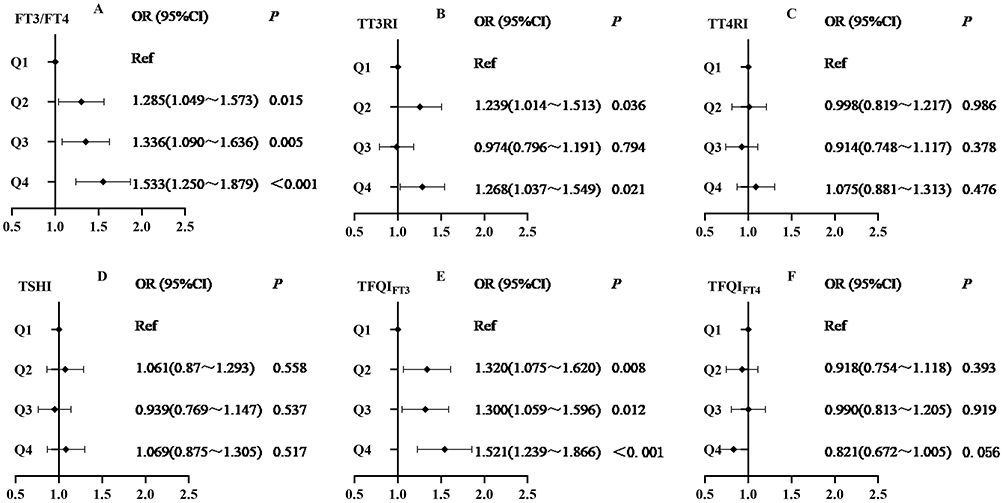 |
Figure 3 Logistic regression analysis of relationship between sensitivity indices to thyroid hormones quartiles and the risk of MAFLD (A) FT3/FT4 quartiles, (B) TT3RI quartiles, (C) TT4RI quartiles, (D) TSHI quartiles, (E) TFQIFT3 quartiles, (F) TFQIFT4 quartiles. The model was adjusted for age, gender, WC, BMI, SBP, DBP, TC, TG, LDL-C, HDL-C, FPG, BUN, SUA, Scr, AST and ALT. |
Subgroup Analyses of the Correlations of FT3/FT4, TFQIFT3 with MAFLD
Subgroup analyses were conducted to ascertain whether or not there were diverse relationships between FT3/FT4, TFQIFT3 and MAFLD with various age, sex, BMI, visceral obesity, and TG. FT3/FT4 with MAFLD risk was more relevant in individuals ≤40 years old and without visceral obesity. Simultaneously, there was a higher correlation between TFQIFT3 and MAFLD among people younger than 40 years old. No other notable interactions were found in subgroup analyses (Table 4).
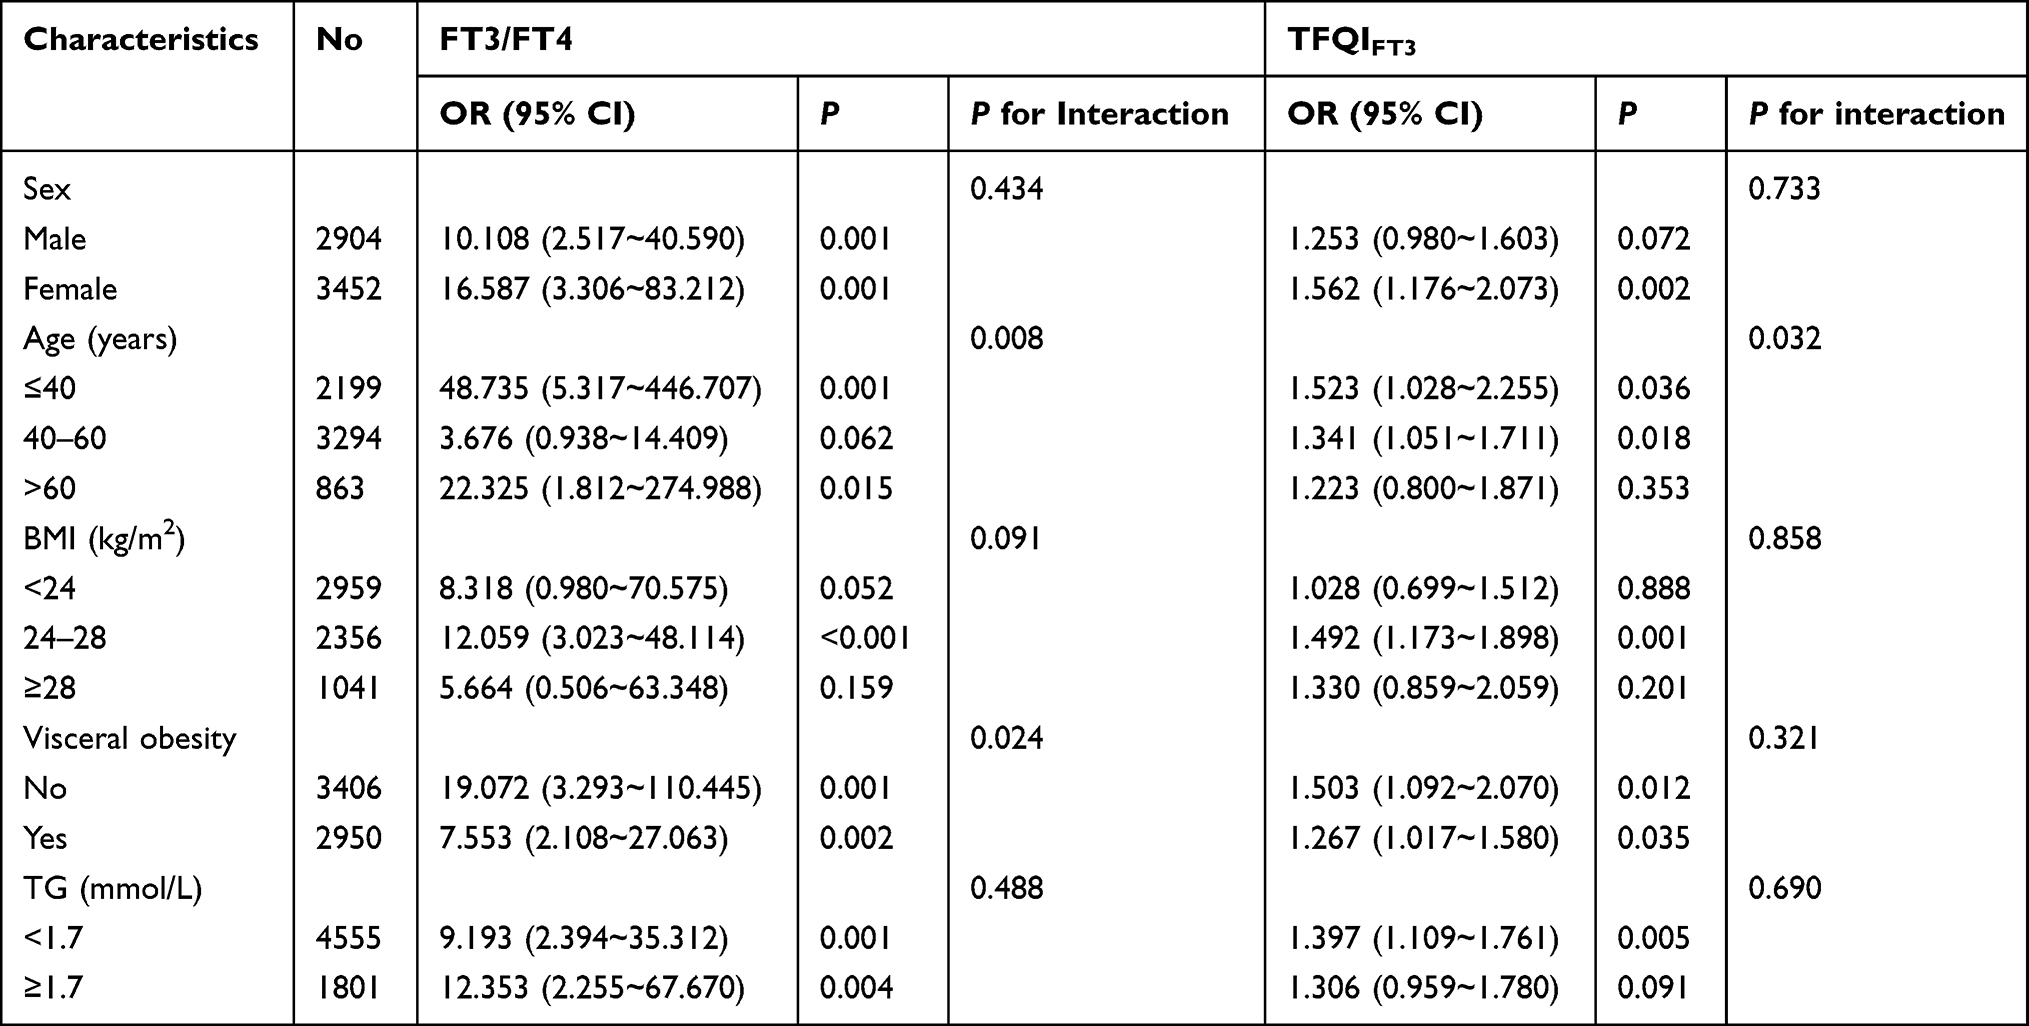 |
Table 4 Subgroup Analysis of the Correlations of FT3/FT4 and TFQIFT3 with MAFLD |
Mesomeric Effect Analyses of TyG Index on Associations Between FT3/FT4, TFQIFT3 and MAFLD
We carried out mediation analyses in order to discuss whether or not TyG index was a mediating factor in the link between FT3/FT4, TFQIFT3 and MAFLD. The research indicated that FT3/FT4, TFQIFT3 and TyG index presented positive correlations with MAFLD. Simultaneously, FT3/FT4 and TFQIFT3 were significantly positively correlative with TyG index. The results expressed underlying mechanisms for TyG index to mediate the connections between FT3/FT4, TFQIFT3 and MAFLD. As the findings reported, FT3/FT4 (β = 2.7820, 95% CI: 1.8979~3.6660) and TFQIFT3 (β = 0.5250, 95% CI: 0.3688~0.6812) had prominent direct influences on MAFLD risk (Figure 4). As Figure 4A displays, TyG index (β = 3.5026, 95% CI: 2.9555~4.0902) incompletely mediated indirect influence of FT3/FT4 on the occurrence of MAFLD. The mediation ratio was 55.73%. TyG index (β = 0.6473, 95% CI: 0.5498~0.7463) also incompletely mediated indirect influence of TFQIFT3 on MAFLD. The mediation proportion was 55.22% in this model (Figure 4B).
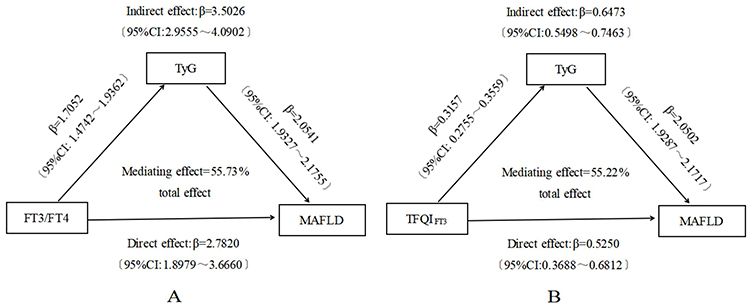 |
Figure 4 Mediation effect of TyG index on the associations between FT3/FT4, TFQIFT3 and MAFLD prevalence (A) FT3/FT4; (B) TFQIFT3. |
Discussion
A growing number of studies have revealed a correlation between THs and MAFLD in individuals with euthyroidism.29–31 The characteristic of our paper was to explore possible correlations of thyroid function with MAFLD by using central and peripheral sensitivity indicators instead of THs. They could supply more messages about the associations between resistance to THs and MAFLD occurrence. Our results revealed that MAFLD prevalence was 34.47% in the euthyroid population. A previous study based on nationwide health examination data demonstrated that from 2009 to 2017, the morbidity of MAFLD rose from 22.75% to 35.58% in China, which was similar to our findings.6
This research showed that the MAFLD group was characterized by higher TT3RI, TFQIFT3 and FT3/FT4 levels in comparison with the non-MAFLD group. The morbidity of MAFLD raised with increasing TFQIFT3 and FT3/FT4 levels when multiple potential confounders were adjusted. From the further analysis, subjects in the highest quartile of TFQIFT3 and FT3/FT4 had the notably highest MAFLD risk compared to the three lower quartile groups, which conformed to the findings of Wan et al.32 The research carried out by Lai et al25 also expressed that TFQIFT3 and FT3/FT4 were closely associated with abnormal blood lipid as well as hepatic steatosis in populations with euthyroidism. This result further provided feasibility for preventing the progression of MAFLD by altering thyroid sensitivity. Nevertheless, one recent research suggested that, for initially diagnosed T2DM individuals with euthyroidism, no associations were found between THs, sensitivity indices to THs and MAFLD after controlling for BMI and homeostatic model assessment for insulin resistance (HOMA-IR).29 The heterogeneity of the criteria and population for euthyroidism might partly illustrate the differences among these studies. Our study expressed that the relevance of FT3/FT4 and MAFLD was stronger among those whose age ≤40 years and had non-visceral obesity. And the interrelation between TFQIFT3 and MAFLD was stronger in subjects whose age ≤40 years. It might be related to the excessive consumption of fatty food and the lack of moderate physical exercise in young participants.33
The underlying mechanisms of relationships between sensitivity indices to THs and MAFLD stay entirely unknown, but may contain chronic inflammation, dysregulation of mitochondrial homeostasis, endoplasmic reticulum stress and decreased insulin sensitivity.34–38 Chronic inflammation was considered to be one of the key pathogenesis of MAFLD and could promote the incidence of MAFLD.35 Studies revealed that low FT4 was related to higher levels of inflammatory biomarkers (eg, tumor necrosis factor alpha (TNF-α), interleukin (IL)-1, IL-6 and interferon-γ).38–40 Low-normal FT4 also could influence pro-inflammatory pathways and exacerbate liver fatty infiltration.38 Alternatively, obesity was considered the main danger for the progress of MAFLD.41,42 Laclaustra et al18 proposed that TFQI was closely related to obesity. Due to obesity, fat accumulation occured in hepatic tissue, which led to the imbalance between pro-inflammatory and anti-inflammatory adipose cytokines.43 Inflammation may also lead to mitochondrial damage, which induces incomplete lipid oxidation and the production of toxic lipid intermediates, ultimately promoting the development of liver steatosis to more serious diseases.44 Abnormal lipid accumulation in hepatocytes was also usually correlated with disruption of the endoplasmic reticulum (ER) stress. High FT3 may upregulate the expression of endoplasmic reticulum-associated proteins, and cause ER stress and IR.34 In response to ER stress, the unfolded protein response was triggered to cause inflammation, inflammasome activation, and the death of hepatocytes.45,46 Furthermore, studies indicated that hepatic abnormal accumulation of lipids was consistent with insulin resistance.47,48 IR was recognized as one of the potential pathogenic mechanisms of MAFLD. The expressions of β2 adrenergic receptor (β2AR) and peroxisome proliferatore-activated receptors (PPAR) triggered by THs could influence insulin sensitivity and promote the progression of MAFLD.49,50 Loria et al51 detected a positively significant correlation between FT3/FT4 and HOMA-IR in patients with NAFLD. Corica et al19 also found that elevated central resistance to THs was markedly correlative with the severity of IR in obese children before puberty. The reduced sensitivity to THs is also related to an increase in adipocyte fatty acid-binding protein (A-FABP), which promotes the progression of MAFLD by binding to free fatty acids (FFAs).52 Besides, some investigators have speculated that THs may induce activation of hepatic stellate cells (HSC) as well as hepatic fibrogenesis to accelerate the development of liver fibrosis.53
TyG index, a product of FPG and fasting TG, was developed as an accurate alternative marker for IR.54,55 Accumulating evidence has demonstrated that elevated TyG index could contribute to the incidence of T2DM,56 MAFLD,57,58 liver fibrosis59 and CVD.60 In our study, a strongly positive correlation between TyG index and MAFLD risk was found, which affirmed the above-mentioned viewpoint. FT3/FT4 and TFQIFT3 were also positively correlative with TyG index. Further analyses of the mediation effect suggested that the relevance of FT3/FT4, TFQIFT3 and MAFLD prevalence were partly mediated by TyG index in the population with euthyroidism, which further elucidated that IR might be the underlying pathway of correlations between sensitivity indices to THs and MAFLD risk.
Our research had a few underlying restrictions. Firstly, inferences regarding the causality between FT3/FT4, TFQIFT3 and MAFLD could not be defined owing to the single-institution cross-section study design. Secondly, the homogeneous ethnicity of this cohort raised questions about universal applicability of our results. In the next, multiracial longitudinal researches are required to deeply explore related possibilities between FT3/FT4, TFQIFT3 and MAFLD. Thirdly, it lacked histological confirmation in the diagnosis of fatty liver by abdominal ultrasound. Finally, data on eating habits, sports hobbies, and job categories have not been collected, so the results of this study had certain limitations in providing in-depth guidance on these aspects.
Conclusion
In summary, our study indicated that elevated FT3/FT4 and TFQIFT3 levels significantly correlated with MAFLD prevalence in euthyroid participants. FT3/FT4 with MAFLD risk was more relevant in individuals less than 40 years old and without visceral obesity. Simultaneously, there was higher correlation between TFQIFT3 and MAFLD among people younger than 40 years old. And TyG index partly mediated the associations between FT3/FT4, TFQIFT3 and MAFLD. Based on these results, the prevention and treatment of MAFLD by improving sensitivity to thyroid hormones and IR may be applied in new clinical practice.
Data Sharing Statement
The raw stats can be obtained via E-mail at all times (Huanxin Liu: [email protected]).
Funding
Our research was funded by Hebei Medical Science Research Project (20230302).
Disclosure
The authors report no conflicts of interest in this research.
References
1. Eslam M, Newsome PN, Sarin SK, et al. A new definition for metabolic dysfunction-associated fatty liver disease: an international expert consensus statement. J Hepatol. 2020;73(1):202–209. doi:10.1016/j.jhep.2020.03.039
2. Younossi ZM, Koenig AB, Abdelatif D, et al. Global epidemiology of nonalcoholic fatty liver disease—meta-analytic assessment of prevalence, incidence, and outcomes. Hepatology. 2016;64(1):73–84. doi:10.1002/hep.28431
3. Liu J, Ayada I, Zhang X, et al. Estimating global prevalence of metabolic dysfunction-associated fatty liver disease in overweight or obese adults. Clin Gastroenterol Hepatol. 2022;20(3):e573–e582. doi:10.1016/j.cgh.2021.02.030
4. Yamamura S, Eslam M, Kawaguchi T, et al. MAFLD identifies patients with significant hepatic fibrosis better than NAFLD. Liver Int. 2020;40(12):3018–3030. doi:10.1111/liv.14675
5. Chen VL, Yeh ML, Yang JD, et al. Effects of cirrhosis and diagnosis scenario in metabolic-associated fatty liver disease-related hepatocellular carcinoma. Hepatol Commun. 2021;5(1):122–132. doi:10.1002/hep4.1606
6. Lei F, Qin JJ, Song X, et al. The prevalence of MAFLD and its association with atrial fibrillation in a nationwide health check-up population in China. Front Endocrinol. 2022;13:1007171. doi:10.3389/fendo.2022.1007171
7. Yoneda M, Yamamoto T, Honda Y, et al. Risk of cardiovascular disease in patients with fatty liver disease as defined from the metabolic dysfunction associated fatty liver disease or nonalcoholic fatty liver disease point of view: a retrospective nationwide claims database study in Japan. J Gastroenterol. 2021;56(11):1022–1032. doi:10.1007/s00535-021-01828-6
8. Xie ZQ, Li HX, Wang BK, et al. Trends in prevalence and all-cause mortality of metabolic dysfunction-associated fatty liver disease among adults in the past three decades: results from the NHANES study. Eur J Intern Med. 2023;110:62–70. doi:10.1016/j.ejim.2023.01.029
9. Kim D, Konyn P, Sandhu KK, et al. Metabolic dysfunction-associated fatty liver disease is associated with increased all-cause mortality in the United States. J Hepatol. 2021;75(6):1284–1291. doi:10.1016/j.jhep.2021.07.035
10. Sinha RA, Singh BK, Yen PM. Direct effects of thyroid hormones on hepatic lipid metabolism. Nat Rev Endocrinol. 2018;14(5):259–269. doi:10.1038/nrendo.2018.10
11. Xu C, Xu L, Yu C, et al. Association between thyroid function and nonalcoholic fatty liver disease in euthyroid elderly Chinese. Clin Endocrinol. 2011;75(2):240–246. doi:10.1111/j.1365-2265.2011.04016.x
12. Ludwig U, Holzner D, Denzer C, et al. Subclinical and clinical hypothyroidism and non-alcoholic fatty liver disease: a cross-sectional study of a random population sample aged 18 to 65 years. BMC Endocr Disord. 2015;15(1):41. doi:10.1186/s12902-015-0030-5
13. Chung GE, Kim D, Kim W, et al. Non-alcoholic fatty liver disease across the spectrum of hypothyroidism. J Hepatol. 2012;57(1):150–156. doi:10.1016/j.jhep.2012.02.027
14. Tao Y, Gu H, Wu J, et al. Thyroid function is associated with non-alcoholic fatty liver disease in euthyroid subjects. Endocr Res. 2015;40(2):74–78. doi:10.3109/07435800.2014.952014
15. Ittermann T, Haring R, Wallaschofski H, et al. Inverse association between serum free thyroxine levels and hepatic steatosis: results from the study of health in Pomerania. Thyroid. 2012;22(6):568–574. doi:10.1089/thy.2011.0279
16. Hu DS, Zhu SH, Liu WY, et al. PNPLA3 polymorphism influences the association between high-normal TSH level and NASH in euthyroid adults with biopsy-proven NAFLD. Diabetes Metab. 2020;46(6):496–503. doi:10.1016/j.diabet.2020.02.001
17. Guo W, Qin P, Li XN, et al. Free triiodothyronine is associated with hepatic steatosis and liver stiffness in euthyroid Chinese adults with non-alcoholic fatty liver disease. Front Endocrinol. 2021;12:711956. doi:10.3389/fendo.2021.711956
18. Laclaustra M, Moreno-Franco B, Lou-Bonafonte JM, et al. Impaired sensitivity to thyroid hormones is associated with diabetes and metabolic syndrome. Diabetes Care. 2019;42(2):303–310. doi:10.2337/dc18-1410
19. Corica D, Licenziati MR, Calcaterra V, et al. Central and peripheral sensitivity to thyroid hormones and glucose metabolism in prepubertal children with obesity: pilot multicenter evaluation. Endocrine. 2023;80(2):308–311. doi:10.1007/s12020-022-03276-5
20. Li R, Zhou L, Chen C, et al. Sensitivity to thyroid hormones is associated with advanced fibrosis in euthyroid patients with non-alcoholic fatty liver disease: a cross-sectional study. Dig Liver Dis. 2023;55(2):254–261. doi:10.1016/j.dld.2022.06.021
21. Yang S, Lai S, Wang Z, et al. Thyroid feedback quantile-based index correlates strongly to renal function in euthyroid individuals. Ann Med. 2021;53(1):1945–1955. doi:10.1080/07853890.2021.1993324
22. Sun H, Zhu W, Liu J, et al. Reduced sensitivity to thyroid hormones is associated with high remnant cholesterol levels in Chinese euthyroid adults. J Clin Endocrinol Metab. 2022;108(1):166–174. doi:10.1210/clinem/dgac523
23. Mehran L, Delbari N, Amouzegar A, et al. Reduced sensitivity to thyroid hormone is associated with diabetes and hypertension. J Clin Endocrinol Metab. 2022;107(1):167–176. doi:10.1210/clinem/dgab646
24. Gökmen FY, Ahbab S, Ataoğlu HE, et al. FT3/FT4 ratio predicts non-alcoholic fatty liver disease independent of metabolic parameters in patients with euthyroidism and hypothyroidism. Clinics. 2016;71(4):221–225. doi:10.6061/clinics/2016(04)08
25. Lai S, Li J, Wang Z, et al. Sensitivity to thyroid hormone indices are closely associated with NAFLD. Front Endocrinol. 2021;12:766419. doi:10.3389/fendo.2021.766419
26. Yagi H, Pohlenz J, Hayashi Y, et al. Resistance to thyroid hormone caused by two mutant thyroid hormone receptors beta, R243Q and R243W, with marked impairment of function that cannot be explained by altered in vitro 3,5,3’-triiodothyroinine binding affinity. J Clin Endocrinol Metab. 1997;82(5):1608–1614. doi:10.1210/jcem.82.5.3945
27. Jostel A, Ryder WD, Shalet SM. The use of thyroid function tests in the diagnosis of hypopituitarism: definition and evaluation of the TSH index. Clin Endocrinol. 2009;71(4):529–534. doi:10.1111/j.1365-2265.2009.03534.x
28. Zhang S, Du T, Zhang J, et al. The triglyceride and glucose index (TyG) is an effective biomarker to identify nonalcoholic fatty liver disease. Lipids Health Dis. 2017;16(1):15. doi:10.1186/s12944-017-0409-6
29. Zhang X, Chen Y, Ye H, et al. Correlation between thyroid function, sensitivity to thyroid hormones and metabolic dysfunction-associated fatty liver disease in euthyroid subjects with newly diagnosed type 2 diabetes. Endocrine. 2023;80(2):366–379. doi:10.1007/s12020-022-03279-2
30. Chen YL, Tian S, Wu J, et al. Impact of thyroid function on the prevalence and mortality of metabolic dysfunction-associated fatty liver disease. J Clin Endocrinol Metab. 2023;108(7):e434–e443. doi:10.1210/clinem/dgad016
31. Marschner RA, Arenhardt F, Ribeiro RT, et al. Influence of altered thyroid hormone mechanisms in the progression of metabolic dysfunction associated with fatty liver disease (MAFLD): a systematic review. Metabolites. 2022;12(8):675. doi:10.3390/metabo12080675
32. Wan H, Yu G, Xu S, et al. Central sensitivity to free triiodothyronine with MAFLD and its progression to liver fibrosis in euthyroid adults. J Clin Endocrinol Metab. 2023. doi:10.1210/clinem/dgad186
33. Correa-Rodriguez M, Gonzalez-Jimenez E, Fernandez-Aparicio A, et al. Dietary energy density is associated with body mass index and fat mass in early adulthood. Clin Nurs Res. 2021;30(5):591–598. doi:10.1177/1054773819883192
34. Bektur AN, Sahin E, Kacar S, et al. Investigation of the effect of hyperthyroidism on endoplasmic reticulum stress and tran-sient receptor potential canonical 1 channel in the kidney. Turk J Med Sci. 2021;51(3):1554–1563. doi:10.3906/sag-2007-109
35. Lim S, Kim JW, Targher G. Links between metabolic syndrome and metabolic dysfunction-associated fatty liver disease. Trends Endocrinol Metab. 2021;32(7):500–514. doi:10.1016/j.tem.2021.04.008
36. Taylor PN, Razvi S, Pearce SH, et al. Clinical review: a review of the clinical consequences of variation in thyroid function within the reference range. J Clin Endocrinol Metab. 2013;98(9):3562–3571. doi:10.1210/jc.2013-1315
37. Sinha RA, Yen PM. Thyroid hormone-mediated autophagy and mitochondrial turnover in NAFLD. Cell Biosci. 2016;6(1):46. doi:10.1186/s13578-016-0113-7
38. van Tienhoven-Wind LJ, Dullaart RP. Tumor necrosis factor-alpha is inversely related to free thyroxine in euthyroid subjects without diabetes. Horm Metab Res. 2017;49(2):95–102. doi:10.1055/s-0042-119211
39. Marchiori RC, Pereira LA, Naujorks AA, et al. Improvement of blood inflammatory marker levels in patients with hypothyroidism under levothyroxine treatment. BMC Endocr Disord. 2015;15:32. doi:10.1186/s12902-015-0032-3
40. Milani AT, Khadem-Ansari MH, Rasmi Y. Effects of thyroxine on adhesion molecules and proinflammatory cytokines secretion on human umbilical vein endothelial cells. Res Pharm Sci. 2019;14(3):237–246. doi:10.4103/1735-5362.258490
41. Souza-Mello V. Peroxisome proliferator-activated receptors as targets to treat non-alcoholic fatty liver disease. World J Hepatol. 2015;7(8):1012–1019. doi:10.4254/wjh.v7.i8.1012
42. Bugianesi E, Gastaldelli A, Vanni E, et al. Insulin resistance in non-diabetic patients with non-alcoholic fatty liver disease: sites and mechanisms. Diabetologia. 2005;48(4):634–642. doi:10.1007/s00125-005-1682-x
43. Könner AC, Brüning JC. Toll-like receptors: linking inflammation to metabolism. Trends Endocrinol Metab. 2011;22(1):16–23. doi:10.1016/j.tem.2010.08.007
44. Hribal ML, Procopio T, Petta S, et al. Insulin-like growth factor-I, inflammatory proteins, and fibrosis in subjects with nonalcoholic fatty liver disease. J Clin Endocrinol Metab. 2013;98(2):E304–E308. doi:10.1210/jc.2012-3290
45. Filali-Mouncef Y, Hunter C, Roccio F, et al. The ménage à trois of autophagy, lipid droplets and liver disease. Autophagy. 2022;18(1):50–72. doi:10.1080/15548627.2021.1895658
46. Lebeaupin C, Vallee D, Hazari Y, et al. Endoplasmic reticulum stress signalling and the pathogenesis of non-alcoholic fatty liver disease. J Hepatol. 2018;69(4):927–947. doi:10.1016/j.jhep.2018.06.008
47. Kammoun HL, Chabanon H, Hainault I, et al. GRP78 expression inhibits insulin and ER stress-induced SREBP-1c activation and reduces hepatic steatosis in mice. J Clin Invest. 2009;119(5):1201–1215. doi:10.1172/JCI37007
48. Nakatani Y, Kaneto H, Kawamori D, et al. Involvement of endoplasmic reticulum stress in insulin resistance and diabetes. J Biol Chem. 2005;280(1):847–851. doi:10.1074/jbc.M411860200
49. Frederiksen L, Brodbaek K, Fenger M, et al. Comment: studies of the Pro12Ala polymorphism of the PPAR-gamma gene in the Danish MONICA cohort: homozygosity of the Ala allele confers a decreased risk of the insulin resistance syndrome. J Clin Endocrinol Metab. 2002;87(8):3989–3992. doi:10.1210/jcem.87.8.873
50. Sakurai Y, Kubota N, Yamauchi T, et al. Role of insulin resistance in MAFLD. Int J Mol Sci. 2021;22(8):4156. doi:10.3390/ijms22084156
51. Loria P, Lonardo A, Anania F. Liver and diabetes. A vicious circle. Hepatol Res. 2013;43(1):51–64. doi:10.1111/j.1872-034X.2012.01031.x
52. Nie X, Ma X, Xu Y, et al. Increased serum adipocyte fatty acid-binding protein levels are associated with decreased sensitivity to thyroid hormones in the Euthyroid population. Thyroid. 2020;30(12):1718–1723. doi:10.1089/thy.2020.0011
53. Zvibel I, Atias D, Phillips A, et al. Thyroid hormones induce activation of rat hepatic stellate cells through increased expression of p75 neurotrophin receptor and direct activation of Rho. Lab Invest. 2010;90(5):674–684. doi:10.1038/labinvest.2010.48
54. Simental-Mendia LE, Rodriguez-Moran M, Guerrero-Romero F. The product of fasting glucose and triglycerides as surrogate for identifying insulin resistance in apparently healthy subjects. Metab Syndr Relat Disord. 2008;6(4):299–304. doi:10.1089/met.2008.0034
55. Du T, Yuan G, Zhang M, et al. Clinical usefulness of lipid ratios, visceral adiposity indicators, and the triglycerides and glucose index as risk markers of insulin resistance. Cardiovasc Diabetol. 2014;13(1):146. doi:10.1186/s12933-014-0146-3
56. Low S, Khoo K, Irwan B, et al. The role of triglyceride glucose index in development of type 2 diabetes mellitus. Diabetes Res Clin Pract. 2018;143:43–49. doi:10.1016/j.diabres.2018.06.006
57. Zhang R, Guan Q, Zhang M, et al. Association between triglyceride-glucose index and risk of metabolic dysfunction-associated fatty liver disease: a cohort study. Diabetes Metab Syndr Obes. 2022;15:3167–3179. doi:10.2147/DMSO.S383907
58. Taheri E, Pourhoseingholi MA, Moslem A, et al. The triglyceride-glucose index as a clinical useful marker for metabolic associated fatty liver disease (MAFLD): a population-based study among Iranian adults. J Diabetes Metab Disord. 2022;21(1):97–107. doi:10.1007/s40200-021-00941-w
59. Tutunchi H, Naeini F, Mobasseri M, et al. Triglyceride glucose (TyG) index and the progression of liver fibrosis: a cross-sectional study. Clin Nutr ESPEN. 2021;44:483–487. doi:10.1016/j.clnesp.2021.04.025
60. Sánchez-íñigo L, Navarro-González D, Fernández-Montero A, et al. The TyG index may predict the development of cardiovascular events. Eur J Clin Invest. 2016;46(2):189–197. doi:10.1111/eci.12583
 © 2023 The Author(s). This work is published and licensed by Dove Medical Press Limited. The
full terms of this license are available at https://www.dovepress.com/terms
and incorporate the Creative Commons Attribution
- Non Commercial (unported, 3.0) License.
By accessing the work you hereby accept the Terms. Non-commercial uses of the work are permitted
without any further permission from Dove Medical Press Limited, provided the work is properly
attributed. For permission for commercial use of this work, please see paragraphs 4.2 and 5 of our Terms.
© 2023 The Author(s). This work is published and licensed by Dove Medical Press Limited. The
full terms of this license are available at https://www.dovepress.com/terms
and incorporate the Creative Commons Attribution
- Non Commercial (unported, 3.0) License.
By accessing the work you hereby accept the Terms. Non-commercial uses of the work are permitted
without any further permission from Dove Medical Press Limited, provided the work is properly
attributed. For permission for commercial use of this work, please see paragraphs 4.2 and 5 of our Terms.