")
Back to Journals » International Journal of Chronic Obstructive Pulmonary Disease » Volume 13
Association between respiratory impedance measured by forced oscillation technique and exacerbations in patients with COPD
Authors Yamagami H, Tanaka A, Kishino Y , Mikuni H, Kawahara T, Ohta S, Yamamoto M, Suzuki S , Ohnishi T, Sagara H
Received 18 July 2017
Accepted for publication 12 November 2017
Published 22 December 2017 Volume 2018:13 Pages 79—89
DOI https://doi.org/10.2147/COPD.S146669
Checked for plagiarism Yes
Review by Single anonymous peer review
Peer reviewer comments 2
Editor who approved publication: Dr Richard Russell
Hitomi Yamagami, Akihiko Tanaka, Yasunari Kishino, Hatsuko Mikuni, Tomoko Kawahara, Shin Ohta, Mayumi Yamamoto, Shintaro Suzuki, Tsukasa Ohnishi, Hironori Sagara
Division of Respiratory Medicine and Allergology, Department of Medicine, School of Medicine, Showa University, Tokyo, Japan
Background: It is well known that increased airflow limitation as measured by spirometry is associated with the risk of exacerbation in patients with COPD. The forced oscillation technique (FOT) is a noninvasive method used to assess respiratory impedance (resistance and reactance) with minimal patient cooperation required. The clinical utility of the FOT in assessing the risk of exacerbations of COPD is yet to be determined. We examined the relationship between respiratory impedance as measured by FOT and exacerbations in patients with COPD.
Materials and methods: Among 310 patients with COPD (Global Initiative for Chronic Obstructive Lung Disease stages I–IV) who presented at the outpatient clinic of the Showa University Hospital from September 2014 through January 2015, 119 were collected and assigned into 2 groups according to their history of exacerbation: exacerbators and nonexacerbators. Respiratory resistance components and respiratory reactance components, as measured by FOT, were compared between the two groups.
Results: Exacerbators were significantly older and had a higher white blood cell count than nonexacerbators. Resistance at 20 Hz, reactance at 5 Hz (X5), resonant frequency (Fres), and area of low reactance (ALX) differed significantly between the two groups. In addition, among patients with stage II COPD, there were significant differences in X5, Fres, and ALX between the two groups despite no significant differences in respiratory function as assessed by spirometry. Finally, receiver operating characteristic curve analysis revealed that the reactance components rather than the resistance components were associated with the risk of exacerbation.
Conclusion: There were significant differences in respiratory impedance between exacerbators and nonexacerbators in patients with moderate COPD. FOT is a promising tool for assessing future exacerbations in patients with COPD.
Keywords: forced oscillation technique, respiratory system resistance and reactance, spirometry
Introduction
It is increasingly recognized that exacerbation is a key event in COPD because of its significant negative impacts on patients’ quality of life and poor prognosis.1–3 It was reported that exacerbations are associated with accelerated lung function loss in patients with COPD, particularly those with mild disease.4 Many studies have reported that an increased frequency of exacerbation is associated with more severe airflow obstruction in patients with COPD.5,6 Bronchial wall thickness and total lung emphysema percentage were associated with COPD exacerbation frequency.7 The clinical symptoms of cough and sputum are associated with the frequency of exacerbation.8,9 Among clinical parameters, a history of frequent exacerbations in the previous year is the most important and independent predictor of exacerbation in the following year.9 Identification of risk factors for exacerbation of COPD is clinically important because it enables adequate precautionary measures, such as pharmacologic therapy and vaccine, in patients predisposed to COPD exacerbation.
The forced oscillation technique (FOT) is a noninvasive procedure that measures lung mechanics using sinusoidal sound waves at two or three different frequencies simultaneously. FOT parameters of respiratory system resistance (Rrs) and respiratory system reactance (Xrs) were measured by the application of a sine wave of airflow to the mouth at the resonant frequency of the respiratory system according to the principle established by Fisher et al.10 Rrs components include the resistance at 5 Hz (R5), the resistance at 20 Hz (R20), and the difference between R5 and R20 (R5-R20). Xrs components include the reactance at 5 Hz (X5), the differences between inspiratory and expiratory Xrs (ΔXrs), the resonant frequency (Fres), and the area of low reactance (ALX). FOT represents an alternative modality to conventional pulmonary function tests because of its sensitivity in detecting peripheral airway obstruction. In addition, it can be performed independent of the patient’s efforts with minimal need for their cooperation.11,12 Therefore, FOT can be used in elderly patients and those with physical and cognitive limitations, and it would be helpful for these patients if FOT can detect exacerbations of COPD.
The utility of FOT has been reported most frequently in relation to asthma and COPD. Respiratory impedance (Rrs and Xrs) in patients with COPD is generally correlated with Global Initiative for Chronic Obstructive Lung Disease (GOLD) staging, classified according to the degree of airway obstruction.13 Moreover, FOT can detect the pharmacologic effects of bronchodilators on small airways in patients with COPD despite an absence of change in forced expiratory volume in 1 second (FEV1).14 ΔXrs, particularly ΔX5, can be used for discrimination between COPD and asthma15,16 or for detection of expiratory flow limitation (EFL) that indicates dynamic hyperinflation in COPD.17,18 In a previous study, it was reported that increased Rrs is associated with frequent exacerbations in severe asthma.19 However, the association between respiratory impedance and exacerbations in patients with COPD has not been determined.
We hypothesized that respiratory impedance as assessed by FOT is associated with the increased risk of exacerbations independently from respiratory parameters as measured by conventional spirometry in patients with COPD. To prove this hypothesis, we evaluated the relationship between respiratory impedance as measured by FOT and the risk of exacerbation in patients with COPD.
Materials and methods
Subjects and study design
This was a single-centered, retrospective case–control study. The analysis was based on data obtained from 310 patients with COPD (defined by GOLD) who presented at Showa University Hospital (Tokyo, Japan) from September 2014 through January 2015. All patients were confirmed that their FEV1/forced vital capacity ratio (FEV1/FVC) <0.7. As shown in Figure 1, we excluded some of the patients for the following reasons: 142 patients concurrently had chronic respiratory disease, 4 patients were receiving regularly oral corticosteroid therapy, and 45 patients did not undergo respiratory function testing. The remaining 119 patients fulfilled our study criteria and were assigned into 2 groups: patients who had one or more exacerbations within the past 2 years from the last visit (Exacerbators) and patients who had no exacerbations within the past 2 years from the last visit (Nonexacerbators). We defined an exacerbation as an acute event that fulfilled the following criteria:20 1) clinically significant change in baseline dyspnea, cough, and/or sputum, 2) presentation at the emergency department because of a need to receive oral corticosteroids or systemic corticosteroid therapy.
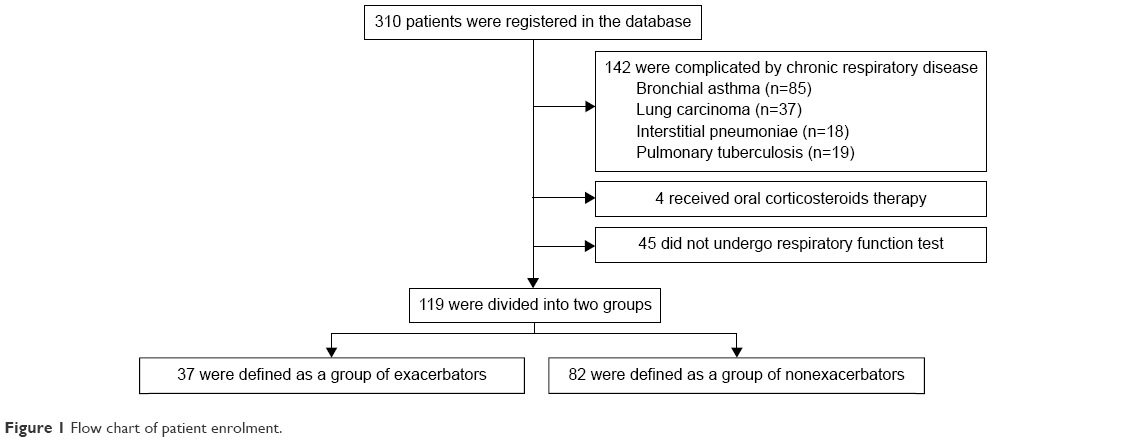 | Figure 1 Flow chart of patient enrolment. |
We collected data including exacerbations, age, gender, height, body weight, smoking history, blood counts, medical history, and respiratory function from the 119 patients. The white blood cell (WBC) count, absolute eosinophil count, and relative eosinophil count were determined within 5 months before enrollment. The blood counts measured when the patients had infectious diseases were excluded. FOT and spirometry were also performed when the patients were free from infectious diseases and exacerbations for at least 2 months.
The study was performed in accordance with the principles of the Declaration of Helsinki. The protocol was approved by the ethics committee of Showa University School of Medicine on March 25, 2016 (No 2029), and all subjects gave their written informed consent.
FOT
Rrs and Xrs were assessed by FOT (Mostgraph-01, Chest MI, Inc., Tokyo, Japan) in all subjects. All FOT assessments were performed by skilled clinical laboratory technicians. FOT was performed before spirometry in all patients to avoid bronchospasm caused by forceful expiration and inspiration. The subjects were requested to sit down, slightly stretch their neck, wear a nose clip, and put a mouthpiece into their mouth, without leaving any space between the lips and the mouthpiece. During impedance measurements, all subjects held their cheeks firmly with their hands. The measurement was conducted three times in a row, and the best data were adopted. We accepted resting ventilation with a coherence of 0.7 or higher and excluded the value when resting ventilation was unstable with patients’ coughing, swallowing, phonation, or breath holding.11
Spirometry
Respiratory function was assessed with the use of a spirometer (CHESTAC-8900, Chest MI, Inc., Tokyo, Japan) in all subjects. The forced expiration maneuver was conducted with the subject in a standing position. Measurements were obtained in accordance with the guidelines for pulmonary function tests issued by the Japanese Respiratory Society.
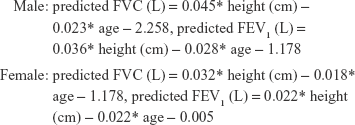
% predicted FVC and % predicted FEV1 were calculated with new prediction equations of FVC and FEV1 provided by the Japanese Respiratory Society in 2001.21 Each equation is shown in the following:
|
Statistical analyses
We performed all statistical analyses using JMP version 12 software (SAS Institute Inc., Cary, NC, USA). The statistical significance of differences in the continuous variables between the Exacerbators and Nonexacerbators was assessed according to standard statistical criteria with the use of the Wilcoxon rank sum test or Kruskal–Wallis test, and the differences in the categorical variables were analyzed using the Pearson χ2 test. The analyses of FOT parameters are adjusted for age, gender, height, and smoking status. To study the sensitivity and specificity of different parameters for the detection of exacerbations, receiver operating characteristic (ROC) curves were analyzed. The results are presented as numbers, percentages, and median (interquartile range). Two-sided P-values of <0.05 were considered to indicate statistical significance.
Results
Patients
We studied 119 patients who fulfilled the study criteria. The characteristics of the study patients are summarized in Table 1. The patients’ median age was 73.0 (67.0, 79.0) years, and 106 (89%) of them were men. Among the 119 patients, 37 (31.1%) were in Exacerbators and 82 (68.9%) were in Nonexacerbators (Figure 1). Exacerbators were significantly older (76.0 [71.0, 82.0] vs 72.5 [66.0, 79.0], P=0.029) and had a higher WBC count (6,900.0 [5,700.0, 8,800.0] vs 6,150.0 [5,100.0, 7,000.0], P=0.013) than Nonexacerbators. The proportion of patients receiving triple therapy was significantly higher in Exacerbators than in Nonexacerbators (27% vs 12%, P=0.045).
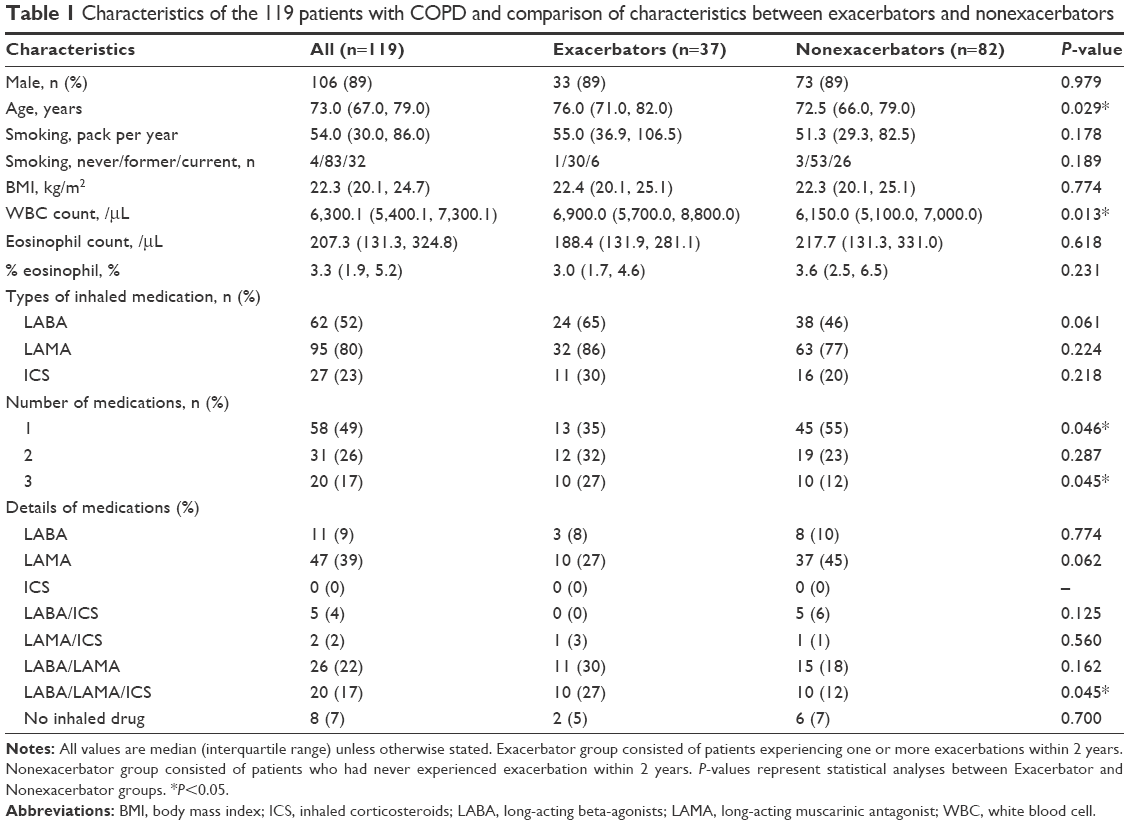 | Table 1 Characteristics of the 119 patients with COPD and comparison of characteristics between exacerbators and nonexacerbators |
Among the 119 patients, 35 (29.4%) were classified as GOLD stage I, 47 (39.5%) were as GOLD stage II, and 37 (31.1%) were as GOLD stages III and IV. Comparisons of clinical characteristics between Exacerbators and Nonexacerbators according to the subgroups are shown in Table 2. Among patients with stage II, the proportions of patients receiving inhaled corticosteroids (35% vs 10%, P=0.034) and triple therapy (29% vs 0%, P=0.002) were significantly higher in Exacerbators than in Nonexacerbators. In addition, among patients with stage III and IV, Exacerbators’ history indicated more pack-years of smoking than Nonexacerbators (80.0 [50.0, 129.0] vs 53.0 [36.8, 84.8], P=0.013). There were no other significant differences in other variables or outcomes between Exacerbators and Nonexacerbators in patients with stage I, stage II, and III and IV.
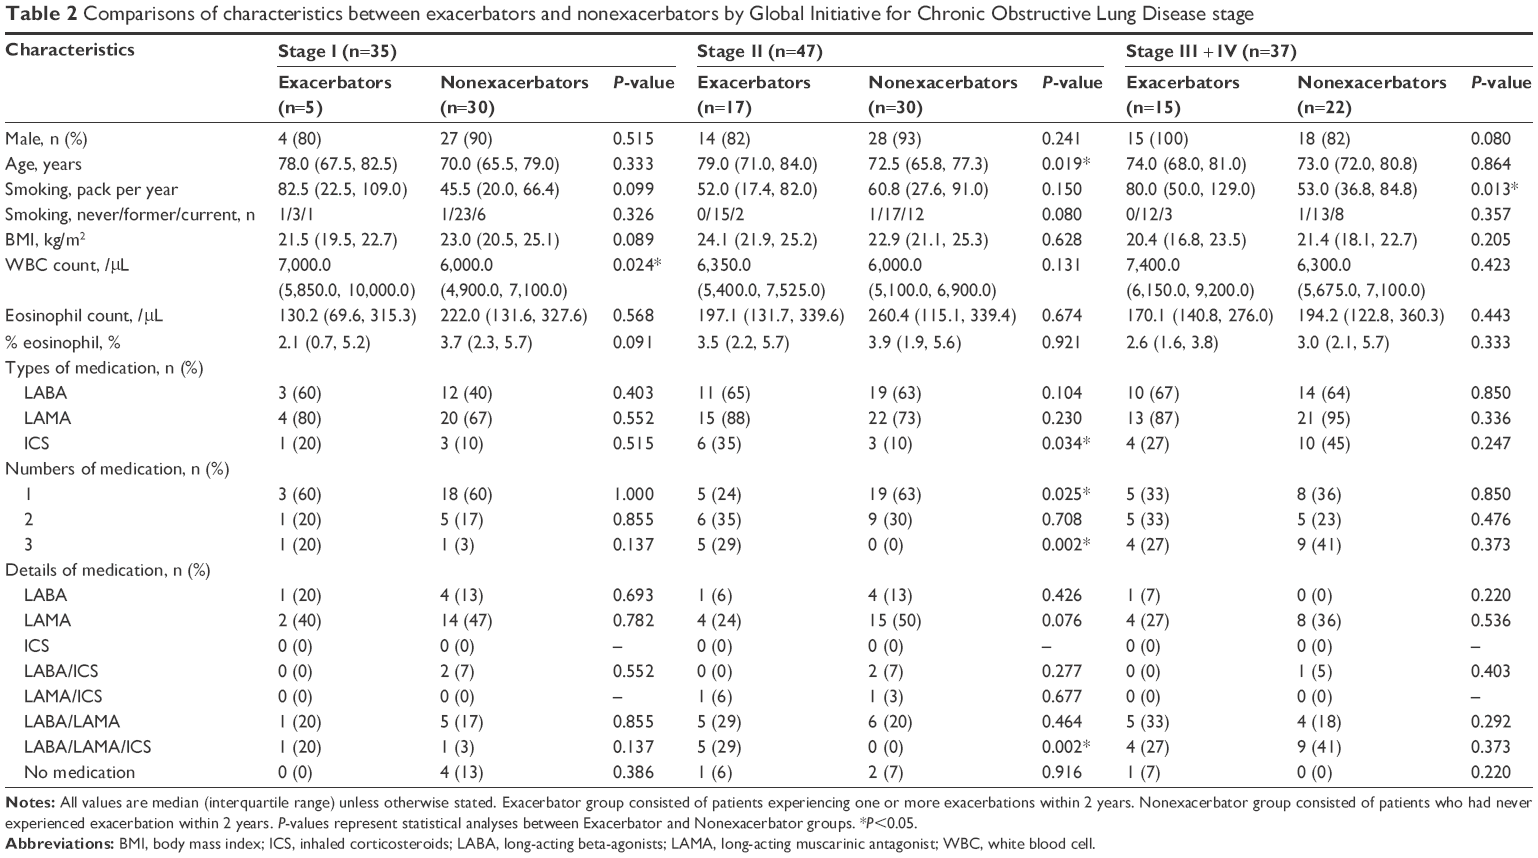 | Table 2 Comparisons of characteristics between exacerbators and nonexacerbators by Global Initiative for Chronic Obstructive Lung Disease stage |
Spirometry and FOT measurements
Comparisons of spirometry data and FOT parameters between the three groups classified by severity are shown in Table S1. There were significant differences in all parameters obtained by spirometry and FOT between the groups. Table 3 shows the comparison of the parameters obtained by spirometry and FOT between Exacerbators and Nonexacerbators. Exacerbators had significantly lower % predicted FVC (85.8 [73.8, 97.1] vs 99.2 [86.8, 109.7], P=0.049), % predicted FEV1 (58.1 [37.3, 70.0] vs 67.7 [48.2, 87.6], P=0.008), and FEV1/FVC (44.9 [37.6, 62.2] vs 56.3 [42.0, 69.5], P=0.006) than Nonexacerbators. Rrs and Xrs were measured by whole-breath analysis with the use of FOT and compared between Exacerbators and Nonexacerbators. Regarding Rrs parameters, we found significant differences in R20 (2.88 [2.33, 3.50] vs 2.39 [1.95, 3.02], P=0.028) between Exacerbators and Nonexacerbators. There were also significant differences in the Xrs parameters: X5 (−2.18 [−3.21, −0.94] vs −0.69 [−2.12, −0.30], P=0.024), Fres (15.60 [10.72, 18.96] vs 9.50 [6.82, 15.59], P=0.004), and ALX (15.99 [4.20, 27.83] vs 3.58 [1.19, 16.61], P=0.008) between the two groups. Meanwhile, there were no significant differences in R5-R20 and ΔX5 between the two groups. We also compared Rrs and Xrs between the two groups by subgroup of disease severity, and the results are shown in Table 4. We found that among patients with stage II COPD, there were significant differences in X5 (−1.33 [−3.21, −0.76] vs −0.73 [−1.30, −0.35], P=0.017), Fres (13.59 [9.83, 16.76] vs 9.44 [6.82, 12.02], P=0.042), and ALX (7.29 [3.36, 22.66] vs 2.94 [1.21, 6.87], P=0.021) between the two groups despite no significant differences in parameters measured with the use of spirometry.
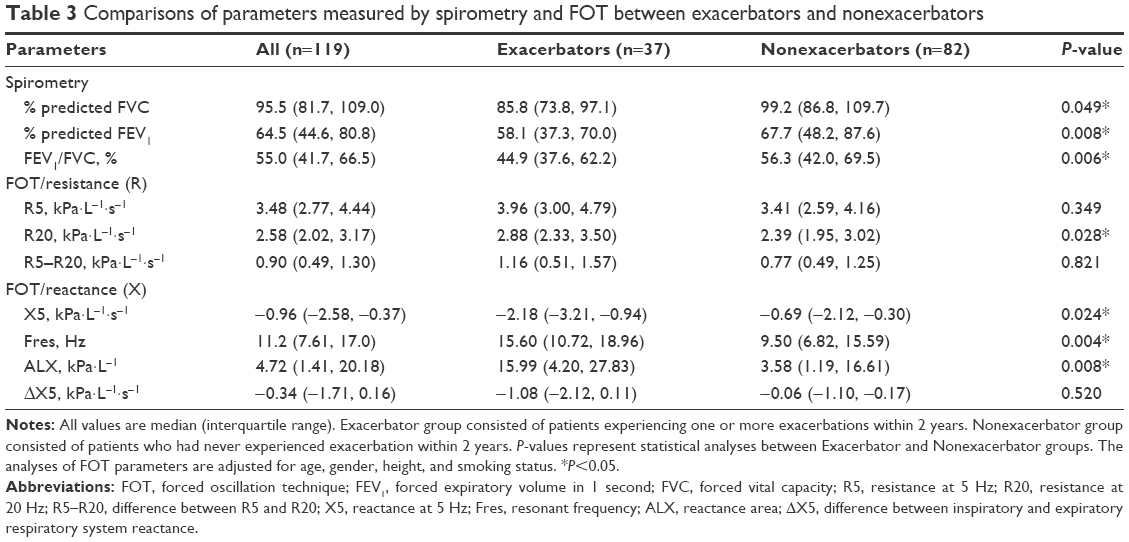 | Table 3 Comparisons of parameters measured by spirometry and FOT between exacerbators and nonexacerbators |
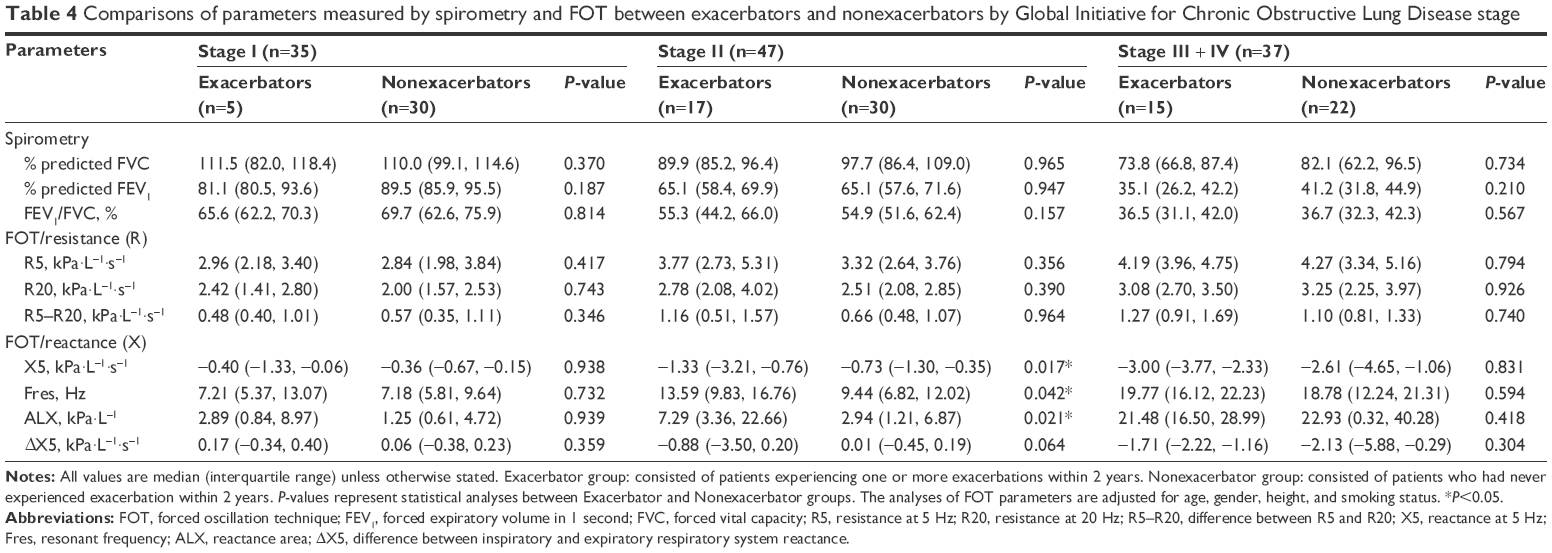 | Table 4 Comparisons of parameters measured by spirometry and FOT between exacerbators and nonexacerbators by Global Initiative for Chronic Obstructive Lung Disease stage |
Predictive values of FOT parameters
Finally, we performed an ROC curve analysis for spirometry data and FOT parameters to identify exacerbations in all 119 patients with COPD (Figure 2). % predicted FVC, % predicted FEV1, and FEV1/FVC yielded high area under the curve (AUC) values of 0.66, 0.65, and 0.61, respectively. Also, X5, Fres, and ALX yielded high AUC values of 0.70, 0.69, and 0.68, respectively, indicating that Xrs is more closely associated with future exacerbations than Rrs. The accuracy of spirometry data and FOT parameters is shown in Table 5. The most closely associated parameter with exacerbations was X5, for which the optimum cutoff point was −0.875 kPa·L−1·s−1 with 81.1% sensitivity and 59.8% specificity. The optimum cutoff points for % predicted FVC, % predicted FEV1, FEV1/FVC, Fres, and ALX were 94.7%, 81.1%, 50.5%, 13.585 Hz, and 4.03 kPa·L−1·s−1, respectively.
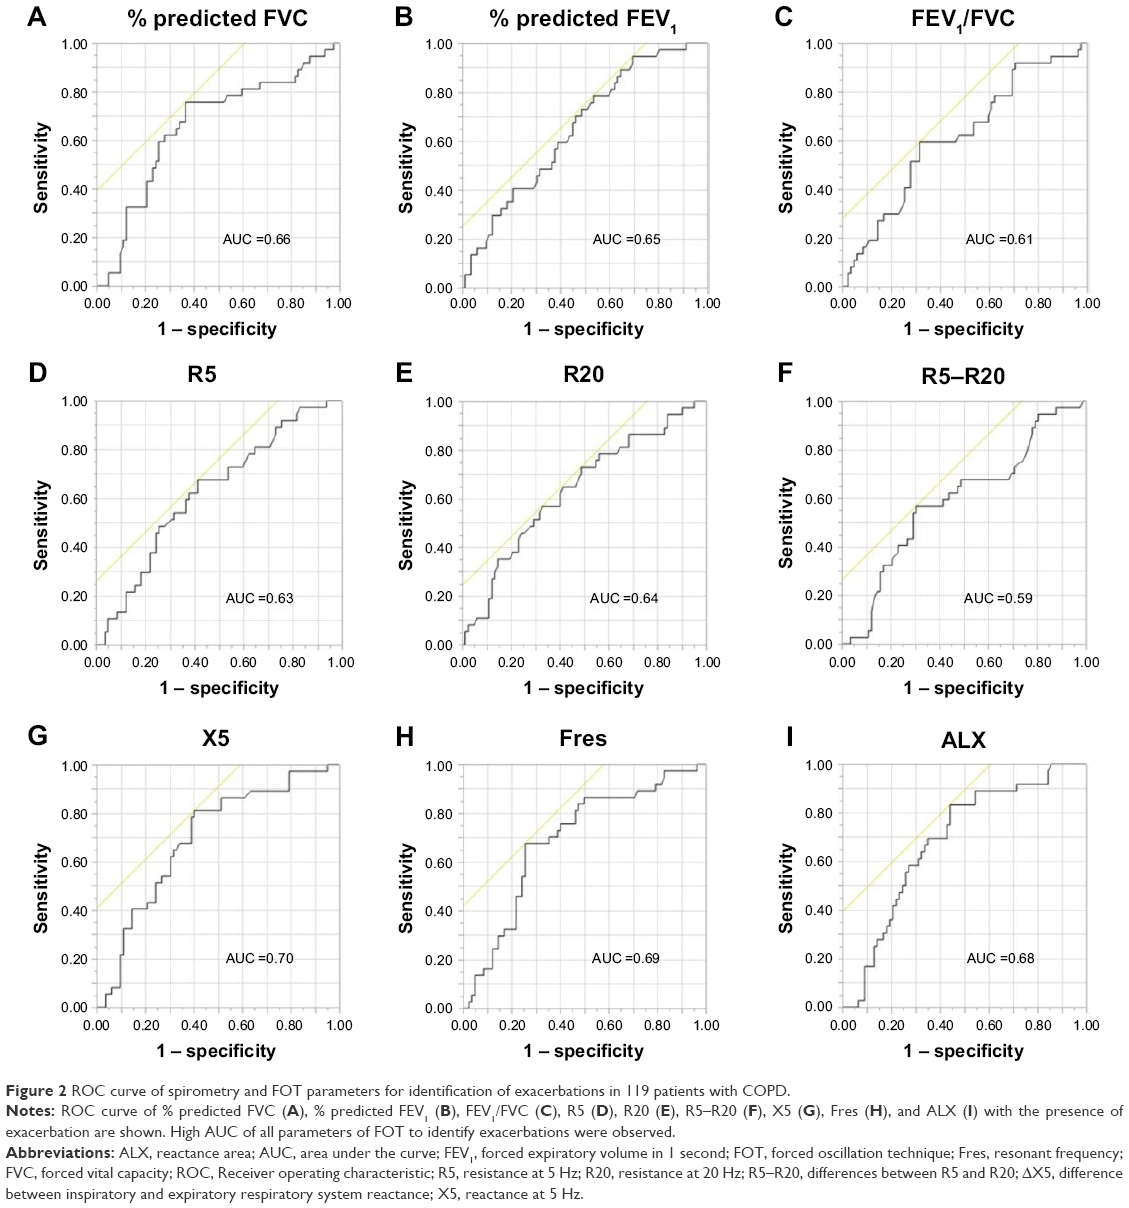 | Figure 2 ROC curve of spirometry and FOT parameters for identification of exacerbations in 119 patients with COPD. |
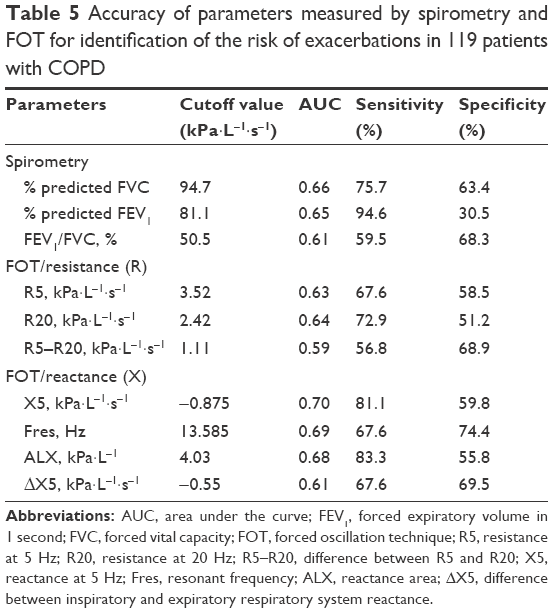 | Table 5 Accuracy of parameters measured by spirometry and FOT for identification of the risk of exacerbations in 119 patients with COPD |
Discussion
Exacerbation is a key event in COPD because it accelerates lung function loss and decreases patients’ quality of life.1–3 The present study showed the differences in respiratory impedance between Exacerbators and Nonexacerbators in patients with COPD as measured by FOT. The values of R20, Fres, and ALX were higher in Exacerbators than in Nonexacerbators, while that of X5 was lower. To our knowledge, this is the first study to demonstrate differences in FOT parameters between Exacerbators and Nonexacerbators in patients with COPD.
The frequency of COPD exacerbation generally depends on the disease severity, classified as airflow limitation measured by the use of conventional spirometry. In the present study, lower pulmonary function as assessed by FVC and FEV1, older age, and higher WBC count were associated with exacerbations in patients with COPD. In line with our results, the ECLIPSE study demonstrated that disease severity and an elevated WBC count were associated exacerbations in patients with COPD; in addition, prior exacerbations, a history of gastroesophageal reflux, symptoms of heartburn, and a poorer quality of life were also found to be determinants of exacerbations.22 In particular, a history of exacerbations in the preceding year was the best determinant of exacerbations. In the present study, we demonstrated the possibility of FOT as a novel and objective indicator for the detection of exacerbation in COPD, representing a viable alternative to spirometry. Intriguingly, Gonem et al reported that, in patients with severe asthma, airway constriction as measured by FOT was associated with an exacerbation-prone phenotype.19
Recently, the importance of identifying patients with mild airway obstruction, such as those classified as GOLD stages I and II, has been recognized because of potential future impairment of their health status.23 In addition, the Genetic Epidemiology of COPD study introduced novel evidence that exacerbations accelerate lung function loss in patients with COPD, particularly in those with mild disease.3 Our study showed that among the subgroup of patients with stage II COPD, there were significant differences in FOT parameters between Exacerbators and Nonexacerbators despite no significant difference in respiratory function as measured by spirometry. This indicates that FOT can discriminate an exacerbation-prone phenotype among patients with the same grade of mild severity. We believe that this is the key findings of our study. FOT has been reported to be more sensitive than spirometry in detecting COPD and in assessing the effects of bronchodilators.24,25 However, our findings do indicate the utility of FOT but do not necessarily confirm its superiority over conventional spirometry in assessing exacerbation in patients with COPD.
Dellacà et al reported that ΔXrs can be used to detect the presence of EFL, which is a characteristic feature in patients with moderate-to-severe COPD with dynamic hyperinflation and the loss of lung elastic recoil.17 Previous studies reported that EFL is associated with certain symptoms, especially dyspnea, and with exacerbations of COPD.26,27 In the present study, it was shown that ΔX5 was reduced more in Exacerbators than in Nonexacerbators, among all patients and among those with stage II COPD, but without statistical differences. Thus, the presence of EFL may not be associated with the ability of FOT to discriminate between Exacerbators and Nonexacerbators in patients with stage II COPD. Xrs is supposed to reflect the compliance and inertial properties of the respiratory system; changes in Xrs in pulmonary disease are dominated by respiratory compliance but not inertial properties.28 Compliance is primarily associated with the lung periphery. A study conducted by Borrill et al showed that changes in X5 and Fres induced by the administration of bronchodilators were related to small airway bronchodilation, causing a reduction in hyperinflation and improvement in lung compliance.29 Therefore, slight perturbations of the small airways might have resulted in differences in Xrs between Exacerbators and Nonexacerbators in patients with stage II COPD, despite no significant differences in respiratory function as measured by spirometry. However, the reason why FOT discriminated between Exacerbators and Nonexacerbators in this study has not fully been elucidated.
In the present study, Xrs values became more negative in patients with higher GOLD staging. This is consistent with a previous study conducted by Di Mango et al.30 They also reported that Xrs was useful in assessing airway obstruction in patients with more advanced COPD. Our study did not show any clinical utility of FOT in discriminating between Exacerbators and Nonexacerbators in patients with severe COPD. In this study, ROC curve analysis showed that AUC values were higher in Xrs, particularly X5 and Fres, than in Rrs, indicating that Xrs is more closely associated with exacerbation-prone phenotype of COPD than Rrs. In accordance with our results, Stevenson et al reported that there was a significant improvement in X5 but not in R5 during recovery from exacerbation of COPD.31 In addition, previous studies showed that Xrs was more effective than Rrs in the assessment of degree of airflow limitation and air trapping in patients with COPD.13,32
Previous studies showed significant correlations between FOT parameters and respiratory function as measured by spirometry in patients with geriatric COPD.13,32 Therefore, FOT, rather than spirometry, can be used to assess airway obstruction in patients who have difficulty with forced expiration. FOT is a useful tool in diagnosing COPD, evaluating disease severity, formulating prognosis, and evaluating response to therapy, similar to spirometry. Amaral et al recently introduced automatic classifiers to simplify the clinical use and increase the accuracy of FOT in the categorization of airway obstruction level in patients with COPD.33 Such new devices may enable clinicians to categorize COPD airway obstruction, track disease progression, evaluate the risk of future disease exacerbations, and guide therapy more easily.
Our study has some limitations. First, we could not exclude the influence of patients with asthma–COPD overlap (ACO), although patients who had evident asthmatic components, such as airway hyper-responsiveness, were excluded. Studies have shown that patients with ACO have more frequent exacerbations than those with COPD only.34,35 However, at present, there is no definition or basis for excluding a patient with ACO. Second, we found no difference in respiratory impedance between Exacerbators and Nonexacerbators among patients with stage III and IV COPD. Although it cannot be concluded whether FOT can discriminate an exacerbation-prone phenotype among patients with severe COPD, it may be superior in discriminating an exacerbation-prone phenotype in patients with nonsevere COPD compared to those with severe COPD. Third, this was a single-centered retrospective study and the sample size was relatively small. Therefore, we cannot conclude whether FOT parameters can predict exacerbations of COPD in clinical practice, particularly in patients with moderate COPD. For this confirmation, prospective studies including a greater number of subjects are necessary to verify our results.
Conclusion
We found significant differences in FOT parameters between Exacerbators and Nonexacerbators, despite no significant differences in respiratory function as measured by spirometry among patients with stage II COPD. FOT can aid therapeutic intervention aimed at the avoidance of COPD exacerbation. Prospective studies are required to further explore the utility of FOT, such as its superiority to spirometry, in patients with COPD.
Acknowledgments
The authors thank Yoshio Watanabe, MD, PhD; Takuya Yokoe MD, PhD; Yasunori Murata MD, PhD; and Sojiro Kusumoto MD, PhD for their assistance in data collection. The authors also thank Kuniaki Hiarai and Tetsuya Homma for their assistance in the interpretation of the results and critical review of the manuscript.
Author contributions
HY performed the major part of the analysis, contributed to the interpretation of the results, and wrote the first drafts. HY and AT are guarantors of the study and take responsibility for the content of the manuscript. AT also contributed to the writing and finalizing of the manuscript. AT, YK, HM, TK, SO, MY, SS, and TO contributed to the data collection, and supported the development of the manuscript. HS conceived the outline of the current analysis, and supervised its completion. All authors agreed with the final draft of the manuscript, contributed toward data analysis, drafting and critically revising the paper, gave final approval of the version to be published, and agree to be accountable for all aspects of the work.
Disclosure
The authors report no conflicts of interest in this work.
References
Llor C, Molina J, Naberan K, Cots JM, Ros F, Miravitlles M; EVOCA study group. Exacerbations worsen the quality of life of chronic obstructive pulmonary disease patients in primary healthcare. Int J Clin Pract. 2008;62(4):585–592. | ||
Tomioka R, Kawayama T, Suetomo M, et al. “Frequent exacerbator” is a phenotype of poor prognosis in Japanese patients with chronic obstructive pulmonary disease. Int J Chron Obstruct Pulmon Dis. 2016;11(1):207–216. | ||
Soler-Cataluna JJ, Martinez-Garcia MA, Roman Sanchez P, Salcedo E, Navarro M, Ochando R. Severe acute exacerbations and mortality in patients with chronic obstructive pulmonary disease. Thorax. 2005;60(11):925–931. | ||
Dransfield MT, Kunisaki KM, Strand MJ, et al; COPDGene Investigators. Acute exacerbations and lung function loss in smokers with and without chronic obstructive pulmonary disease. Am J Respir Crit Care Med. 2017;195(3):324–330. | ||
McGarvey L, Lee AJ, Roberts J, Gruffydd-Jones K, McKnight E, Haughney J. Characterization of the frequent exacerbator phenotype in COPD patients in a large UK primary care population. Respir Med. 2015;109(2):228–237. | ||
Sundh J, Johansson G, Larsson K, et al. The phenotype of concurrent chronic bronchitis and frequent exacerbations in patients with severe COPD attending Swedish secondary care units. Int J Chron Obstruct Pulmon Dis. 2015;10(1):2327–2334. | ||
Han MK, Kazerooni EA, Lynch DA, et al. Chronic obstructive pulmonary disease exacerbations in the COPDGene study: associated radiologic phenotypes. Radiology. 2011;261(1):274–282. | ||
Burgel PR, Nesme-Meyer P, Chanez P, et al; Initiatives Bronchopneumopathie Chronique Obstructive (BPCO) Scientific Committee. Cough and sputum production are associated with frequent exacerbations and hospitalizations in COPD subjects. Chest. 2009;135(4):975–982. | ||
Margüello MS, Garrastazu R, Ruiz-Nuñez M, et al. Independent effect of prior exacerbation frequency and disease severity on the risk of future exacerbations of COPD: a retrospective cohort study. NPJ Prim Care Respir Med. 2016;26:16046. | ||
Fisher AB, DuBois AB, Hyde RW. Evaluation of the forced oscillation technique for the determination of resistance to breathing. J Clin Invest. 1968;47(9):2045–2057. | ||
Brashier B, Salvi S. Measuring lung function using sound waves: role of the forced oscillation technique and impulse oscillometry system. Breathe (Sheff). 2015;11(1):57–65. | ||
Goldman MD, Saadeh C, Ross D. Clinical applications of forced oscillation to assess peripheral airway function. Respir Physiol Neurobiol. 2005;148(1–2):179–194. | ||
Tse HN, Tseng CZ, Wong KY, Yee KS, Ng LY. Accuracy of forced oscillation technique to assess lung function in geriatric COPD population. Int J Chron Obstruct Pulmon Dis. 2016;11(1):1105–1118. | ||
Timmins SC, Diba C, Schoeffel RE, Salome CM, King GG, Thamrin C. Changes in oscillatory impedance and nitrogen washout with combination fluticasone/salmeterol therapy in COPD. Respir Med. 2014;108(2):344–350. | ||
Paredi P, Goldman M, Alamen A, et al. Comparison of inspiratory and expiratory resistance and reactance in patients with asthma and chronic obstructive pulmonary disease. Thorax. 2010;65(3):263–267. | ||
Mori K, Shirai T, Mikamo M, et al. Colored 3-dimensional analyzes of respiratory resistance and reactance in COPD and asthma. COPD. 2011;8(6):456–463. | ||
Dellacà RL, Santus P, Aliverti A, et al. Detection of expiratory flow limitation in COPD using the forced oscillation technique. Eur Respir J. 2004;23(2):232–240. | ||
Mikamo M, Shirai T, Mori K, et al. Predictors of expiratory flow limitation measured by forced oscillation technique in COPD. BMC Pulm Med. 2014;14:23. | ||
Gonem S, Umar I, Burke D, et al. Airway impedance entropy and exacerbations in severe asthma. Eur Respir J. 2012;40(5):1156–1163. | ||
Global Initiative for Chronic Obstructive Lung Disease. Global strategy for the diagnosis, management, and prevention of chronic obstructive lung disease. Available from: http://goldcopd.org/global-strategy-diagnosis-management-prevention-copd-2016/. Accessed August 22, 2016. | ||
Aoki M, Osanai S, Ogasa T, et al. [Comparison between predicted equations obtained by standard Japanese values and present predicted equations for vital capacity and forced expiratory volume in one second]. Nihon Kokyuki Gakkai Zasshi. 2010;48(5):357–363. Japanese. | ||
Hurst JR, Vestbo J, Anzueto A, et al; Evaluation of COPD Longitudinally to Identify Predictive Surrogate Endpoints (ECLIPSE) Investigators. Susceptibility to exacerbation in chronic obstructive pulmonary disease. N Engl J Med. 2010;363(12):1128–1138. | ||
Jones PW, Brusselle G, Dal Negro RW, et al. Health-related quality of life in patients by COPD severity within primary care in Europe. Respir Med. 2011;105(1):57–66. | ||
Borrill ZL, Houghton CM, Woodcock AA, Vestbo J, Singh D. Measuring bronchodilation in COPD clinical trials. Br J Clin Pharmacol. 2005;59(4):379–384. | ||
Houghton CM, Woodcock AA, Singh D. A comparison of plethysmography, spirometry and oscillometry for assessing the pulmonary effects of inhaled ipratropium bromide in healthy subjects and patients with asthma. Br J Clin Pharmacol. 2005;59(2):152–159. | ||
Jetmalani K, Timmins S, Brown NJ, et al. Expiratory flow limitation relates to symptoms during COPD exacerbations requiring hospital admission. Int J Chron Obstruct Pulmon Dis. 2015;10(1):939–945. | ||
O’Donnell DE, Parker CM. COPD exacerbations . 3: Pathophysiology. Thorax. 2006;61(4):354–361. | ||
MacLeod D, Birch M. Respiratory input impedance measurement: forced oscillation methods. Med Biol Eng Comput. 2001;39(5):505–516. | ||
Borrill ZL, Houghton CM, Tal-Singer R, et al. The use of plethysmography and oscillometry to compare long-acting bronchodilators in patients with COPD. Br J Clin Pharmacol. 2008;65(2):244–252. | ||
Di Mango AM, Lopes AJ, Jansen JM, Melo PL. Changes in respiratory mechanics with increasing degrees of airway obstruction in COPD: detection by forced oscillation technique. Respir Med. 2006;100(3):399–410. | ||
Stevenson NJ, Walker PP, Costello RW, Calverley PM. Lung mechanics and dyspnea during exacerbations of chronic obstructive pulmonary disease. Am J Respir Crit Care Med. 2005;172(12):1510–1516. | ||
Kolsum U, Borrill Z, Roy K, et al. Impulse oscillometry in COPD: identification of measurements related to airway obstruction, airway conductance and lung volumes. Respir Med. 2009;103(1):136–143. | ||
Amaral JL, Lopes AJ, Faria AC, Melo PL. Machine learning algorithms and forced oscillation measurements to categorize the airway obstruction severity in chronic obstructive pulmonary disease. Comput Methods Programs Biomed. 2015;118(2):186–197. | ||
Nielsen M, Bårnes CB, Ulrik CS. Clinical characteristics of the asthma-COPD overlap syndrome–a systematic review. Int J Chron Obstruct Pulmon Dis. 2015;10(1):1443–1454. | ||
Menezes AM, Montes de Oca M, Pérez-Padilla R, et al. Increased risk of exacerbation and hospitalization in subjects with an overlap phenotype: COPD-asthma. Chest. 2014;145(2):297–304. |
Supplementary material
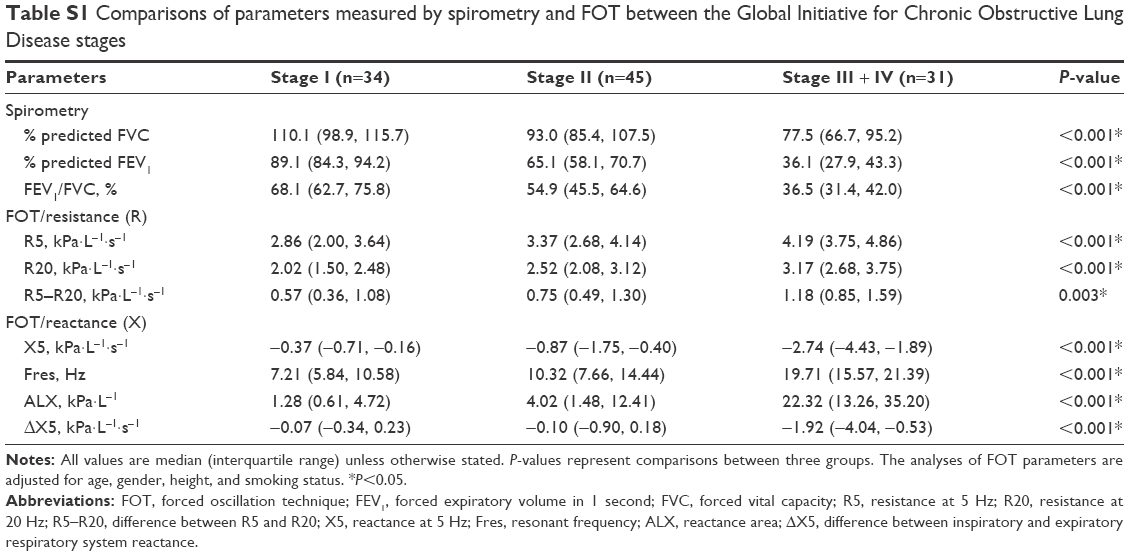 | Table S1 Comparisons of parameters measured by spirometry and FOT between the Global Initiative for Chronic Obstructive Lung Disease stages |
 © 2017 The Author(s). This work is published and licensed by Dove Medical Press Limited. The full terms of this license are available at https://www.dovepress.com/terms.php and incorporate the Creative Commons Attribution - Non Commercial (unported, v3.0) License.
By accessing the work you hereby accept the Terms. Non-commercial uses of the work are permitted without any further permission from Dove Medical Press Limited, provided the work is properly attributed. For permission for commercial use of this work, please see paragraphs 4.2 and 5 of our Terms.
© 2017 The Author(s). This work is published and licensed by Dove Medical Press Limited. The full terms of this license are available at https://www.dovepress.com/terms.php and incorporate the Creative Commons Attribution - Non Commercial (unported, v3.0) License.
By accessing the work you hereby accept the Terms. Non-commercial uses of the work are permitted without any further permission from Dove Medical Press Limited, provided the work is properly attributed. For permission for commercial use of this work, please see paragraphs 4.2 and 5 of our Terms.