Back to Journals » Clinical Epidemiology » Volume 10
Association between educational level and cardiovascular disease and all-cause mortality in patients with type 2 diabetes: a prospective study in the Joint Asia Diabetes Evaluation Program
Authors Wu HJ ![]() , Lau ESH, Kong APS, Ma RCW, Ozaki R, Cheung KKT, Chow E, Tsang CC, Lau KP, Hui EMT, So WY, Gasevic D
, Lau ESH, Kong APS, Ma RCW, Ozaki R, Cheung KKT, Chow E, Tsang CC, Lau KP, Hui EMT, So WY, Gasevic D ![]() , Wild SH
, Wild SH ![]() , Chan JCN
, Chan JCN ![]() , Luk A
, Luk A ![]()
Received 16 June 2018
Accepted for publication 22 August 2018
Published 25 October 2018 Volume 2018:10 Pages 1561—1571
DOI https://doi.org/10.2147/CLEP.S177437
Checked for plagiarism Yes
Review by Single anonymous peer review
Peer reviewer comments 3
Editor who approved publication: Professor Irene Petersen
Hongjiang Wu,1,2 Eric SH Lau,3 Alice PS Kong,2,4 Ronald CW Ma,2,4 Risa Ozaki,4 Kitty KT Cheung,4 Elaine Chow,4 Chiu Chi Tsang,5 Kam Piu Lau,6 Eric MT Hui,7 Wing Yee So,8 Danijela Gasevic,1,9 Sarah H Wild,1 Juliana CN Chan,2–4 Andrea Luk2–4
1Usher Institute of Population Health Sciences and Informatics, The University of Edinburgh, Edinburgh, UK; 2Hong Kong Institute of Diabetes and Obesity, The Chinese University of Hong Kong, Prince of Wales Hospital, Hong Kong SAR, China; 3Asia Diabetes Foundation, Prince of Wales Hospital, Hong Kong SAR, China; 4Department of Medicine and Therapeutics, The Chinese University of Hong Kong, Prince of Wales Hospital, Hong Kong SAR, China; 5Alice Ho Miu Ling Nethersole Hospital, Tai Po, Hong Kong SAR, China; 6Northern District Hospital, Fanling, Hong Kong SAR, China; 7Department of Family Medicine, Prince of Wales Hospital, Hong Kong SAR, China; 8Hospital Authority Head Office, Hong Kong SAR, China; 9School of Public Health and Preventive Medicine, Monash University, Melbourne, Australia
Purpose: The aim of this study was to describe the association between educational level and incident cardiovascular disease (CVD) and all-cause mortality in Hong Kong Chinese patients with type 2 diabetes.
Patients and methods: We included 12,634 patients with type 2 diabetes who were enrolled into the Joint Asia Diabetes Evaluation Program between June 1, 2007, and June 30, 2017. We classified patients’ educational level into the following three groups: ≤6 years, 6–13 years, and >13 years. Incident CVD events were identified using hospital discharge diagnoses. Death was identified from Hong Kong Death Register. We estimated HRs for incident CVD and all-cause mortality using Cox regression models.
Results: Patients with the highest educational level were younger and had shorter diabetes duration and better glycemic control at enrollment than those with the lowest educational level. During the median follow-up of 6.2 years for CVD and 6.4 years for all-cause mortality, 954 CVD events and 833 deaths were recorded. HRs for CVD and all-cause mortality were 0.73 (95% CI: 0.57, 0.94) and 0.71 (95% CI: 0.54, 0.94) for the highest educational level compared to the lowest educational level, after adjustment for age, sex, diabetes duration, and family history of diabetes.
Conclusion: Educational level is inversely associated with the risk of CVD and all-cause mortality among Hong Kong Chinese patients with type 2 diabetes. Hong Kong Chinese patients with type 2 diabetes and low educational level should be given special attention for the prevention of key complications of diabetes.
Keywords: socioeconomic status, educational level, diabetes, cardiovascular disease, all-cause mortality
Introduction
Cardiovascular disease (CVD) is one of the most common causes of morbidity and premature mortality in people with type 2 diabetes.1 Large cohort studies suggest that people with diabetes are at two- to fourfold increased risk of CVD events compared with nondiabetic populations.2 A review of data published between 1990 and 2010 concluded that the risk of all-cause mortality among people with diabetes was approximately double those of the general population, although relative risks vary with age, sex, and socioeconomic status (SES).3,4
SES is an important determinant of people’s health.5 The explanations for the association of SES with health outcomes are multifactorial and include influences on health care, health-related behaviors, and environmental factors.6 Inverse associations between SES and incident CVD in general populations7 and all-cause mortality in both general populations8,9 and people with diabetes4,10,11 have previously been reported. However, there is limited information available about the association between SES and incident CVD in patients with type 2 diabetes, whose health-related behaviors, treatment patterns, health surveillance, and the variation by SES may differ importantly from those of general populations.12 The effect of the epidemiological transition on changes in number and distribution of patients with type 2 diabetes means that more evidence is required to clarify the relationship between SES and complications of type 2 diabetes in populations in Asia and around the world, including countries at a different stage of the epidemiological transition.13
In this study, we describe the association between educational level, one of the key measures of SES, and incident CVD and all-cause mortality in Hong Kong Chinese patients with type 2 diabetes using prospective data from the Joint Asia Diabetes Evaluation (JADE) program.
Patients and methods
Study population
The rationale, design, and implementation of the JADE program have been published previously.14 Briefly, the JADE program is a disease management program implemented using an electronic portal that systematically captures clinical characteristics, including risk factors and complications, of patients with diabetes to create a diabetes register with built in risk engines to generate a personalized report with decision support. The JADE program was established in 2007 and enrolled patients diagnosed with diabetes from three public hospital-based diabetes centers, one public community-based clinic, and one university-affiliated self-funded nurse-led diabetes center in Hong Kong. Between June 1, 2007, and June 30, 2017, 18,493 Hong Kong Chinese patients were enrolled in the JADE program. For our study, we excluded 4,155 patients with baseline prevalent CVD. We further excluded 324 patients with type 1 diabetes and included patients with unspecified diabetes under the assumption that most of these patients would have type 2 diabetes. We also excluded 1,380 patients with missing data, leaving 12,634 patients (217 patients with unspecified diabetes) for the present analyses (Figure S1). This study was approved by the Clinical Research Ethnics Committee of the Chinese University of Hong Kong and the relevant institutional boards of participating sites. All patients provided written informed consent.
Measures
All patients underwent comprehensive assessment guided by structured assessment forms including recording of sociodemographic factors, lifestyle factors, medical history, current medication use, physical examination, and laboratory testing based on the JADE protocol at enrollment.15 We classified patients’ educational level into the following three groups using years of education completed by an individual: ≤6 years (primary school or below), 6–13 years (middle or high school), and >13 years (university or above). Information on incident CVD was identified using the principal diagnosis on hospital discharge records as coded by ICD-9 from the Hong Kong Hospital Authority (HA) Central Computer System. The HA is the governing body of all public-funded hospitals and outpatient clinics in Hong Kong. Clinical information on patients attending public hospitals and clinics is continuously recorded by the HA Central Computer System. Health care in Hong Kong is heavily subsidized, and as such, majority of the Hong Kong people seek care for acute and chronic illnesses in the public sector. It is estimated that about 95% of the total hospital bed days and 80% of the outpatient visits in Hong Kong occur in the public sector.16 Information on death was identified from linkage to the Hong Kong Death Register where cause of death is identified by ICD-9 codes.
For our analyses, CVD included any coronary heart disease (ICD-9 codes 410–414, and procedure codes 36 and 00.66), congestive heart failure (ICD-9 code 428), stroke (ICD-9 codes 430–438), and peripheral vascular disease (ICD-9 codes 250.7, 785.4, 443.81, and 443.9 and procedure codes 39.29, 39.90, and 84.1 without ICD-9 codes 895–897).
Entry date to the cohort was the date when patients were enrolled into the JADE program. Exit date for CVD analyses was the date of the first incident, CVD event or June 30, 2017, for patients who neither died nor had a CVD event recorded by that date, with censoring at the date of death where appropriate. Exit date for mortality analyses was the date of death or June 30, 2017, for survivors to that date. Follow-up time was calculated as the period from entry date to exit date or to censoring.
Statistical analyses
We described baseline characteristics of patients by educational level. One-way ANOVA, Kruskal–Wallis test, and Chi-squared test were used for comparisons as appropriate. We used Cox proportional hazards models to estimate the HRs and 95% CIs for the association between educational level and incident CVD and all-cause mortality, adjusting for age at the diagnosis of diabetes and sex in model 1 and further adjusting for family history of diabetes and diabetes duration at enrollment in model 2 forming the basic model. Potential mediating variables were selected based on a prior knowledge of underlying mechanism linking SES and CVD and all-cause mortality.17 We created several further non-nested models in order to investigate the potential mediating roles separately for health-related behaviors, treatment received, baseline prevalent comorbidities, and metabolic risk factors between educational level and CVD and all-cause mortality and compare their contributions. Health-related behaviors (current smoking, regular use of alcohol, regular physical activity, and good adherence to balanced diet) were added to model 2 to create model 3. For model 4, we added current treatment (regular medical follow-up, record of attending diabetes education, use of oral antidiabetic drugs, insulin, antihypertensive drugs, and lipid-lowering drugs) to model 2. Baseline prevalent comorbidities (albuminuria, diabetic retinopathy, sensory neuropathy, end-stage renal disease, chronic kidney disease, and cancer) were added to create model 5. Model 6 included baseline metabolic risk factors (body mass index, waist-to-hip ratio, SBP, DBP, hemoglobin A1c [HbA1c], fasting plasma glucose, low-density lipoprotein cholesterol, high-density lipoprotein cholesterol, and triglyceride). Finally, all variables were included in model 7. We checked the Cox proportional hazards assumption using Schoenfeld residuals and found no evidence of violation.
We performed likelihood ratio tests for models including interaction terms to test whether age at the diagnosis of diabetes (<50 and ≥50 years), sex, and diabetes duration (<7 and ≥7 years) modified the association between educational level and incident CVD or all-cause mortality. Potential effect modifiers were selected based on previous studies reporting interactions between age, sex, and duration of diabetes and SES on CVD and all-cause mortality.4,18 We used competing risk regression models19 to estimate the subdistribution HRs (sHRs), with death not due to CVD as the competing risk. We compared the characteristics of patients with and without complete data. We performed a sensitivity analysis after excluding patients with unspecified diabetes. Statistical analyses were conducted using the R software (Version 3.3.3).
Results
Characteristics of patients
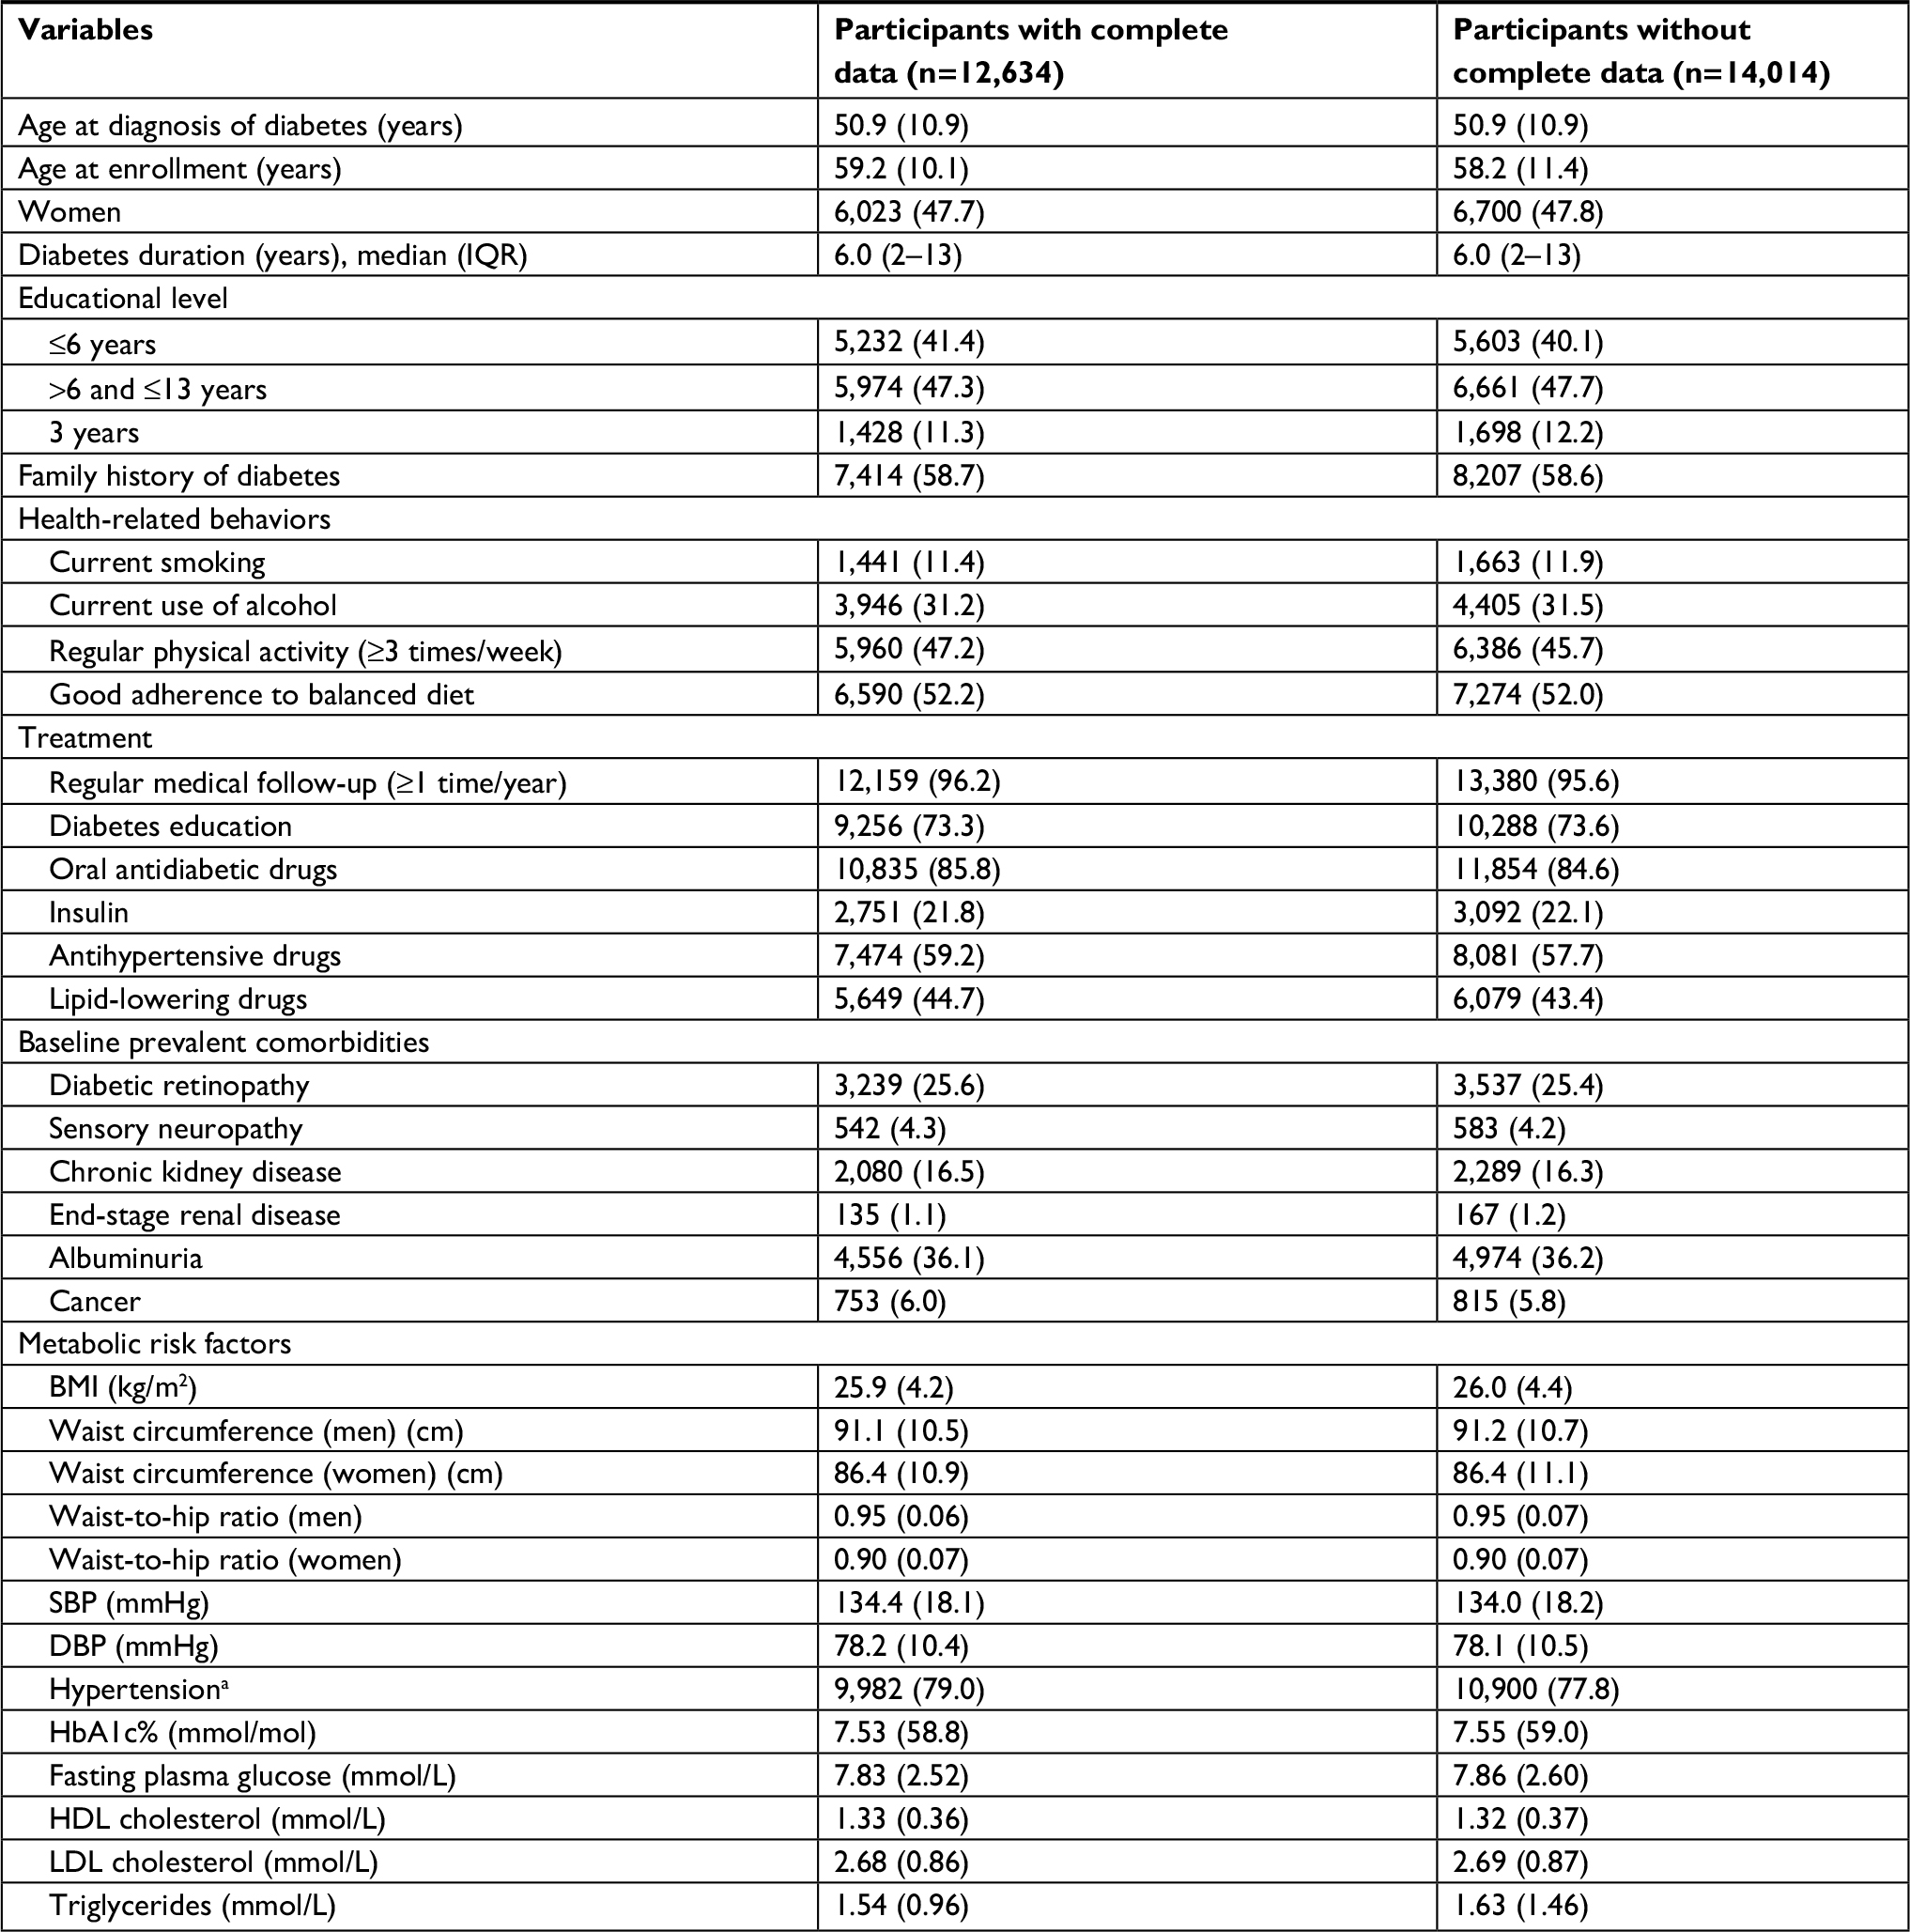
Among 12,634 patients included in the analyses, 47.7% were women, 11.3% were in the highest educational category (>13 years), and 41.4% were in the lowest educational category (≤6 years). The mean (SD) age was 50.9 (10.9) years at the diagnosis of diabetes and was 59.2 (10.1) years at enrollment. Compared with patients with the lowest educational level, those with the highest educational level were younger at the diagnosis of diabetes (mean 48.7 vs 54.2 years) and had shorter diabetes duration (median 5.0 vs 8.0 years), including higher proportions of men (72.1 vs 37.6%) and patients with a family history of diabetes (68.7 vs 49.3%) (Table 1). About 39.2 and 44.0% of patients with the highest educational level were current alcohol drinkers and engaged in regular physical activity, while the proportions of those with the lowest educational level were 24.2 and 52.4%, respectively. Patients with the highest educational level had lower prevalence of comorbidities. For example, the prevalence of diabetic retinopathy, sensory neuropathy, chronic kidney disease, albuminuria, and cancer was 18.1, 2.9, 11.0, 29.1, and 4.8%, respectively, in patients with the highest educational level, while the prevalence of diabetic retinopathy, sensory neuropathy, chronic kidney disease, albuminuria, and cancer was 29.1, 5.8, 22.2, 40.5, and 7.2%, respectively, in those with the lowest educational level. In addition, patients with the highest educational level were less likely to receive regular medical follow-up, received diabetes education, insulin, antihypertensive drugs, and lipid-lowering drugs, and had better metabolic risk factors’ patterns at enrollment than patients with the lowest educational level. For patients with the highest educational level, the mean SBP and HbA1c were 130.3 mmHg and 56.9 mmol/mol, respectively, and 74.5% had prevalent hypertension. For patients with the lowest educational level, the mean SBP and HbA1c were 137.5 mmHg and 59.1 mmol/mol, respectively, and 83.4% had prevalent hypertension. There were statistically significant differences in several characteristics between patients with and without complete data, but the absolute differences were very small (Table S1).
 | Table 1 Characteristics of patients (n=12,643) according to educational level Notes: Data are mean (SD) or n (%), unless otherwise indicated. aHypertension defined as SBP ≥130 or DBP ≥80 or taking antihypertensive drugs. Abbreviations: BMI, body mass index; HbA1c, hemoglobin A1c; HDL, high-density lipoprotein; LDL, low-density lipoprotein. |
Association between educational level and incident CVD and all-cause mortality
During the median (IQR) follow-up of 6.2 (4.3–7.2) years for CVD and 6.4 (4.4–7.3) years for all-cause mortality, 954 incident CVD events and 833 deaths were recorded, with crude CVD and mortality rates 12.9 and 10.9/1,000 person-years respectively. The number of events, duration of follow-up, and event rates by educational level is shown in Table 2. The Kaplan–Meier curves for incident CVD and all-cause mortality by educational level are shown in Figure 1.
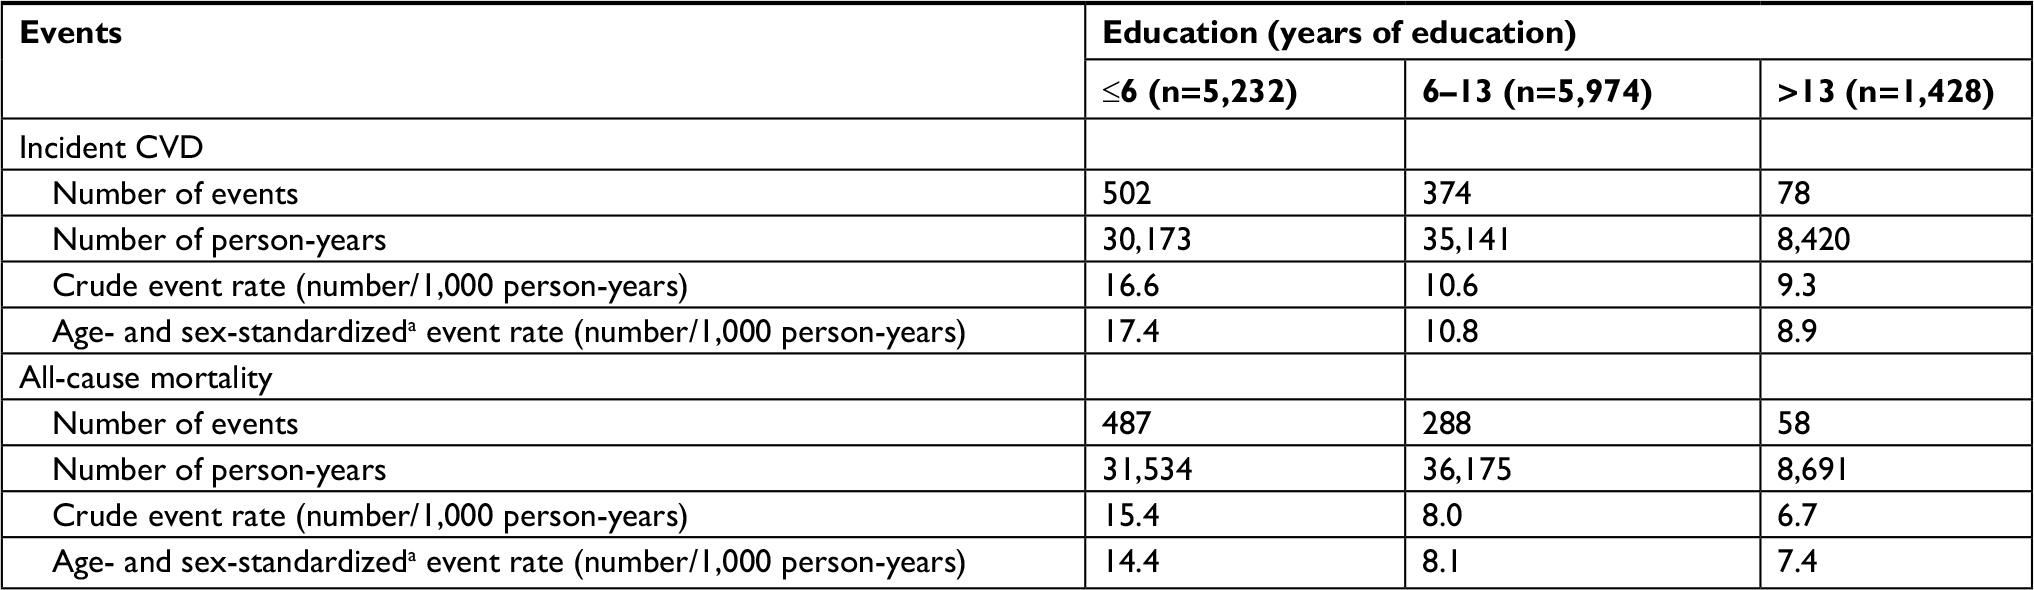 | Table 2 Duration of follow-up and CVD and all-cause mortality rates according to educational level (n=12,634) Notes: aTotal population included in the analysis by age at diabetes diagnosis (quartiles) and sex is used as the standard population. Abbreviation: CVD, cardiovascular disease. |
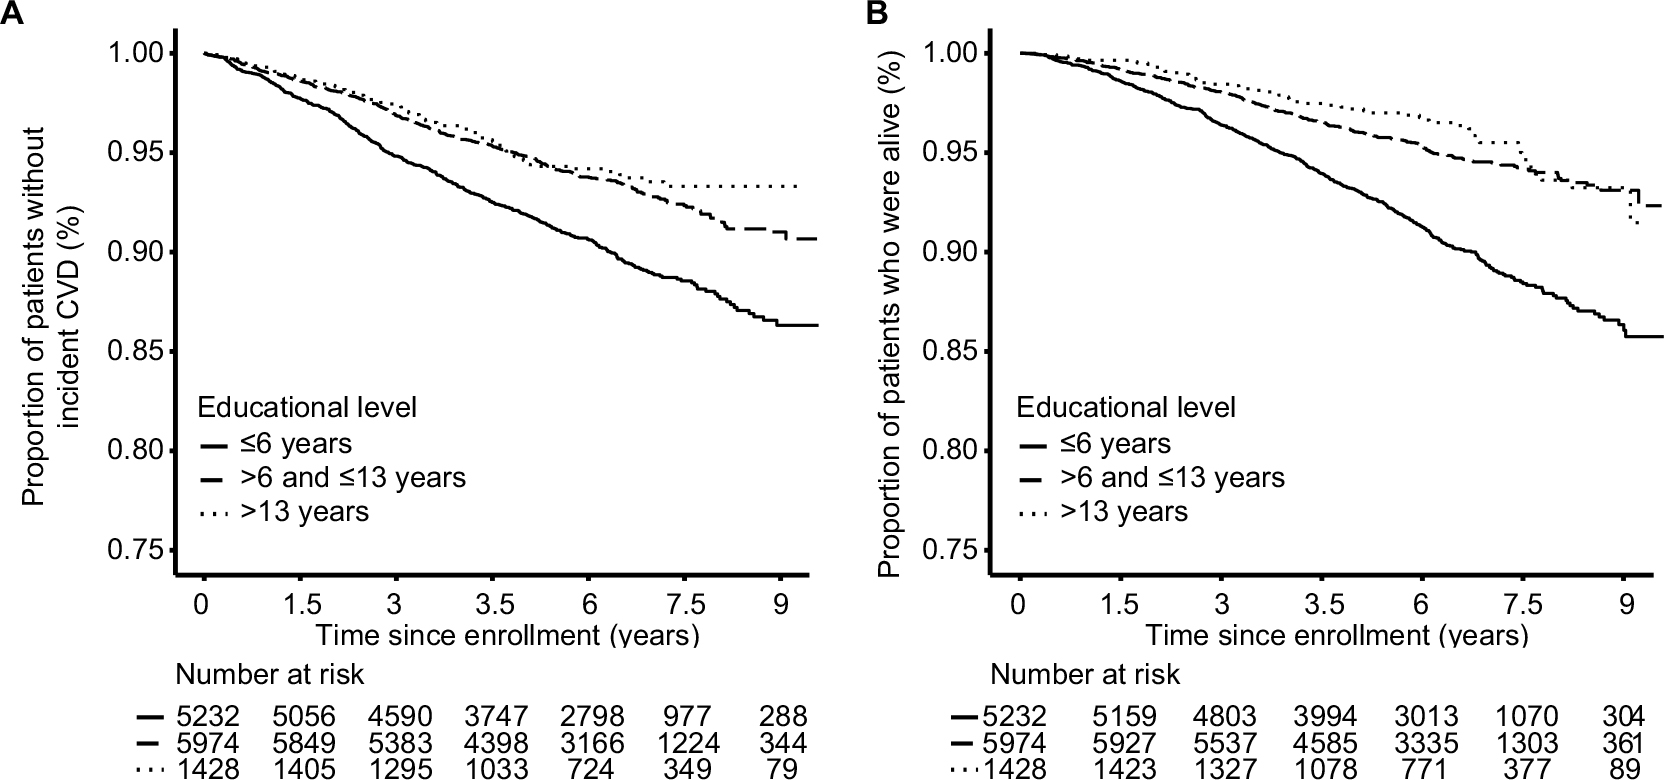 | Figure 1 Kaplan–Meier curves for incident CVD (A) and all-cause mortality (B) by educational level. Abbreviation: CVD, cardiovascular disease. |
After adjusting for age at diabetes diagnosis, sex, diabetes duration, and family history of diabetes, an inverse association consistent with a dose–response pattern was observed both between educational level and incident CVD and between educational level and all-cause mortality (Table 3). The adjusted HRs for incident CVD and all-cause mortality were 0.73 (95% CI: 0.57, 0.94) and 0.71 (95% CI: 0.54, 0.94), respectively, for the highest educational level compared to the lowest educational level. The strength of both associations was attenuated after further adjustment for health-related behaviors, current treatment, baseline prevalent comorbidities, or baseline metabolic risk factors, with baseline prevalent comorbidities and metabolic risk factors making the largest contributions (Table 3). The competing risk regression models obtained similar results to the Cox proportional hazards models, indicating little evidence for an important effect of competing risk from non-CVD death (Table S2). The only evidence for interaction we identified was that the association of educational level with all-cause mortality was more pronounced in patients aged less than 50 years (Table S3). The sensitivity analysis excluding patients with unspecified diabetes had little effect on the results (data not shown but are available from authors).
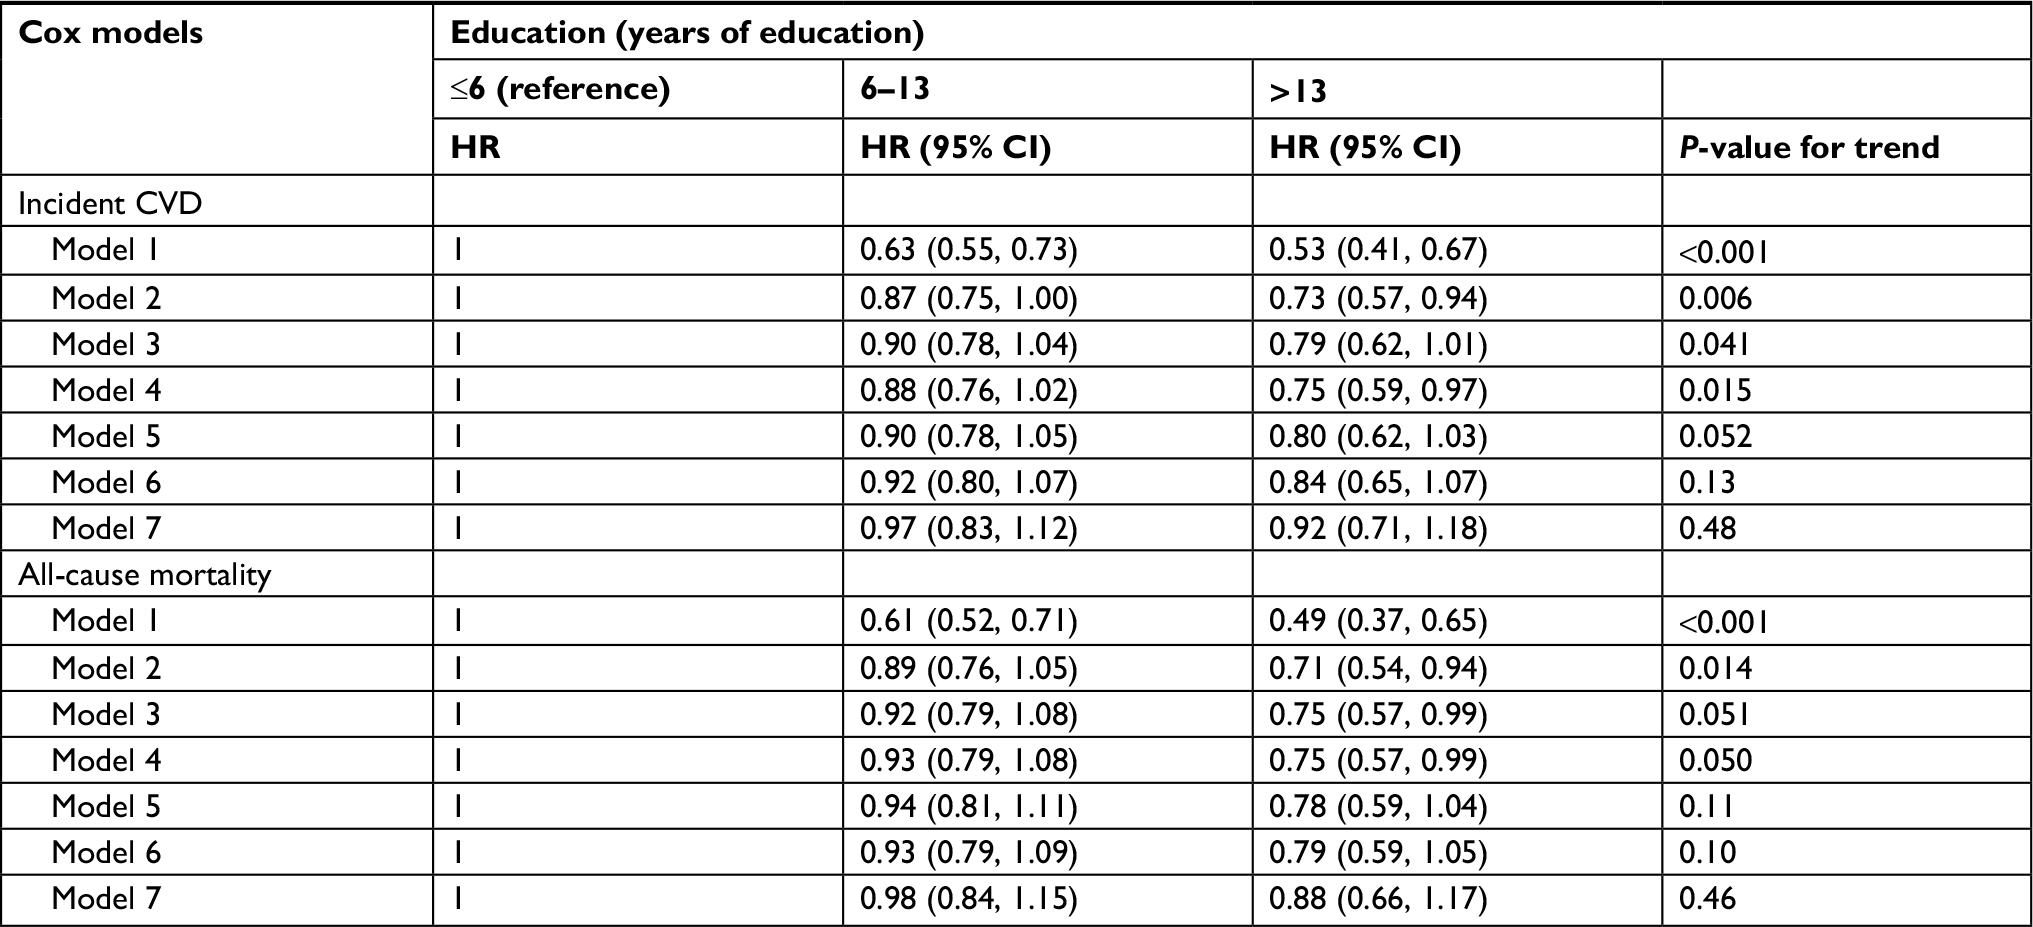 | Table 3 HRs for incident CVD and all-cause mortality according to educational level in models including different covariates (n=12,634) Notes: Model 1: adjusted for age and sex. Model 2: adjusted for age, sex, diabetes duration, and family history of diabetes. Model 3: model 2+ health behaviors (including smoking, use of alcohol, physical activity, and adherence to balanced diet). Model 4: model 2+ treatment (including regular medical follow-up, diabetes education, oral antidiabetic drugs, use of insulin, antihypertensive drugs, and lipid regulating drugs). Model 5: model 2+ baseline prevalent comorbidities (including cancer, albuminuria, diabetic retinopathy, sensory neuropathy, end-stage renal disease, and chronic kidney disease). Model 6: model 2+ baseline metabolic risk factors (including body mass index, waist-to-hip ratio, SBP, DBP, hemoglobin A1c, fasting blood glucose, high-density lipoprotein cholesterol, low-density lipoprotein cholesterol, and triglycerides). Model 7: adjusted for all variables listed above. Abbreviation: CVD, cardiovascular disease. |
Discussion
In this large prospective cohort study, we found a clear socioeconomic gradient in two key health outcomes in a contemporary cohort of Hong Kong Chinese patients with type 2 diabetes, with higher educational level being associated with a decreased risk of CVD and all-cause mortality. Diabetes-related comorbidities and metabolic risk factors made major contributions to the observed disparities.
To the best of our knowledge, this is the first prospective cohort study to describe the association between SES and incident CVD in Hong Kong Chinese with type 2 diabetes. A prospective study of 11,140 participants with type 2 diabetes and aged 55 years or older from 20 countries reported that people with low educational level had 31% (95% CI: 16, 48%) of increased risk of vascular events than those with high educational level during a median follow-up of 5 years.20 Several studies also reported that educational level was inversely associated with incident CVD in type 1 diabetes.21,22 Given the scarcity of similar data in type 2 diabetes, our results suggest that Hong Kong Chinese patients with type 2 diabetes, especially those less than 50 years old, who have a low educational level may require special attention, eg, diabetes education and ongoing support, although trials will be needed to test the effectiveness of targeted interventions. In the general Hong Kong Chinese population, SES was positively associated with CVD mortality before 1990, but this association was reversed in later year.23–25 This epidemiological transition is consistent with patterns in other countries where greater burden of noncommunicable diseases initially occurs in people with high SES but later shifts toward people with lower SES following economic development and urbanization.26 However, due to the lack of data of patients from earlier periods, we are not able to explore whether the association between educational level and risk of CVD and all-cause mortality among patients with type 2 diabetes in Hong Kong has changed over time.
The observed socioeconomic inequalities in CVD and all-cause mortality were consistent for men and women and for patients with different diabetes duration. However, we found the beneficial effect of educational level on all-cause mortality appeared to be more pronounced in younger patients, similar to other studies.4,27 With increasing age, biological factors may contribute more than socioeconomic factors to determine the health.28 Besides, after retirement, there are often greater reductions in some psychosocial risk factors in patients with low SES, such as occupational stress.29 In contrast, in young patients, lack of awareness or concern of long-term impacts of chronic disease such as diabetes, competing priorities, and psychosocial factors may interact with socioeconomic differentials to increase the long-term disease burden.
Various models have been proposed to explain socioeconomic inequalities in health.9,17,30 Health-related behaviors, access to health care, and processes of care are considered to be the main mechanisms linking SES and health outcomes among patients with diabetes.17 Generally, patients with low SES in more developed countries have worse patterns of health-related behaviors and less access to health care and are less likely to receive important processes of care. However, in Hong Kong, all citizens had access to highly subsidized care where integrated team-based diabetes care, with nurse-coordinated diabetes centers, is available to most hospitals.31 Indeed, patients with low educational level had better patterns of health-related behaviors with more regular medical follow-up and higher rates of treatments for diabetes, hypertension, and dyslipidemia at enrollment. However, these patients were older at diabetes diagnosis and had longer diabetes duration, which might contribute to higher prevalence of comorbidities, poorer metabolic control, and greater requirement for medications and health care at baseline. In addition, longer diabetes duration potentially gives patients more opportunities to receive diabetes education, which could result in an improvement of health-related behaviors that may help improve the natural history of the condition. In contrast, patients with lower educational level may have lower health awareness with delayed presentation and older age of diagnosis than patients with higher educational level.32 Despite the availability of comprehensive assessment, nonadherence to appointment may be a contributing factor to the longer diabetes duration at enrollment to the JADE program in patients with lower educational level compared to those with higher educational level.
We found that baseline diabetes-related comorbidities and metabolic risk factors were more common among patients with low educational level. The effect of educational level on CVD and mortality was largely attenuated after adjustment for either diabetes-related comorbidities or metabolic risk factors. This finding suggests that educational level is likely to affect the risk of CVD and all-cause mortality through the association with diabetes-related comorbidities and metabolic risk factors. This information is a key for clinical management of patients with type 2 diabetes. There is conclusive evidence showing that lower rates of diabetes-related comorbidities and attaining multiple metabolic targets could effectively reduce CVD risk and mortality in type 2 diabetes.33–36 Therefore, health care and social policies aimed at reducing socioeconomic inequalities in CVD and all-cause mortality in type 2 diabetes should prioritize the control of diabetes-related comorbidities and metabolic risk factors among younger individuals with low educational level. Though interventions at the individual level can be expected to have beneficial effects on health outcomes, policies are also needed to address the upstream determinants of health such as education. Our study highlights the potential importance of universal education that may have long-term health impacts.
Strengths and limitations
Our study has some limitations. Educational attainment is only one component of a person’s SES. Different measures of SES may have different effects on people’s health outcomes and through different mechanisms.32 However, information on other measures of SES other than educational level was not available in our database. We were not able to investigate the effects of other SES measures on the risk of CVD and all-cause mortality such as income and area-based measures of SES and whether the effects of educational level on the risk of CVD and all-cause mortality were independent of other SES measures. In addition, we have included patients with prevalent diabetes at enrollment to the JADE program in the analyses and have therefore excluded patients who died before having the opportunity to enroll in the JADE program. If, as expected, patients with lower educational level were more likely to be excluded for this reason than patients with higher educational level, the inverse association between educational level and all-cause mortality is likely to have been underestimated. Furthermore, a single time-point assessment of health-related behaviors and metabolic risk factors at enrollment might not be sensitive enough to measure their cumulative effects on long-term health outcomes or to investigate potential interactions with SES. Finally, patients enrolled in the JADE program may not be representative of the Hong Kong Chinese patients with diabetes, younger mean age at the diagnosis of diabetes, and lower proportion of women in the JADE database compared to patients with diabetes identified from public sector health records.37 It is possible that socioeconomic differences observed in our study are greater than those in all Hong Kong Chinese with diabetes, given the narrowing of inequalities in older age.
Despite these limitations, this study has several strengths. The outcome ascertainment in our study was complete, and accuracy of recording is unlikely to differ markedly by educational level. Due to the universal and equitable health care systems in Hong Kong, access to public hospitals and clinics is less likely to be affected by SES or people’s payment ability.38 Data from our study have showed that more than 97% of patients reported having regular medical follow-up more than once a year at enrollment, indicating that socioeconomic difference in CVD ascertainment in our population was unlikely. In addition, we had comprehensive demographic and clinical data of patients at baseline, which enabled us to explore various potential pathways linking educational level and risk of CVD and all-cause mortality.
Conclusion
Using data from the JADE program, we have shown that educational level is inversely associated with the risk of CVD and all-cause mortality among Hong Kong Chinese patients with type 2 diabetes. Hong Kong Chinese with type 2 diabetes and low educational level should be given special attention for the prevention of key complications of diabetes.
Acknowledgments
The authors thank all health care professionals especially nurses for using the JADE protocol to assess and educate the patients and all patients for contributing their anonymized data for research and publication purpose. The work was partially supported by the Asia Diabetes Foundation.
Author contributions
HJW and JCNC wrote the first draft of the manuscript. HJW, JCNC, AL, SHW, and DG designed the study and the analysis plan. HJW analyzed the data. All authors contributed to interpretation of the results and to the discussion, critically reviewed the article, and approved the final version of the article.
Disclosure
The authors report no conflicts on interest in this work
References
Stirban AO, Tschoepe D. Cardiovascular complications in diabetes: targets and interventions. Diabetes Care. 2008;31 Suppl 2:S215–S221. | ||
Fox CS, Coady S, Sorlie PD, et al. Trends in cardiovascular complications of diabetes. JAMA. 2004;292(20):2495–2499. | ||
Nwaneri C, Cooper H, Bowen-Jones D. Mortality in type 2 diabetes mellitus: magnitude of the evidence from a systematic review and meta-analysis. Br J Diabetes Vasc Dis. 2013;13(4):192–207. | ||
Walker JJ, Livingstone SJ, Colhoun HM, et al. Effect of socioeconomic status on mortality among people with type 2 diabetes: a study from the Scottish Diabetes Research Network Epidemiology Group. Diabetes Care. 2011;34(5):1127–1132. | ||
Cutler DM, Lleras-Muney A, Vogl T. Socioeconomic Status and Health: Dimensions and Mechanisms. Cambridge, MA: National Bureau of Economic Research; 2008. | ||
Adler NE, Newman K. Socioeconomic disparities in health: pathways and policies. Health Aff. 2002;21(2):60–76. | ||
Clark AM, Desmeules M, Luo W, Duncan AS, Wielgosz A. Socioeconomic status and cardiovascular disease: risks and implications for care. Nat Rev Cardiol. 2009;6(11):712–722. | ||
Mackenbach JP, Stirbu I, Roskam AJ, et al. Socioeconomic inequalities in health in 22 European countries. N Engl J Med. 2008;358(23):2468–2481. | ||
Stringhini S, Sabia S, Shipley M, et al. Association of socioeconomic position with health behaviors and mortality. JAMA. 2010;303(12):1159–1166. | ||
Saydah SH, Imperatore G, Beckles GL. Socioeconomic status and mortality: contribution of health care access and psychological distress among U.S. adults with diagnosed diabetes. Diabetes Care. 2013;36(1):49–55. | ||
Rawshani A, Svensson AM, Zethelius B, Eliasson B, Rosengren A, Gudbjörnsdottir S. Association between socioeconomic status and mortality, cardiovascular disease, and cancer in patients with type 2 diabetes. JAMA Intern Med. 2016;176(8):1146–1154. | ||
Newsom JT, Huguet N, Mccarthy MJ, et al. Health behavior change following chronic illness in middle and later life. J Gerontol B Psychol Sci Soc Sci. 2012;67(3):279–288. | ||
Chan JC, Malik V, Jia W, et al. Diabetes in Asia: epidemiology, risk factors, and pathophysiology. JAMA. 2009;301(20):2129–2140. | ||
Luk AO, Li X, Zhang Y, et al. Quality of care in patients with diabetic kidney disease in Asia: The Joint Asia Diabetes Evaluation (JADE) Registry. Diabet Med. 2016;33(9):1230–1239. | ||
Ko GT, So WY, Tong PC, et al. From design to implementation--the Joint Asia Diabetes Evaluation (JADE) program: a descriptive report of an electronic web-based diabetes management program. BMC Med Inform Decis Mak. 2010;10(1):26. | ||
Luk AO, Lau ES, So WY, et al. Prospective study on the incidences of cardiovascular-renal complications in Chinese patients with young-onset type 1 and type 2 diabetes. Diabetes Care. 2014;37(1):149–157. | ||
Brown AF, Ettner SL, Piette J, et al. Socioeconomic position and health among persons with diabetes mellitus: a conceptual framework and review of the literature. Epidemiol Rev. 2004;26(1):63–77. | ||
Jackson CA, Jones NR, Walker JJ, et al. Area-based socioeconomic status, type 2 diabetes and cardiovascular mortality in Scotland. Diabetologia. 2012;55(11):2938–2945. | ||
Fine JP, Gray RJ. A Proportional Hazards Model for the Subdistribution of a Competing Risk. J Am Stat Assoc. 1999;94(446):496–509. | ||
Blomster JI, Zoungas S, Woodward M, et al. The impact of level of education on vascular events and mortality in patients with type 2 diabetes mellitus: Results from the ADVANCE study. Diabetes Res Clin Pract. 2017;127:212–217. | ||
Rawshani A, Svensson AM, Rosengren A, Eliasson B, Gudbjörnsdottir S. Impact of socioeconomic status on cardiovascular disease and mortality in 24,947 individuals with type 1 Diabetes. Diabetes Care. 2015;38(8):1518–1527. | ||
Secrest AM, Costacou T, Gutelius B, Miller RG, Songer TJ, Orchard TJ. Associations between socioeconomic status and major complications in type 1 diabetes: the Pittsburgh epidemiology of diabetes complication (EDC) Study. Ann Epidemiol. 2011;21(5):374–381. | ||
Lam YM, Lau EM, Donnan SP. Geographical and socio-economic variations in ischaemic heart disease in men in Hong Kong. Ann Acad Med Singapore. 1984;13(2):211–215. | ||
Wong SL, Donnan SP. Influence of socioeconomic status on cardiovascular diseases in Hong Kong. J Epidemiol Community Health. 1992;46(2):148–150. | ||
Schooling CM, Lau EW, Tin KY, Leung GM. Social disparities and cause-specific mortality during economic development. Soc Sci Med. 2010;70(10):1550–1557. | ||
World Health Organization [homepage on the Internet]. Noncommunicable disease risk factors and socioeconomic inequalities - what are the links? A multicountry analysis of noncommunicable disease surveillance data. Available from: http://www.wpro.who.int/publications/docs/WHOSESFINALforupload.pdf. Accessed October 11, 2018. | ||
Gnavi R, Petrelli A, Demaria M, Spadea T, Carta Q, Costa G. Mortality and educational level among diabetic and non-diabetic population in the Turin Longitudinal Study: a 9-year follow-up. Int J Epidemiol. 2004;33(4):864–871. | ||
Mirowsky J, Ross CE. Education and self-rated health: cumulative advantage and its rising importance. Res Aging. 2008;30(1):93–122. | ||
House JS, Lepkowski JM, Kinney AM, Mero RP, Kessler RC, Herzog AR. The social stratification of aging and health. J Health Soc Behav. 1994;35(3):213–234. | ||
Kaplan GA, Pamuk ER, Lynch JW, Cohen RD, Balfour JL. Inequality in income and mortality in the United States: analysis of mortality and potential pathways. BMJ. 1996;312(7037):999–1003. | ||
Luk AOY, Hui EMT, Sin MC, et al. Declining trends of cardiovascular-renal complications and mortality in type 2 diabetes: the Hong Kong Diabetes Database. Diabetes Care. 2017;40(7):928–935. | ||
Galobardes B, Shaw M, Lawlor DA, Lynch JW, Davey Smith G, Smith GD. Indicators of socioeconomic position (part 1). J Epidemiol Community Health. 2006;60(1):7–12. | ||
Zhao W, Katzmarzyk PT, Horswell R, Wang Y, Johnson J, Hu G. HbA1c and coronary heart disease risk among diabetic patients. Diabetes Care. 2014;37(2):428–435. | ||
Gaede P, Lund-Andersen H, Parving HH, Pedersen O. Effect of a multifactorial intervention on mortality in type 2 diabetes. N Engl J Med. 2008;358(6):580–591. | ||
Afkarian M, Sachs MC, Kestenbaum B, et al. Kidney disease and increased mortality risk in type 2 diabetes. J Am Soc Nephrol. 2013;24(2):302–308. | ||
Cheung N, Wang JJ, Klein R, Couper DJ, Sharrett AR, Wong TY. Diabetic retinopathy and the risk of coronary heart disease. Diabetes Care. 2007;30(7):1742–1746. | ||
Quan J, Li TK, Pang H, et al. Diabetes incidence and prevalence in Hong Kong, China during 2006-2014. Diabet Med. 2017;34(7):902–908. | ||
Kong X, Yang Y, Gao J, et al. Overview of the health care system in Hong Kong and its referential significance to mainland China. J Chin Med Assoc. 2015;78(10):569–573. |
Supplementary materials
 | Table S1 Characteristics of patients with (n=12,634) and without (n=14,014) complete data: Hong Kong, 2007–2017 Notes: Data are mean (SD) or n (%), unless otherwise indicated. Missing data for participants without complete data were 667 for age at the diagnosis of diabetes, 1 for age at enrollment, 667 for diabetes duration, 4 for smoking, 8 for the use of alcohol, 42 for regular physical activity, 30 for good adherence to balanced diet, 12 for regular medical follow-up, 39 for diabetes education, 12 for antihypertensive drugs, 10 for lipid lowering drugs, 104 for diabetic retinopathy, 4 for sensory neuropathy, 280 for albuminuria, 24 for BMI, 25 for waist circumference, 33 for waist-to-hip ratio, 6 for SBP, 6 for DBP, 5 for hypertension, 25 for HbA1c, 57 for fasting plasma glucose, 62 for HDL cholesterol, 265 for LDL cholesterol, 53 for triglycerides. aHypertension defined as SBP ≥130 or DBP ≥80 or taking antihypertensive drugs. Abbreviations: BMI, body mass index; HbA1c, hemoglobin A1c; HDL, high-density lipoprotein; LDL, low-density lipoprotein. |
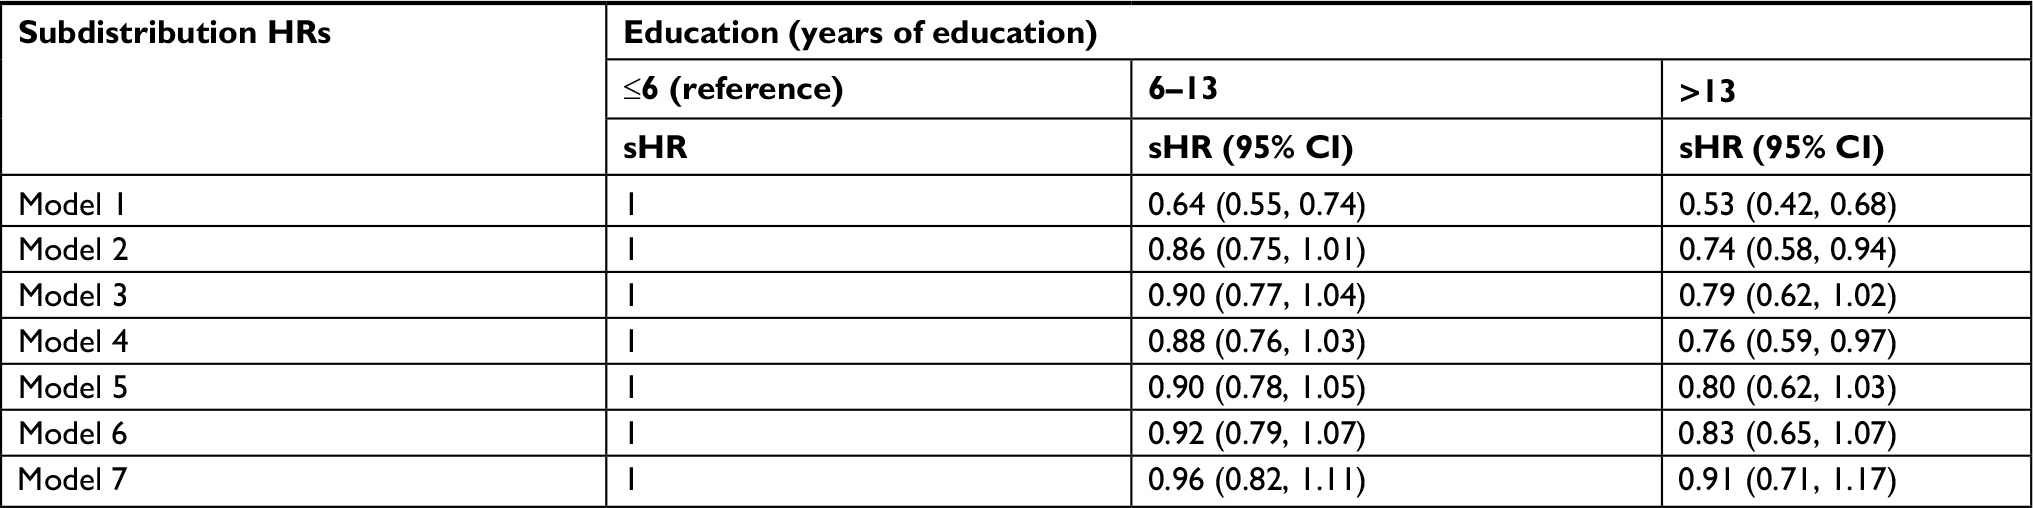 | Table S2 Subdistribution HRs for incident CVD according to educational level (n=12,634): Hong Kong, 2007–2017 Notes: Model 1: adjusted for age and sex. Model 2: adjusted for age, sex, diabetes duration, and family history of diabetes. Model 3: model 2+ health behaviors (including smoking, use of alcohol, physical activity, and adherence to balanced diet). Model 4: model 2+ treatment (including regular medical follow-up, diabetes education, oral antidiabetic drugs, use of insulin, antihypertensive drugs, and lipid-regulating drugs). Model 5: model 2+ baseline prevalent comorbidities (including cancer, albuminuria, diabetic retinopathy, sensory neuropathy, end-stage renal disease, and chronic kidney disease). Model 6: model 2+ baseline metabolic risk factors (body mass index, waist-to-hip ratio, SBP, DBP, hemoglobin A1c, fasting blood glucose, high-density lipoprotein cholesterol, low-density lipoprotein cholesterol, and triglycerides). Model 7: adjusted for all variables listed above. Abbreviations: CVD, cardiovascular disease; sHR, subdistribution HR. |
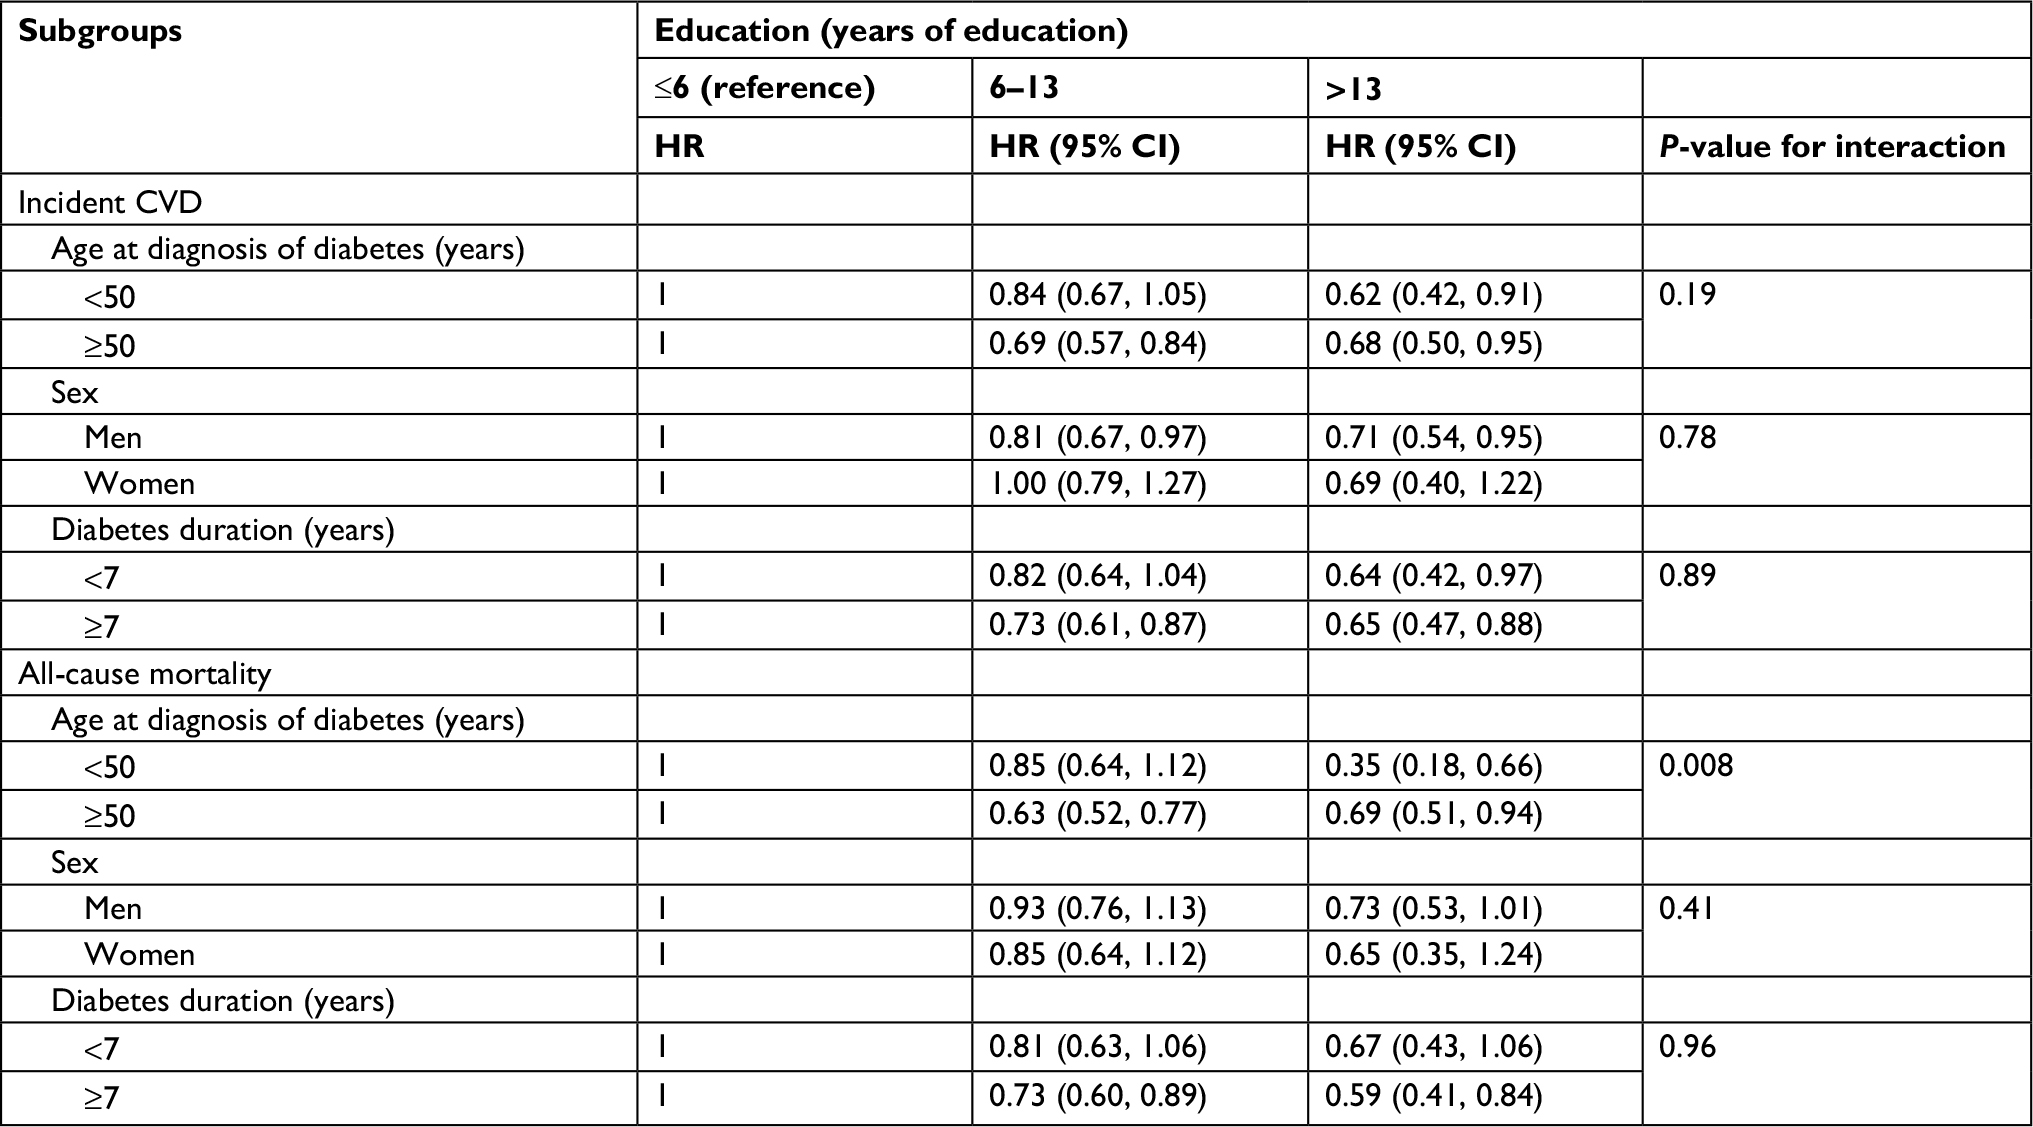 | Table S3 HRs for incident CVD and all-cause mortality according to educational level in strata for age, sex, and diabetes duration: Hong Kong, 2007–2017 Note: All models were adjusted for age at the diagnosis of diabetes, sex (as appropriate), diabetes duration, and family history of diabetes. Abbreviation: CVD, cardiovascular disease. |
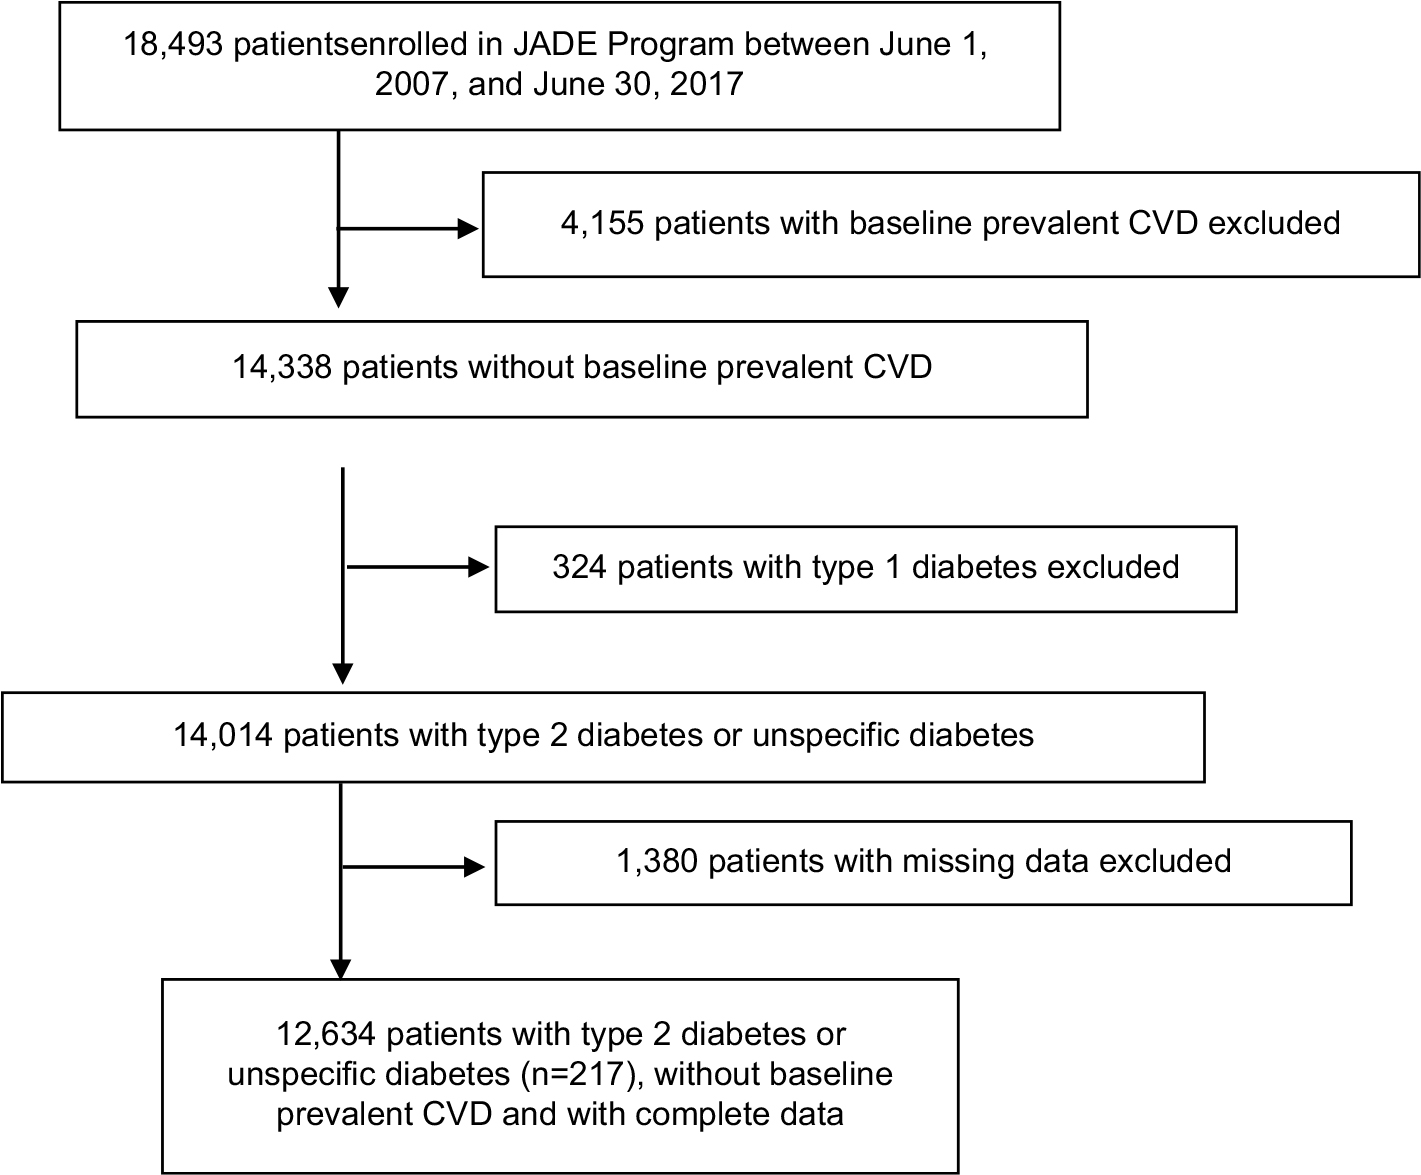 | Figure S1 Selection of patients for investigation of the association between educational level and incident CVD or all-cause mortality: Hong Kong, 2007–2017. Abbreviation: CVD, cardiovascular disease. |
 © 2018 The Author(s). This work is published and licensed by Dove Medical Press Limited. The
full terms of this license are available at https://www.dovepress.com/terms
and incorporate the Creative Commons Attribution
- Non Commercial (unported, 3.0) License.
By accessing the work you hereby accept the Terms. Non-commercial uses of the work are permitted
without any further permission from Dove Medical Press Limited, provided the work is properly
attributed. For permission for commercial use of this work, please see paragraphs 4.2 and 5 of our Terms.
© 2018 The Author(s). This work is published and licensed by Dove Medical Press Limited. The
full terms of this license are available at https://www.dovepress.com/terms
and incorporate the Creative Commons Attribution
- Non Commercial (unported, 3.0) License.
By accessing the work you hereby accept the Terms. Non-commercial uses of the work are permitted
without any further permission from Dove Medical Press Limited, provided the work is properly
attributed. For permission for commercial use of this work, please see paragraphs 4.2 and 5 of our Terms.