Back to Journals » Diabetes, Metabolic Syndrome and Obesity » Volume 16
Association Between Different Metabolic Markers and Metabolic Syndrome in an Outpatient Hyperuricemia Population: A Cross-Sectional Study
Authors Li X, Huang B, Liu Y, Wang M ![]() , Wang YX, Feng KL, Cui JQ
, Wang YX, Feng KL, Cui JQ ![]()
Received 25 October 2023
Accepted for publication 26 November 2023
Published 4 December 2023 Volume 2023:16 Pages 3967—3978
DOI https://doi.org/10.2147/DMSO.S443472
Checked for plagiarism Yes
Review by Single anonymous peer review
Peer reviewer comments 2
Editor who approved publication: Prof. Dr. Juei-Tang Cheng
Xin Li,* Bo Huang,* Yue Liu, Meng Wang, Yi-Xuan Wang, Kai-Lei Feng, Jing-Qiu Cui
Department of Endocrinology and Metabolism, Tianjin Medical University General Hospital, Tianjin, People’s Republic of China
*These authors contributed equally to this work
Correspondence: Jing-Qiu Cui, Department of Endocrinology and Metabolism, Tianjin Medical University General Hospital, An Shan Dao 154, Tianjin, 300052, People’s Republic of China, Tel +86-13920765604, Email [email protected]
Background: Hyperuricemia (HUA) is often associated with metabolic syndrome (MetS). However, the role of different metabolic markers in the screening of MetS in out-patients with hyperuricemia is unclear. The study aims to investigate the relationship between different metabolic indexes and MetS.
Methods: A total of 399 hyperuricemia patients from Tianjin Medical University General Hospital from 2022 to 2023 were included in this study. We collected demographic, anthropometric, and biochemical data on each subject. And calculate serum uric acid-to-creatinine ratio (SUA/Cr), serum uric acid to high-density lipoprotein cholesterol (UHR), triglyceride to high-density lipoprotein cholesterol (THR), and triglyceride and glucose (TyG) index. Binary logistic regression modeling was performed to explore the association between different metabolic markers and MetS.
Results: Out of the 399 subjects, 28.3% had MetS. UHR, THR, and TyG index were significantly higher in the MetS group than those in the control group (p< 0.05), which were associated with an increased risk of MetS. However, SUA/Cr was not associated with MetS (p> 0.05). TyG index had a stronger relationship with the risk of MetS (OR 5.476, 95% CI 2.210– 13.569, p< 0.001). The cut-off with the biggest Youden index of the TyG index was 9.13 and the area under the curve (AUC) was 0.719.
Conclusion: A high TyG index is associated with an increased risk of MetS in HUA patients. These findings might help screen MetS in individuals with HUA and could be more standardized management of patients with high uric acid in outpatient clinics.
Keywords: metabolic syndrome, serum uric acid-to-creatinine ratio, serum uric acid to high-density lipoprotein cholesterol, triglyceride to high-density lipoprotein cholesterol, TyG index
Introduction
Metabolic syndrome (MetS) is a collection of hypertension, diabetes, obesity, high levels of triglyceride (TG), and low levels of high-density lipoprotein cholesterol (HDL-c).1 According to a report of 31 provinces in China, there were nearly 454 million adults who had MetS in mainland China, with the prevalence of MetS being 13.3% in those aged 35–64 years.2 MetS has become an increasingly common disease in the world.
Hyperuricemia (HUA) is an increase in the level of serum uric acid (SUA) due to excessive or insufficient urinary excretion of uric acid, or both. Recently, the prevalence of HUA has been increasing, and it is higher in males than in females, higher in urban than in rural, and higher in coastal than inland.3 Insulin resistance (IR) is one of the most important pathogens in T2DM patients and HUA. Studies have found that the hyper-insulinemic environment could lead to uric acid excretion decreasing and production increasing, which in turn leads to uric acid accumulation.4 There was a bidirectional relationship between SUA levels and MetS risk, with higher SUA levels associated with an increased risk of MetS.5–7 In addition, patients with Hyperuricemia are often seen in outpatient clinics. Therefore, it is important to predict the incidence of MetS in a Hyperuricemia population.
However, there was conflicting result. The study indicated that SUA has no apparent association with MetS,8 which may be related to the fact that levels of endogenous uric acid depend on renal clearance function. Therefore, renal function-normalized uric acid (SUA/Cr) has been as a standard SUA and a new biomarker, which is regarded as a superior indicator of net uric acid production.9 Some studies have found that SUA/Cr is associated with metabolic diseases, which is a predictor for total mortality.10,11 Moreover, high uric acid can also cause target organ damage. The recent results of the URRAH (Uric Acid Right for Heart Health) project have shown that SUA is related to cardiovascular (CV) and chronic kidney disease (CKD).12 Increasing SUA levels are associated with higher cardiovascular mortality (CVM) risk irrespective of the presence of MetS, and a cardiovascular SUA threshold may improve risk stratification.13 However, its association with MetS in hyperuricemia patients is unclear.
Studies have confirmed that UHR was associated with some diseases, such as nonalcoholic fatty liver disease (NAFLD), diabetic kidney injury (DKI), and MetS.11,14,15 THR is a useful marker for evaluating IR and arteriosclerosis disease16 and is associated with cerebrovascular disease, diabetes, and MetS.17–19 However, their association with MetS in hyperuricemia patients is unclear. In addition, the TyG index is a new indicator of insulin resistance (IR),20 but its relationship with HUA is unclear. Therefore, our study compares four metabolic markers with the prevalence of MetS.
Methods
Study Design and Populations
The cross-sectional study collected data from the endocrine clinics of Tianjin Medical University General Hospital between March 2022 and March 2023, which totaled 950 patients (Figure 1). Subjects with the following conditions were excluded: (1) Incomplete information; (2) Use drugs that affect uric acid excretion (diuretics, SGLT-2i, aspirin, and benzbromarone); (3) Autoimmune diseases, acute and chronic diseases Infected persons; (4) Tumor diseases and blood system diseases. After excluding, a total of 399 patients were enrolled.
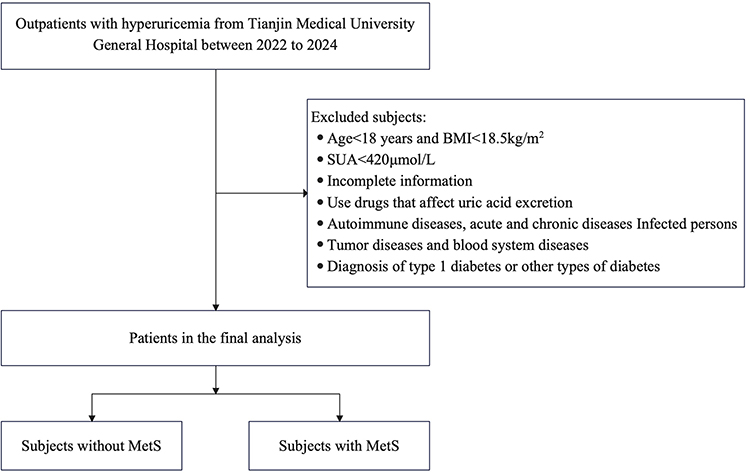 |
Figure 1 Flowchart of the cross-sectional study. |
Data Collection
The anthropometric indices and demographic characteristics were extracted from electronic medical records, including gender, age, history of diabetes and hypertension, duration of hyperuricemia, complications of hyperuricemia (gout and renal calculi), weight, and height. Fasting plasma glucose (FPG), total cholesterol (TC), triglyceride (TG), high-density lipoprotein cholesterol (HDL-c), low-density lipoprotein cholesterol (LDL-c), alanine aminotransferase (ALT), aspartate aminotransferase (AST), glutamyl transpeptidase (GGT), creatinine (Cr), and uric acid (UA) were measured by an autoanalyzer.
Definition
Body mass index (BMI) was calculated by body weight in kilograms divided by height in square meters. Moreover, SUA/Cr is the ratio of serum uric acid to creatinine, UHR is the ratio of serum uric acid to high-density lipoprotein cholesterol, THR is the ratio of triglyceride to high-density lipoprotein cholesterol, TyG = Ln [fasting plasma glucose (mg/dL) ×TG (mg/dL)/2].21 Hyperuricemia was defined differently in males and females; serum uric acid level >420 μmol/L (>7.0 mg/dL) in males and >360 μmol/L (>6.0 mg/dL) in females.22
According to the Chinese Diabetes Society Criteria,23 the patients were defined as having MetS if they had three or more of the following: (1) BMI≥25 kg/m2; (2) were receiving treatment for hypertension or had a diastolic blood pressure (DBP)≥90mm/Hg or (and) a systolic blood pressure (SBP)≥140mm/Hg; (3) had been diagnosed with diabetes or had an FPG concentration ≥6.1 mmol/L; (4) were female and had HDL-c levels<1.0 mmol/L, were male and had HDL-c concentration<0.9 mmol/L, or/and had TG levels≥1.7 mmol/L.
Statistical Analysis
Statistical analyses were performed with SPSS version 29.0 (IBM Corp., Armonk, NY). Kolmogorov–Smirnov (K-S) method was used to test the normality of the data for continuous variables (P>0.05 was significant), which were expressed as the mean ± standard deviation (SD) or the median with an interquartile range (25%, 75%). Categorical variables were presented as percentages (%). The independent sample t-test and one-way analysis of variance were used for the comparison of normally distributed variables among groups. Mann–Whitney U-test and Kruskal–Wallis H-test were used for comparison between non-normally distributed variables between groups. Categorical variables were expressed as percentages and compared between groups using the Chi-square test or Fisher’s exact test. Binary logistic regression tests were used to analyze the associations between different metabolic indexes and MetS. The receiver operating characteristics (ROC) curve was constructed to evaluate the predictive value of different induces for MetS, and the maximum Youden index determined the optimal cut-off point. A P-value <0.05 (two-sided) was regarded as statistically significant.
Results
Characteristics of Study Participants
The clinical and biochemical characteristics of the subjects are shown in Table 1. Compared with non-MetS, participants with MetS were older than non-MetS (p=0.003).
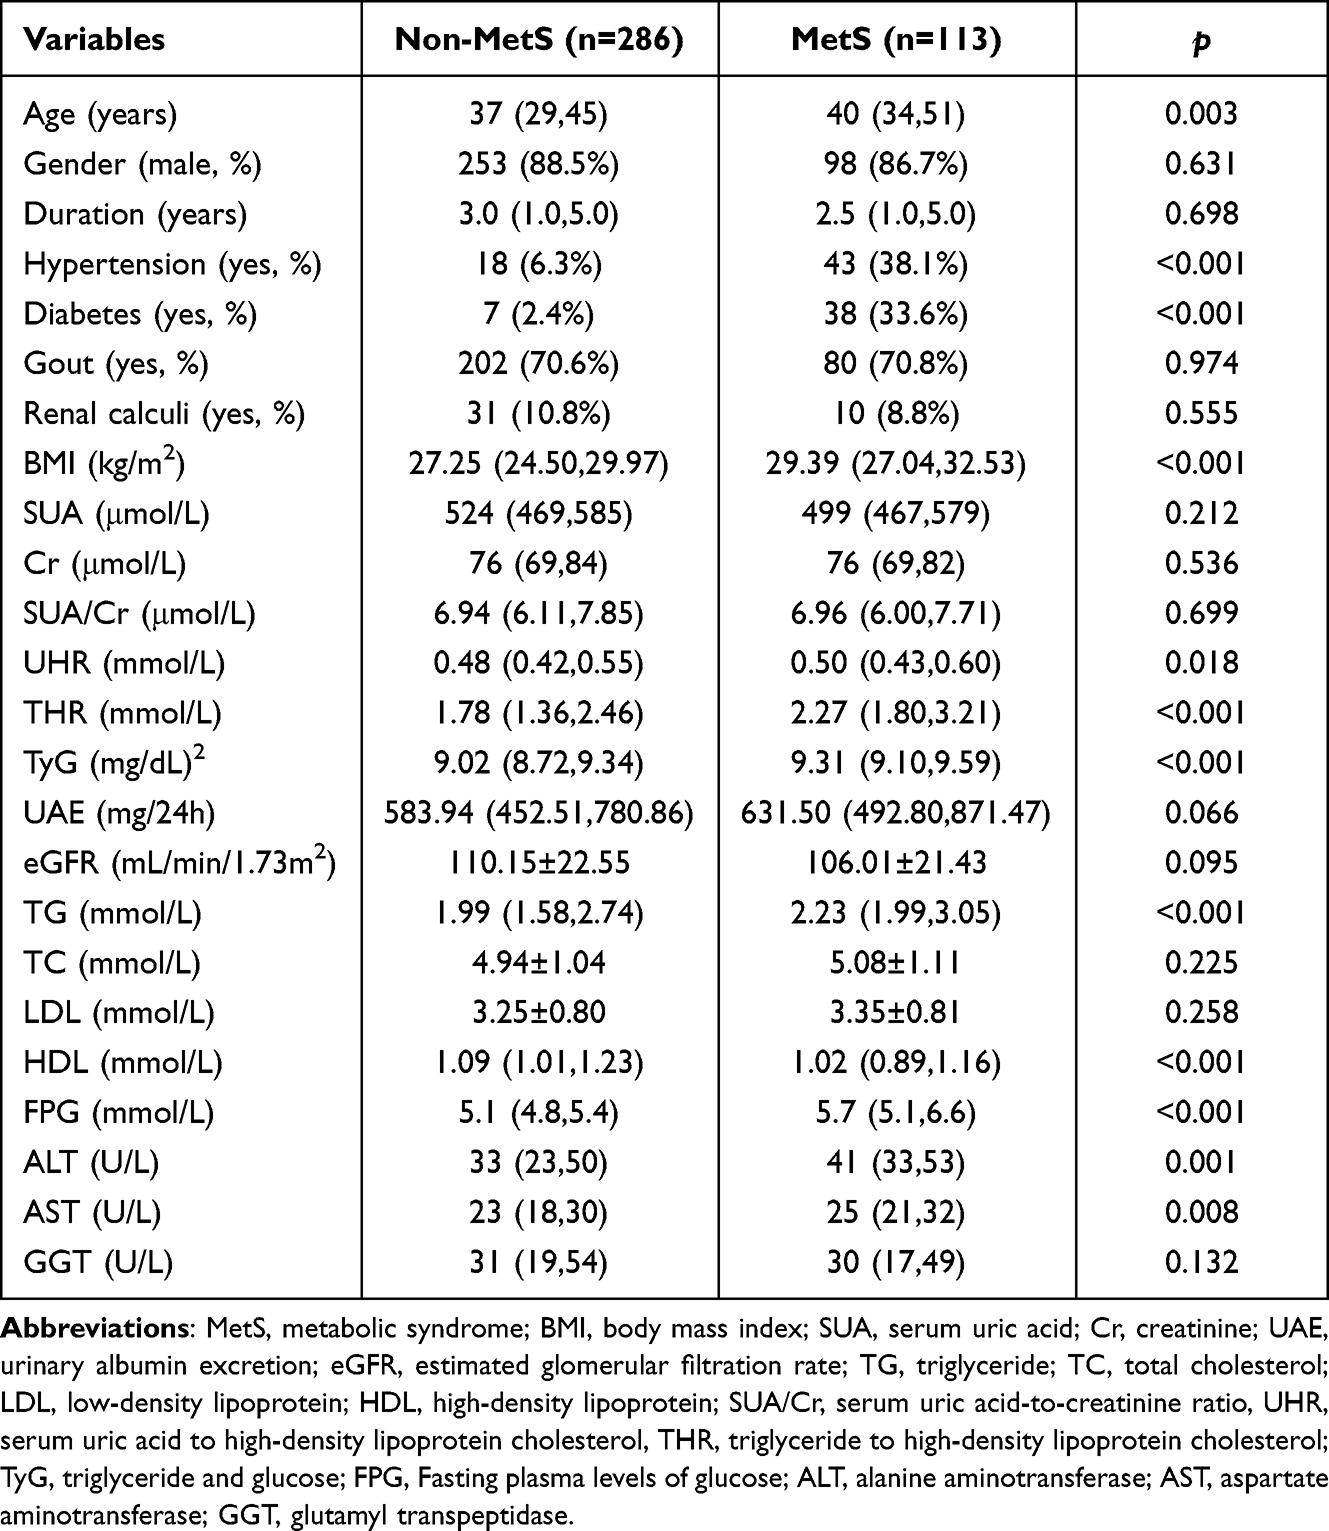 |
Table 1 General Characteristics of the Study Population |
Participants with MetS presented with higher BMI, UHR, THR, TyG index, and higher levels of TG, FPG, ALT, and AST (p<0.05). They also showed lower levels of HDL than the non-MetS individuals (p<0.001). The prevalence of type 2 diabetes (T2DM) or hypertension was higher in the MetS group (p<0.001).
The general characteristics of the study participants are summarized in Tables 2–4, according to the quartiles of UHR, THR, and TyG index. In Table 2, the patients in the Q4 group were younger than those in the Q1-Q3 group (p<0.05). BMI of Q3-Q4 was higher than that of Q1-Q2 (p<0.05). SUA/Cr is significant among groups for every UHR additional unit (p<0.05). The levels of GGT (glutamyl transpeptidase) in the Q4 group were higher than those in the Q1-Q3 group (p<0.05). However, there were no significant differences in duration, UAE (urinary albumin excretion), eGFR, FPG, AST, and the incidence of MetS (p>0.05).
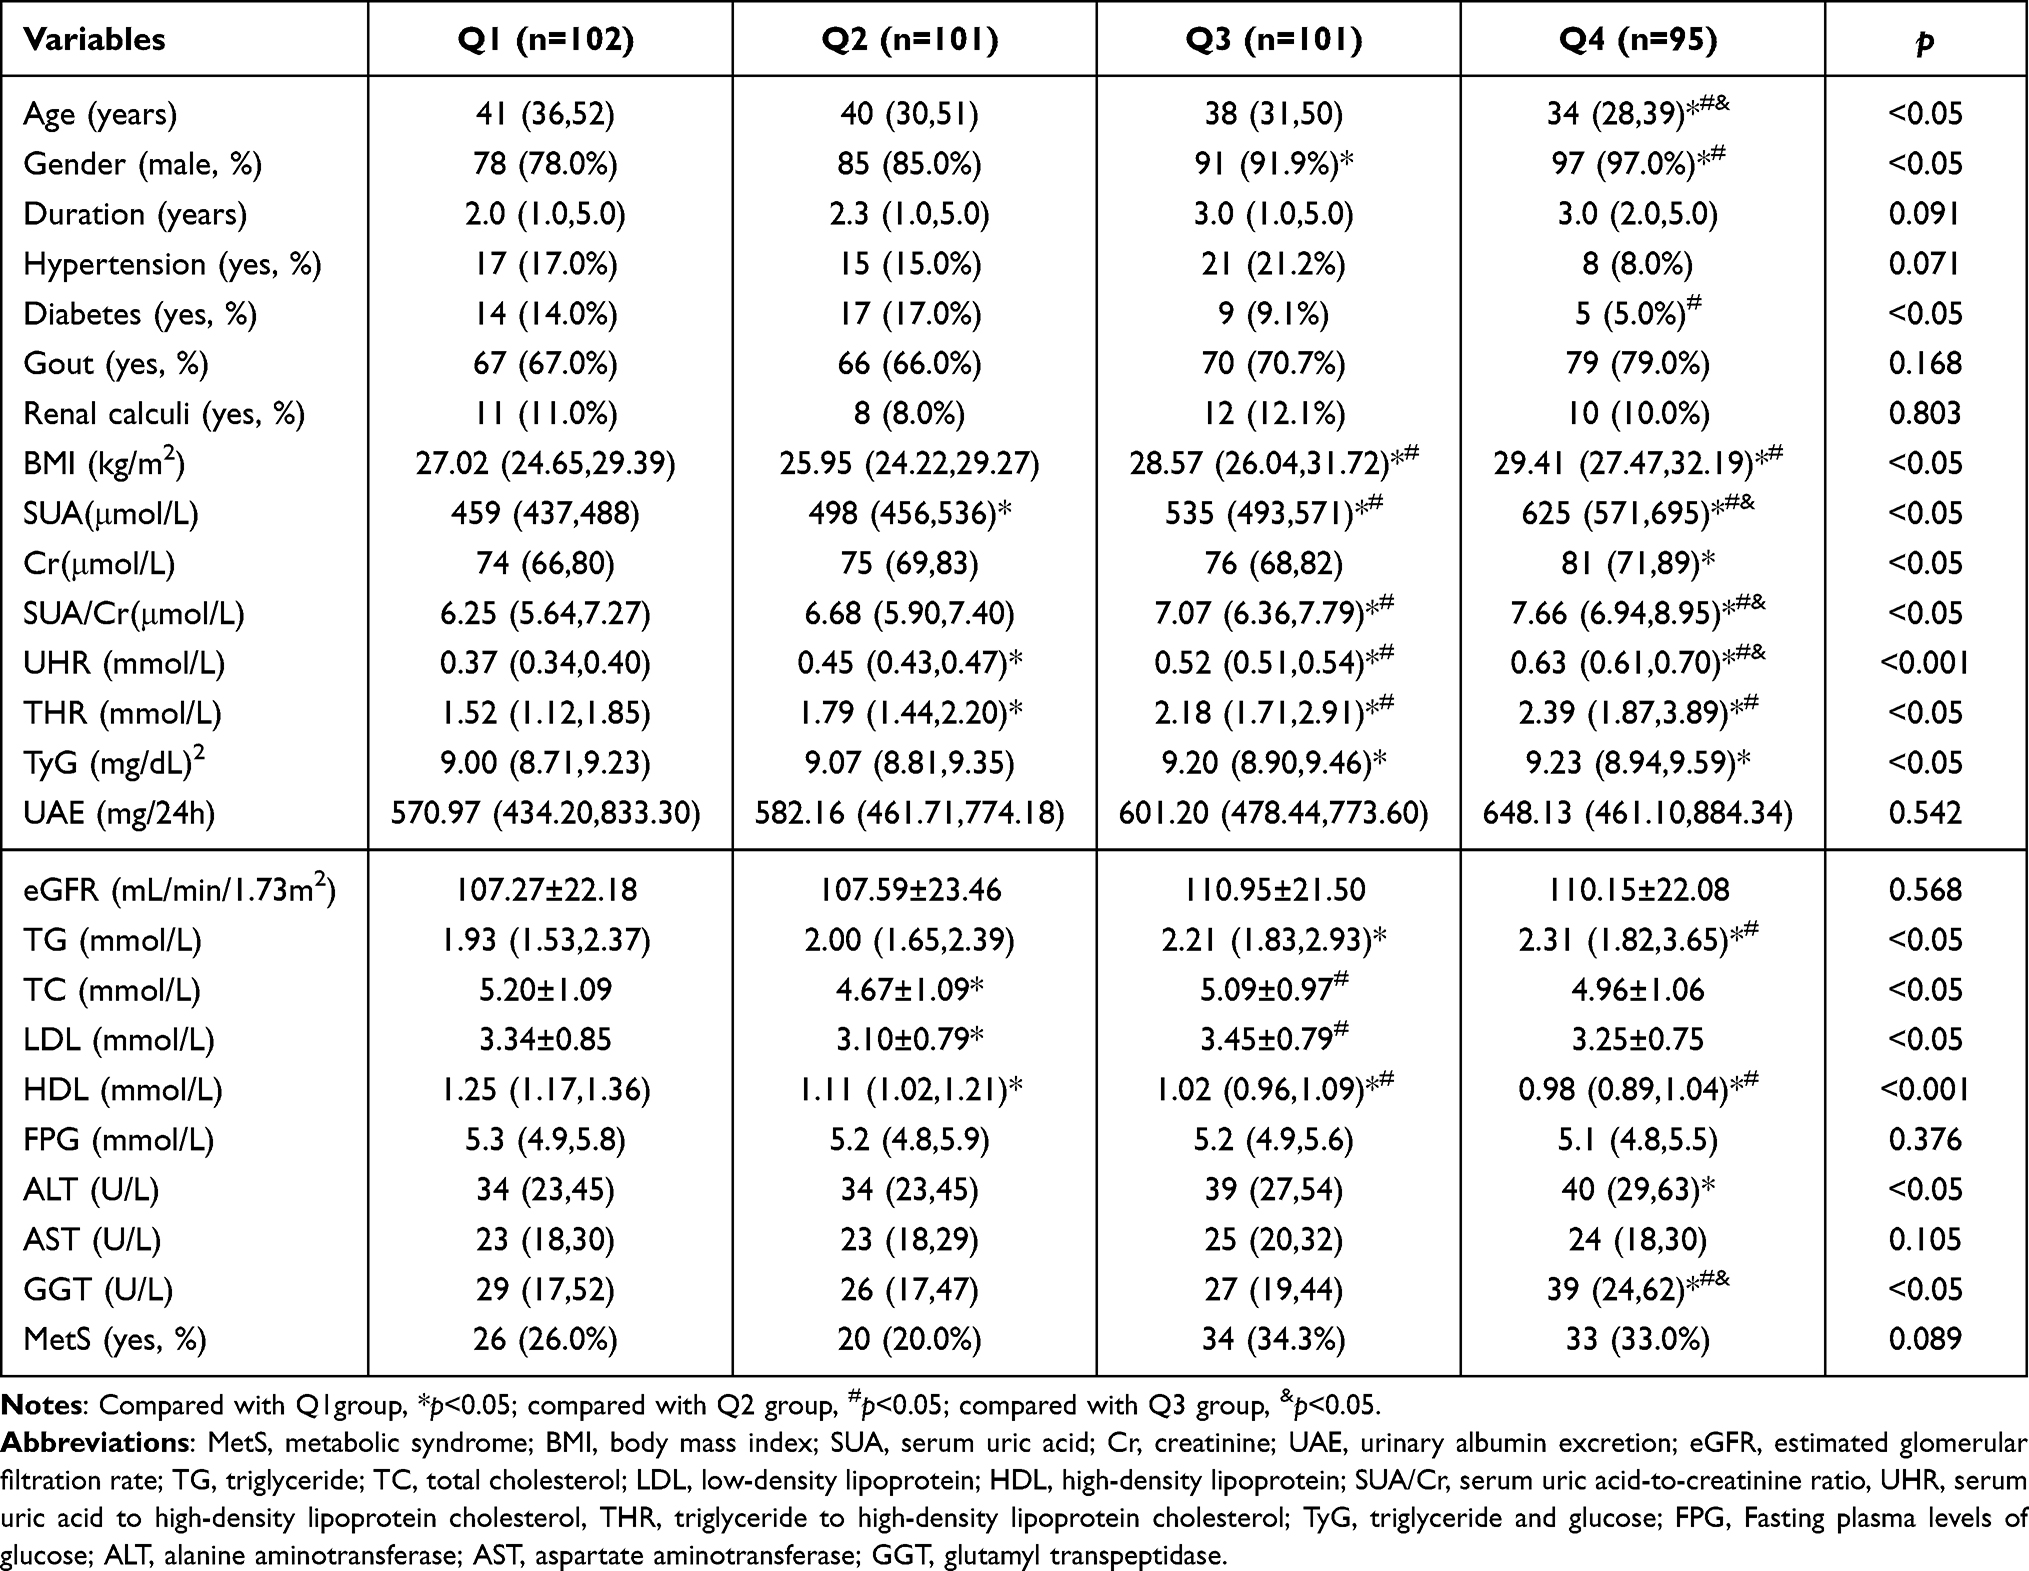 |
Table 2 Characteristics of the Patients According to UHR Quartiles |
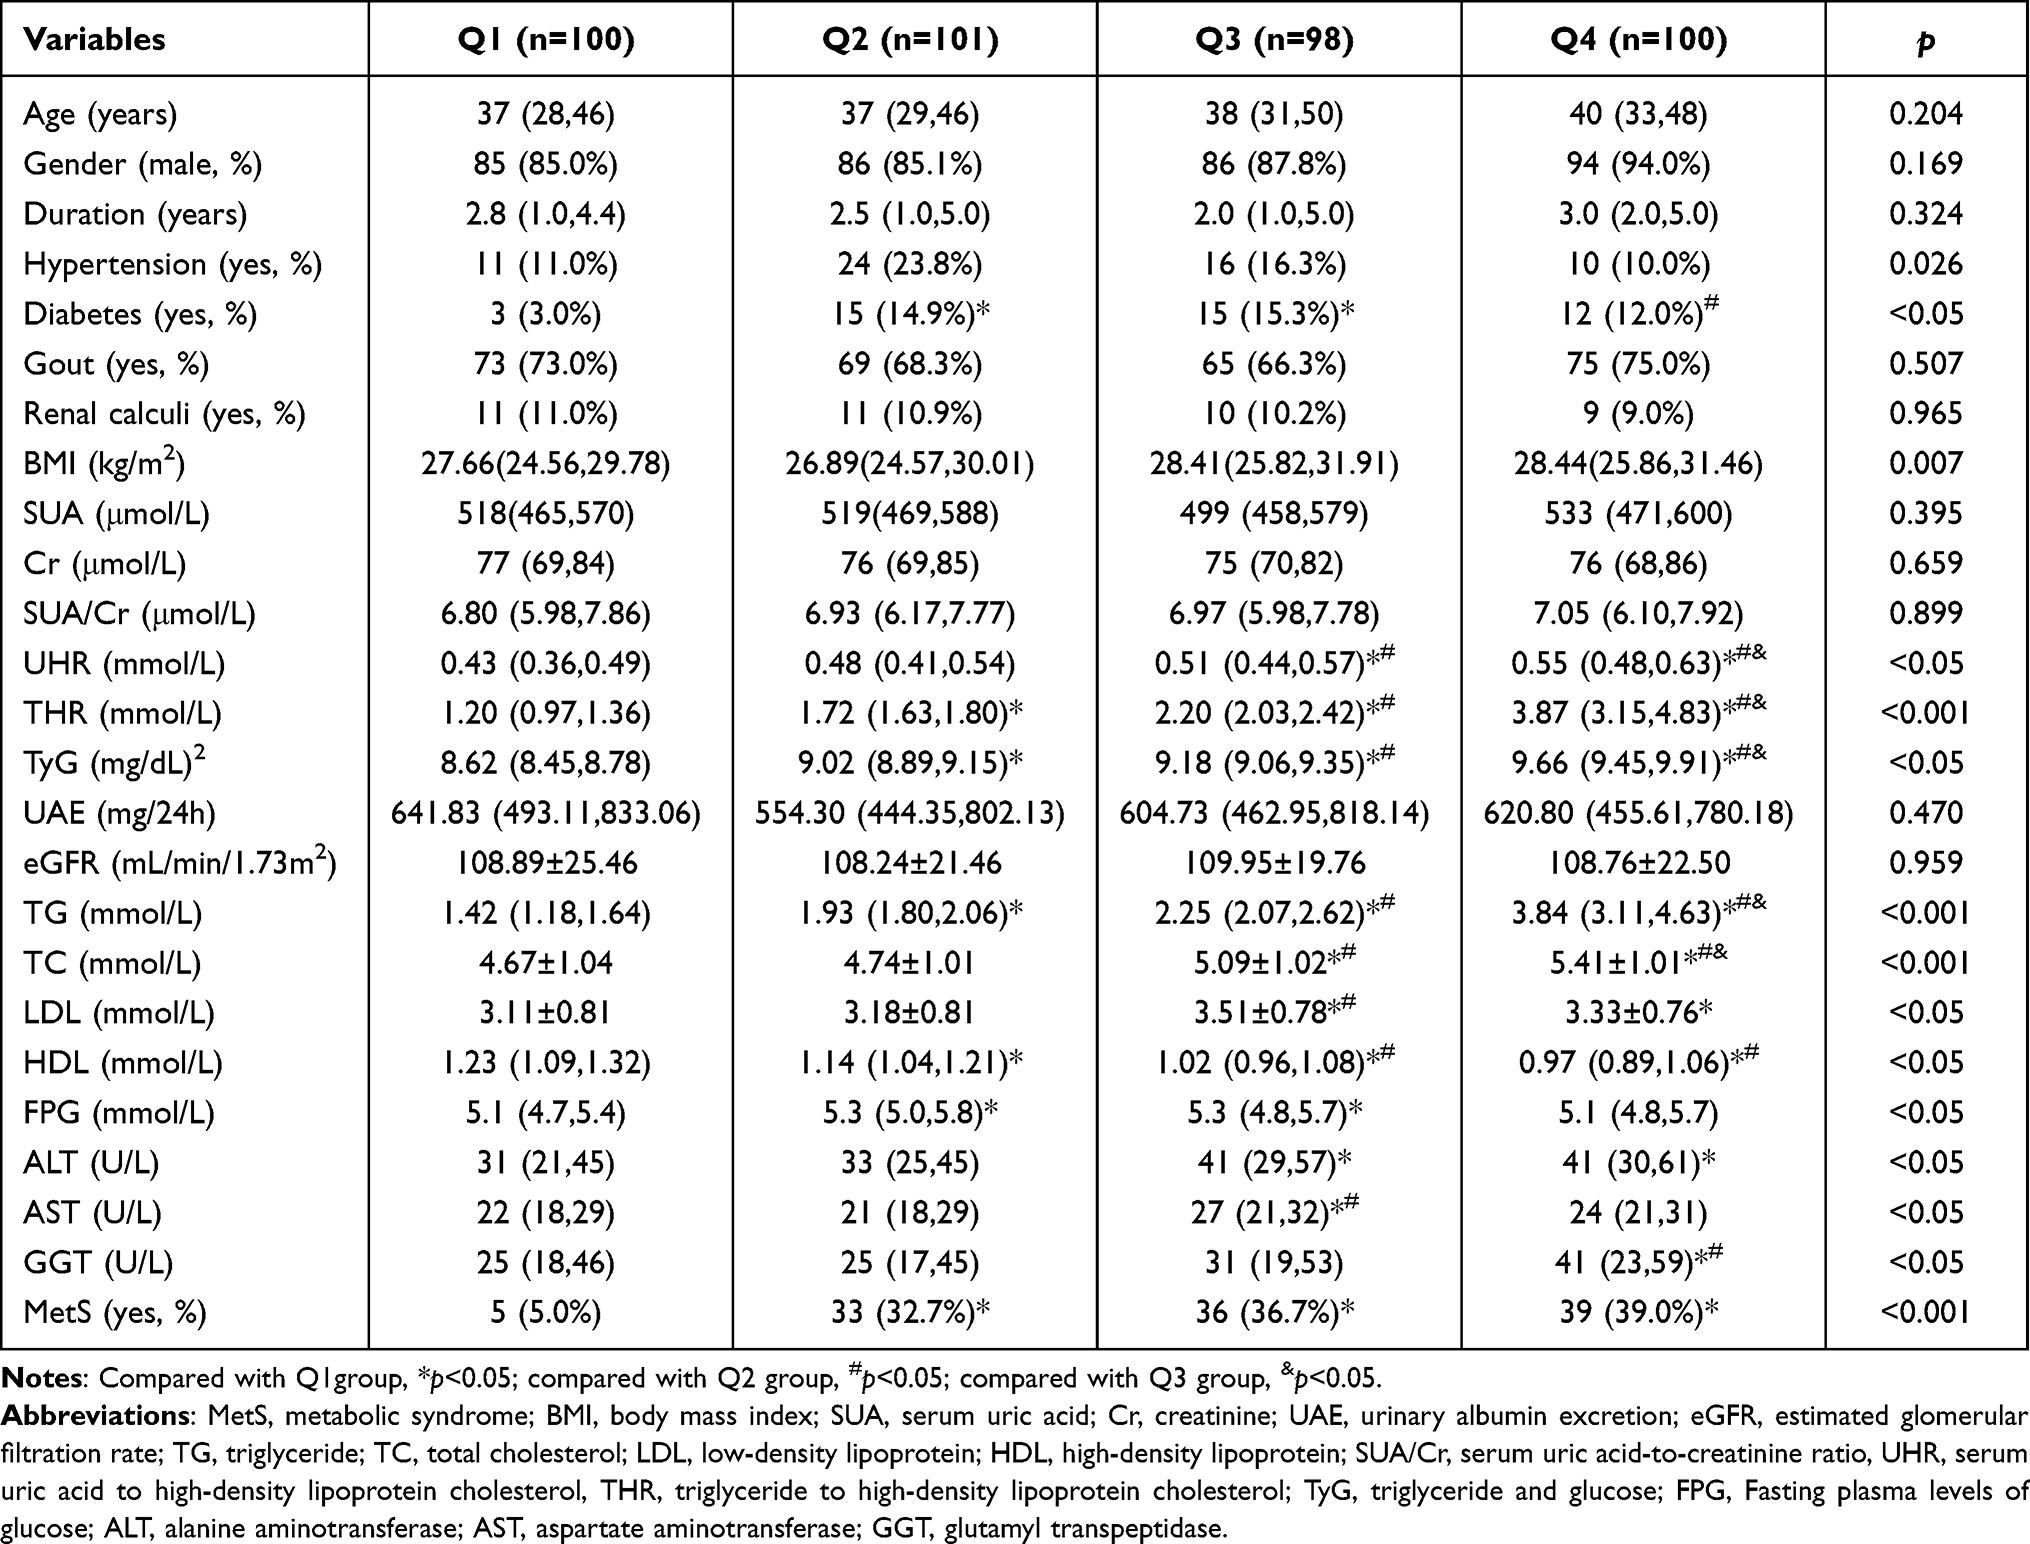 |
Table 3 Characteristics of the Patients According to THR Quartiles |
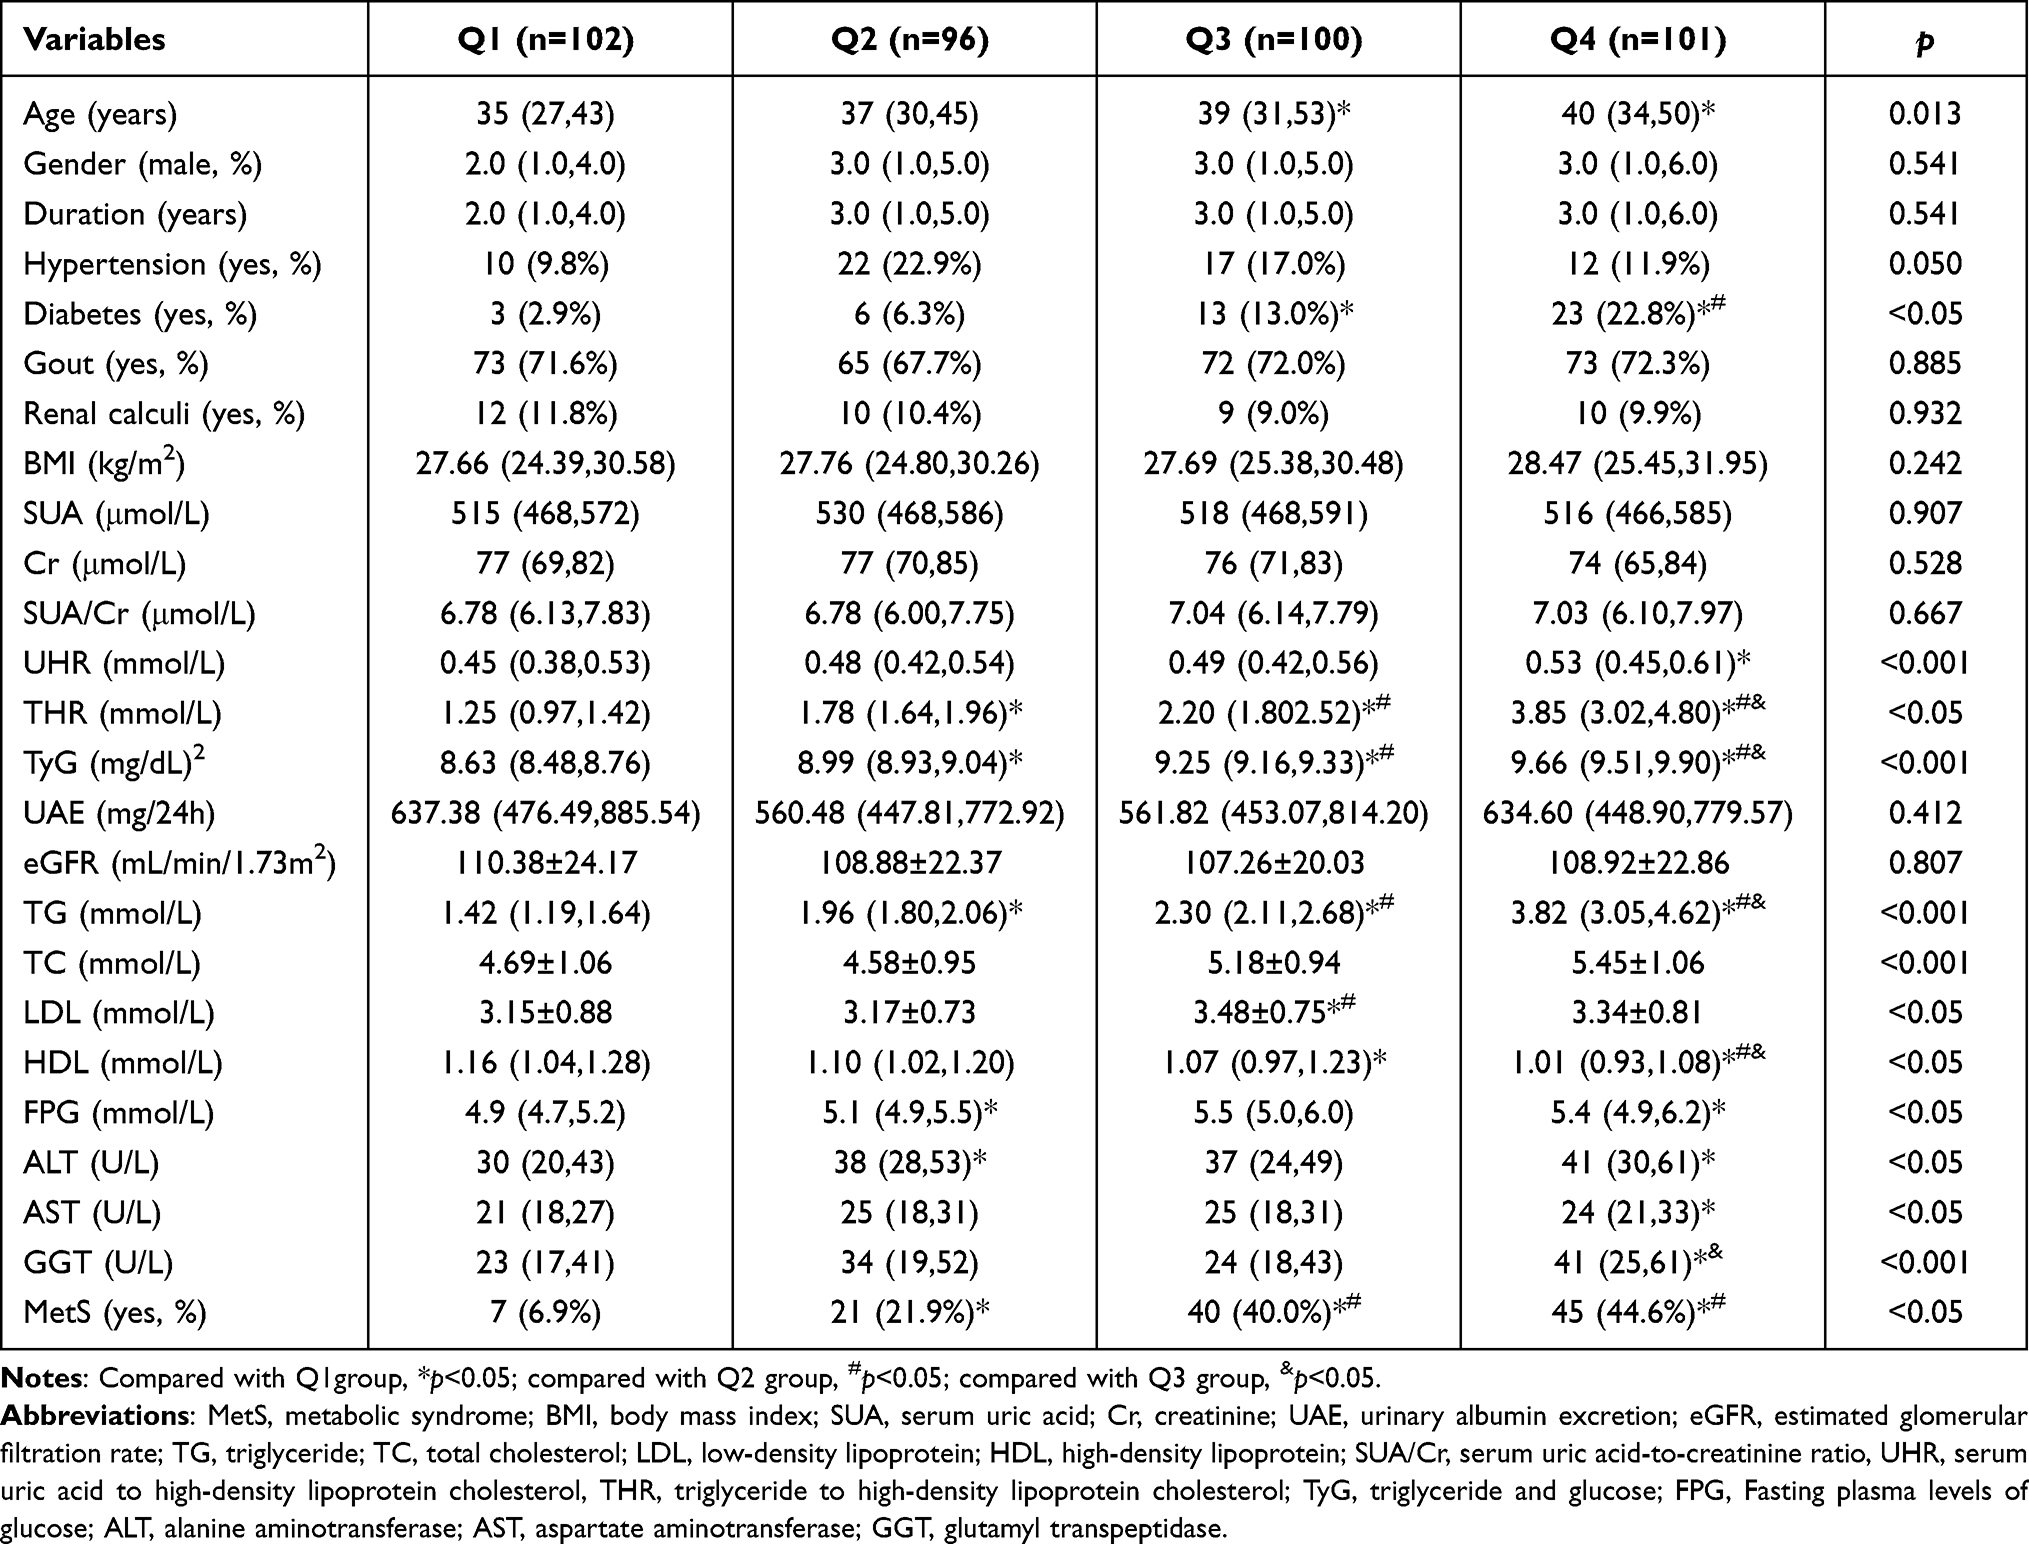 |
Table 4 Characteristics of the Patients According to TyG Index Quartiles |
In Table 3, the levels of TC and LDL in Q3 were higher than those in the Q1-Q2 group (p<0.05). TyG index is significant among groups for every THR additional unit (p<0.05). The levels of GGT in the Q4 group were higher than those in the Q1-Q2 group (p<0.05). Moreover, the incidence of MetS in the Q2-Q4 group was higher than in the Q1 group (p<0.001, Figure 2A). However, there were no significant differences in age, gender, SUA, Cr, UAE, and eGFR (p>0.05). The incidence of hypertension, gout, and renal calculi showed no significant difference among the four groups (p>0.05).
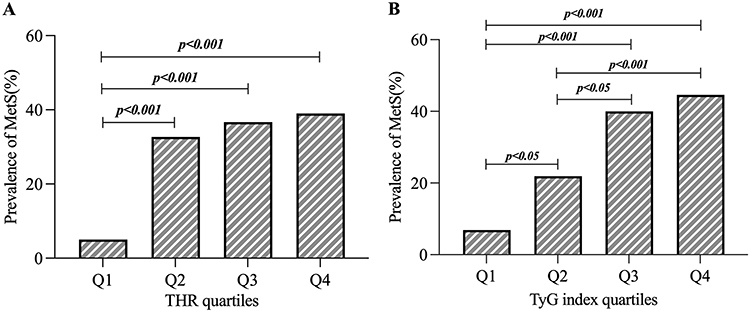 |
Figure 2 Comparison of metabolic syndrome (MetS) prevalence between triglyceride to high-density lipoprotein cholesterol (THR, A) and triglyceride and glucose (TyG, B) index level. |
In Table 4, the patients of the Q4 group were older than those in Q1 (p<0.05). The levels of LDL in Q3 were higher, and the levels of HDL in Q4 were lower than those in the Q1-Q3 group (p<0.05). The level of THR is significant among groups for every TyG index additional unit (p<0.05). The levels of GGT in the Q4 group were higher than those in the Q1 and Q3 groups (p<0.05). Moreover, the incidence of MetS in the Q3-Q4 group was higher than in the Q1-Q2 group (p<0.05, Figure 2B). However, there were no significant differences in gender, SUA, Cr, UAE, and eGFR (p>0.05). The incidence of hypertension, gout, and renal calculi showed no significant difference among the four groups (p>0.05).
Association Among THR, TyG Index, and MetS
Tables 5 and 6 showed the relationship between THR, TyG index, and MetS. As shown in the tables, we found that a unit increase in THR (OR=1.345, 95% CI=1.155–1.566), TyG index (OR=5.070, 95% CI=3.002–8.564) were significantly associated with the prevalence of MetS (p<0.001).
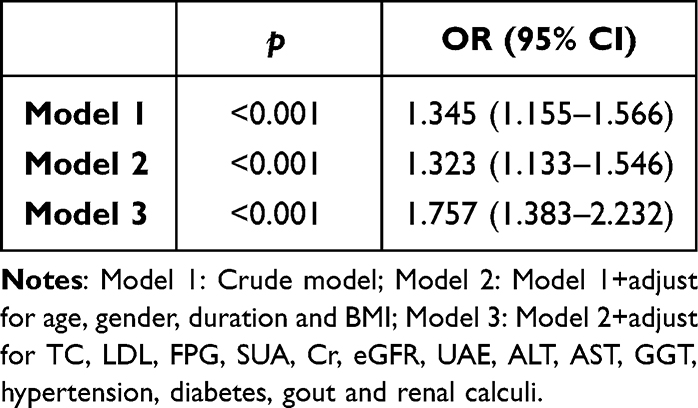 |
Table 5 Association Between THR and MetS |
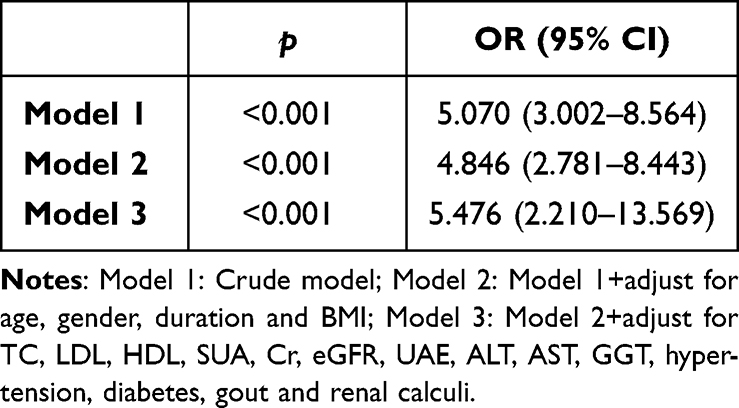 |
Table 6 Association Between TyG Index and MetS |
After adjusting for age, gender, duration, BMI, TC, LDL, FPG, SUA, Cr, eGFR, UAE, ALT, AST, GGT, hypertension, diabetes, gout, and Renal calculi, THR (OR=1.757, 95% CI=1.383–2.232) was still associated with an increased risk of MetS (p<0.001). After adjusting for age, gender, duration, BMI, TC, LDL, HDL, SUA, Cr, eGFR, UAE, ALT, AST, GGT, hypertension, diabetes, gout and Renal calculi, TyG index (OR=5.476, 95% CI=2.210–13.569) was still associated with an increased risk of MetS (p<0.001).
In addition, we constructed three models to explore the associations of the THR and TyG index quartiles with MetS using binary logistic regression analyses. Model 1 was unadjusted, model 2 was adjusted for age, gender, and duration; model 3 further adjusted for TC, LDL, ALT, AST, GGT, diabetes, hypertension, gout, and renal calculi. However, there were differences between the THR and the TyG groups, after adjusting FPG in the THR group and HDL in the TyG group. The result is shown in Figure 3.
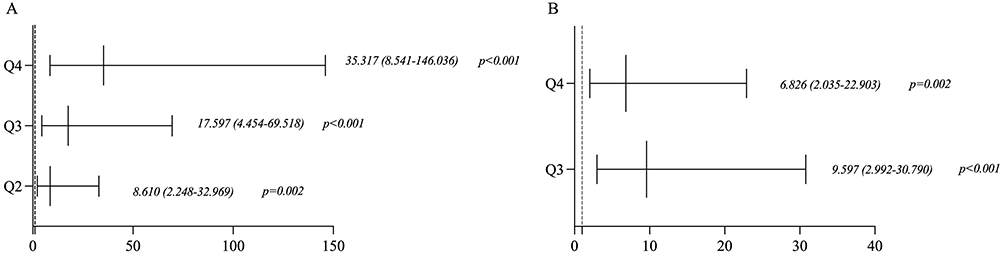 |
Figure 3 Association among THR (A), TyG index (B), and MetS. |
Receiver-Operating Characteristics (ROC) Curve Analysis
The diagnostic ability of THR and TyG index for MetS was found by the ROC curve. The differences between the area under the curve of THR and TyG index were all significant (p<0.001). (Figure 4). The area under ROC curve (AUC) of THR and TyG index for MetS was 0.677, and 0.719 respectively (all p<0.001). TyG index had a larger area under the ROC curve compared to THR, and the cut-off with the biggest Youden index of TyG index was 9.13 with a sensitivity of 74.3% and a specificity of 63.3%. Moreover, Figure 5 shows that the probability of developing MetS will also increase as the level of the TyG index increases.
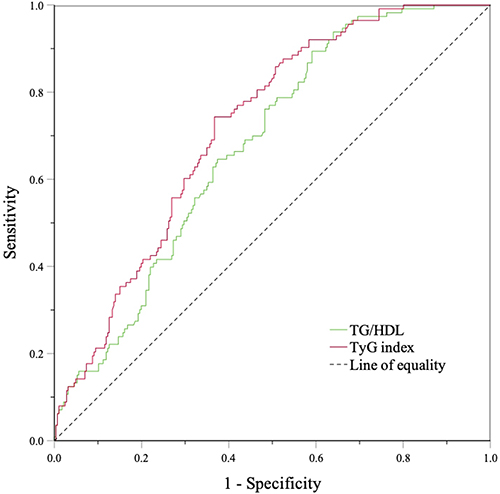 |
Figure 4 The ROC curve of MetS for diagnosing. |
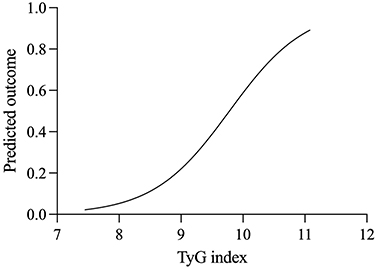 |
Figure 5 The predicted outcome of the TyG index in MetS. |
Discussion
We conducted this cross-sectional study to investigate the role of different metabolic markers in screening metabolic syndrome in out-patients with hyperuricemia. Our study involved a population of 399 patients in endocrine clinics. We discovered the prevalence of MetS to be 28.3% and the TyG index was positively associated with MetS in HUA patients, compared with another index.
HUA is a purine metabolism disorder associated with excessive secretion or decreased clearance of UA in the body.24 High levels of SUA can induce oxidative stress in vascular endothelial cells, activate inflammatory cells and pathways, stimulate the expression of inflammatory transmitters, and increase the production of reactive oxygen species (ROS), which all lead to long-term chronic inflammation, and aggravate lipid metabolism disorder and IR in further.25 HUA is related to IR, so it is important to explore the relationship between different metabolic markers and MetS.
The role of UA in the prevalence of MetS was always unclear, which may be due to renal clearance dysfunction. Individuals with lower eGFRs are more likely to have higher UA concentrations.26 For this reason, renal function-normalized UA will be more exact to reflect net UA production.27 The study of Zhong et al has shown that elevated values of SUA/Cr were associated with MetS, and the positive relationship remained in those individuals with normal UA levels.9 Based on the 2015 CHARLES database, the study found that SUA/Cr was significantly and positively associated with MetS risk in Chinese individuals aged ≥45 years.28 The recent study by She et al found that SUA/Cr levels were significantly associated with MetS and its components in Chinese adults with overweight/obesity.29 However, there was no significant association between SUA/Cr and MetS in our study, which may be due to the small sample size and different participants.
As we all know, elevated SUA levels have often been related to cardiovascular risk factors such as obesity, hypertriglyceridemia, hypertension, and hyperglycemia, which the collection called MetS.30 Obesity is an important contributing factor in the incidence and development of hypertension.31 A study has found that elevated SUA marks a pre-inflammatory state and impacts the role of HDL-c on carotid atherosclerosis.32 The study has confirmed that people with low HDL are more than 4 times more likely to develop MetS than people with normal HDL, and people with a high UHR are 2.9 times more likely to have MetS.14 In a retrospective study by Kocak et al, more than 10.6% of UHR had a high sensitivity and specificity for the prediction of MetS in 100 patients with type 2 diabetes.33 In our study, the patients with MetS had higher levels of UHR, but there was no significant association between UHR quartiles and MetS.
In the MetS, hypertriglyceridemia, which is part of arteriosclerosis dyslipidemia, leads to lower levels of high-density lipoprotein (HDL-c) cholesterol and smaller, Low-density lipoprotein (LDL) particles, this leads to a high risk of myocardial infarction.34,35 Meanwhile, HDL prevents arteriosclerosis by delivering excess cholesterol to the liver, inhibiting LDL oxidation, stimulating prostacyclin secretion, and reducing platelet aggregation.36 The atherogenic link between high triglyceride and HDL-c is due to high plasma concentrations of triglyceride and Low-density lipoprotein that produce small, dense LDL during lipid exchange and lipolysis. Thus, lipid ratios, such as THR and TC/HDL, are widely used for cardiovascular disease risk assessment.37
At the same time, insulin resistance is associated with increased production of Very Low-density lipoprotein cholesterol (VLDL-c) in the liver, chemical transformation of HDL particles, and rapid excretion by the kidneys, leading to changes in blood lipids, as TG increases and HDL decreases. Clinical studies have shown that THR can predict the MetS and assess the risk of later cardiovascular events.35,38 A four-year follow-up of 15,198 subjects showed a positive association between THR and HUA risk, an independent predictor of elevated UA.39 However, no studies demonstrate the relationship between THR and MetS in HUA patients. In our study, THR was associated with MetS, but less than the TyG index.
In the end, IR is one of the pathogenesis in many metabolic diseases, and SUA levels are also closely related to IR.40 The study of Xie et al found that UA induces hepatic fat accumulation via the ROS/ JNK/AP-1 pathway, which HUA may induce insulin resistance and aggravate hyperlipidemia.41 The TyG index is a new, easy-to-use clinical measure, which is regarded as a simple and reliable alternative clinical marker of IR.42 Many studies have demonstrated that the TyG index was associated with HUA in different metabolic diseases, such as hypertension,43 nonalcoholic fatty liver disease (NAFLD),20 and diabetic kidney (DKD).44 The study of Luo et al found that the TyG index was positively associated with SUA in non-obese T2DM patients, which might be better than HOMA-IR.45 Gisela Unger et al suggested that the TyG index and THR are closely related to the IR, which is the basis of MetS, it can be used as an evaluation index of MetS.46 In our study, we found that the TyG index was closely related to the risk of MetS in hyperuricemia patients. The risk of developing MetS will also increase as the level of the TyG index increases. Furthermore, the study of Chen et al has shown that an elevated TyG index is independently associated with an increased risk of eGFR decline in hypertensive patients.47 In our study, eGFR levels in HUA patients were normal, which the relationship between TyG index and decreased renal function in HUA needs further investigation.
This study had some limitations. Firstly, this was a cross-sectional study with small sample size, and it was impossible to determine cause-and-effect relationships between MetS and indicators, nor to explore gender differences. Secondly, some variables such as dietary habits and lifestyle were missing, which may affect UA and Cr levels. Thirdly, only a single measurement of SUA and Cr and MetS components in the study may introduce bias. Fourthly, MetS was defined according to the Chinese Diabetes Society Criteria in 2004, it was not possible to test the predictive power of different indicators in abdominal obesity. Finally, a future longitudinal study with a larger sample size is needed to explore this association further.
Conclusion
In conclusion, the TyG index was closely related to the risk of MetS in HUA patients, and the higher the risk of MetS, the higher the value of the TyG index level was. TyG index is a powerful indicator for identifying MetS in out-patients. A future longitudinal study with a larger sample size is needed to explore this association further.
Data Sharing Statement
The raw data supporting the conclusions of this article will be made available by the authors, without undue reservation.
Ethics Statement
All procedures performed in studies were by the 1964 Helsinki Declaration and its later amendments or comparable ethical standards. The ethical approval for this study was provided by the Ethical Committee of Tianjin Medical University General Hospital (Approval number: IRB2020-YX-027-01). Informed consent was obtained from all participants.
Acknowledgments
Xin Li and Bo Huang are the co-first authors of this study. We are grateful to all subjects, nurses, and physicians who participated in the study.
Author Contributions
All authors made a significant contribution to the work reported, whether that is in the conception, study design, execution, acquisition of data, analysis, and interpretation, or all these areas; took part in drafting, revising, or critically reviewing the article; gave final approval of the version to be published; have agreed on the journal to which the article has been submitted; and agree to be accountable for all aspects of the work.
Funding
This study was supported by the National Natural Science Foundation of China (82070854).
Disclosure
The authors report no potential conflicts of interest relevant to this article.
References
1. Alberti K, Zimmet P, Shaw J. The metabolic syndrome—a new worldwide definition. Lancet. 2005;366(9491):1059–1062. doi:10.1016/s0140-6736(05)67402-8
2. Lu J, Wang L, Li M, et al. Metabolic syndrome among adults in China: the 2010 China noncommunicable disease surveillance. J Clin Endocrinol Metab. 2017;102:507–515. doi:10.1210/jc.2016-2477
3. Li Y, Shen Z, Zhu B, et al. Demographic, regional and temporal trends of hyperuricemia epidemics in mainland China from 2000 to 2019: a systematic review and meta-analysis. Glob Health Action. 2021;14:1874652. doi:10.1080/16549716.2021.1874652
4. Yanai H, Adachi H, Hakoshima M, Katsuyama H. Molecular biological and clinical understanding of the pathophysiology and treatments of hyperuricemia and its association with metabolic syndrome, cardiovascular diseases and chronic kidney disease. Int J Mol Sci. 2021;22. doi:10.3390/ijms22179221
5. Li S, Fu Y, Liu Y, et al. Serum uric acid levels and nonalcoholic fatty liver disease: a 2-sample bidirectional Mendelian randomization study. J Clin Endocrinol Metab. 2022;107:e3497–e3503. doi:10.1210/clinem/dgac190
6. Liu Z, Que S, Zhou L, Zheng S. Dose-response relationship of serum uric acid with metabolic syndrome and non-alcoholic fatty liver disease incidence: a meta-analysis of prospective studies. Sci Rep. 2015;5:14325. doi:10.1038/srep14325
7. Yuan H, Yu C, Li X, et al. Serum uric acid levels and risk of metabolic syndrome: a dose-response meta-analysis of prospective studies. J Clin Endocrinol Metab. 2015;100:4198–4207. doi:10.1210/jc.2015-2527
8. Li L, Song Q, Yang X. Lack of associations between elevated serum uric acid and components of metabolic syndrome such as hypertension, dyslipidemia, and T2DM in overweight and obese Chinese adults. J Diabetes Res. 2019;2019:3175418. doi:10.1155/2019/3175418
9. Zhong D, Liu D, Guo Y, et al. Association of the serum uric acid to creatinine ratio with metabolic syndrome in the middle age and older population in China. Front Endocrinol. 2022;13:1060442. doi:10.3389/fendo.2022.1060442
10. Moriyama K. The association between the serum uric acid to creatinine ratio and metabolic syndrome, liver function, and alcohol intake in healthy Japanese subjects. Metab Syndr Relat Disord. 2019;17:380–387. doi:10.1089/met.2019.0024
11. Kawamoto R, Ninomiya D, Akase T, et al. Serum uric acid to creatinine ratio independently predicts incident metabolic syndrome among community-dwelling persons. Metab Syndr Relat Disord. 2019;17:81–89. doi:10.1089/met.2018.0055
12. Maloberti A, Mengozzi A, Russo E, et al. The results of the URRAH (Uric Acid Right for Heart Health) Project: a focus on hyperuricemia in relation to cardiovascular and kidney disease and its role in metabolic dysregulation. High Blood Press Cardiovasc Prev. 2023;30:411–425. doi:10.1007/s40292-023-00602-4
13. Pugliese N, Mengozzi A, Virdis A, et al. The importance of including uric acid in the definition of metabolic syndrome when assessing the mortality risk. Clin Res Cardiol. 2021;110:1073–1082. doi:10.1007/s00392-021-01815-0
14. Yazdi F, Baghaei M, Baniasad A, et al. Investigating the relationship between serum uric acid to high-density lipoprotein ratio and metabolic syndrome. Endocrinol Diabetes Metab J. 2022;5:e00311. doi:10.1002/edm2.311
15. Aktas G, Yilmaz S, Kantarci D, et al. Is serum uric acid-to-HDL cholesterol ratio elevation associated with diabetic kidney injury? Postgrad Med. 2023;135:519–523. doi:10.1080/00325481.2023.2214058
16. Lin D, Qi Y, Huang C, et al. Associations of lipid parameters with insulin resistance and diabetes: a population-based study. Clin Nutr. 2018;37:1423–1429. doi:10.1016/j.clnu.2017.06.018
17. Zhou L, Mai J, Li Y, et al. Triglyceride to high-density lipoprotein cholesterol ratio and risk of atherosclerotic cardiovascular disease in a Chinese population. Nutr Metab Cardiovasc Dis. 2020;30:1706–1713. doi:10.1016/j.numecd.2020.05.009
18. Wang YL, Koh WP, Talaei M, et al. Association between the ratio of triglyceride to high‐density lipoprotein cholesterol and incident type 2 diabetes in Singapore Chinese men and women. J Diabetes. 2016;9(7):689–698.
19. Gu Z, Zhu P, Wang Q, et al. Obesity and lipid-related parameters for predicting metabolic syndrome in Chinese elderly population. Lipids Health Dis. 2018;17:289. doi:10.1186/s12944-018-0927-x
20. Qi J, Ren X, Hou Y, et al. Triglyceride-glucose index is significantly associated with the risk of hyperuricemia in patients with nonalcoholic fatty liver disease. Diabetes Metab Syndr Obes. 2023;16:1323–1334. doi:10.2147/dmso.S408075
21. Zhu B, Wang J, Chen K, et al. A high triglyceride glucose index is more closely associated with hypertension than lipid or glycemic parameters in elderly individuals: a cross-sectional survey from the Reaction Study. Cardiovasc Diabetol. 2020;19:112. doi:10.1186/s12933-020-01077-6
22. Liu B, Wang T, Hn Z, et al. The prevalence of hyperuricemia in China: a meta-analysis. BMC Public Health. 2011;11:1–10. doi:10.1186/1471-2458-11-832
23. Pang C, Jia L, Hou X, et al. The significance of screening for microvascular diseases in Chinese community-based subjects with various metabolic abnormalities. PLoS One. 2014;9:e97928. doi:10.1371/journal.pone.0097928
24. Wang H, Zhang J, Pu Y, et al. Comparison of different insulin resistance surrogates to predict hyperuricemia among U.S. non-diabetic adults. Front Endocrinol. 2022;13:1028167. doi:10.3389/fendo.2022.1028167
25. Kimura Y, Tsukui D, Kono H. Uric acid in inflammation and the pathogenesis of atherosclerosis. Int J Mol Sci. 2021;22. doi:10.3390/ijms222212394
26. Johnson R, Bakris G, Borghi C, et al. Hyperuricemia, acute and chronic kidney disease, hypertension, and cardiovascular disease: report of a Scientific Workshop Organized by the National Kidney Foundation. Am J Kidney Dis. 2018;71:851–865. doi:10.1053/j.ajkd.2017.12.009
27. Ma C, Liu Y, He S, et al. C-peptide: a mediator of the association between serum uric acid to creatinine ratio and non-alcoholic fatty liver disease in a Chinese Population With Normal Serum Uric Acid Levels. Front Endocrinol. 2020;11:600472. doi:10.3389/fendo.2020.600472
28. Cao T, Tong C, Halengbieke A, et al. Serum uric acid to creatinine ratio and metabolic syndrome in middle-aged and elderly population: based on the 2015 CHARLS. Nutr Metab Cardiovasc Dis. 2023;33:1339–1348. doi:10.1016/j.numecd.2023.05.004
29. She D, Xu W, Liu J, et al. Serum uric acid to creatinine ratio and risk of metabolic syndrome in patients with overweight/obesity. Diabetes Metab Syndr Obes. 2023;16:3007–3017. doi:10.2147/dmso.S427070
30. Gołembiewska E, Ciechanowski K, Safranow K, et al. Renal handling of uric acid in patients with type 1 diabetes in relation to glycemic control. Arch Med Res. 2005;36:32–35. doi:10.1016/j.arcmed.2004.09.003
31. Shah W, Ali I, Shahid W, et al. Obesity prevalence factors associated with sympathetic overactivity and hypertension. Neurol Clin Neurosci. 2023;11:310–315. doi:10.1111/ncn3.12765
32. Hu X, Liu J, Li W, et al. Elevated serum uric acid was associated with pre-inflammatory state and impacted the role of HDL-C on carotid atherosclerosis. Nutr Metab Cardiovasc Dis. 2022;32:1661–1669. doi:10.1016/j.numecd.2022.03.026
33. Kocak M, Aktas G, Erkus E, et al. Serum uric acid to HDL-cholesterol ratio is a strong predictor of metabolic syndrome in type 2 diabetes mellitus. Revista da Associacao Medica Brasileira. 2019;65:9–15. doi:10.1590/1806-9282.65.1.9
34. Ju S, Lee J, Kim D. Association of metabolic syndrome and its components with all-cause and cardiovascular mortality in the elderly: a meta-analysis of prospective cohort studies. Medicine. 2017;96:e8491. doi:10.1097/md.0000000000008491
35. Chu S, Jung J, Park M, Kim S. Risk assessment of metabolic syndrome in adolescents using the triglyceride/high-density lipoprotein cholesterol ratio and the total cholesterol/high-density lipoprotein cholesterol ratio. Ann Pediatr Endocrinol Metab. 2019;24:41–48. doi:10.6065/apem.2019.24.1.41
36. Maruyama C, Imamura K, Teramoto T. Assessment of LDL particle size by triglyceride/HDL-cholesterol ratio in non-diabetic, healthy subjects without prominent hyperlipidemia. J Atheroscler Thromb. 2003;10:186–191. doi:10.5551/jat.10.186
37. Pacifico L, Bonci E, Andreoli G, et al. Association of serum triglyceride-to-HDL cholesterol ratio with carotid artery intima-media thickness, insulin resistance and nonalcoholic fatty liver disease in children and adolescents. Nutr Metab Cardiovasc Dis. 2014;24:737–743. doi:10.1016/j.numecd.2014.01.010
38. da Luz P, Cesena F, Favarato D, Cerqueira E. Comparison of serum lipid values in patients with coronary artery disease at <50, 50 to 59, 60 to 69, and >70 years of age. Am J Cardiol. 2005;96:1640–1643. doi:10.1016/j.amjcard.2005.07.080
39. Liu X, Wu Q, Chen Z, et al. Elevated triglyceride to high-density lipoprotein cholesterol (TG/HDL-C) ratio increased risk of hyperuricemia: a 4-year cohort study in China. Endocrine. 2020;68:71–80. doi:10.1007/s12020-019-02176-5
40. Fernández-Chirino L, Antonio-Villa N, Fermín-Martínez C, et al. Elevated serum uric acid is a facilitating mechanism for insulin resistance mediated accumulation of visceral adipose tissue. Clin Endocrinol. 2022;96:707–718. doi:10.1111/cen.14673
41. Xie D, Zhao H, Lu J, et al. High uric acid induces liver fat accumulation via ROS/JNK/AP-1 signaling. Am J Physiol Endocrinol Metab. 2021;320:E1032–E1043. doi:10.1152/ajpendo.00518.2020
42. Yan F, Yan S, Wang J, et al. Association between triglyceride glucose index and risk of cerebrovascular disease: systematic review and meta-analysis. Cardiovasc Diabetol. 2022;21:226. doi:10.1186/s12933-022-01664-9
43. Liu S, Zhou Z, Wu M, et al. Association between the triglyceride glucose index and hyperuricemia in patients with primary hypertension: a cross-sectional study. Int J Endocrinol. 2023;2023:5582306. doi:10.1155/2023/5582306
44. Li Q, Shao X, Zhou S, et al. Triglyceride-glucose index is significantly associated with the risk of hyperuricemia in patients with diabetic kidney disease. Sci Rep. 2022;12:19988. doi:10.1038/s41598-022-23478-1
45. Luo Y, Hao J, He X, et al. Association between Triglyceride-Glucose Index and serum uric acid levels: a biochemical study on anthropometry in non-obese type 2 diabetes mellitus patients. Diabetes Metab Syndr Obes. 2022;15:3447–3458. doi:10.2147/dmso.S387961
46. Unger G, Benozzi S, Perruzza F, Pennacchiotti G. Triglycerides and glucose index: a useful indicator of insulin resistance. Endocrinol Nutr. 2014;61:533–540. doi:10.1016/j.endonu.2014.06.009
47. Chen H, Tsai Y, Huang C. Triglyceride glucose index and renal function decline in Han Chinese hypertensive patients. J Clin Hypertens. 2023;25:951–956. doi:10.1111/jch.14720
 © 2023 The Author(s). This work is published and licensed by Dove Medical Press Limited. The
full terms of this license are available at https://www.dovepress.com/terms
and incorporate the Creative Commons Attribution
- Non Commercial (unported, 3.0) License.
By accessing the work you hereby accept the Terms. Non-commercial uses of the work are permitted
without any further permission from Dove Medical Press Limited, provided the work is properly
attributed. For permission for commercial use of this work, please see paragraphs 4.2 and 5 of our Terms.
© 2023 The Author(s). This work is published and licensed by Dove Medical Press Limited. The
full terms of this license are available at https://www.dovepress.com/terms
and incorporate the Creative Commons Attribution
- Non Commercial (unported, 3.0) License.
By accessing the work you hereby accept the Terms. Non-commercial uses of the work are permitted
without any further permission from Dove Medical Press Limited, provided the work is properly
attributed. For permission for commercial use of this work, please see paragraphs 4.2 and 5 of our Terms.