Back to Journals » International Journal of Women's Health » Volume 17
Association Between Dietary Inflammatory Index and Triglyceride Glucose-Body Mass Index with Iron Deficiency in Reproductive Age Women: Evidence from NHANES 2005-2018
Authors Ding J, Xu Z ![]() , Liang R, Xie S
, Liang R, Xie S
Received 21 November 2024
Accepted for publication 2 February 2025
Published 10 February 2025 Volume 2025:17 Pages 355—367
DOI https://doi.org/10.2147/IJWH.S507765
Checked for plagiarism Yes
Review by Single anonymous peer review
Peer reviewer comments 2
Editor who approved publication: Dr Vinay Kumar
Jia Ding,1,* Zhehao Xu,2,* Ruiyun Liang,3 Shuangfeng Xie1
1Department of Hematopathology, Sun Yat-sen Memorial Hospital, Sun Yat-sen University, Guangzhou, People’s Republic of China; 2Department of General Medicine, Sun Yat-sen Memorial Hospital, Sun Yat-sen University, Guangzhou, People’s Republic of China; 3Department of Respiratory Medicine, Sun Yat-sen Memorial Hospital, Sun Yat-sen University, Guangzhou, People’s Republic of China
*These authors contributed equally to this work
Correspondence: Shuangfeng Xie, Email [email protected]
Background & Aims: There is a growing focus on the role of dietary factors and metabolic conditions in the evolution and progression of iron deficiency (ID), yet few studies have examined the underlying mechanisms. Dietary Inflammatory Index (DII) is a metric that gauges the inflammatory potential of an overall diet. This study explores the association between DII and triglyceride glucose-body mass index (TyG-BMI) with ID in reproductive-age women.
Methods: This analysis utilized data from 2311 reproductive-age women in the National Health and Nutrition Examination Survey (NHANES) from 2005 to 2018. ID was identified using serum ferritin and transferrin receptor (TfR). The association between DII, TyG-BMI and ID was assessed using weighted logistic regression, linear regression and restricted cubic spline (RCS) models, with receiver operating characteristic (ROC) curve analysis for diagnostic power. Mediation effects of TyG-BMI were further explored by causal mediation analysis.
Results: Among reproductive-age women, both DII and TyG-BMI were significantly positively associated with ID (DII: OR = 1.32, 95% CI 1.19, 1.48; TyG-BMI: OR = 1.13, 95% CI 1.02, 1.35). There is a close relationship between the DII index and TfR (β= 1.17, 95% CI 1.03, 1.13). RCS analysis indicated that the relationships were mostly linear (P-overall < 0.05, P-nonlinear > 0.05). Furthermore, TyG-BMI mediated 5.19%, 12.83%, and 5.63% of the associations between DII and ID, Ferritin, and transferrin receptor (TfR), respectively.
Conclusion: The findings suggest that targeted interventions to enhance dietary practices, nutritional intake, and overall metabolic well-being may result in substantial amelioration of ID among reproductive women.
Keywords: iron deficiency, reproductive women, dietary inflammatory index, triglyceride glucose-body mass index, insulin resistance
Graphical Abstract:

Introduction
Iron deficiency (ID), mainly caused by insufficient iron intake or an inability to replenish iron losses, depletes the body’s iron stores and plays a significant role in the global disease burden.1,2 This micronutrient is crucial for hemoglobin synthesis, and iron-deficiency anemia (IDA) is a predominant consequence of ID. According to the Global Burden of Disease, IDA is the foremost cause of disability-adjusted life years (DALYs) among women,1 impacting 37% (32 million) of pregnant women and 30% (32 million) of non-pregnant women.3,4 Due to physiological factors such as menstruation, pregnancy, and lactation, the iron requirements of women of reproductive age increase significantly, as does the risk of developing ID. ID exerts detrimental effects on women’s health, even in the absence of anemia, leading to diminished concentration, lowered physical endurance, and potentially heightening the risk of adverse pregnancy outcomes.5,6
There is a growing focus on the role of dietary factors and metabolic conditions in the evolution and progression of ID.2,7 Recent evidence has highlighted the significant role of diet-induced inflammation in this process. Dietary intake is recognized as a key modulator in the development of chronic inflammatory states.8 Notably, a case-control study indicates that the Western dietary pattern, characterized by high intake of animal fats, refined grains, and low intake of seeds, fruits, or vegetables, triggers postprandial inflammation and may precipitate chronic metabolic diseases.9 This dietary pattern is linked to an overproduction of pro-inflammatory cytokines, which in turn augment the secretion of hepcidin. Hepcidin reduces dietary iron absorption by binding to the iron exporter ferroportin, which inhibits the transport of iron from the enterocytes into the circulatory system and promotes ferroportin degradation, thereby impairing iron absorption.10
The Mediterranean dietary pattern, revered for its emphasis on olive oil, fish, vegetables, fruits, and whole grains, is correlated with notable health benefits and a decrease in inflammatory markers.11 There is a growing body of evidence suggesting that the antioxidant compounds in these foods contribute to the suppression of reactive oxygen species through multiple pathways, resulting in a reduction of pro-inflammatory cytokines.12,13 The Dietary Inflammatory Index (DII), a metric that gauges the inflammatory potential of an overall diet rather than focusing on a single nutrient, is derived from an assessment of 45 distinct dietary components. The intake of these components, which can either be increased or decreased, influences an individual’s inflammatory score.14
Insulin resistance (IR), characterized by a diminished response of target tissues to insulin, has been implicated in the pathogenesis of ID through its capacity to induce systemic chronic inflammation.15,16 The Triglyceride-Glucose Index (TyG) offers an economical and straightforward approach to assessing IR by leveraging the relationship between fasting triglyceride levels and fasting blood glucose, thereby enhancing the accuracy of IR diagnosis.17 While triglyceride glucose-body mass index (TyG-BMI) has demonstrated significant associations with metabolic and cardiovascular disease risks17,18, its link to iron metabolism awaits further empirical support.
Although direct research on the relationship between DII and TyG-BMI is scant, it is well-established that pro-inflammatory diets exacerbate IR.19 Consequently, this study aims to investigate the correlation between DII, TyG-BMI, and ID in reproductive-age American women, as well as the combined predictive power of these factors for ID. In addition, it was explored whether TyG-BMI played an intermediary role in DII and ID, offering a novel approach to the prevention and treatment of iron deficiency.
Materials and Methods
Study Population and Ethics
This cross-sectional analysis included 50765 adults from the National Health and Nutrition Examination Survey (NHANES) spanning 2005 to 2018. The exclusion criteria omitted: (1) participants without iron intake data (n = 39,578); (2) those lacking information for TyG-BMI and DII calculations (n = 7380 and n = 1478, respectively); (3) individuals with incomplete covariate data (n = 18). After these exclusions, 2311 female participants from the United States remained for analysis (Figure 1). The NHANES protocol was approved by the NCHS Institutional Review Board (https//www.cdc.gov/nchs/nhanes/index.htm), with all participants providing written informed consent.
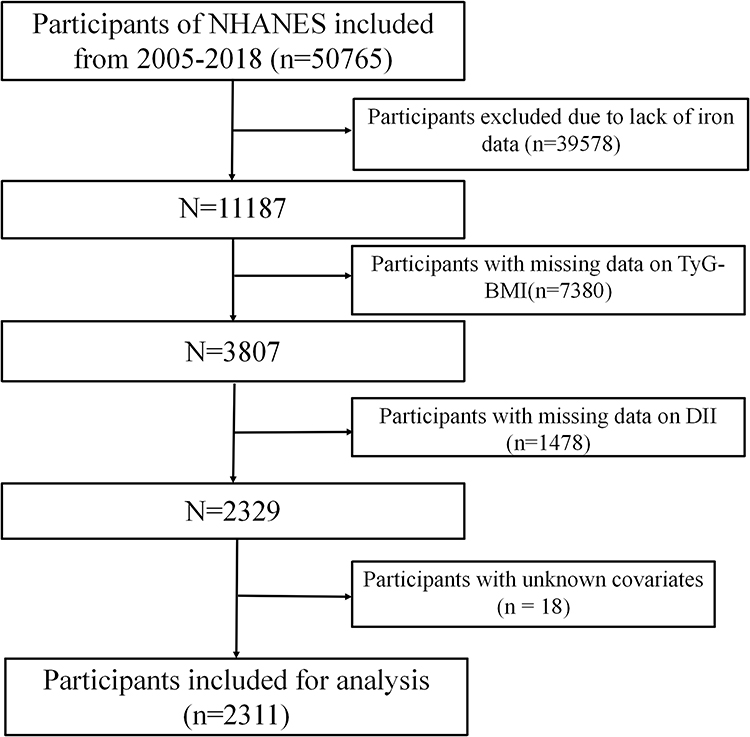 |
Figure 1 Flowchart depicting the participants’ selection. |
Assessments of DII and TyG-BMI
DII is a scoring system developed by Shivappa, based on a literature review that assesses the potential inflammatory levels of dietary components. DII is a metric that evaluates a diet’s inflammatory potential based on its relationship with both pro-inflammatory factors such as IL-1β, IL-4, IL-6, TNF-α, and CRP, as well as the anti-inflammatory factor IL-10. The DII is calculated by aggregating the specific scores of 45 different food items or nutrients, yielding a total DII value that signifies the overall inflammatory effect of the diet. A positive DII score indicates a pro-inflammatory diet, a negative score points to an anti-inflammatory diet, and a score close to zero suggests little to no impact on inflammation. The theoretical reference value of the DII ranges from −8.87, representing a diet with maximal anti-inflammatory potential, to +7.98, representing a diet with maximal pro-inflammatory potential.14 Gathering data for the DII involves two 24-hour dietary recall interviews with participants, which are conducted both in-person and over the telephone, separated by a period of 3 to 10 days. This approach ensures a comprehensive evaluation of each participant’s dietary habits and their associated inflammatory potential.
In this study, 28 out of 45 food parameters were used for DII calculations, including carbohydrates, protein, total fat, alcohol, fiber, cholesterol, saturated fatty acids, monounsaturated fatty acids, polyunsaturated fatty acids, n-3 fatty acids, n-6 fatty acids, niacin, vitamin A, thiamine, vitamin B2, vitamin B6, vitamin B12, vitamin C, vitamin D, vitamin E, iron, magnesium, zinc, selenium, folic acid, carotene, caffeine, and energy. The steps to calculate the DII are as follows: First, calculate the Z-score for the exposure of individual dietary components, Z-score = (individual dietary component daily intake - global dietary component intake average) / global dietary component intake standard deviation.20

The TyG-BMI index, an indicator of IR, is derived from the combination of fasting glucose and triglyceride levels. These metabolic parameters are assessed at the outset when participants submit their blood samples. Concurrently, anthropometric measurements such as weight and height are collected during physical examinations conducted at mobile examination centers. The TyG-BMI index is calculated using the following formula:21


Assessment of ID
At the Mobile Examination Centers (MECs), blood samples were obtained by well-trained staff in a controlled environment. All samples underwent duplicate complete blood count (CBC) analyses utilizing the Beckman Coulter MAXM, which included the measurement of hemoglobin. To assess ID, serum ferritin and soluble transferrin receptor (sTfR) levels were determined; these markers are reflective of the body’s iron storage and iron transport capabilities, respectively.22 Given that ferritin is a positive acute-phase protein, we employed the regression adjustment method recommended by the biomarker panel reflecting inflammatory and nutritional determinants of anemia, which adjusts ferritin levels based on C-reactive protein.23

In the equation, β1 represents the regression coefficient of CRP, obs refers to the observed value, and ref indicates the reference value used to define low inflammation, which is equivalent to the maximum value of the logarithmically transformed CRP at the lowest decile. The adjustment for ferritin is only applied to individuals with a natural logarithm of CRP greater than the natural logarithm of the reference value for CRP, in order to avoid over-adjustment. The Roche e601 analyzer was employed for the quantification of serum ferritin and transferrin receptor (TfR). In this study, Cook formula was used to further standardize the concentration of transferrin, so as to facilitate the subsequent evaluation and calculation.23

Subsequently, we utilized the body iron model to identify subjects with ID, a method that has been validated and employed in previous NHANES studies: a negative value of less than 0 mg/kg indicates ID.22

Covariate
Covariates were selected based on prior knowledge of factors that affect iron metabolism and IR indicators, including age, race, poverty income ratio (PIR), marital status, education level, alcohol status, smoking status, hypertension, and diabetes. Race was categorized into non-Hispanic White, non-Hispanic Black, Mexican American, other Hispanic, and other groups. Indicators of family socioeconomic status included PIR and education level, which was classified into less than high school, high school, or more than high school. Marital status was categorized into two groups: those who were married or partnered, and those who were widowed, divorced, separated, or never married. Smoking status was divided into those who had never smoked and those who were currently smoking. Hypertension was identified by systolic blood pressure of 140 mmHg or higher, diastolic blood pressure of 90 mmHg or higher, a physician’s diagnosis, or the use of antihypertensive medication. Diabetes was diagnosed if there was a physician’s diagnosis, a glycated hemoglobin (HbA1c) level greater than 6.5%, fasting glucose levels of 7 mmol/L or higher, random glucose levels of 11.1 mmol/L or higher, glucose levels of 11.1 mmol/L or higher on a 2-hour oral glucose tolerance test, or if the individual was using diabetes medication or insulin. The presence of coronary heart disease was based on participants’ self-reports of a physician’s diagnosis in the study questionnaire.
Statistical Analysis
This study utilized complex survey design methodologies from NHANES, incorporating sampling weights and variables like clusters and strata to account for its design intricacies. To preserve sample size, precision, and statistical power, we conducted multiple imputations for covariates with missing values of less than 5% using a fully random forest approach. Participants were stratified into two groups: those with and without ID based on their baseline characteristics. Continuous variables were presented as mean and standard deviation, while categorical variables were expressed as percentages determined by the Rao-Scott chi-square test.
Logistic regression was employed to investigate the association between the DII and TyG-BMI indices and the risk of ID. Cutoff points for these indices were identified using the Youden index from the receiver operating characteristic (ROC) curve, categorizing participants into low and high groups. Linear regression models were used for evaluating the relationships between DII index, TyG-BMI and Iron related metabolic indicators (ferritin and TfR). We sequentially applied logistic and linear regression models: a non-adjusted model (Model 1), and two adjusted models (Model 2 and Model 3). Model 2 was adjusted for age, gender, and race, while Model 3 included further adjustments for PIR, education, BMI, smoking, alcohol consumption, diabetes and hypertension.
Furthermore, this study applied restricted cubic spline (RCS) regression to explore the dose-response relationship between the DII and TyG-BMI indices and the occurrence of ID. The study performed causal mediation analysis to investigate the intermediary role of TyG-BMI in the relationship between DII with ID and iron related metabolic indicators. The extent of TyG-BMI’s mediating influence was ascertained by calculating the mediation percentage, defined as the ratio of the indirect effect to the overall effect. To assess the statistical significance of this mediating effect, we employed Bootstrap resampling methods, conducting 1000 iterations for robust estimation. The ROC curve analysis was utilized to evaluate the diagnostic power of the combined DII and TyG-BMI indices for predicting ID, thereby assessing their collective significance. Subgroup analyses were performed to investigate potential interactions between the DII and TyG-BMI indices and the risk of ID across different demographic and health status subgroups. These subgroups were categorized based on gender, BMI, PIR, hypertension, diabetes and smoking habits. For each subgroup, adjustments were made for all other covariates to specifically discern the impact of each stratification variable on the association between the DII and TyG-BMI indices and ID.
All statistical analyses were performed using R software, version 4.2.3, with statistical significance defined as P < 0.05. This rigorous statistical approach ensures that the findings are robust and the conclusions drawn are valid within the context of the study’s design and objectives.
Results
Baseline Characteristics of the Study Participants
Table 1 presents the general characteristics of the study population, which includes 2311 reproductive-age women from the United States, stratified by the presence of ID. The mean (±SD) age of the participants was 31.69±0.29 years, with those in the non-ID group having a mean (±SD) age of 31.56±0.34 years and those with ID having a mean (±SD) age of 32.28±0.53 years (p=0.278). Compared to the non-ID group, individuals with ID had higher BMI, higher education levels, lower income and exhibited higher levels of glycohemoglobin, creatinine, DII, TyG-BMI, TfR and lower levels of the Functional Evaluation of Reactive Synthesis Index (FERSI) and hemoglobin (p < 0.05 for all comparisons). The prevalence of ID in our study population was 22.67% (524 out of 2311 participants). The mean (±SD) value of TyG-BMI was 131.18±2.00, and the mean (±SD) and range of DII were 1.97±0.06, respectively.
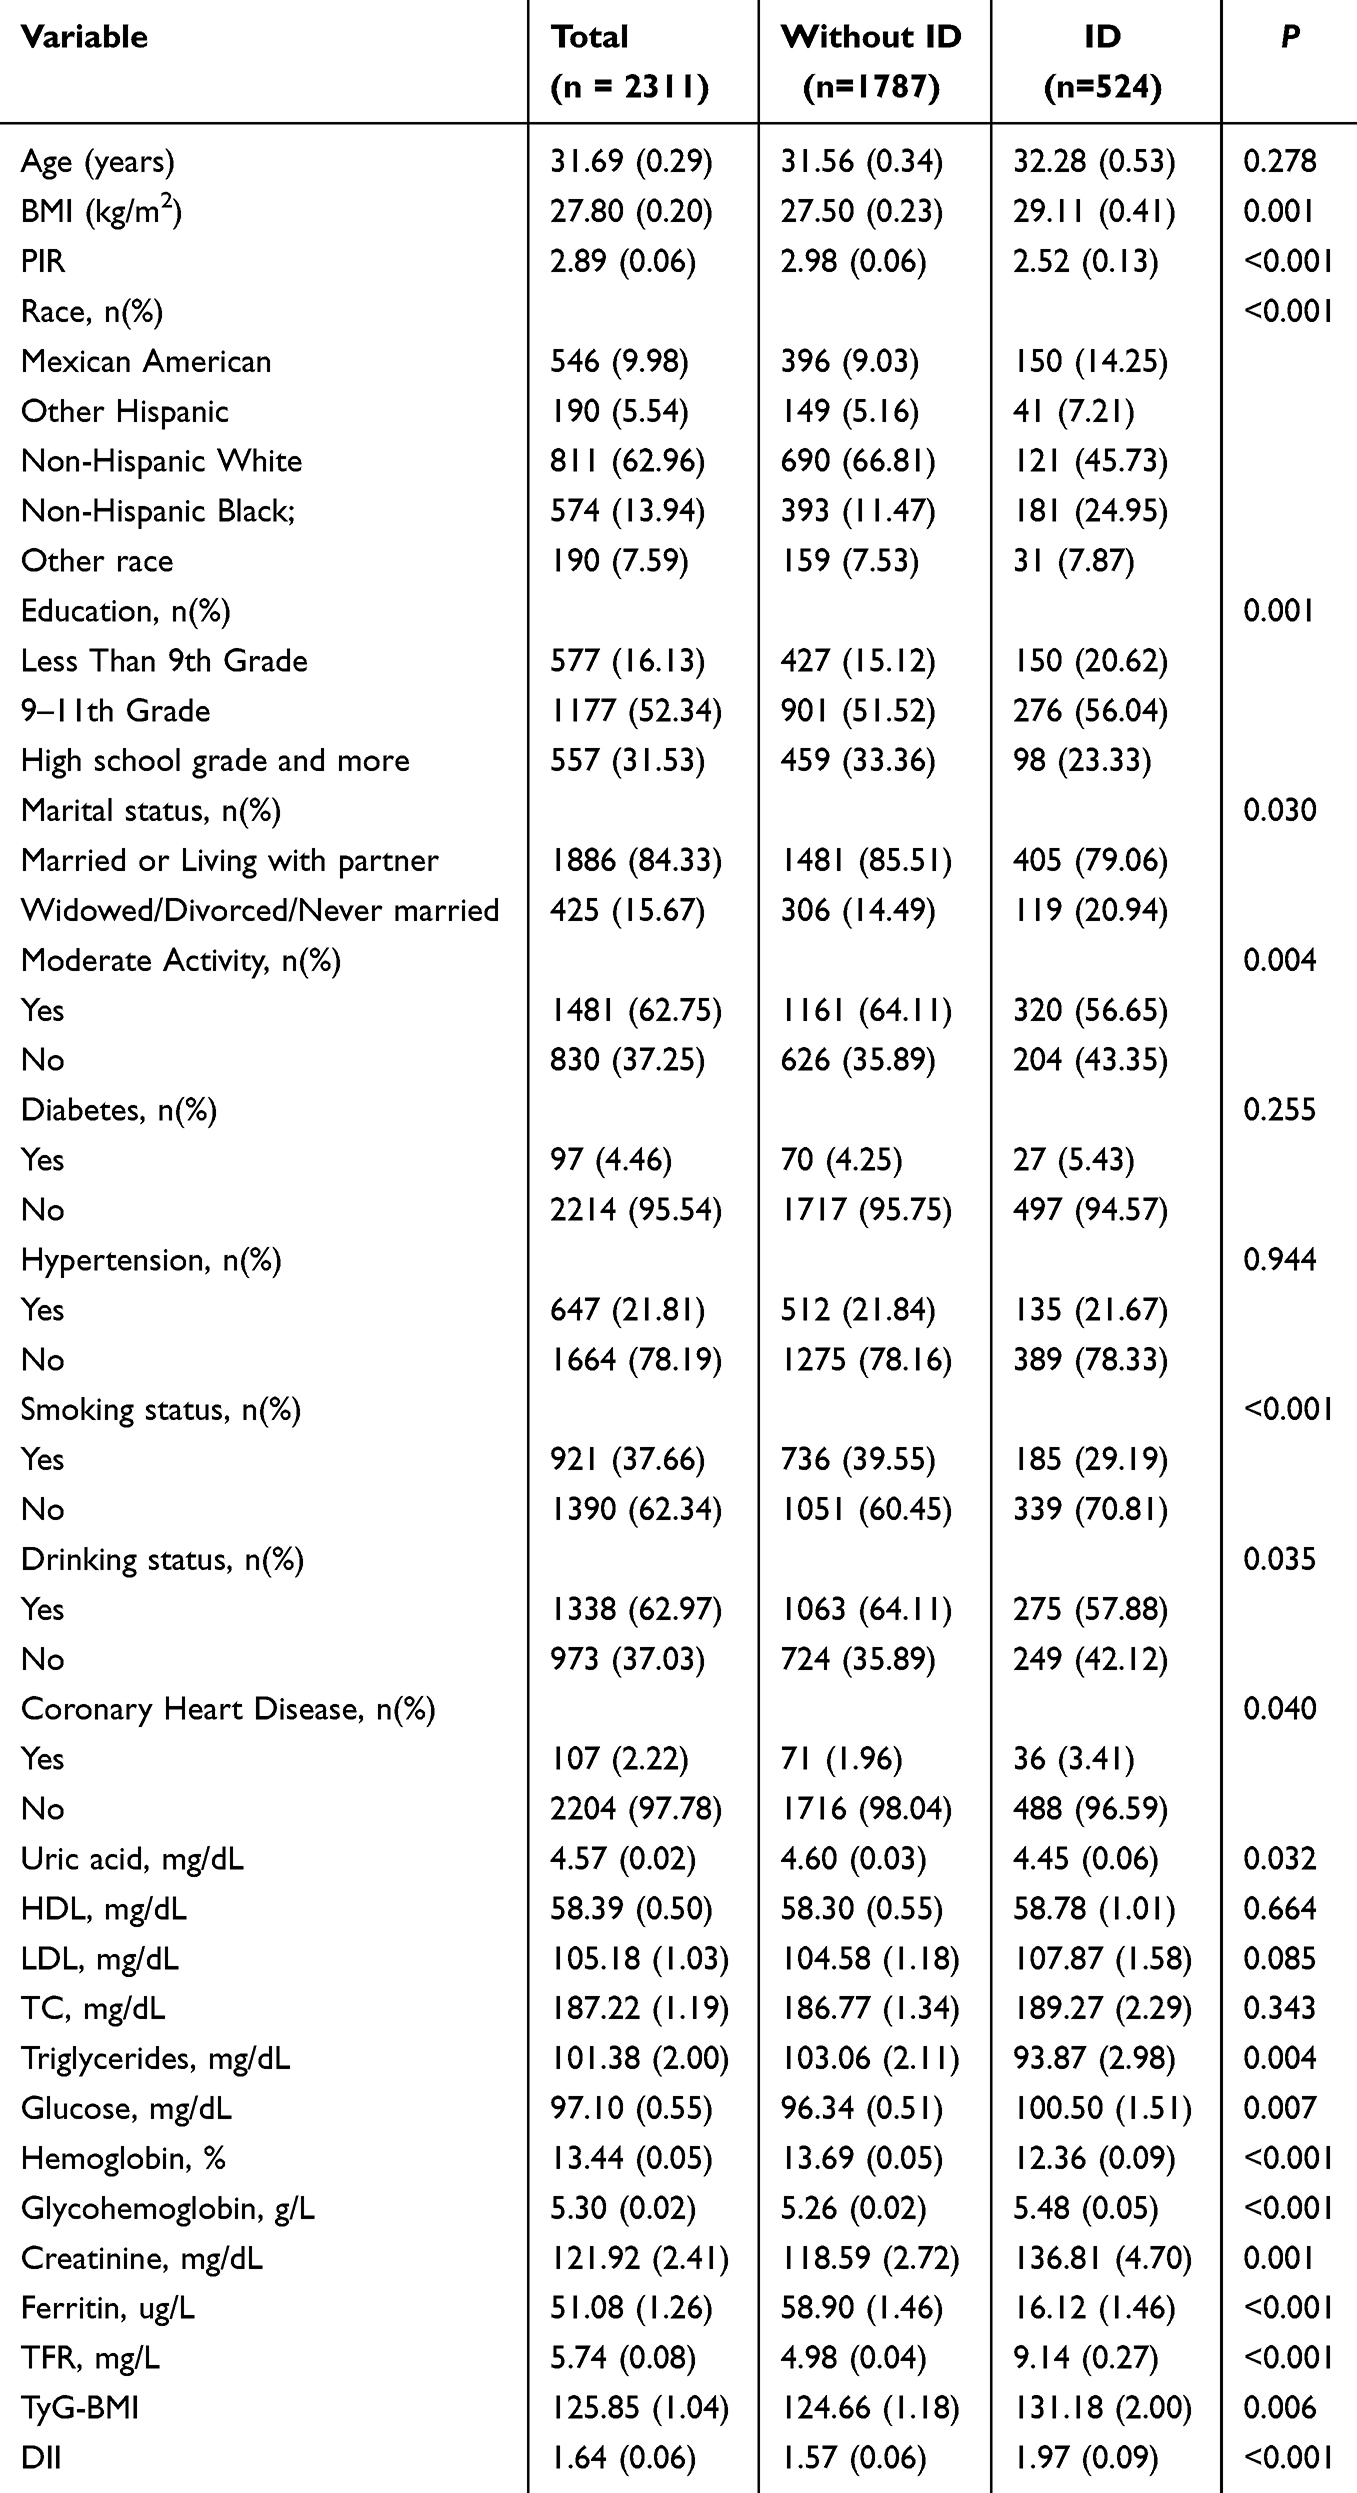 |
Table 1 Characteristics of the Study Population from NHANES 2005–2018 |
Association of DII and TyG-BMI with ID
As shown in Table 2, after adjusting for covariates, there is a significant association between the increase in the prevalence of ID and both the DII and TyG-BMI when treated as continuous variables (DII: OR = 1.32, 95% CI 1.19, 1.48; TyG-BMI: OR = 1.13, 95% CI 1.02, 1.35). Furthermore, when DII and TyG-BMI are considered as binary variables (cutoff points determined by the Youden index) (Table S1), a significant positive association with the prevalence of ID is observed, which is even more pronounced (DII: OR = 1.68, 95% CI 1.34, 2.11; TyG-BMI: OR = 1.29, 95% CI 1.06, 1.60). Not only that, this study found that there is a close relationship between the DII and TfR (β= 1.17, 95% CI 1.03, 1.13) (Table S2). We utilized RCS curves to model and visualize the relationships between DII and TyG-BMI with ID. The RCS regression analysis demonstrated significant linear associations for DII with ID (p-overall < 0.05, p -nonlinear > 0.05) and nonlinear associations for TyG-BMI with ID (p-overall < 0.05, p -nonlinear <0.05), following adjustment for covariates (Figure 2).
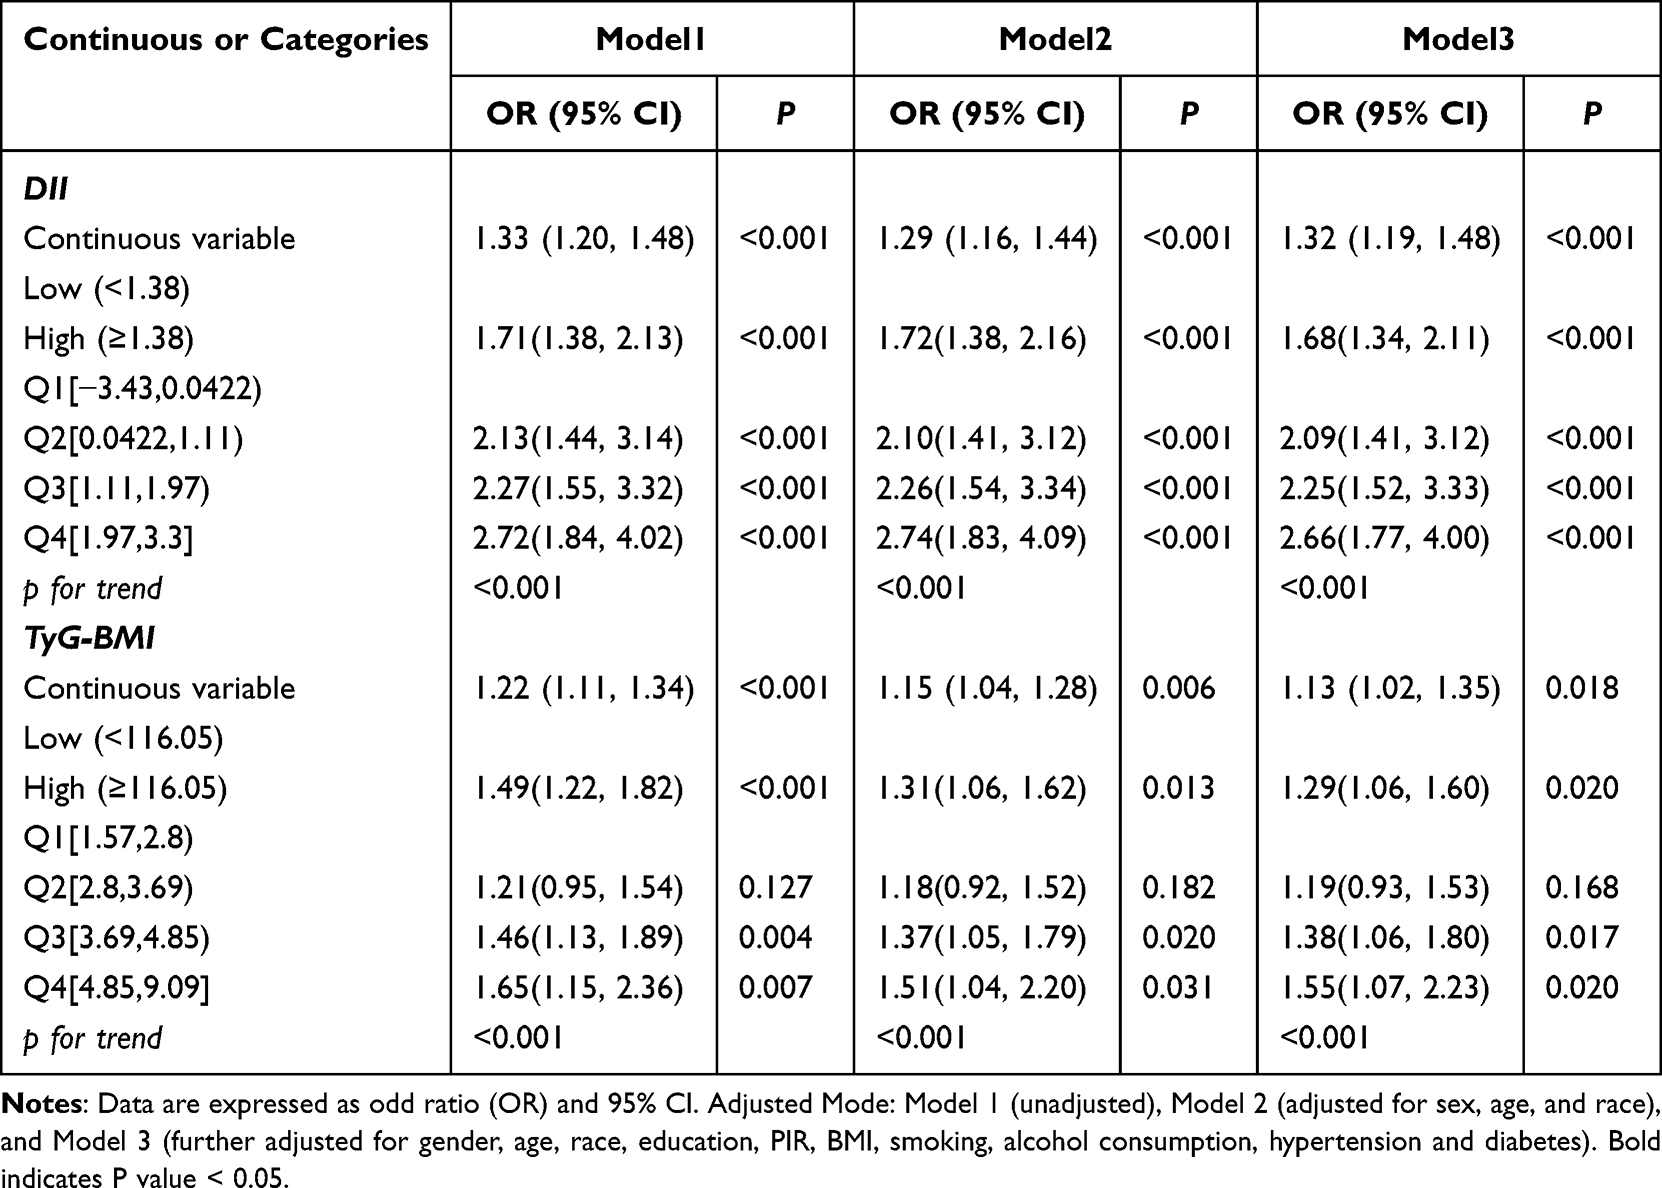 |
Table 2 Association of DII and TyG-BMI with ID |
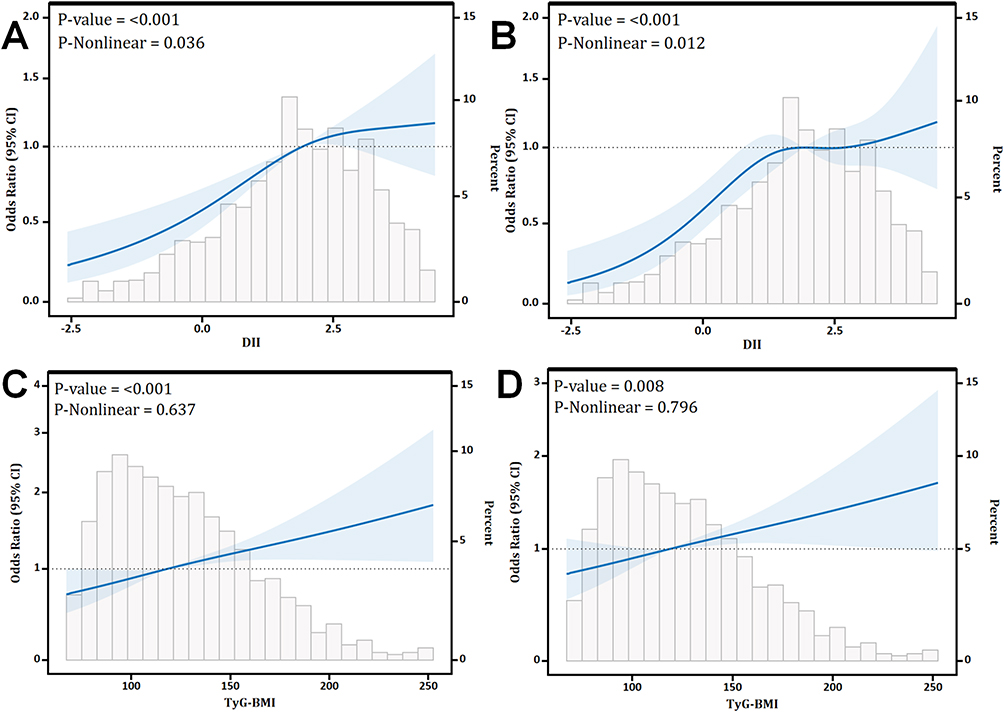 |
Figure 2 Associations between DII and TyG-BMI with ID. (A) The relationship between DII and ID (unadjusted RCS Model). (B) The relationship between DII and ID (fully adjusted RCS Model). (C) The relationship between TyG-BMI with ID (unadjusted RCS Model). (D) The relationship between TyG-BMI with ID (fully adjusted RCS Model). Adjustments in the model accounted for the following variables: age, educational level, ethnicity, marital status, family PIR, smoking status, drinking status, BMI, diabetes, and hypertension. |
Mediation Effects of TyG-BMI on DII-ID
Taking into account the correlations between DII, TyG-BMI, and iron deficiency indicators, this study further analyzed the mediating effects. The study found that TyG-BMI mediated 5.19%, 12.83%, and 5.63% of the associations between DII and ID, Ferritin, and TfR, respectively (Figure 3).
 |
Figure 3 Mediation effects of TyG-BMI on the associations of DII with ID, Ferritin and TfR. (A) The relationship between DII and ID mediated by TyG-BMI. (B) The relationship between DII and Ferritin mediated by TyG-BMI. (C) The relationship between DII and TfR mediated by TyG-BMI. Abbreviations: ACME, average causal mediation effects; ADE, average direct effects. Note: Arrows and rounded heads indicate promotion and inhibition, respectively. |
Stratification Connection
Figures S1 and S2 present detailed analyses of the stratified relationships between DII and TyG-BMI with ID, stratified by age, smoking status, alcohol consumption, and the presence of hypertension and diabetes. The stratified analysis indicated that there were no significant interactions observed between the TyG-BMI and DII indices and ID within any of the subgroups except hypertension (p-values for interaction > 0.05).
ROC Curve for Evaluating the Predictive Power for ID
To further investigate the relationship between DII and TyG-BMI with ID, we employed ROC curves to predict the diagnostic efficacy of both indices. The ROC curves analysis demonstrated that the combined TyG-BMI and DII indices had the highest diagnostic efficacy for ID (AUC: 0.5973), followed by the individual diagnostic efficacies of DII and TyG-BMI for ID (DII: AUC: 0.5704; TyG-BMI: AUC: 0.5530) (Figure 4).
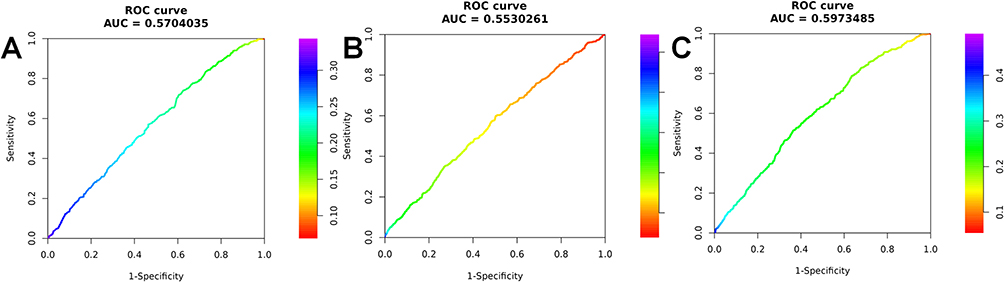 |
Figure 4 ROC curve for evaluating the predictive power for ID. (A) DII; (B) TyG-BMI; (C) DII and TyG-BMI. |
Discussion
This pioneering study delves into the dietary influences on ID risk in women of reproductive age, illuminating the potential involvement of metabolic disorders in its pathogenesis. Our findings indicate that while elevated DII and TyG-BMI are both linked to a significant rise in ID risk, the association between DII and ID is more pronounced. Notably, this correlation persists even after adjusting for various covariates. Furthermore, TyG-BMI was identified as a mediator in the relationship between DII and ID. We also examined the interrelations between DII, TyG-BMI, and iron metabolism—including ferritin and TfR—offering insights into the mechanisms by which DII might influence ID. The combination of these two indices enhances the predictive power of ID, suggesting a synergistic effect that merits further investigation. Moreover, a comprehensive stratified analysis was conducted to enhance the study’s sensitivity, providing a nuanced perspective on the multifaceted factors influencing ID in women of reproductive age.
Research has established that dietary factors are instrumental in modulating iron metabolism.8,24 The study utilized the DII score to assess individual inflammatory responses comprehensively and identified a positive correlation between higher DII scores and the prevalence of ID among women of reproductive age. We discovered that a pro-inflammatory diet, rich in high-energy nutrients with elevated trans fat and sugar content, not only escalates the intake of these substances but also enhances the expression of pro-inflammatory cytokines. This dietary pattern further modulates the activation of protease caspase-1, which is pivotal for the cleavage of cytokine precursors IL-1β and IL-18.13 The processing of these cytokine precursors can regulate the hepcidin antimicrobial peptide gene expression, impede the function of the iron transporter, curtail iron uptake in the intestinal mucosa, and hinder iron recycling in macrophages, ultimately leading to ID.25,26 Conversely, adherence to the Mediterranean diet has been shown to significantly diminish the serum concentrations of multiple pro-inflammatory cytokines, demonstrating the capacity of dietary patterns to mitigate systemic chronic inflammation.27 Among pregnant women, adherence to this anti-inflammatory dietary approach has been associated with a reduced incidence of ID,28 offering robust evidence for the potential of dietary interventions in alleviating ID through the reduction of inflammation.
Furthermore, the study’s findings reveal a positive correlation between DII and TfR levels, with a significant direct impact on transferrin observed in both mediation analysis and linear regression (P<0.05). This suggests that DII may predominantly induce ID by influencing TfR. The current dearth of research on the association between dietary inflammation and TfR is noteworthy. A case-control study focusing on rheumatoid arthritis indicated that patients’ levels of TfR were markedly elevated compared to controls, hinting at a link between inflammatory states and TfR levels.29 Additionally, a cross-sectional study by Doherty et al reported elevated hepcidin levels in individuals on a pro-inflammatory diet,30 a protein known to be regulated by TfR2. Evidence suggests that TfR2 stimulates hepcidin expression in the liver, and that the deletion of the murine TfR2 gene or mutations in the human TfR2 gene can result in reduced hepcidin expression.31,32 While these findings offer a potential explanation for our observations, the precise mechanisms involved should be subjected to further scrutiny in prospective studies.
Although research on the link between IR and ID is scant, the interplay between iron metabolism and glucose homeostasis has garnered significant interest.33,34 Vaquero et al, utilizing transferrin saturation (TAST) classification, revealed that overweight and obese adults with iron deficiency exhibited higher insulin levels than their non-iron deficient counterparts (P < 0.05). These findings echo the results of a substantial prospective study and an analysis based on the NHANES database. Notably, Podmore et al observed that this association was particularly pronounced in women.35–37 This provides a compelling basis for further investigation into the relationship between TyG-BMI and ID.
It is recognized that a higher BMI is generally linked to an elevated risk of ID. A meta-analysis38 indicated a higher prevalence of ID in individuals who are overweight and obese compared to those with normal weight; however, no correlation was found between obesity and ID. This may be attributed to the fact that a small proportion of obese individuals with occult ID or early-stage IDA might not present with clinically identifiable anemia. Furthermore, Laillou et al39 noted that BMI was not significantly associated with the occurrence of IDA. In our study, the integration of TyG index with TyG-BMI and IDA demonstrated significant statistical relevance, suggesting that IR may contribute to the development of ID in individuals with elevated BMI.
The research indicates an interactive effect between a high-inflammatory diet and IR. Higher DII has been implicated in the promotion of obesity, which is considered a critical link between chronic inflammation and IR.40 Adipose tissue macrophages (ATMs) undergo a phenotypic shift from an M2-like anti-inflammatory state to an M1-like pro-inflammatory state, releasing excessive free fatty acids (FFA), ROS, and pro-inflammatory cytokines.41 This leads to persistent tissue inflammation, a key contributor to decreased insulin sensitivity, leading to IR. Furthermore, IR can induce a chronic low-grade inflammatory state, and adipose tissue in patients is more likely to accumulate macrophages and release pro-inflammatory cytokines (such as IL-6, TNF-α).16 IL-6 upregulates hepcidin gene expression through the JAK/STAT3 pathway, leading to ID.25,26 The inflammatory environment, especially elevated levels of TNF-α, can reduce the expression of ferroportin 1(FPN1), the only iron export protein in the body, causing intracellular iron release disorders.42,43 These researches also support the result of this study that IR plays a mediating role between DII and iron metabolism, providing a new perspective on the interaction between iron deficiency anemia and these dietary and metabolic mechanisms, however, future longitudinal cohort studies and randomized controlled studies should be conducted to reveal the specific causal relationship and mechanism of action.
The research benefits from several methodological strengths. Notably, it utilizes data from NHANES, which provides a representative sample of the US population. This allows for the adjustment of various confounding factors, thereby amplifying the statistical power of our findings. However, it is essential to acknowledge the study’s limitations. As a cross-sectional study, we are unable to infer causality between TyG-BMI, DII, and the risk of ID in American women, a relationship that should be further validated in longitudinal studies. Secondly, the project applied Cook’s equation for the quantitative assessment of body iron, and although CRP was considered in the calculation of ferritin to exclude the interference of inflammation, there was no data on α1-acid glycoprotein (AGP) in the database, and we did not adjust for transferrin saturation.23,44 Thirdly, the DII was derived from 24-hour recall data obtained through face-to-face interviews, a method that is susceptible to reporting biases. Moreover, while the DII typically incorporates 45 different food items or nutrients, our analysis was based on 28. Nonetheless, previous research has indicated that utilizing this reduced subset does not diminish the predictive value of the DII.45,46 Lastly, despite accounting for multiple covariates, we acknowledge the possibility of residual confounding due to unmeasured variables, such as heavy menstrual bleeding and pregnancy history. These are major risk factors for iron deficiency in this group and must be considered in future research to better understand the risk of ID in this population.
To summarize our findings, the study establishes a significant correlation between the DII and TyG-BMI with ID in reproductive-age women. The data suggest that pro-inflammatory diet may increase the incidence of ID by exacerbating IR, and there is a synergistic effect between pro-inflammatory diet and IR. The interplay between TyG-BMI, DII, and ID merits deeper investigation. It is plausible that interventions aimed at improving dietary habits, nutritional status, and metabolic health could lead to significant improvements in the ID status of women in their reproductive years.
Data Sharing Statement
The data associated with this study been deposited into NHANES. The NHANES data and survey methodology are publicly available and accessible on the website (https//:www.cdc.gov/nchs/nhanes/index.htm). Further inquiries can be directed to the corresponding authors.
Highlights
1. DII and TyG-BMI are significantly linked to ID risk in reproductive-age women.
2. Combined DII and TyG-BMI enhance predictive power for ID.
3. TyG-BMI mediates the relationship between DII and ID.
4. Improving diet and metabolic health could improve iron status in reproductive-age women.
Acknowledgments
Jia Ding and Zhehao Xu are co-first authors for this study. We are immensely grateful and deeply appreciative for the invaluable contribution made by the National Health and Nutrition Examination Survey (NHANES) program in sharing their extensive and meticulously collected data with us. And we acknowledge BioRender for their exceptional platform that enabled the creation of our graphical abstract with ease and precision.
Author Contributions
All authors made a significant contribution to the work reported, whether that is in the conception, study design, execution, acquisition of data, analysis and interpretation, or in all these areas; took part in drafting, revising or critically reviewing the article; gave final approval of the version to be published; have agreed on the journal to which the article has been submitted; and agree to be accountable for all aspects of the work.
Funding
This research was supported by grants from Guangzhou Science and Technology Plan Project (No.202102010314) and Yixian Clinical Research and Cultivation Project (No.SYS-C-202104).
Disclosure
All authors report no conflicts of interest in this work.
References
1. Global. regional, and national incidence, prevalence, and years lived with disability for 328 diseases and injuries for 195 countries, 1990-2016: a systematic analysis for the global burden of disease study 2016. Lancet. 2017;390(10100):e38.
2. Pasricha S-R, Tye-Din J, Muckenthaler MU, Swinkels DW. Iron deficiency. Lancet. 2021;397(10270):233–248. doi:10.1016/S0140-6736(20)32594-0
3. Tang GH, Sholzberg M. Iron deficiency anemia among women: an issue of health equity. Blood Rev. 2024;64:101159. doi:10.1016/j.blre.2023.101159
4. Chang J-S, Chen Y-C, Owaga E, Palupi K, Pan W-H, Bai C-H. Interactive effects of dietary fat/carbohydrate ratio and body mass index on iron deficiency anemia among Taiwanese women. Nutrients. 2014;6(9):3929–3941. doi:10.3390/nu6093929
5. Benson CA-O, Shah AA-O, Stanworth SJ, et al. The effect of iron deficiency and anaemia on women’s health. Anaesthesia. 2021;76(Suppl 4):84–95. doi:10.1111/anae.15405
6. Breymann C. Iron deficiency anemia in pregnancy. Semin Hematol. 2015;52(4):339–347. doi:10.1053/j.seminhematol.2015.07.003
7. Sun H, Weaver CM. Decreased iron intake parallels rising iron deficiency anemia and related mortality rates in the US population. J Nutr. 2021;151(7):1947–1955. doi:10.1093/jn/nxab064
8. Mayasari NA-O, Bai CA-O, Hu TY, et al. Associations of food and nutrient intake with serum hepcidin and the risk of gestational iron-deficiency anemia among pregnant women: a population-based study. Nutrients. 2021;13(10):3501. doi:10.3390/nu13103501
9. Pavillard LE, Marín-Aguilar F, Bullon P, Cordero MD. Cardiovascular diseases, NLRP3 inflammasome, and western dietary patterns. Pharmacol Res. 2018;131:44–50. doi:10.1016/j.phrs.2018.03.018
10. Tayyem RF, Qalqili TR, Ajeen R, Rayyan YM. Dietary patterns and the risk of inflammatory bowel disease: findings from a case-control study. Nutrients. 2021;13(6):1889. doi:10.3390/nu13061889
11. Bizzozero-Peroni B, Brazo-Sayavera J, Martínez-Vizcaíno V, et al. High adherence to the Mediterranean diet is associated with higher physical fitness in adults: a systematic review and meta-analysis. Adv Nutr. 2022;13(6):2195–2206. doi:10.1093/advances/nmac104
12. Fitó M, Guxens M, Corella D, et al. Effect of a traditional Mediterranean diet on lipoprotein oxidation: a randomized controlled trial. Arch Intern Med. 2007;167(11):1195–1203. doi:10.1001/archinte.167.11.1195
13. Koelman L, Egea Rodrigues C, Aleksandrova K. Effects of dietary patterns on biomarkers of inflammation and immune responses: a systematic review and meta-analysis of randomized controlled trials. Adv Nutr. 2022;13(1):101–115. doi:10.1093/advances/nmab086
14. Shivappa N, Steck SE, Hurley TG, Hussey JR, Hébert JR. Designing and developing a literature-derived, population-based dietary inflammatory index. Pub Health Nut. 2014;17(8):1689–1696. doi:10.1017/S1368980013002115
15. Szklarz M, Gontarz-Nowak KA-O, Matuszewski WA-O, Bandurska-Stankiewicz E. ”Ferrocrinology”-iron is an important factor involved in gluco- and lipocrinology. Nutrients. 2022;14(21):4693. doi:10.3390/nu14214693
16. Aigner E, Feldman A, Datz C. Obesity as an emerging risk factor for iron deficiency. Nutrients. 2014;6(9):3587–3600. doi:10.3390/nu6093587
17. Ramírez-Vélez R, Pérez-Sousa M, González-Ruíz K. Obesity- and lipid-related parameters in the identification of older adults with a high risk of prediabetes according to the American diabetes association: an analysis of the 2015 health, well-being, and aging study. Nutrients. 2019;11(11):2654. doi:10.3390/nu11112654
18. Zhou Z, Liu Q, Zheng M, et al. Comparative study on the predictive value of TG/HDL-C, TyG and TyG-BMI indices for 5-year mortality in critically ill patients with chronic heart failure: a retrospective study. Cardiovasc diabet. 2024;23(1):213. doi:10.1186/s12933-024-02308-w
19. Hariharan R, Odjidja EN, Scott D, et al. The dietary inflammatory index, obesity, type 2 diabetes, and cardiovascular risk factors and diseases. Obesity Rev. 2022;23(1):e13349. doi:10.1111/obr.13349
20. Zhao L, Sun Y, Liu Y, Yan Z, Peng W. A J-shaped association between Dietary Inflammatory Index (DII) and depression: a cross-sectional study from NHANES 2007-2018. J Affective Disorders. 2023;323:257–263. doi:10.1016/j.jad.2022.11.052
21. Dang K, Wang X, Hu J, et al. The association between triglyceride-glucose index and its combination with obesity indicators and cardiovascular disease: NHANES 2003-2018. Cardiovasc diabet. 2024;23(1):8. doi:10.1186/s12933-023-02115-9
22. Al Hinai M, Jansen EC, Song PXK, Peterson KE, Baylin A. Iron deficiency and vitamin d deficiency are associated with sleep in females of reproductive age: an analysis of NHANES 2005–2018 data. J Nutr. 2024;154(2):648–657. doi:10.1016/j.tjnut.2023.11.030
23. Namaste SA-O, Rohner FA-O, Huang J, et al. Adjusting ferritin concentrations for inflammation: biomarkers reflecting inflammation and nutritional determinants of anemia (BRINDA) project. Am J Clin Nut. 2017;106(Suppl 1):359S–71S. doi:10.3945/ajcn.116.141762
24. Kim YJ, Kim KS, Lim D, et al. Epigallocatechin-3-gallate (EGCG)-inducible SMILE inhibits STAT3-mediated hepcidin gene expression. Antioxidants. 2020;9(6):514. doi:10.3390/antiox9060514
25. Fillebeen C, Lam NH, Chow S, Botta A, Sweeney G, Pantopoulos KA-O. Regulatory connections between iron and glucose metabolism. Int J mol Sci. 2020;21(20):7773. doi:10.3390/ijms21207773
26. Sobieska K, Buczyńska A, Krętowski AJ, Popławska-Kita A. Iron homeostasis and insulin sensitivity: unraveling the complex interactions. Rev Endocr Metab Disord. 2024;25(5):925–939. doi:10.1007/s11154-024-09908-7
27. Khan I, Kwon M, Shivappa N, Hébert JR, Kim MA-O. Positive Association of Dietary Inflammatory Index with Incidence of Cardiovascular Disease: findings from a Korean Population-Based Prospective Study. Nutrients. 2020;12(2):588. doi:10.3390/nu12020588
28. Morales-Suárez-Varela MA-O, Peraita-Costa I, Perales-Marín AA-O, Marcos Puig BA-O, Llopis-Morales J, Picó YA-O. Effect of adherence to the Mediterranean diet on maternal iron related biochemical parameters during pregnancy and gestational weight gain. Life. 2023;13(5):1138. doi:10.3390/life13051138
29. Chijiwa T, Nishiya K, Fau - Hashimoto K, Hashimoto K. Serum transferrin receptor levels in patients with rheumatoid arthritis are correlated with indicators for anaemia. Clin Rheumatol. 2001;20(5):307–313. doi:10.1007/s100670170018
30. Doherty JL, Larvie DY, Shivappa N, Hebert JR, Armah SM. Inflammatory diets are associated with lower total iron binding capacity in sera of young adults. Int J Vitam Nutr Res. 2023;93(1):9–17. doi:10.1024/0300-9831/a000697
31. Kawabata H. Transferrin and transferrin receptors update. Free Radic Biol Med. 2019;133:46–54. doi:10.1016/j.freeradbiomed.2018.06.037
32. Wallace DF, McDonald CJ, Ostini L, Subramaniam VN. Blunted hepcidin response to inflammation in the absence of Hfe and transferrin receptor 2. Blood. 2011;117(10):2960–2966. doi:10.1182/blood-2010-08-303859
33. Fernández-Real JM, McClain D, Manco M. Mechanisms linking glucose homeostasis and iron metabolism toward the onset and progression of type 2 diabetes. Diabetes Care. 2015;38(11):2169–2176. doi:10.2337/dc14-3082
34. Miao RA-O, Fang X, Zhang Y, Wei J, Zhang Y, Tian J. Iron metabolism and ferroptosis in type 2 diabetes mellitus and complications: mechanisms and therapeutic opportunities. Cell Death Dis. 2023;14(3):186. doi:10.1038/s41419-023-05708-0
35. Vaquero MP, Martínez-Maqueda D, Gallego-Narbón A, Zapatera B, Pérez-Jiménez J. Relationship between iron status markers and insulin resistance: an exploratory study in subjects with excess body weight. PeerJ. 2020;8:e9528. doi:10.7717/peerj.9528
36. Podmore CA-O, Meidtner K, Schulze MB, et al. Association of multiple biomarkers of iron metabolism and type 2 diabetes: the EPIC-interact study. Diabetes Care. 2016;39(4):572–581. doi:10.2337/dc15-0257
37. Cheung C-L, Cheung TT, Lam KSL, Cheung BMY. High ferritin and low transferrin saturation are associated with pre-diabetes among a national representative sample of U.S. adults. Clin Nutr. 2013;32(6):1055–1060. doi:10.1016/j.clnu.2012.11.024
38. Zhao L, Zhang X, Shen Y, Fang X, Wang Y, Wang FA-O. Obesity and iron deficiency: a quantitative meta-analysis. Obesity Rev. 2015;16(12):1081–1093. doi:10.1111/obr.12323
39. Laillou A, Yakes E, Le TH, et al. Intra-individual double burden of overweight and micronutrient deficiencies among Vietnamese women. PLoS One. 2014;9(10):e110499. doi:10.1371/journal.pone.0110499
40. Kahn SE, Hull R, Utzschneider KM. Mechanisms linking obesity to insulin resistance and type 2 diabetes. Nature. 2006;444(7121):840–846. doi:10.1038/nature05482
41. Ahmed B, Sultana R, Greene MW. Adipose tissue and insulin resistance in obese. Biomed Pharmacother. 2021;137:111315.
42. Comità S, Falco P, Mezzanotte M, Vujić Spasić MA-O, Roetto AA-O. Lack of Hfe and TfR2 in macrophages impairs iron metabolism in the spleen and the bone marrow. Int J mol Sci. 2024;25(17):9142. doi:10.3390/ijms25179142
43. Sam RM, Shetty SS, Kumari NSA-O, Kp S, Bhandary P. Association between iron profile status and insulin resistance in patients with type 2 diabetes mellitus. J Diabetes Metab Disord. 2024;22(2):1453–1458. doi:10.1007/s40200-023-01268-4
44. Luo H, Geng J, Zeiler M, et al. A practical guide to adjust micronutrient biomarkers for inflammation using the BRINDA method. J Nutr. 2023;153(4):1265–1272. doi:10.1016/j.tjnut.2023.02.016
45. Shivappa N, Steck SE, Hurley TG, et al. A population-based dietary inflammatory index predicts levels of C-reactive protein in the seasonal variation of blood cholesterol study (SEASONS). Pub Health Nut. 2014;17(8):1825–1833. doi:10.1017/S1368980013002565
46. Shu Y, Wu X, Wang J, Ma X, Li H, Xiang Y. Associations of dietary inflammatory index with prediabetes and insulin resistance. Front Endocrinol. 2022;13:820932. doi:10.3389/fendo.2022.820932
 © 2025 The Author(s). This work is published and licensed by Dove Medical Press Limited. The
full terms of this license are available at https://www.dovepress.com/terms
and incorporate the Creative Commons Attribution
- Non Commercial (unported, 3.0) License.
By accessing the work you hereby accept the Terms. Non-commercial uses of the work are permitted
without any further permission from Dove Medical Press Limited, provided the work is properly
attributed. For permission for commercial use of this work, please see paragraphs 4.2 and 5 of our Terms.
© 2025 The Author(s). This work is published and licensed by Dove Medical Press Limited. The
full terms of this license are available at https://www.dovepress.com/terms
and incorporate the Creative Commons Attribution
- Non Commercial (unported, 3.0) License.
By accessing the work you hereby accept the Terms. Non-commercial uses of the work are permitted
without any further permission from Dove Medical Press Limited, provided the work is properly
attributed. For permission for commercial use of this work, please see paragraphs 4.2 and 5 of our Terms.
Recommended articles
Association and Diagnostic Value of TyG-BMI for Hyperuricemia in Patients with Non-Alcoholic Fatty Liver Disease: A Cross-Sectional Study
Li H, Gao G, Xu Z, Zhao L, Xing Y, He J, Gao Y
Diabetes, Metabolic Syndrome and Obesity 2024, 17:4663-4673
Published Date: 6 December 2024
Linear Inverse Association Between Triglyceride Glucose-Body Mass Index and Osteoporosis in Patients with Type 2 Diabetes Mellitus: A Cross-Sectional Study
Zhou L, Zhang F, Wang Z, Kang Z
Diabetes, Metabolic Syndrome and Obesity 2026, 19:569521
Published Date: 6 January 2026