Back to Journals » Risk Management and Healthcare Policy » Volume 14
Association between Dietary Diversity and Food Insecurity in Urban Households: A Cross-Sectional Survey of Various Ethnic Populations of Karachi, Pakistan
Authors Hashmi S ![]() , Safdar NF, Zaheer S, Shafique K
, Safdar NF, Zaheer S, Shafique K
Received 12 October 2020
Accepted for publication 26 April 2021
Published 17 July 2021 Volume 2021:14 Pages 3025—3035
DOI https://doi.org/10.2147/RMHP.S284513
Checked for plagiarism Yes
Review by Single anonymous peer review
Peer reviewer comments 3
Editor who approved publication: Dr Kent Rondeau
Shahkamal Hashmi, Nilofer Fatimi Safdar, Sidra Zaheer, Kashif Shafique
School of Public Health, Dow University of Health Sciences, Karachi, Pakistan
Correspondence: Shahkamal Hashmi
School of Public Health, Dow University of Health Sciences, 111 Suparco Road, Gulzar e Hijri Scheme 33, Karachi, Pakistan
Tel +923323377652
Email [email protected]
Background and Purpose: The world is experiencing a nutritional transition, yet some regions of South East Asia are still living under the shadows of catastrophic nutritional indicators. Pakistan bears a high dual burden of both communicable and chronic diseases. However, a major contributing factor of both is poor diet and nutrition. The causal pathway of stunting, underweight, wasting, and micronutrient deficiencies has beginnings in less dietary diversity and food insecurity. Current literature on Pakistan and other South Asian countries regarding food insecurity and dietary diversity largely focus on women and children aged less than 5 years; however, ethnic and cultural dynamics of the populace concerning their food and dietary practices in Pakistan have not been well explored. It is essential to have a clear insight into the factors involving malnutrition in different clusters, especially different cultures and ethnicities to target specific areas of interventional strategies versus a uniform approach for all. This study aimed to explore the level of food insecurity and dietary diversity in all major ethnic groups of Karachi, the largest city of Pakistan.
Methods: Using the multistage random sampling, 535 households from five major ethnic groups residing in Karachi were included in the study. To measure food insecurity and dietary diversity (primary and secondary outcome, respectively), we used a FAO standardized questionnaire (version 3, 2007) that was translated first into local languages, piloted, and employed to collect information.
Results: Severe food insecurity levels had an inverse relationship with the household dietary diversity, which persisted even after adjusting for other variables (β=− 0.31, 95% CI=− 0.65, − 0.07). There was no statistically significant association of age, marital status, or education level on food diversity. The most food secure cultural people were those whose ancestors had migrated from India and were Urdu speaking communities, while Sindhi speakers were the least food secure community.
Conclusion: It is imperative to investigate more on the cultural causal factors leading to food insecurity to address the root causes of malnutrition and design new cultural-specific interventions that should be employed in large urban centers where different communities reside together.
Keywords: dietary diversity, food insecurity, ethnicity, urban population
Introduction
Changing global demographics and rapid urbanization are key factors that shape modern dietary patterns.1 Population growth in urban zones demands greater food supplies and availability, hence these urban centers are prone to have an increased cost of food. Additionally, rising inflation can have an inverse impact on dietary diversity and food security.1 Ending all forms of malnutrition and providing access to safe, adequate, and healthy food to all people worldwide is one of the aims of the United Nations’ Sustainable Development Goals (SDGs). Despite global efforts made to reduce malnutrition, which have lowered overall deaths due to nutritional causes, child deaths owing to undernutrition are still around 45% worldwide, and the prevalence of undernutrition related mortality remains considerably high in South East Asia.2
Pakistan, a low-to-middle-income country, which is striving to deal with substantial food security challenges in addition to other effect multipliers such as spurt population growth and economic crisis, is also experiencing a mass urbanization crisis.3 Pakistan is not merely self-sufficient in most of the food sources, but is also a net exporter of several agricultural products, yet it faces food insecurity at high levels. The calamity is evident by the “World Food program” report for Pakistan, stating that 18% of the Pakistani population are undernourished and this prevalence of undernourishment is also ranked “Serious” by the Global Hunger Map threshold.4 In Pakistan, almost 40% of children aged less than 5 years suffer from stunting (a key and extremely sensitive indicator of chronic malnutrition) and every third child is underweight (National Nutritional survey 2018). This indicates an alarming situation and mandates an immediate evidence-based comprehensive nutritional policy.5
Dietary diversity is linked with the access dimension of household food security. It serves as a measure of the nutritional quality of the diet as a variety of food items in the diet that is required to ensure adequate consumption of essential nutrients.6 M’Kaibi et al7 showed a positive relationship of dietary diversity with normal growth patterns.
Studies have shown that, besides specific fiscal and nutritional variables, multiple social factors are also strongly associated with food insecurity in Pakistan. These factors include maternal education, paternal employment, and poor healthcare system, vulnerable population, knowledge, awareness at household levels, and inequitable food supply.8,9 Almost half of the Pakistani population (48%) suffers from food insecurity, and the prevalence is much higher in rural areas and suburbs of large cities. It is also a major concern that 42% and 27.3% of Pakistani women of reproductive age suffer from iron deficiency anemia and vitamin A deficiency, respectively.5,10
With an increased cost of healthcare, high inflation rate, treating complications, and loss of productive life years, more importance should be given to preventive health, including the indispensable role of nutrition in reducing the risk of mortality and morbidity.11 The Food and Agriculture Organization of the United Nations (FAO) defines food security as “When all people, at all times, have physical, social, and economic access to sufficient, safe, and nutritious food, which meets their dietary needs and food preferences for an active and healthy life”.12 Key facets of food security include availability, accessibility, affordability, and acceptability.13
Research has demonstrated that an average urban Pakistani diet consists of a carbohydrate rich staple based diet.14 Staple foods provide a greater level of energy, however may not improve nutritional outcomes if not supplemented with other sources such as vitamins and minerals.14 Multiple studies demonstrate that increasing dietary diversity and food variety can successfully decrease food insecurity and the choice of food consumption in households, and these are driven by cultural choices and family preferences such as taste, quality, health concerns, and monetary elements.15,16 DiSantis et al17,18 and Burns et al have demonstrated that family preferences and price of the food are among the most important key factors associated with the number of food items consumed in a household diet in a low income country.
In Pakistan, during the last 60 years, there has not been a significant change seen in the indicators of malnutrition despite huge investments in different nutrition interventions. This has been reflected in numerous studies including various national nutrition surveys.19 Hence, there is a need to find the critical “missing link” which has been left unaccounted for so far. This critical link could be the ethnic dimension of nutrition. Most of the nutrition-specific and sensitive programs have been designed and relied on numbers of the malnourished population without understanding the cultural dynamics of the populace concerning their food and dietary practices. However, ethnic subgroup differences that could influence food insecurity and dietary diversity in different populations have not been explored so much, specifically among South Asians. The population of Pakistan includes five major ethnic subgroups coming from different parts of Central and South Asia: the Urdu speakers, the Punjabis, the Sindhis, the Baluchis, and the Pashtuns. These groups have distinct differences in cultural practices and values, dietary habits, health beliefs, and behaviors that could make them susceptible to food insecurity and dietary diversity, even within the same geographic location. It is also known that the lack of intermingling of these ethnic groups can further contribute to the relatively well-preserved sociocultural and dietary practices of each ethnic subgroup that could either protect or prevent food security within each ethnic group.
The main objective of this study was to conduct a preliminary quantitative survey of the population residing in Karachi to identify food insecurity (primary outcome) and dietary diversity (secondary outcome) among five ethnic groups in Pakistan to capture cultural relevance to the nutritional situation of households.
Materials and Methods
Study Design, Setting, and Population
This is a community-based, cross-sectional study that was conducted between August 2019 and July 2020 in five major municipal areas of Karachi. The five ethnic groups mentioned above represent more than 95% of the country’s population and they reside in clusters in different regions of Karachi, hence besides being the largest, it is the most culturally diverse city of Pakistan, also known as Mini Pakistan, with a population over 16 million.20 The study population was drawn from various catchment areas of Karachi including; Patel Para, Malir, Liyari, Sheerin Jinnah Colony, and North Nazimabad, that have a concentrated population of Punjabi, Sindhi, Balochi, Pushto, and Urdu speaking communities, respectively.
Sample Size and Sampling Technique
The study sample size was estimated using Openepi online calculator using a 60% proportion of food insecurity,21 a 4.5% margin of error with 95% confidence intervals, and a design effect of 1.0 for random sampling. The sample size came out to be 456. We sampled 535 households after inflating the sample size by 15% to account for the non-response rate and missing information.
Within the selected communities/cultures, a two-stage household sampling procedure was employed allowing for a partially convenient and randomized selection process. In the first phase, five districts of Karachi were chosen and, within those five districts, five areas concentrated with each ethnicity were purposely selected for the advantage of an improved sampling frame, followed by second phase sampling, which involved selecting households. A total of 535 households were approached from the five selected areas, with a systematic sampling technique starting with a random start.
Data Collection Procedure
The first house in “Union council” (smallest administrative unit of a district in Pakistan) within communities was selected by computer generated house or apartment number from the available registry of addresses from population department, the government of Sindh, Pakistan. The interviews were conducted by 15 trained professionals, who were residents of their selected areas (five from each area). However, team supervisors were present to monitor the activities during data collection. In case of denial or non-availability of the member of a household that had been selected, the next house on the right side (while standing facing the door of the first house) was selected and in rare instances where the next house was also not accessible to survey (denial or non-availability), the house after that was included.22 Forty-six households denied access or were not available and we moved to the second house, however, only three houses were required to be approached in the case of double denial. Hence, the first house response and participation rate was 91.4%.
Inclusion Criteria
This consisted of the person responsible for planning meals in the household (decision-maker). However, a person who prepared or cooked the meal if he or she was not the person who planned the meal was excluded. All study participants were females, as they are considered the decision-makers for food preparation in their homes in Pakistan; however they represented their entire households.
Data Collection Tools
To identify the prevalence of selected household’s food insecurity situation and dietary diversity and food consumption patterns, the FAO standardized questionnaires were used. These were Household Dietary Diversity Score23 and Household Food Insecurity and Access Scale (HFIAS).24 Both tools were standardized and have been used in many low-to-middle income countries in settings where malnutrition is a major concern.25–27
Face Validity
The questionnaire was translated into the local languages and all questions were discussed independently with 20 households (four from each ethnicity) from houses other than the selected five areas aiming to inquire regarding the clarity and understanding level of the questions and their relevance to the objectives of the study. Only two participants responded with multiple interpretations. Modifications were made in the questionnaire for cultural validation, by five experts of the field. Four questions were modified, and contextually appropriate examples were included.
HFIAS
The HFIAS questionnaire consists of a list of nine specific questions about apprehension and availability of and accessibility to foods for the household during the past month.24 The questionnaire was translated into five different languages including Urdu, Sindhi, Punjabi, Balochi, and Pashto for subjects included in the study. A standardized procedure for scoring was used, where zero was attributed if the event described by the question never occurred, 1 point if it occurred 1 or 2 times during the previous 30 days (rarely), 2 points if it occurred 3–10 times (sometimes), and 3 points if it occurred 10 times or more (often). For each household, the HFIAS score corresponded to the sum of these points and could range from 0 (food security) to 27 (maximum food insecurity)24 (Supplementary Table S1).
Dietary Diversity Scale
Dietary diversity was estimated by organizing information on household food consumption from a set of 21 food items for 24 hours preceding the survey. These 21 items were clustered into six food groups: Pulses/grains; Fish/seafood; Fruits; Vegetables; Meat; and Dairy products. The six food group score, a measure of dietary diversity, is counted by adding up the value of the items reflecting the six food groups. For each household, the diet diversity can take any value from zero and six. A household would get the value zero if it does not consume any one of the 21 given items and it would get the value of six if it consumed items from all seven food groups.23 Food insecurity is the primary outcome, while dietary diversity is the secondary outcome. Study Covariates: Socio-demographic information about the respondents such as age, marital status, education level, ethnicity, employment status, number of family members and average household monthly income was collected. The number of family members sharing one kitchen was taken as a proxy (substitute) for household composition.
Data Analysis
We used SPSS version 22 for data analysis. Descriptive measures were reported as mean±SD, frequency, and percentages for all study variables. One-way ANOVA (for continuous variables) and Chi-square test (for categorical variables) were used to determine significant differences between the food insecurity groups.
Firstly, an association between food insecurity and diet diversity score was assessed using linear regression analysis. The household’s diet diversity score was taken as a continuous outcome variable and results were reported as a beta coefficient, standard error (SE), and p-value. Subsequently, binary logistic regression was analyzed to determine the association between diet diversity and food insecurity (dichotomous outcome variable: food secure (reference) and food insecure). Results were reported as odds ratio, 95% confidence interval (CI), and p-value. Univariate and multivariate regression analyses were used to estimate the association between food insecurity and diet diversity after adjusting for age, marital status, education level, ethnicity, employment status, and the number of family members. A p-value<0.05 was considered as significant.
Results
Socio-Demographic Characteristics of Respondents
Table 1 shows the basic characteristics of 535 households. The average age of the participants was 32.5 years, and the average household size was 5.8 persons. On average, more than 70% (n=445) of the representative participants had secondary school and higher education, while 16.8% did not attain any formal education. Overall, 63.7% (n=341) of the households were food secure. Approximately 20% (n=109) of households had severe food insecurity issues. Those who consumed more than three food groups were 23% (n=125) of household and almost an equal number reported consuming either three or less of food groups (Table 2). Figure 1 reflects consumption of the depicted number of food groups in an average meal by households.
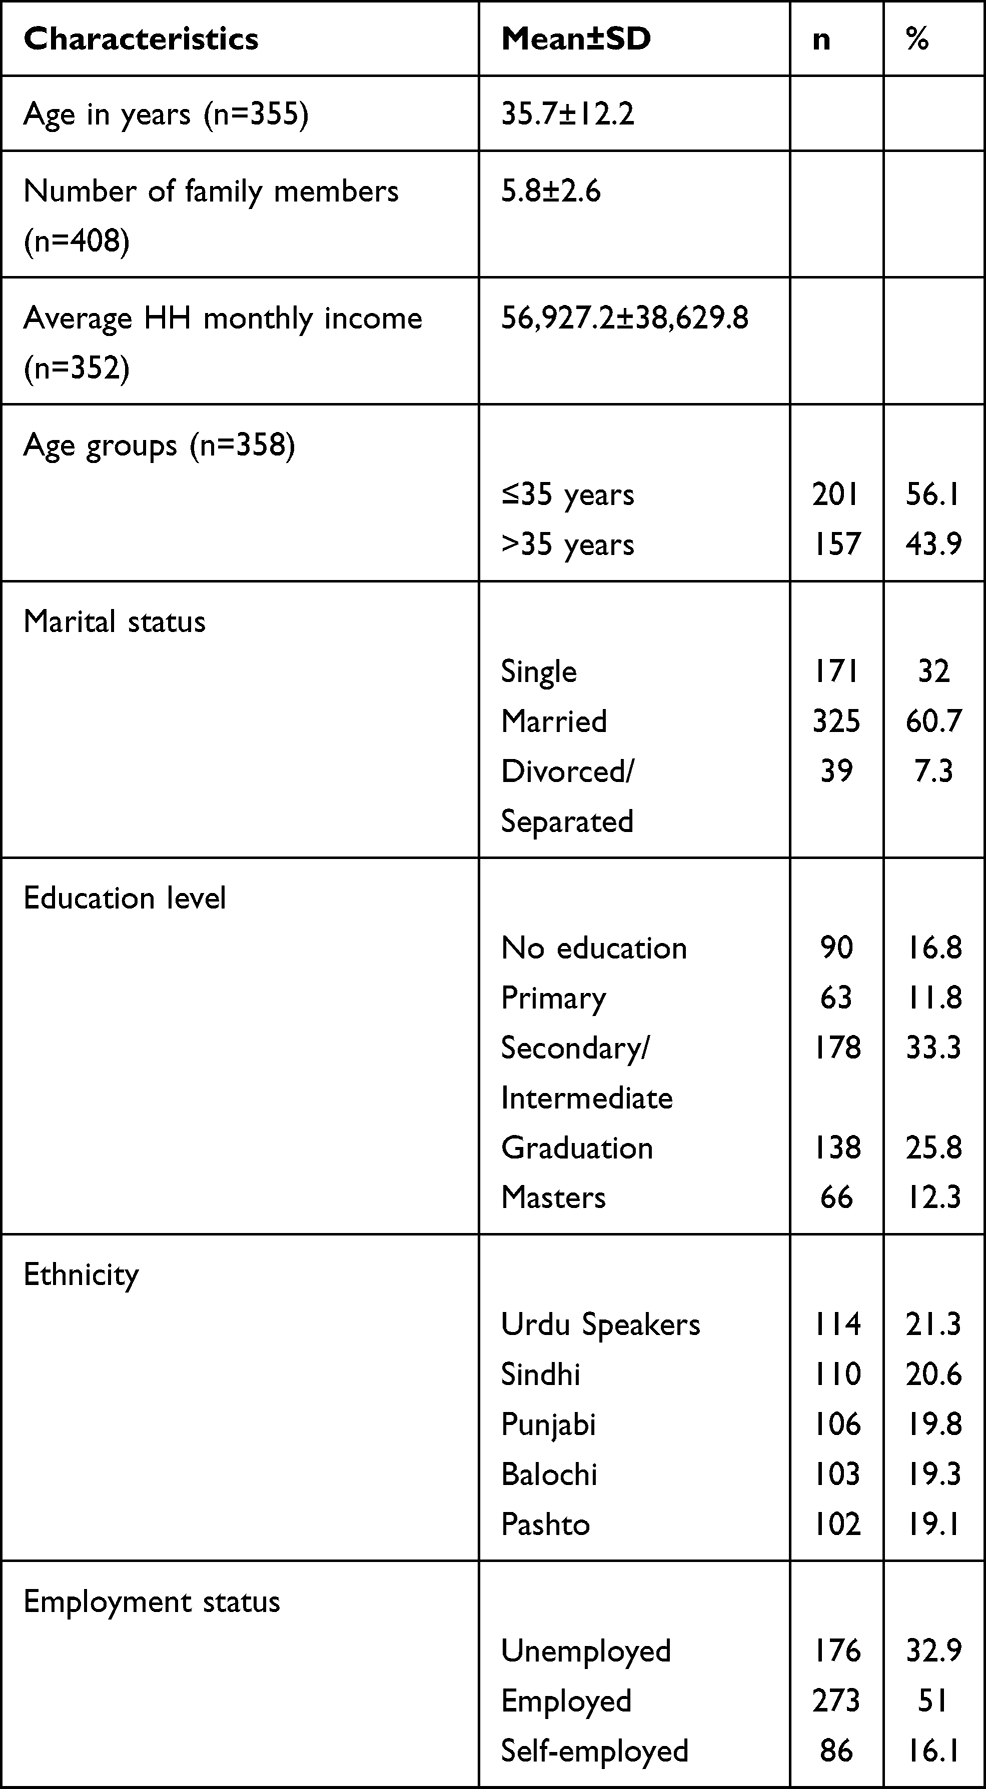 |
Table 1 Socio-Demographic Characteristics of Respondents (n=535) |
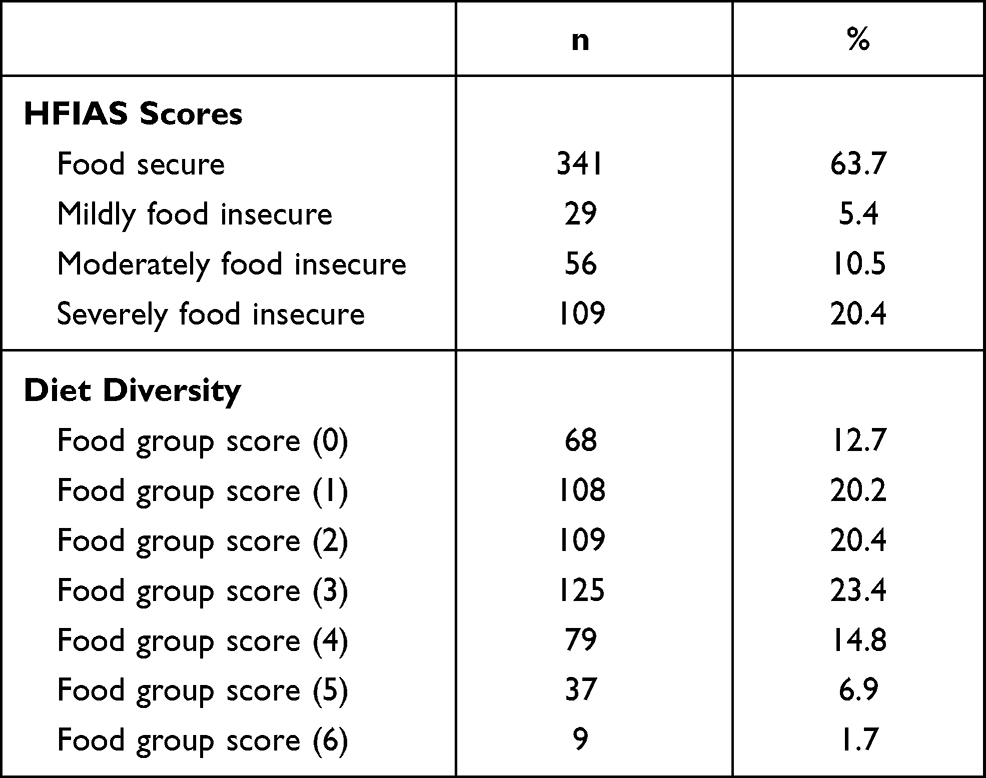 |
Table 2 Food Security and Dietary Diversity Status among Household Participants (n=535) across Five Ethnic Populations at Baseline |
 |
Figure 1 Dietary diversity across all ethnic groups (number of food groups consumed by the households). |
Dietary Diversity
Figure 1 depicts the number of food groups in a household’s average meals, a little less than a quarter of households (23.4%, n=125) consume three groups and 23% (n=125) have more than three groups of food in daily meals. The remaining households (53%, n=285) were consuming meals that were of very low diversity (≤2 food groups as per FAO scale).
Table 3 shows household food insecurity regarding socio-demographic factors. Being single, married, or divorced or separated did not have a large effect on food insecurity status (67%, 61%, and 69%, respectively) with a p-value of 0.014.
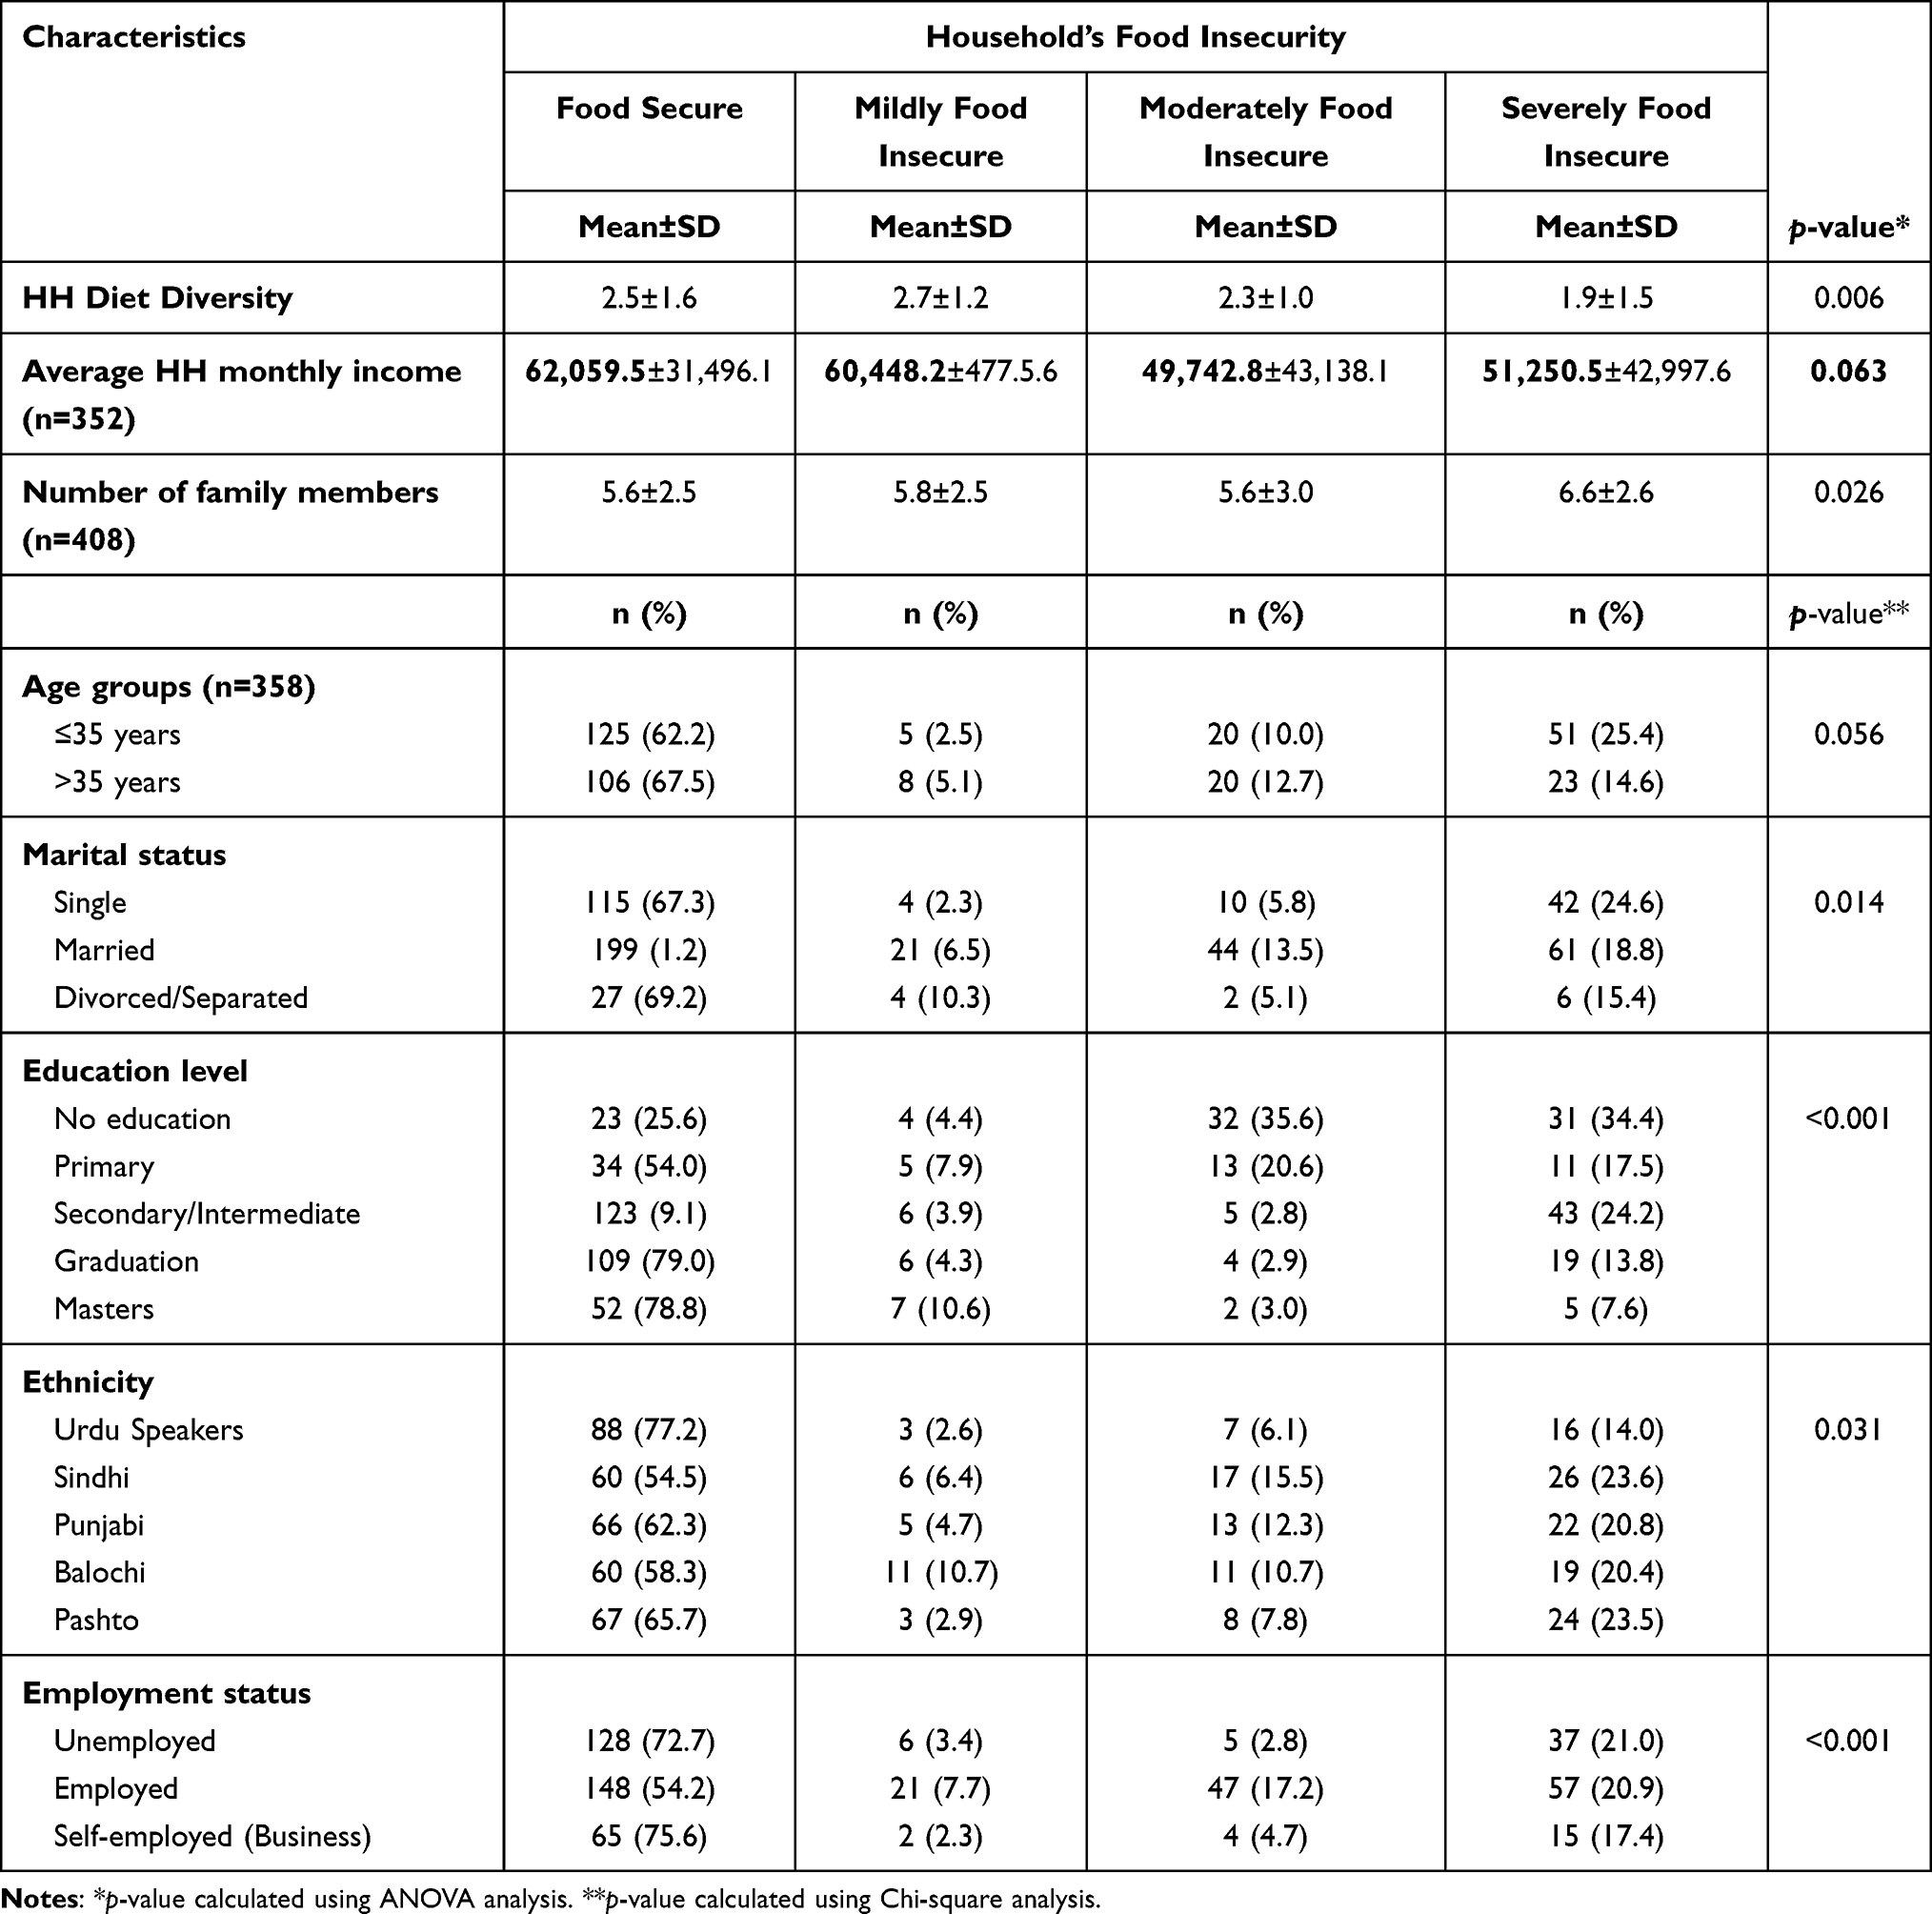 |
Table 3 Socio-Demographic and Lifestyle Factors Associated with Adherence to Major Dietary Patterns among Pakistani Adults (n=535) |
Another significant finding was that the Urdu-speaking households were the most food-secure group (77.2%) as compared to Pushto speaking households (67%), Punjabi population (66%), Sindhi (60%), and Balochi (60%) participants. Those who were unemployed, irrespective of their ethnicity, were significantly more (72.7%, p-value=0.001) food secure than those who had some kind of job (54.2%).
Severe food insecurity levels were found to have an inverse association with the household dietary diversity (β=−0.24, 95% CI=−0.39, −0.09), which persisted after adjusting for other variables (β=−0.31, 95% CI=−0.65, −0.07) (Table 4). There was no statistically significant association of age, marital status, or education level on food diversity.
 |
Table 4 Association Between Household’s Diet Diversity Score and Household Food Insecurity |
Ethnicity and Food Groups
The Urdu-speaking population were the group with the most diversified diet, having on average three or more than three groups in their diet. However the meat group was most commonly consumed by Sindhi speaking population (64.5%). The least abundant food group in all ethnicities was the seafood, which varied from 15.7–26.3%.
Household Food Insecurity
We analyzed the association of various factors on food insecurity through univariate and multivariate models. If the dietary diversity is increased by one unit, there is a likelihood that household food insecurity would reduce by 12% (cOR=0.88, 95% CI=0.78–0.99, p-value=0.042). However, after adjustment of other variables, there would be a reduction of 22% (aOR=0.78, 95% CI=0.66–0.92, p-value=0.002) in food insecurity. Being married or divorced/separated reduced the odds of food insecurity by 43% (aOR=0.57, 95% CI=0.33–0.99, p-value=0.049) and 80% (aOR= 0.20, 95% CI=0.06–0.65, p-value=0.008), respectively, as compared to being single. Education level of the mother was found to be significantly associated with food insecurity; the lower the educational level, the higher the food insecurity (No education: aOR=16.18, 95% CI=6.08–43.10, p-value<0.001, Primary: aOR=3.52, 95% CI=1.32–9.34, p-value=0.012). The Urdu-speaking population was the most food-secure group in the univariate model; however, after adjusting other factors, there was no significant difference between any ethnic groups (Table 5).
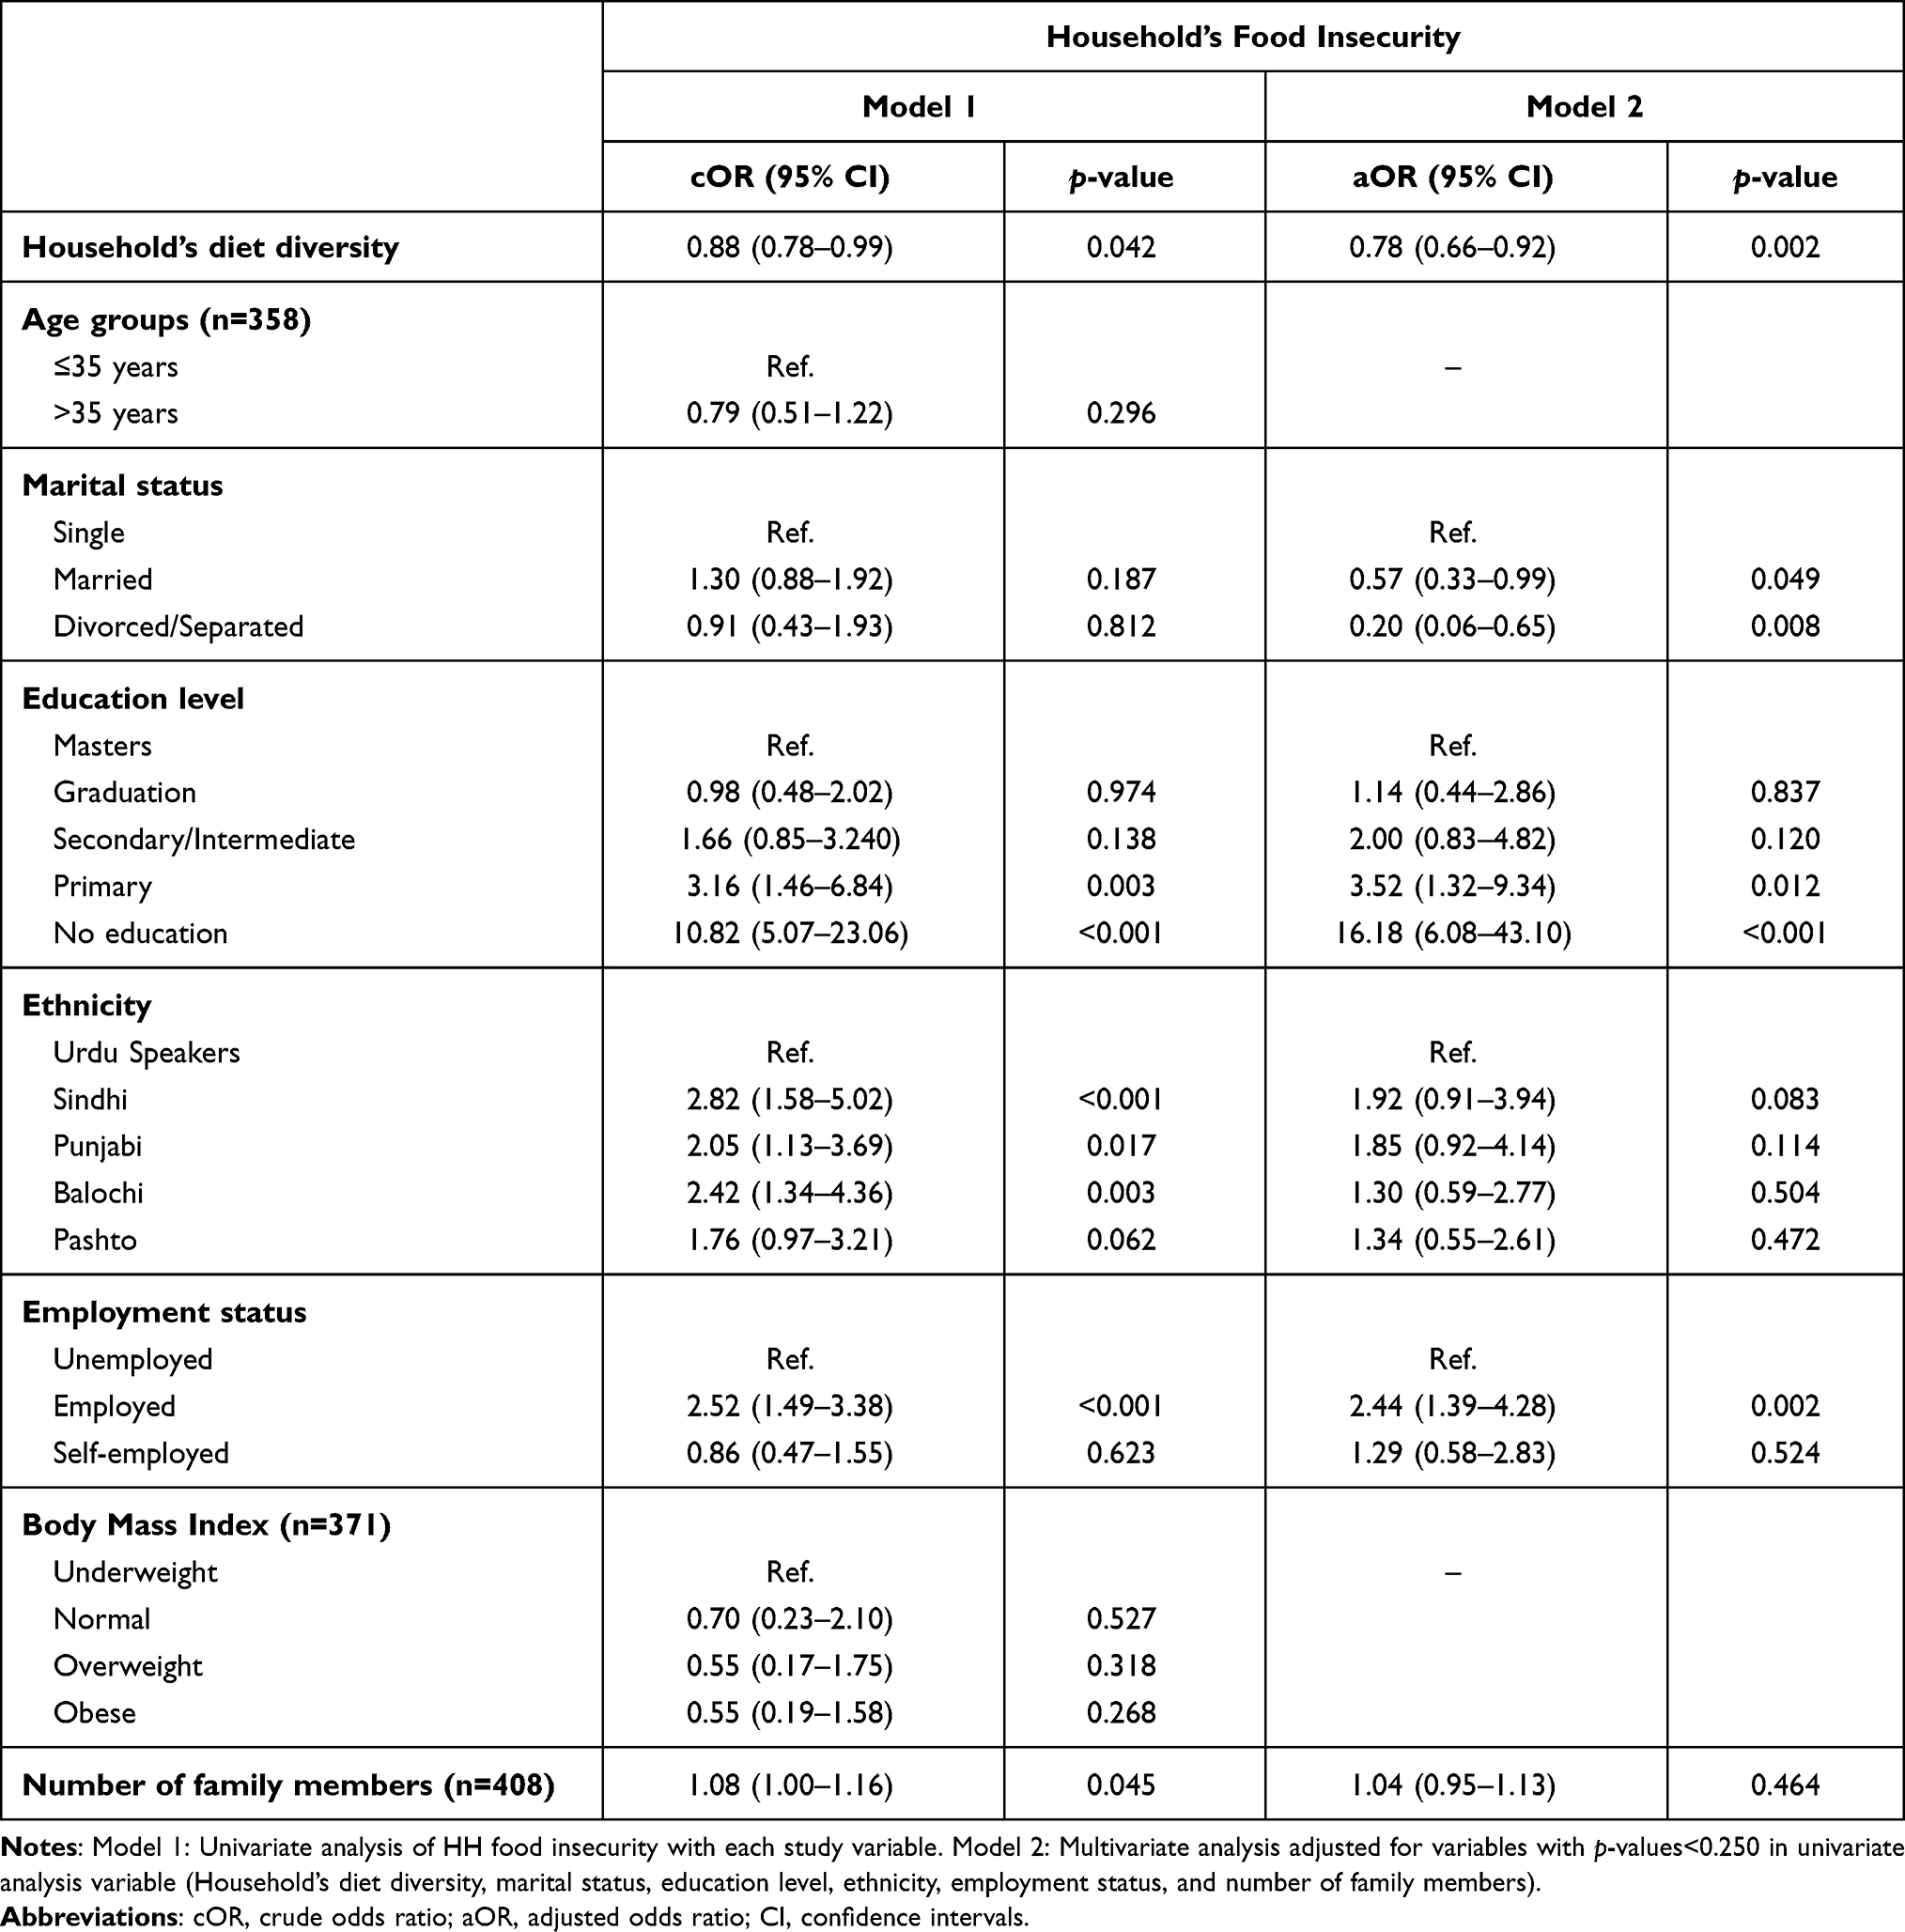 |
Table 5 Association of Household’s Diet Diversity on Household’s Food Insecurity |
Discussion
In this cross-sectional analysis, we have looked at the associations between food insecurity and dietary diversity across five ethnic groups in Pakistan. A positive association was seen between high food insecurity and low dietary diversity among major ethnic populations in Pakistan. The findings showed that households in all ethnic groups lacked dietary diversity. To our knowledge, this is the first investigation reporting a relationship between food insecurity and dietary diversity among different ethnic populations in Pakistan.
The majority of the households consumed less than three groups of food an average, being mainly dependent on carbohydrate-rich food items including wheat, rice, vegetables, and tubers. Similar findings were observed in other low-to-middle-income countries such as Ethiopia, Nigeria, and Tanzania.28–30 Pakistan is facing a vicious circle of the economic crisis resulting in a recent currency devaluation and the hike in prices of consumable goods including food items.31 Affordability is an important pillar of dietary diversity, thus compromise on diversity over quantity is comprehensible.
The results of this study showed that the Urdu-speaking communities are generally more food secure than other ethnicities. Given the fact that they are native residents of the city for decades and Balochi and Sindhi speakers have generally migrated from other cities and villages, a plausible reason could be that the families of individuals who have migrated from villages or small towns to big urban cities even after decades of residence may experience transitional or persistent food crises.32 That may be contributed to early non-employment status, switching to high accommodation prices in cities, and receiving loans.33 Haung et al34 showed that the children of the population who have moved from other areas were less food secure than their native peers, even after a long duration of residence and adjusting for some monetary variables. Another interesting and significant finding of this study was that the households with employed women were 2.5-times more food insecure than those households where the women were not employed. In the local context of Pakistan, the majority of women are housewives (usually men are bread earners) and women work outside of the home in cases of financial constraints such as low income or unemployment of husbands or fathers; however, this may not be true in all cases.35,36
It was found from our result that the educational level of the mother or food preparer endures an effect on food insecurity, the lower the educational level of the person who plans the meal, the higher the food insecurity. This may be secondary to an increase in nutritional education, better understanding of safe and hygienic practices by education.37,38 Numerous studies have found that lack of dietary diversity and scant utilization of locally produced nutritious food may exist across all wealth groups, highlighting the importance of nutrition literacy in addition to food affordability and accessibility in achieving household food security.39,40
Several limitations were identified in our study including concerns related to the study approach, sampling and cultural considerations. The cross-sectional study design provided a descriptive analysis of the study population at a given point in time, concerning several specific behavioral outcomes. However, due to design limitations, it was not possible to establish a clear temporal association between less dietary diversity and economic crisis, and increasing inflation faced by the Pakistani population. Whether less diversity occurred before the crisis or had a causal effect. Another concern is whether all the ethnicities carry the same cultural roots, beliefs, and practices that we assumed may have had influenced their diet or altered behaviors after moving to the urban center.
Recall bias is always a limiting factor, with issues related to accuracy or completeness of recollection of nutritional practices. However, communication limitations were minimized by data collectors who were equipped to be culturally sensitive and speak the same language of the selected participants.
In the ethnically diverse population of Pakistan our results have shown that there are clear ethnic differences. The most food-secure cultural group was those whose ancestors migrated from India and were called Urdu speakers, as compared to Sindhis who have been present in the Indus Valley (now in the province of Sind) for over 5,000 years. More research should be done to explore potential linguistic, religious, and sociopolitical variables that may strongly impact households’ diet in different cultures through a mixed methodology in both urban and rural areas. This may open up the avenues to new “culturally sensitive, cost-effective interventions” and a “culturally sensitive food index” for households that have high acceptability in all cultures.
Conclusion
This study highlighted the quantum of food insecurity and less dietary diversity in all ethnic groups, especially in the Sindhi and Balochi-speaking populations. Ethnic subgroup differences in susceptibility to food security and the reasons for such differences within the Pakistani population have provided additional information about lack of food security reasons when other factors like age, education, and income are similar. This information can potentially be of use by other low-income countries where ethnic differences exist, and food insecurity issues persist. Our results have given considerable hope for improvement in dietary behavior with sound communication and education strategies recognizing ethnic variations in the Pakistani population. However, these attributes are characteristic of many developing countries, to which our findings may be generalizable. We recommend that unmeasured ethnic variations in the food insecurity and dietary diversity deserve further study. There are cultural differences among food consumption patterns in households. The gravity of the nutritional situation in Pakistan mandates culturally sensitive approaches to tackle this mushrooming crisis.
Data Sharing Statement
Additional information is available on request from the corresponding author.
Ethics Approval and Informed Consent
The study was approved by the Internal Review Board of Dow University of Health Sciences, Karachi, Pakistan (IRB approval letter # 1083/DUHS). Oral and written informed consent was obtained from all participants before the start of the study. Participants were also briefed regarding the nature and procedures of the study and assurance of confidentiality of their identity was made. This study was conducted in accordance with the Declaration of Helsinki.
Acknowledgments
We are thankful to Mansoor Mahar and Owais Raza for providing technical assistance.
Author Contributions
All authors contributed to data analysis, drafting or revising the article, have agreed on the journal to which the article will be submitted, gave final approval of the version to be published, and agree to be accountable for all aspects of the work.
Funding
This was self-funded research.
Disclosure
The authors report no conflicts of interest for this work.
References
1. Cockx L, Colen L, De Weerdt J, et al. From corn to popcorn? Urbanization and dietary change: evidence from rural-urban migrants in Tanzania. World Dev. 2018;110:140–159. doi:10.1016/j.worlddev.2018.04.018
2. Walia K, Kapoor A, Farber JM, et al. Qualitative risk assessment of cricket powder to be used to treat undernutrition in infants and children in Cambodia. Food Control. 2018;92:169–182. doi:10.1016/j.foodcont.2018.04.047
3. Rana IA, Bhatti SS. Lahore, Pakistan–Urbanization challenges and opportunities. Cities. 2018;72:348–355. doi:10.1016/j.cities.2017.09.014
4. Program WF. 2019 food security bulletin; 2020 Available from: https://reliefweb.int/sites/reliefweb.int/files/resources/2019%20Global%20Hunger%20Index.pdf.
5. UNICEF. National nutrition survey short report; 2018. Available from: https://www.unicef.org/pakistan/reports/national-nutrition-survey-2018-key-findings-report.
6. Drimie S, Faber M, Schwabe C. Dietary diversity in relation to other household food security indicators. Int J Food Saf Nutr Public Health. 2015.
7. M’Kaibi FK, Steyn NP, Ochola SA, et al. The relationship between agricultural biodiversity, dietary diversity, household food security, and stunting of children in rural Kenya. Food Sci Nutr. 2017;5(2):243–254. doi:10.1002/fsn3.387
8. Akbar M, Niaz R, Amjad M. Determinants of households’ food insecurity with severity dimensions in Pakistan: varying estimates using partial proportional odds model. Health Soc Care Commun. 2020;28(5):1698–1709. doi:10.1111/hsc.12995
9. Akhtar S. Malnutrition in South Asia—A critical reappraisal. Crit Rev Food Sci Nutr. 2016;56(14):2320–2330. doi:10.1080/10408398.2013.832143
10. Sheikh S, Iqbal R, Qureshi R, Azam I, Barolia R. Adolescent food insecurity in rural Sindh, Pakistan: a cross-sectional survey. BMC Nutr. 2020;6(1):1–9. doi:10.1186/s40795-020-00343-w
11. Lucas CJ, McMahon AT, Charlton KE. Developing professional education for primary healthcare providers about nutrition. Aust J Prim Health. 2020;25(6):534–538. doi:10.1071/PY19075
12. Pérez-Escamilla R. Food security and the 2015–2030 sustainable development goals: from human to planetary health: perspectives and opinions. Curr Dev Nutr. 2017;1(7):e000513. doi:10.3945/cdn.117.000513
13. Dwyer JT, Drewnowski A. Overview: food and nutrition security. In: Sustainable Nutrition in a Changing World. Springer; 2017:3–24.
14. Tontisirin K, Nantel G, Bhattacharjee L, et al. Food-based strategies to meet the challenges of micronutrient malnutrition in the developing world. Proc Nutr Soc. 2002;61(2):243–250. doi:10.1079/PNS2002155
15. Kirkland TM, Kemp RJ, Hunter LM, Twine WM. Toward improved understanding of food security: a methodological examination based in rural South Africa. Food Culture Soc. 2013;16(1):65–84. doi:10.2752/175174413X13500468045407
16. Lo YT, Chang YH, Lee MS, et al. Dietary diversity and food expenditure as indicators of food security in older Taiwanese. Appetite. 2012;58(1):180–187. doi:10.1016/j.appet.2011.09.023
17. DiSantis KI, Grier SA, Odoms-Young A, et al. What “price” means when buying food: insights from a multisite qualitative study with Black Americans. Am J Public Health. 2013;103(3):516–522. doi:10.2105/AJPH.2012.301149
18. Burns C, Cook K, Mavoa H, et al. Role of expendable income and price in food choice by low income families. Appetite. 2013;71:209–217. doi:10.1016/j.appet.2013.08.018
19. Victora CG, Barros AJ, Axelson H, et al. How changes in coverage affect equity in maternal and child health interventions in 35 Countdown to 2015 countries: an analysis of national surveys. Lancet. 2012;380(9848):1149–1156. doi:10.1016/S0140-6736(12)61427-5
20. Fazal O, Hotez PJ, Jex AR. NTDs in the age of urbanization, climate change, and conflict: Karachi, Pakistan as a case study. PLoS Negl Trop Dis. 2020;14(11):e0008791. doi:10.1371/journal.pntd.0008791
21. GoP. Pakistan Vision 2025. Govt. Of Pakistan, Ministry of Planning, Development and Reforms, Islamabad, Pakistan. GoP; 2014.
22. Bernzen A, Jenkins JC, Braun B. Climate change-induced migration in coastal Bangladesh? A critical assessment of migration drivers in rural households under economic and environmental stress. Geosciences. 2019;9(1):51. doi:10.3390/geosciences9010051
23. Kennedy G, Ballard T, Dop M. FAO Guidelines for Measuring Household and Individual Dietary Diversity. Rome, Italy: Food and Agriculture Organization of the United Nations; 2013.
24. Coates J, Swindale A, Bilinsky P. Household Food Insecurity Access Scale for Measurement of Household Food Access: Indicator Guide. Washington DC: Food and Nutrition Technical Assistance Project; 2007:29pp.
25. Hussein FM, Ahmed AY, Muhammed OS, Lightfoot DA. Household food insecurity access scale and dietary diversity score as a proxy indicator of nutritional status among people living with HIV/AIDS, Bahir Dar, Ethiopia, 2017. PLoS One. 2018;13(6):e0199511. doi:10.1371/journal.pone.0199511
26. Gebreyesus SH, Lunde T, Mariam DH, Woldehanna T, Lindtjørn B. Is the adapted Household Food Insecurity Access Scale (HFIAS) developed internationally to measure food insecurity valid in urban and rural households of Ethiopia? BMC Nutr. 2015;1(1):1. doi:10.1186/2055-0928-1-2
27. Workicho A, Belachew T, Feyissa GT, et al. Household dietary diversity and Animal Source Food consumption in Ethiopia: evidence from the 2011 Welfare Monitoring Survey. BMC Public Health. 2016;16(1):1. doi:10.1186/s12889-016-3861-8
28. Mekuria G, Wubneh Y, Tewabe T, et al. Household dietary diversity and associated factors among residents of finote selam town, north west Ethiopia: a cross sectional study. BMC Nutr. 2017;3(1):28. doi:10.1186/s40795-017-0148-0
29. Akarolo-Anthony SN, Odubore FO, Yilme S, et al. Pattern of dietary carbohydrate intake among urbanized adult Nigerians. Int J Food Sci Nutr. 2013;64(3):292–299. doi:10.3109/09637486.2012.746290
30. Keding GB, Msuya JM, Maass BL, et al. Dietary patterns and nutritional health of women: the nutrition transition in rural Tanzania. Food Nutr Bull. 2011;32(3):218–226. doi:10.1177/156482651103200306
31. Dizon F, Herforth A, Wang Z, et al. The cost of a nutritious diet in Afghanistan, Bangladesh, Pakistan, and Sri Lanka. Global Food Security. 2019;21:38–51. doi:10.1016/j.gfs.2019.07.003
32. Pottie K, Martin JP, Cornish S, et al. Access to healthcare for the most vulnerable migrants: a humanitarian crisis. Confl Health. 2015;9(1):16. doi:10.1186/s13031-015-0043-8
33. Baey G, Yeoh BS. Migration and precarious work: negotiating debt, employment, and livelihood strategies amongst Bangladeshi migrant men working in Singapore’s construction industry. 2015.
34. Huang J, Yang J, Deng X, et al. Urbanization, food production and food security in China 2015: (No. 331-2016-14070). 2015.
35. Syed J, Pio E, Ali F, et al. A multi‐level perspective on equal employment opportunity for women in Pakistan. Equal Divers Inclusion. 2015.
36. Sadaquat MB. Employment situation of women in Pakistan. Int J Soc Econ. 2011.
37. Farzana FD, Rahman AS, Sultana S, et al. Coping strategies related to food insecurity at the household level in Bangladesh. PLoS One. 2017;12(4).
38. McArthur LH, Ball L, Danek AC, et al. A high prevalence of food insecurity among university students in Appalachia reflects a need for educational interventions and policy advocacy. J Nutr Educ Behav. 2018;50(6):564–572. doi:10.1016/j.jneb.2017.10.011
39. Picchioni F, Aurino E, Aleksandrowicz L, et al. Roads to interdisciplinarity–working at the nexus among food systems, nutrition and health. Food Security. 2017;9(1):181–189. doi:10.1007/s12571-017-0658-2
40. Gillespie S, van den Bold M, Hodge J. Nutrition and the governance of agri-food systems in South Asia: a systematic review. Food Policy. 2019;82:13–27. doi:10.1016/j.foodpol.2018.10.013
 © 2021 The Author(s). This work is published and licensed by Dove Medical Press Limited. The
full terms of this license are available at https://www.dovepress.com/terms
and incorporate the Creative Commons Attribution
- Non Commercial (unported, 3.0) License.
By accessing the work you hereby accept the Terms. Non-commercial uses of the work are permitted
without any further permission from Dove Medical Press Limited, provided the work is properly
attributed. For permission for commercial use of this work, please see paragraphs 4.2 and 5 of our Terms.
© 2021 The Author(s). This work is published and licensed by Dove Medical Press Limited. The
full terms of this license are available at https://www.dovepress.com/terms
and incorporate the Creative Commons Attribution
- Non Commercial (unported, 3.0) License.
By accessing the work you hereby accept the Terms. Non-commercial uses of the work are permitted
without any further permission from Dove Medical Press Limited, provided the work is properly
attributed. For permission for commercial use of this work, please see paragraphs 4.2 and 5 of our Terms.