Back to Journals » Clinical Interventions in Aging » Volume 17
Association Between Changes in Frailty Index and Clinical Outcomes: An Observational Cohort Study
Authors Ji S ![]() , Baek JY
, Baek JY ![]() , Jin T
, Jin T ![]() , Lee E
, Lee E ![]() , Jang IY
, Jang IY ![]() , Jung HW
, Jung HW ![]()
Received 14 January 2022
Accepted for publication 11 April 2022
Published 27 April 2022 Volume 2022:17 Pages 627—636
DOI https://doi.org/10.2147/CIA.S358512
Checked for plagiarism Yes
Review by Single anonymous peer review
Peer reviewer comments 4
Editor who approved publication: Dr Maddalena Illario
Sunghwan Ji,1 Ji Yeon Baek,2 Taeyang Jin,1 Eunju Lee,2 Il-Young Jang,2 Hee-Won Jung2
1Department of Internal Medicine, Asan Medical Center, University of Ulsan College of Medicine, Seoul, Republic of Korea; 2Division of Geriatrics, Department of Internal Medicine, Asan Medical Center, University of Ulsan College of Medicine, Seoul, Republic of Korea
Correspondence: Ji Yeon Baek, Division of Geriatrics, Department of Internal Medicine, Asan Medical Center, University of Ulsan College of Medicine, 88, Olympic-ro 43-gil, Songpa-gu, Seoul, 05505, Republic of Korea, Tel +82-2-3010-0020, Email [email protected]
Purpose: Although the association between a single assessment of frailty index (FI) and clinical outcomes has been revealed in prior studies, there is a lack of knowledge about the prognostic value of FI at different time points and the changes in repeated measurements of FI. Hence, we sought to determine the clinically meaningful changes in FI and reveal the association with the changes and a composite outcome of mortality and institutionalization.
Participants and Methods: This study was based on a longitudinal study of the Pyeongchang Rural Area cohort that included people aged 65 years or older, ambulatory and living at home. Individuals were divided into the worsened group (changes in FI ≥ 0.03 during 2 years) and the stable group (changes in FI < 0.03 during 2 years). The incidence of a composite outcome was compared between the two groups and the relationship was adjusted for age, sex, baseline FI, and follow-up FI.
Results: Of the 953 participants, 403 (42.3%) and 550 (57.7%) were included in the worsened group and the stable group, respectively. The worsened group had a significantly higher risk of the composite outcome than the stable group (HR, 2.37 [95% CI, 1.54– 3.67]; p < 0.001). Although the higher risk remained significant after adjusting for age, sex, and baseline FI, the statistical significance disappeared after adjusting for follow-up FI (p = 0.614). The aggravation of FI in the worsened group was predominantly due to aggravation of FI domains, such as activities in daily living, cognitive function and mood, and mobility rather than comorbidity burden.
Conclusion: Aggravation of FI was associated with a composite outcome regardless of baseline FI, and the association was significantly reflected in the follow-up measurement of FI. The worsening FI was mainly attributable to functional geriatric domains.
Keywords: frailty index, changes in frailty index, mortality, geriatric domains
Introduction
Frailty, a common geriatric condition closely related to human aging, has been attracting interest in research and public healthcare in accordance with the global increase in the older population. Defined as a state of decreased physiological reserve and increased vulnerability to possible intrinsic or extrinsic stressors,1,2 studies have shown that frailty is associated with health-related outcomes in older people, including falls, functional decline, institutionalization, and mortality.1,3,4 A community-based study reported that frailty is observed in 10–15% of people aged 65 or older,5 with cross-sectional association with multimorbidity and disabilities, giving frailty the state of a core geriatric syndrome.6–8
Frailty is not a static state, and longitudinal studies have reported on its dynamic changes.9–14 An established concept of the frailty cycle regarding pathophysiological mechanisms underlying the development of frailty (eg, chronic inflammation, undernutrition, decreased physical activity, and progression of organ pathologies with chronic diseases) is supported by both basic and clinical studies.3,15–17 As a result of this vicious cycle, disability and frailty worsen, and breaking this cycle with programs such as multicomponent geriatric intervention has been regarded as the key point in preventing the progression of frailty.18–20
The frailty index (FI) has been recognized as one of the most effective methods for operationalizing frailty. The FI, based on the proportion of health deficits across symptoms, signs, diseases, disabilities, or laboratory findings, can be calculated according to the number of deficits divided by the total number of examined deficits.21 The relationship between a single assessment of FI and clinical outcomes has been demonstrated in many studies.22–25
Worsening of FI, through reflecting the dynamic feature and serial assessment of frailty, has become an important surrogate marker for mortality.24,26 Also, some studies demonstrated different frailty trajectories and their impact on clinical outcomes according to baseline frailty status10 and age at death.27 However, no study to date has focused on investigating the prognostic values of baseline FI, follow-up FI, and the changes in mortality and institutionalization due to functional impairment.
This study aimed to determine the clinically meaningful absolute changes in FI and identify the associations of changes in FI with a composite outcome of mortality and institutionalization in a rural community-based prospective cohort study in South Korea. Furthermore, we compared the deficit changes according to four domains of FI.
Participants and Methods
Study Population and Design
This longitudinal observational study was based on the Aging Study of Pyeongchang Rural Area (ASPRA), a prospective cohort study in Pyeongchang County, Gangwon Province, Korea.28 The ASPRA was initially designed to study the natural course and clinical impact of frailty and geriatric syndromes in community-dwelling adults, and to develop geriatric multicomponent intervention schemes that are feasible in rural, resource-limited settings in Korea, the details of the ASPRA study have been published elsewhere.19
The inclusion criteria for the ASPRA were as follows: 1) aged 65 years or older, 2) registered in the National Healthcare Service, 3) ambulatory with or without an assistive device, 4) living at home at the time of the assessment, and 5) able to provide informed consent. The exclusion criteria were as follows: 1) living in a nursing home, 2) hospitalized, or 3) bed-ridden and receiving nursing-home level care at home.
From October 2014 to December 2018, 1338 individuals underwent baseline geriatric examinations in the ASPRA, and had variables to allow for FI calculation. Among these, we excluded 385 individuals who had missing variables for FI calculation at 2 years from baseline examination (reasons for exclusion are provided in detail in Table S1). The 953 remaining individuals were included in the final analysis (Figure 1).
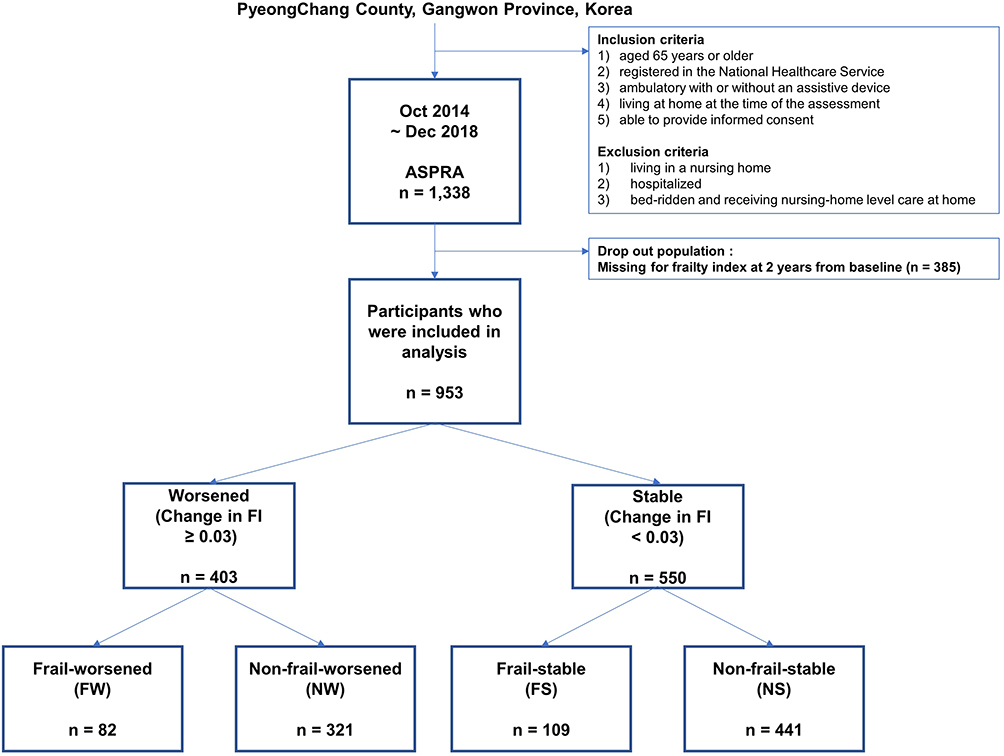 |
Figure 1 Study population flow chart. Abbreviations: ASPRA, Aging Study of Pyeongchang Rural Area; FI, frailty index. |
The Institutional Review Board (IRB) of Asan Medical Center (Seoul, Korea) approved the protocol for this study (IRB number: 2015–0673), and all participants or their proxies had provided written informed consent before enrollment in the ASPRA cohort. The study was conducted per the approved study protocol, complying with the ethical rules for human experimentation stated in the Declaration of Helsinki.
Frailty Index
For quantitative evaluation of frailty burden, we built a 34-item FI based on the concept of deficit accumulation and established methods.29–31 The 34 items (Table S2) were categorized into four domains: ADL (activities in daily living), cognitive function and mood, comorbidity, and mobility. The FI was calculated as the cumulative deficit of the 34 items, with the total score ranging from 0 to 1. We defined participants with FI ≥ 0.25 as frail and those with FI < 0.25 as non-frail.32,33
Geriatric Parameters
Trained nurses annually performed a comprehensive geriatric assessment to evaluate the functional status and common geriatric conditions. Disability status was evaluated by asking the participants seven questions on ADL (bathing, continence, dressing, eating, toileting, transferring, and face and hands washing) and 10 questions on instrumental activities of daily living (IADL; food preparation, household chores, going out a short distance, grooming, handling finances, laundry, managing own medications, shopping, transportation, and using a telephone).34 We also assessed multimorbidity, defined as having two or more of the 11 physician-diagnosed illnesses, including angina, arthritis, asthma, cancer, chronic lung disease, congestive heart failure, diabetes, heart attack, hypertension, kidney disease, and stroke. We measured the dominant grip strength using a handgrip dynamometer (T.K.K 5401 Grip-D, Takei, Tokyo, Japan), and proceeded with an analysis of the best of the two measurements. Depression was defined according to the Korean version of the Center for Epidemiological Studies Depression (CES-D) scale greater than 20 points.35 Polypharmacy was defined as taking five or more prescription medications daily. We evaluated cognitive function through the use of the Korean version of the Mini-Mental State Examination (MMSE) and defined cognitive dysfunction as MMSE score of <24.36
Clinically Meaningful Changes in FI
In line with a previous study,9 we defined changes in FI of 0.03 or more as clinically meaningful changes. Accordingly, we categorized the study individuals into two groups by absolute changes in FI during 2 years: worsened group (increase in FI ≥ 0.03) and stable group, which included both stationary (change in FI < 0.03) and improved groups (decrease in FI ≥ 0.03). Then, each group was further divided into two subgroups according to baseline FI: the frail-worsened (FW) group, which was frail (FI ≥ 0.25) at baseline and worsened; the non-frail-worsened (NW) group, which was non-frail (FI < 0.25) at baseline and worsened; the frail-stable (FS) group, which was frail at baseline and remained stable; and the non-frail-stable (NS) group, which was non-frail at baseline and remained stable. The cutoff value (≥0.25) for the FI was determined following a previous study.25,37 This cutoff effectively predicted the risk of death and institutionalization well in the same cohort.30
Outcome Assessment
We used the composite outcome of death and institutionalization due to functional impairment to assess composite outcome-free survival for clinical outcome evaluation through phone interviews with the participants or their family members every 3 months. Death was additionally captured from records of the Community Health Post network system. For this analysis, we used composite outcome data captured up to August 2020.
Statistical Analysis
Statistical analysis was performed using the R Statistical Software (version 3.6.3; R Foundation for Statistical Computing, Vienna, Austria). Independent t-tests and the Chi-squared test were used to evaluate the continuous and categorical variables of the participants’ characteristics, respectively. The estimated mortality of the worsened and stable groups was calculated with Kaplan–Meier estimators, and a Log rank test was used for between-group comparisons. Another Kaplan–Meier analysis was performed to compare the FW, NW, FS, and NS groups.
Multivariable Cox proportional hazards regression was used to calculate the hazard ratio (HR) and 95% confidence interval (CI) between the worsened group and the stable group after adjusting for age, sex, FI measured at baseline and 2 years from baseline. We stratified the participants into four groups for the sensitivity analysis based on baseline FI according to cutoff values of 0.1, 0.2, and 0.3. We compared the Kaplan–Meier curves of the worsened and stable groups for each stratum. Furthermore, we stratified the participants into four strata based on FI after 2 years from baseline and compared the worsened group with the stable group in each stratum.
To determine the aggravated FI domain, the changes in the deficit over 2 years were calculated for each domain among the FW, NW, FS, and NS groups.
Results
Baseline Characteristics
Of the 953 participants, 403 (42.3%) were included in the worsened group and 550 (57.7%) were included in the stable group. As shown in Table 1, participants in the worsened group were significantly more likely to be female, older, with shorter education years, weaker grip strength, and more cognitive dysfunction than those in the stable group. Baseline FI did not significantly differ between the two groups (P = 0.87). The average change in FI was 0.02 and 0.11 in the stable and worsened groups, respectively.
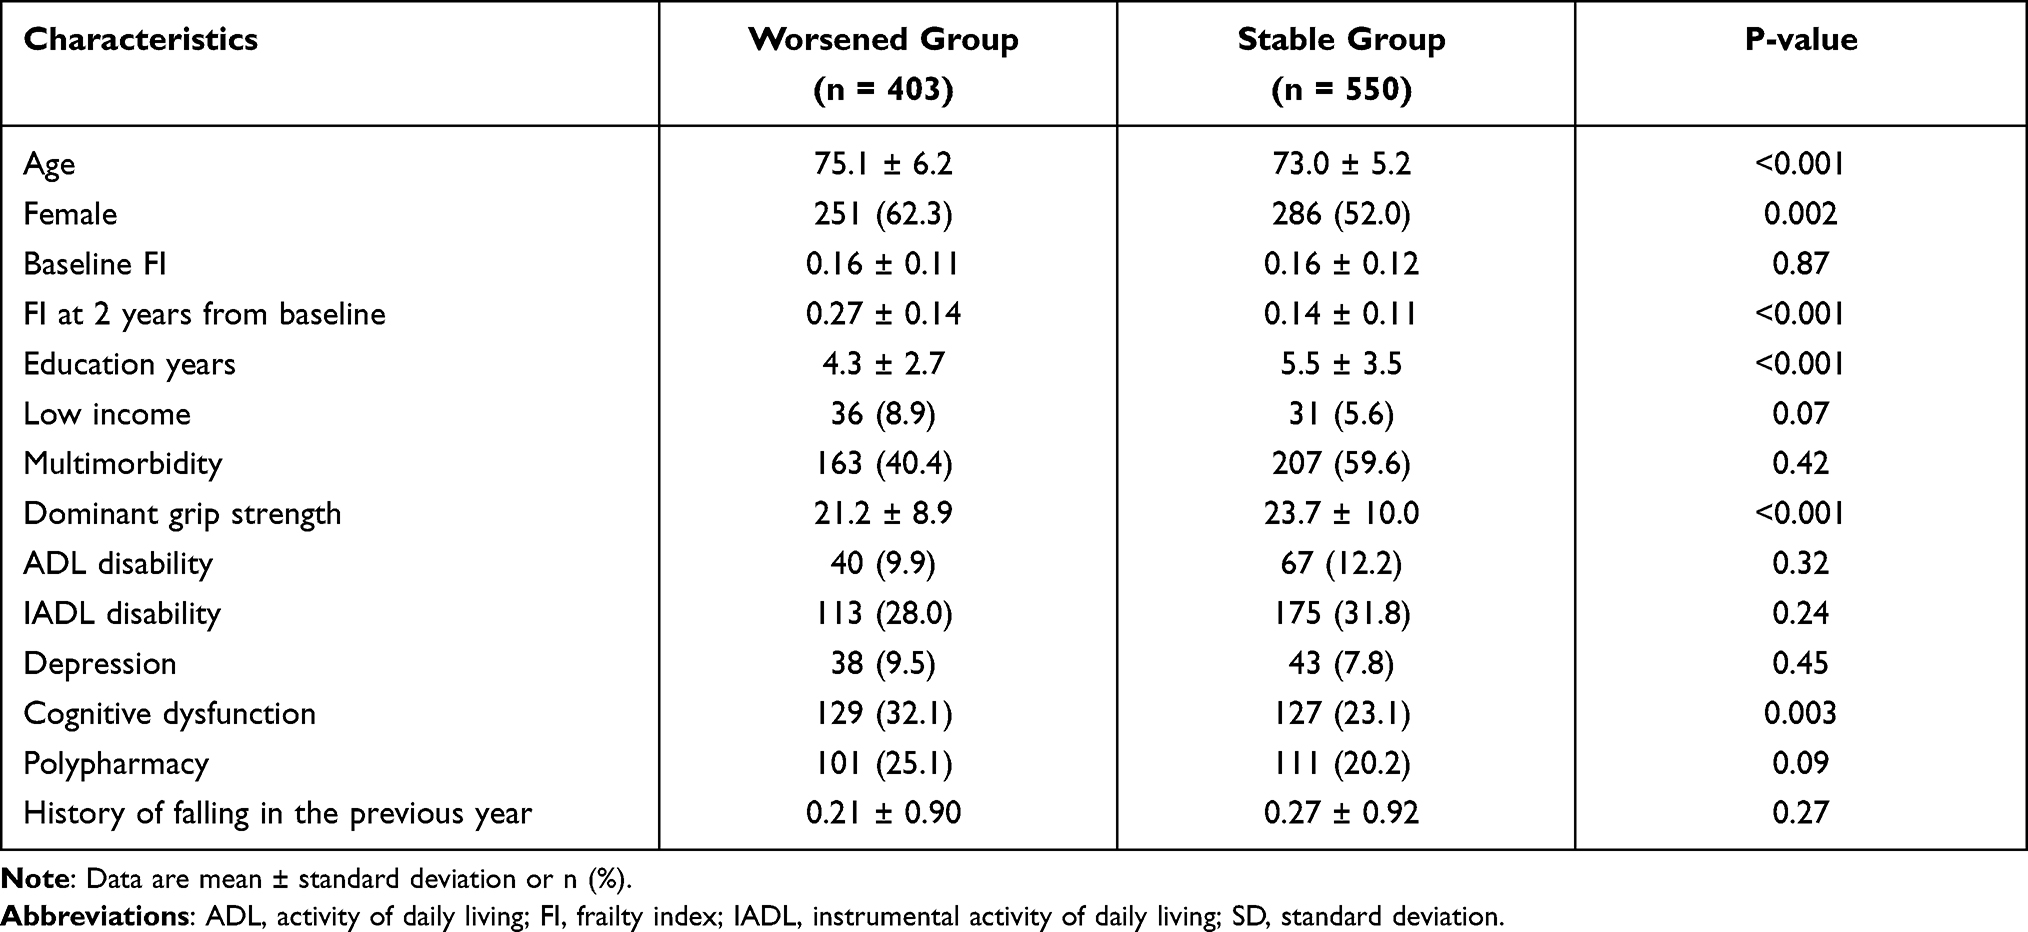 |
Table 1 Baseline Characteristics of Study Population According to Changes in the Frailty Index During 2 Years |
A total of 385 individuals were excluded from the analysis due to the lack of FI measurement at 2 years from baseline. The comparison of baseline demographic characteristics between the study population and the excluded individuals is shown in Table S3. Compared with the study population, the excluded group was older, had a higher baseline FI and higher proportions of individuals with ADL disability, IADL disability, depression, and cognitive dysfunction.
Incidence of Composite Outcome and Changes in FI During 2 Years
At a mean follow-up duration of 56.9 (SD 9.6) months, 35 (3.7%) participants had died and 54 (5.7%) had been institutionalized because of functional impairment. As shown in Figure 2A, survival of participants without composite outcome (mortality and institutionalization by functional decline) was significantly higher in the stable group than in the worsened group (Log rank test P < 0.0001).
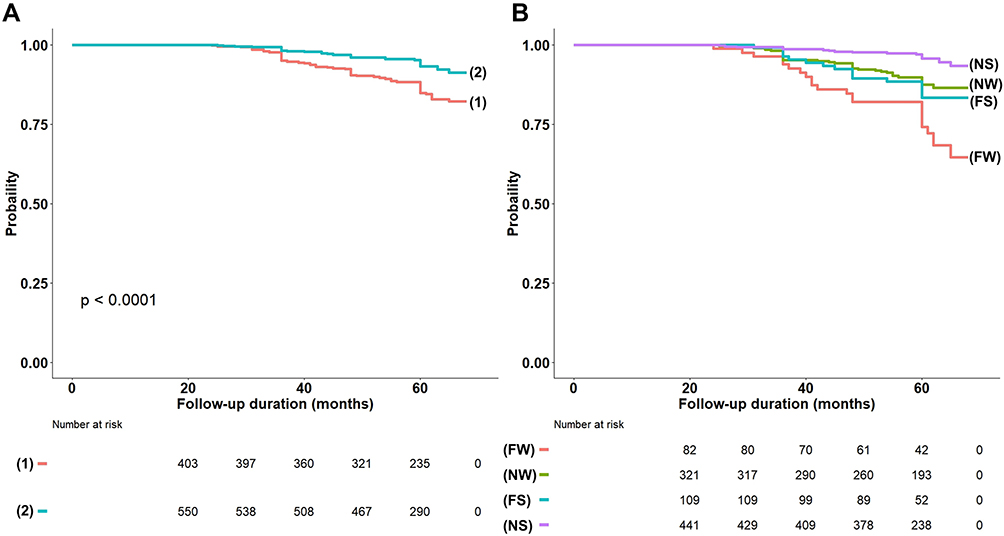 |
Figure 2 Kaplan–Meier curves for the probability of composite outcome-free survival according to baseline frailty index and changes in frailty index. (A) Worsened group (group 1) vs stable group (group 2). (B) FW (frail at baseline and worsened) vs FS (frail at baseline and stable) vs NW (non-frail at baseline and worsened) vs NS (non-frail at baseline and stable) Kaplan–Meier curves of the groups categorized based on baseline FI and changes in the FI during 2 years. |
We categorized the participants into four groups (FW, NW, FS, and NS) according to the baseline FI and changes in FI (Figure 2B). The average change in the FI was 0.13, 0.11, −0.05, and −0.01 in the FW, NW, FS, and NS groups, respectively. Group FW had the worst prognosis, while individuals in the NS group had the best prognosis. There was no significant difference between the composite outcome-free survival of Group NW and Group FS (Log rank test P = 0.4).
Impact of Baseline FI and Changes of FI on the Composite Outcome
A Cox regression analysis was performed to adjust for age, sex, and FI at baseline and after 2 years (Table 2). In the unadjusted model, the worsened group had a significantly higher risk of composite outcome compared with the stable group (HR, 2.37 [95% CI, 1.54–3.67]; P < 0.001). The higher risk of the worsened group for the composite outcome remained statistically significant after adjusting for age and sex (model 2) or age, sex, and baseline (model 3). However, after these adjustments for age, sex, and FI after 2 years from baseline, the risk of composite outcome did not differ significantly between the two groups (HR, 1.13 [95% CI, 0.70–1.84]; P = 0.61), suggesting that changes in FI over time significantly contributed to the composite outcome.
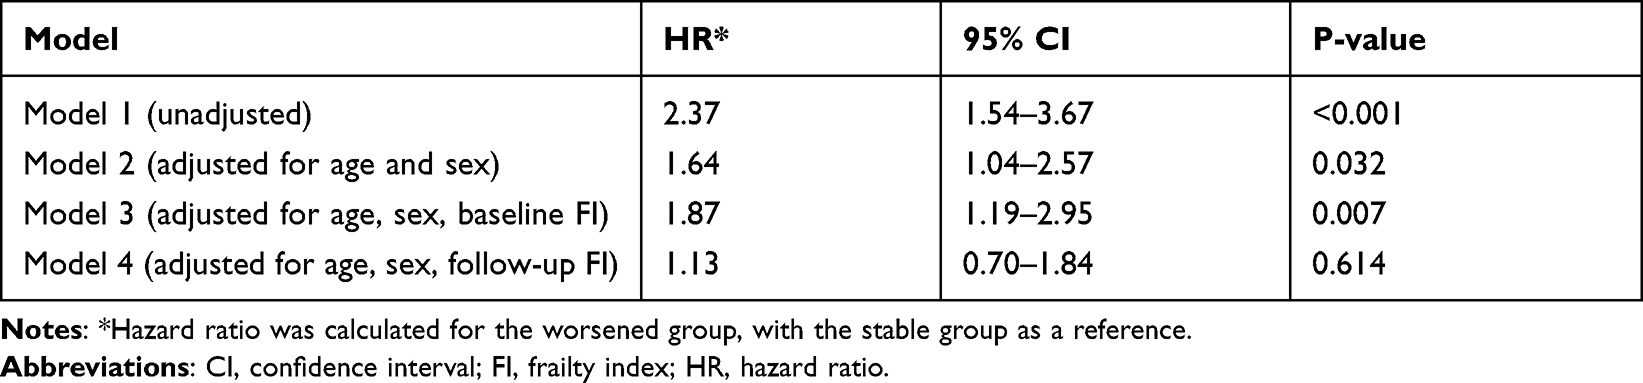 |
Table 2 Cox Proportional Hazard Analysis for the Risk of the Composite Outcome |
We divided the participants into four categories according to baseline FI, and 358 (37.6%), 299 (31.4%), 193 (20.3%), and 103 (10.8%) had a baseline FI of <0.1, 0.1–0.2, 0.2–0.3, and ≥0.3, respectively. Kaplan–Meier analysis showed that in each category, the worsened group had worse outcomes than the stable group (Log rank test P < 0.001, P = 0.052, 0.16, and 0.10, respectively; Figure 3A).
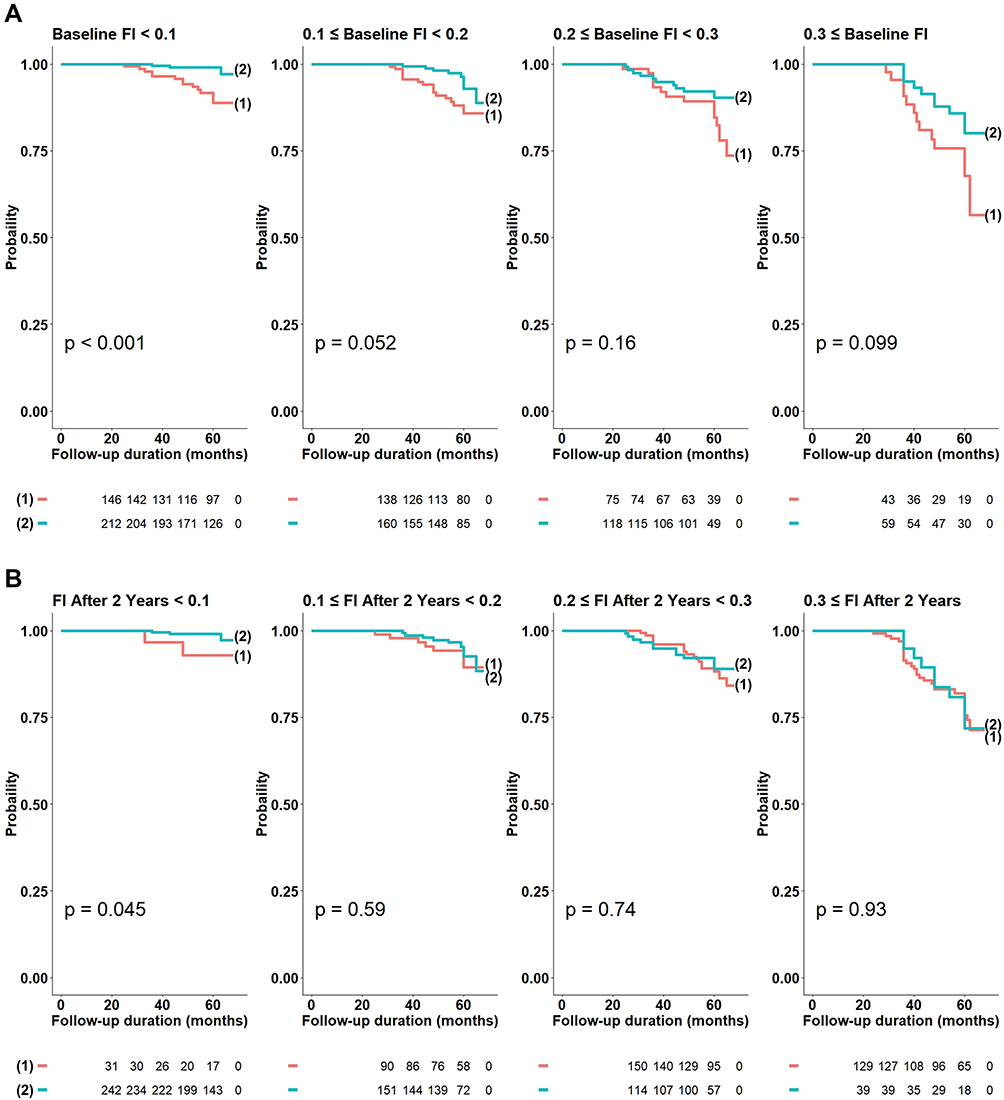 |
Figure 3 Kaplan–Meier curves for the probability of composite outcome-free survival stratified by baseline FI and follow-up FI (A) Worsened group (group 1) vs stable group (group 2) stratified by baseline FI.(B) Worsened group (group 1) vs stable group (group 2) stratified by follow-up FI at 2 years after baseline. Abbreviation: FI, frailty index. |
When we divided the participants based on the FI measured after 2 years, 273 (28.6%), 245 (25.7%), 267 (28.0%), and 168 (17.6%) had a FI of <0.1, 0.1–0.2, 0.2–0.3, and ≥0.3, respectively. In the analysis of participants whose FI after 2 years from baseline was 0.1–0.2, 0.2–0.3, ≥ 0.3, there was no significant association between the changes of FI ≥ 0.03 and the outcome (Log rank test p = 0.59, 0.74, and 0.93, respectively; Figure 3B), suggesting the importance of the up-to-date frailty status that combines both baseline FI and its changes over time in predicting outcome.
Changes in the Deficits by Four Major Domains of FI
The mean changes in the deficit of the FI in four major domains are shown in Figure 4 and Table S4. In groups FW, NW, FS, and NS, the mean changes in the ADL domain were 0.17, 0.11, −0.08 and −0.02, respectively. The mean changes in the deficit of the mobility domain were 0.17, 0.14, −0.10, and −0.03, respectively, and those of the cognitive function and mood domain were 0.13, 0.14, −0.07 and −0.02, respectively. The mean changes in the deficit of the comorbidity domain were 0.04, 0.05, 0.03 and 0.02, respectively. When groups FW and NW were compared, only the ADL domain showed a significant difference in the mean changes in the deficit (independent t-test P = 0.009).
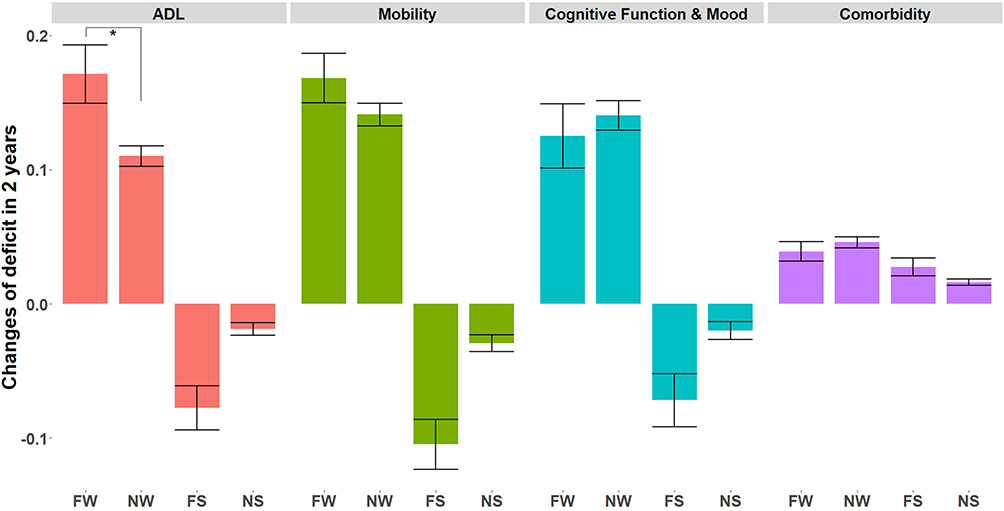 |
Figure 4 Changes of deficit in the four main domains of the frailty index. FW (frail at baseline and worsened) vs FS (frail at baseline and stable) vs NW (non-frail at baseline and worsened) vs NS (non-frail at baseline and stable). Note: Error bar represents the standard error of the mean. *p = 0.009 (see Table S4). |
Discussion
We identified an association between the worsening of FI of more than 0.03 during 2 years and an increased risk of mortality and institutionalization regardless of age, sex, and baseline FI. The prognostic impact of changes in FI was attenuated when adjusted by the FI measurement at 2 years after baseline. Changes in FI over 2 years were mainly driven by the geriatric functional domains of ADL, mobility, cognitive function and mood, rather than changes in the burden of comorbidity.
In our study, we stratified the participants according to the baseline FI and FI after 2 years. When stratified by baseline FI, participants with significantly increased FI had worse clinical outcomes than those in the other group; however, when individuals were stratified according to FI measured at 2 years from baseline, there were no significant differences in the incidence of composite outcome between the stable worsened groups. These findings underscore the prognostic importance of measuring FI at a time point encompassing individuals’ prior aging trajectories, including recent changes.
A recent study that analyzed 5672 adults over the age of 65 with data from the National Health in Aging Trends Study showed that increments in FI were associated with mortality among pre-frail (FI, 0.15–0.24) and frail (FI ≥ 0.25) individuals, but not among robust (FI < 0.15) individuals.38 Following this observation, we found that the aggravation of FI was associated with the composite outcome regardless of baseline FI. Worsening of FI adjusted by the baseline FI was related to mortality as well as the relationship between baseline FI and mortality. By further stratifying individuals according to FI after 2 years, we found that follow-up FI at 2 years after baseline was a better predictor of composite outcome than baseline FI.
Another study analyzing 909 individuals reported that the most recent FI was the dominant factor for predicting mortality among serial measurements of FI.39 Our results add to this argument by demonstrating that the most recent FI can reflect the past trajectory of FI because the survival curves of patients in the same group according to the most recent FI were similar regardless of changes in FI (i.e., worsened vs. stable, Figure 3B), which is consistent with a recent study.27 The survival outcomes were statistically different between the worsened and stable group among participants whose follow-up FI was <0.1. This difference may be attributed to incomplete matching of FI at 2 years after stratification. As we categorized individuals according to aggravation, the mean FI after 2 years was significantly higher in the worsened group than in the stable group (0.08 vs 0.05; P < 0.001; data not shown).
As far as we know, this is the first study to divide FI changes according to functional domains. Individuals who experienced worsening FI over 2 years had an increasing burden of deficits throughout different geriatric domains. Furthermore, ADL impairment from FI changes was significantly more prominent in individuals with higher baseline FI. This observation supports the concept of the accumulation of deficits, from chronic disease to the development of mobility impairments and subsequent development of care needs due to impaired ADL.25
This study has two main implications. Assessment of the risk of mortality and institutionalization is important to both clinicians and policymakers. This study highlights the prognostic value of repeated FI measurement in older adults in predicting the risk of mortality and institutionalization. Our results can guide the interpretation of FI at each time point. Furthermore, our observation suggests the potential value of enrolling vulnerable community-dwelling people in a well-designed, multicomponent geriatric intervention program that has shown efficacy in preventing composite outcome-free survival, as well as improving frailty status and physical performance.18,20,40
This study has a few limitations. Since the population excluded due to missing FI value at 2 years was frailer, had more disability and cognitive decline compared with the study population, the association between changes in FI and the composite outcome might have been underestimated. Additionally, objective measurements of physical performance were omitted in our analysis because we did not perform a physical performance battery test in the first year of the ASPRA cohort. The calculated values of FI and mobility domain analysis might have been affected. Lastly, our results may have limited generalizability because the data were gathered from a single cohort from a rural area of Korea. Adaptation in individuals who are institutionalized or living in urban areas may therefore be challenging. Our observation should be validated in independent populations for broader generalizability.
Conclusion
Progression of frailty over time was associated with mortality and institutionalization regardless of the baseline frailty status. The association was considerably reflected in the follow-up FI at 2 years from baseline. The increases in deficit were largely due to the worsening of geriatric functional domains, rather than the increment of comorbidity burden. Repeated assessment of the frailty status to delineate the aging trajectory may help clinicians and policymakers identify high-risk individuals and prepare for their functional decline.
Acknowledgments
We would like to thank all the participants of the ASPRA cohort. We are grateful to the public health professionals and nurses of the Pyeongchang County Hospital, Public Health Center, and Community Health Posts for their support. We also thank Joon Seo Lim, Ph.D. of the Science Publications Team at Asan Medical Center for his assistance in the preparation of this manuscript and Danielle A.L. Lee, MSc from the same institution, for her assistance in the review of the manuscript.
Author Contributions
All authors made a significant contribution to the work reported, whether that is in the conception, study design, execution, acquisition of data, analysis and interpretation, or in all these areas; took part in drafting, revising or critically reviewing the article; gave final approval of the version to be published; have agreed on the journal to which the article has been submitted; and agree to be accountable for all aspects of the work.
Funding
The Aging Study of Pyeongchang Rural Area was funded by the Pyeongchang Health Center, Pyeongchang County, Gangwon Province, South Korea. This study was also supported by a National Research Foundation of Korea (NRF) grant funded by the Ministry of Science and ICT (No. 2021R1A2C300580111) and the Korea Institute of Planning and Evaluation for Technology in Food, Agriculture and Forestry (IPET) through the high value-added food technology development program, funded by Ministry of Agriculture, Food and Rural Affairs (MAFRA) (321031031HD030).
Disclosure
Hee-Won Jung cofounded Dyphi Inc, a startup company developing sensor technologies on human movement and robotics. Otherwise, all authors declare that there are no potential conflicts of interest.
References
1. Clegg A, Young J, Iliffe S, Rikkert MO, Rockwood K. Frailty in elderly people. Lancet. 2013;381(9868):752–762. doi:10.1016/S0140-6736(12)62167-9
2. Morley JE. Frailty Fantasia. J Am Med Dir Assoc. 2017;18(10):813–815. doi:10.1016/j.jamda.2017.07.009
3. Fried LP, Tangen CM, Walston J, et al.; For cardiovascular health study collaborative research group. Frailty in older adults: evidence for a phenotype. J Gerontol A Biol Sci Med Sci. 2001;56(3):M146–156. doi:10.1093/gerona/56.3.M146
4. Hanlon P, Nicholl B, Jani B, Lee D, McQueenie R, Mair F. Frailty and pre-frailty in middle-aged and older adults and its association with multimorbidity and mortality: a prospective analysis of 493 737 UK Biobank participants. Lancet Public Health. 2018;3(7):e323–e332. doi:10.1016/S2468-2667(18)30091-4
5. Bandeen-Roche K, Seplaki CL, Huang J, et al. Frailty in older adults: a nationally representative profile in the United States. J Gerontol A Biol Sci Med Sci. 2015;70(11):1427–1434. doi:10.1093/gerona/glv133
6. Fried LP, Ferrucci L, Darer J, Williamson JD, Anderson G. Untangling the concepts of disability, frailty, and comorbidity: implications for improved targeting and care. J Gerontol A Biol Sci Med Sci. 2004;59(3):255–263. doi:10.1093/gerona/59.3.M255
7. Ji L, Jazwinski SM, Kim S. Frailty and biological age. Ann Geriatr Med Res. 2021;25(3):141–149. doi:10.4235/agmr.21.0080
8. Jung HW. Frailty as a clinically relevant measure of human aging. Ann Geriatr Med Res. 2021;25(3):139–140. doi:10.4235/agmr.21.0106
9. Jang IY, Jung HW, Lee HY, Park H, Lee E, Kim DH. Evaluation of clinically meaningful changes in measures of frailty. J Gerontol A Biol Sci Med Sci. 2020;75(6):1143–1147. doi:10.1093/gerona/glaa003
10. Kojima G, Taniguchi Y, Iliffe S, Jivraj S, Walters K. Transitions between frailty states among community-dwelling older people: a systematic review and meta-analysis. Ageing Res Rev. 2019;50:81–88. doi:10.1016/j.arr.2019.01.010
11. Tang H, Zhu H, Sun Q, Qin H, Wang S. Transitions in the cognitive frailty states in community-living older adults: a 6-year prospective cohort study. Front Aging Neurosci. 2021;13:774268. doi:10.3389/fnagi.2021.774268
12. Oh E, Moon S, Hong GS. Longitudinal changes in frailty prevalence and related factors in older adults living in long-term care facilities. J Adv Nurs. 2020;76(7):1679–1690. doi:10.1111/jan.14388
13. Lunney JR, Lynn J, Foley DJ, Lipson S, Guralnik JM. Patterns of functional decline at the end of life. JAMA. 2003;289(18):2387–2392. doi:10.1001/jama.289.18.2387
14. Mitnitski A, Song X, Rockwood K. Assessing biological aging: the origin of deficit accumulation. Biogerontology. 2013;14(6):709–717. doi:10.1007/s10522-013-9446-3
15. Howlett SE, Rutenberg AD, Rockwood K. The degree of frailty as a translational measure of health in aging. Nat Aging. 2021;1(8):651–665. doi:10.1038/s43587-021-00099-3
16. Tchkonia T, Zhu Y, van Deursen J, Campisi J, Kirkland JL. Cellular senescence and the senescent secretory phenotype: therapeutic opportunities. J Clin Invest. 2013;123(3):966–972. doi:10.1172/JCI64098
17. Fried LP, Cohen AA, Xue Q-L, Walston J, Bandeen-Roche K, Varadhan R. The physical frailty syndrome as a transition from homeostatic symphony to cacophony. Nat Aging. 2021;1(1):36–46. doi:10.1038/s43587-020-00017-z
18. Oh G, Lee H, Park CM, et al. Long-term effect of a 24-week multicomponent intervention on physical performance and frailty in community-dwelling older adults. Age Ageing. 2021;50(6):2157–2166. doi:10.1093/ageing/afab149
19. Baek JY, Lee E, Oh G, et al. The Aging Study of Pyeongchang Rural Area (ASPRA): findings and perspectives for human aging, frailty, and disability. Ann Geriatr Med Res. 2021;25(3):160–169. doi:10.4235/agmr.21.0100
20. Park CM, Oh G, Lee H, et al. Multicomponent intervention and long-term disability in older adults: a nonrandomized prospective study. J Am Geriatr Soc. 2021;69(3):669–677. doi:10.1111/jgs.16926
21. Rockwood K, Mitnitski A. Frailty in relation to the accumulation of deficits. J Gerontol A Biol Sci Med Sci. 2007;62(7):722–727. doi:10.1093/gerona/62.7.722
22. Kojima G, Iliffe S, Walters K. Frailty index as a predictor of mortality: a systematic review and meta-analysis. Age Ageing. 2018;47(2):193–200. doi:10.1093/ageing/afx162
23. Dallmeier D, Braisch U, Rapp K, et al.; For actife study group. Frailty index and sex-specific 6-year mortality in community-dwelling older people: the ActiFE study. J Gerontol A Biol Sci Med Sci. 2020;75(2):366–373. doi:10.1093/gerona/glz051
24. Fan J, Yu C, Guo Y, et al. Frailty index and all-cause and cause-specific mortality in Chinese adults: a prospective cohort study. Lancet Public Health. 2020;5(12):e650–e660. doi:10.1016/S2468-2667(20)30113-4
25. Rockwood K, Song X, MacKnight C, et al. A global clinical measure of fitness and frailty in elderly people. CMAJ. 2005;173(5):489–495. doi:10.1503/cmaj.050051
26. Stolz E, Hoogendijk EO, Mayerl H, Freidl W. Frailty changes predict mortality in 4 longitudinal studies of aging. J Gerontol A Biol Sci Med Sci. 2021;76(9):1619–1626. doi:10.1093/gerona/glaa266
27. Bai G, Szwajda A, Wang Y, et al. Frailty trajectories in three longitudinal studies of aging: is the level or the rate of change more predictive of mortality? Age Ageing. 2021;50(6):2174–2182. doi:10.1093/ageing/afab106
28. Jung HW, Jang IY, Lee YS, et al. Prevalence of frailty and aging-related health conditions in older Koreans in rural communities: a cross-sectional analysis of the aging study of Pyeongchang rural area. J Korean Med Sci. 2016;31(3):345–352. doi:10.3346/jkms.2016.31.3.345
29. Searle SD, Mitnitski A, Gahbauer EA, Gill TM, Rockwood K. A standard procedure for creating a frailty index. BMC Geriatr. 2008;8(1):24. doi:10.1186/1471-2318-8-24
30. Jung HW, Baek JY, Jang IY, et al. Short physical performance battery as a crosswalk between frailty phenotype and deficit accumulation frailty index. J Gerontol A Biol Sci Med Sci. 2021;76(12):2249–2255. doi:10.1093/gerona/glab087
31. Mitnitski AB, Mogilner AJ, Rockwood K. Accumulation of deficits as a proxy measure of aging. Sci World J. 2001;1:321027. doi:10.1100/tsw.2001.58
32. Song X, Mitnitski A, Rockwood K. Prevalence and 10-year outcomes of frailty in older adults in relation to deficit accumulation. J Am Geriatr Soc. 2010;58(4):681–687. doi:10.1111/j.1532-5415.2010.02764.x
33. Gordon EH, Reid N, Khetani IS, Hubbard RE. How frail is frail? A systematic scoping review and synthesis of high impact studies. BMC Geriatr. 2021;21(1):719. doi:10.1186/s12877-021-02671-3
34. Won CW, Yang KY, Rho YG, et al. [The development of Korean Activities of Daily Living (K-ADL) and Korean Instrumental Activities of Daily Living (K-IADL) scale]. J Korean Geriatr Soc. 2002;6(2):107–120. Korean
35. Park JH, Kim KW. [A review of the epidemiology of depression in Korea]. J Korean Med Assoc. 2011;54(4):362–369. Korean. doi:10.5124/jkma.2011.54.4.362
36. Kang Y, Na DL, Hahn S. [A validity study on the Korean Mini-Mental State Examination (K-MMSE) in dementia patients]. J Korean Neurol Assoc. 1997;15:300–308. Korean.
37. Won CW, Lee Y, Lee S, Kim M. Development of Korean Frailty Index for Primary Care (KFI-PC) and its criterion validity. Ann Geriatr Med Res. 2020;24(2):125–138. doi:10.4235/agmr.20.0021
38. Shi SM, Olivieri-Mui B, McCarthy EP, Kim DH. Changes in a frailty index and association with mortality. J Am Geriatr Soc. 2021;69(4):1057–1062. doi:10.1111/jgs.17002
39. Thompson MQ, Theou O, Tucker GR, Adams RJ, Visvanathan R. Recurrent measurement of frailty is important for mortality prediction: findings from the North West Adelaide health study. J Am Geriatr Soc. 2019;67(11):2311–2317. doi:10.1111/jgs.16066
40. Dent E, Martin FC, Bergman H, Woo J, Romero-Ortuno R, Walston JD. Management of frailty: opportunities, challenges, and future directions. Lancet. 2019;394(10206):1376–1386. doi:10.1016/S0140-6736(19)31785-4
 © 2022 The Author(s). This work is published and licensed by Dove Medical Press Limited. The
full terms of this license are available at https://www.dovepress.com/terms
and incorporate the Creative Commons Attribution
- Non Commercial (unported, 3.0) License.
By accessing the work you hereby accept the Terms. Non-commercial uses of the work are permitted
without any further permission from Dove Medical Press Limited, provided the work is properly
attributed. For permission for commercial use of this work, please see paragraphs 4.2 and 5 of our Terms.
© 2022 The Author(s). This work is published and licensed by Dove Medical Press Limited. The
full terms of this license are available at https://www.dovepress.com/terms
and incorporate the Creative Commons Attribution
- Non Commercial (unported, 3.0) License.
By accessing the work you hereby accept the Terms. Non-commercial uses of the work are permitted
without any further permission from Dove Medical Press Limited, provided the work is properly
attributed. For permission for commercial use of this work, please see paragraphs 4.2 and 5 of our Terms.