Back to Journals » Diabetes, Metabolic Syndrome and Obesity » Volume 13
Association Between Blood Glucose Within 24 Hours After Intensive Care Unit Admission and Prognosis: A Retrospective Cohort Study
Authors Li L, Chen Q, Chen Q ![]() , Wu R, Wang S, Yao C
, Wu R, Wang S, Yao C
Received 17 February 2020
Accepted for publication 28 March 2020
Published 23 April 2020 Volume 2020:13 Pages 1305—1315
DOI https://doi.org/10.2147/DMSO.S250133
Checked for plagiarism Yes
Review by Single anonymous peer review
Peer reviewer comments 2
Editor who approved publication: Dr Konstantinos Tziomalos
Lingling Li,1,2,* Qinchang Chen,1,* Qingui Chen,3 Ridong Wu,1 Shenming Wang,1 Chen Yao1
1Department of Vascular Surgery, The First Affiliated Hospital, Sun Yat-sen University, Guangzhou, People’s Republic of China; 2Zhongshan School of Medicine, Sun Yat-sen University, Guangzhou, People’s Republic of China; 3Department of Medical Intensive Care Unit, The First Affiliated Hospital, Sun Yat-sen University, Guangzhou, People’s Republic of China
*These authors contributed equally to this work
Correspondence: Shenming Wang; Chen Yao
Department of Vascular Surgery, The First Affiliated Hospital, Sun Yat-sen University, No. 58 Zhongshan Road 2, Guangzhou, People’s Republic of China
Email [email protected]; [email protected]
Purpose: The aim of this study was to evaluate the association between blood glucose within 24 hours after intensive care unit (ICU) admission and prognosis.
Patients and Methods: A retrospective cohort study was conducted using data from a large critical care database. Patients who had a length of ICU stay ≥ 24 hours and at least two blood glucose records within 24 hours after ICU admission were included and hospital mortality was chosen as the primary outcome. The average, minimum, and maximum blood glucose within 24 hours after ICU admission were a priori selected as exposures and associations between each exposure and outcomes were assessed after adjusted for potential confounders.
Results: A total of 14,237 patients were included finally with an average age of 62.9± 17.7 years and a mean SAPS II on admission of 34 (26– 44). Among the study population, 20.2% (2872/14,237) had uncomplicated diabetes, and 6.7% (953/14,237) had complicated diabetes. Lowest hospital mortality rate was observed in the stratum with an average blood glucose ranged 110– 140 mg/dL, a minimum blood glucose ranged 80– 110 mg/dL, and a maximum blood glucose ranged 110– 140 mg/dL. After adjusted for confounders including age, sex, disease severity scores and comorbidities, an average blood glucose ranged 110– 140 mg/dL, a minimum blood glucose ranged 80– 110 mg/dL, and a maximum blood glucose ranged 110– 140 mg/dL were associated with the lowest risk of hospital mortality. Consistent results were found among patients without diabetes in the subgroup analyses stratified by diabetes.
Conclusion: A range of 110– 140 mg/dL for average and maximum blood glucose and a range of 80– 110 mg/dL for minimum blood glucose within 24 hours after ICU admission predicted better prognosis especially among patients without diabetes.
Keywords: blood glucose, critical care, mortality, retrospective studies
Introduction
Hyperglycemia is rather common among patients in intensive care unit (ICU), the prevalence of which ranged from about 40% to nearly 100% based on some previous reports,1–4 although the exact number is not known and may vary according to different study populations and different definitions of hyperglycemia. The mechanisms of hyperglycemia developed in critically ill patients are also not well understood, which are supposed to be complex and may be related to pre-existing diabetes (either previously diagnosed or not) and stress hyperglycemia due to increased counterregulatory hormones.5,6 Hyperglycemia was once considered an adaptive response essential for survival and therefore not routinely controlled,7 but numerous observational studies have provided evidences which supported a link between hyperglycemia and poor prognosis of critically ill patients.2,8–15 Now it is well accepted that glycemic control plays an important role in the management of patients in ICU,16 but it is still controversial what the optimal blood glucose range is.17,18 Evidences from several clinical trials which investigated various ranges of blood glucose in various populations of ICU patients supported different target blood glucose, and are sometimes contrary.19–21 Considering that clinical trials usually only include study populations under specific and strict criteria, of which the characteristics may be quite different to the general population, and that the clinical practice and patient characteristics in ICU are usually highly heterogeneous, evidences from real-world clinical data might provide some clues for trials which aim at determining or validating the ideal target of glycemic control,22–24 although it is obvious that what the ideal target of glycemic control could only be answered by clinical trials. Given current available observational studies had either limited sample sizes10 or specific indications,12,14 the study used data from a large critical care database and focused on mixed ICU patients, aiming to evaluate the association between blood glucose within 24 hours after ICU admission and prognosis.
Methods
Study Population
The study used data from the Medical Information Mart for Intensive Care III (MIMIC-III) database, which encompassed a large de-identified population of ICU patients admitted to the Beth Israel Deaconess Medical Center between 2001 and 2012.25 The access to the database was approved by the institutional review boards of both Beth Israel Deaconess Medical Center and Massachusetts Institute of Technology Affiliates after completing the required training course. Informed consent was waived since only anonymous data were used. Patients in the database were included if they met the following inclusion criteria: 1) at least one ICU admission during the hospitalization; 2) at least 2 blood glucose records within 24 hours after ICU admission; 3) only the first hospital admission if there were more than 1 hospital admission in the database; 4) aged ≥18 years; 5) length of first ICU stay ≥24 hours. Records with potential typographical errors were excluded, including a length of ICU or hospitalization stay less than 0, and the ICU admission or discharge time earlier than the time of death (Figure 1).
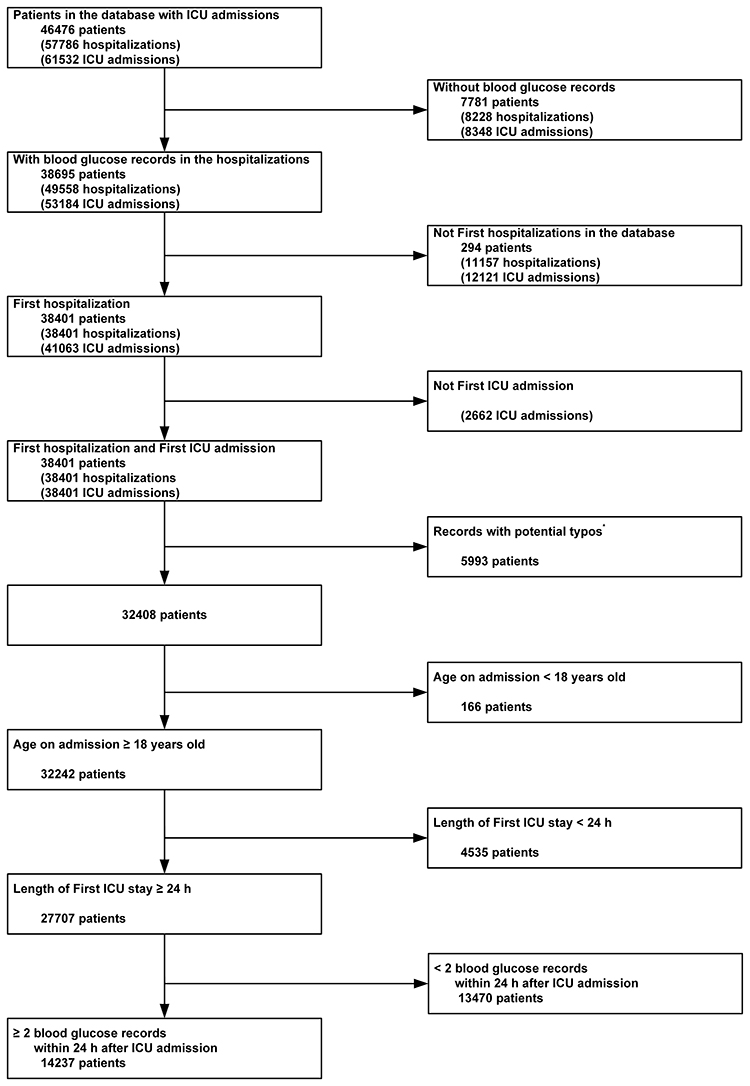 |
Figure 1 Flow chart of the study population. Notes: Records with potential typographical errors were excluded, including a length of ICU or hospitalization stay less than 0, and the ICU admission or discharge time earlier than the time of death.Abbreviation: ICU, intensive care unit. |
Variables Extraction
Structured query language and codes from the MIMIC Code Repository (https://github.com/MIT-LCP/mimic-code)26 were used to extract data from the database, including age, sex, ethnicity, type of admission, Simplified Acute Physiology Score II (SAPS II)27 on admission, mechanical ventilation on first day, renal replacement therapy on first day, Elixhauser Comorbidity Index (SID30),28 and specific comorbidities. For patients who were older than 89 years, the database shifted the date of birth to exactly 300 years before to obscure their ages, and these records were corrected (by minus 300 and plus 89) before analysis.
Exposures
Blood glucose records were extracted according to Logical Observation Identifiers Names and Codes (LOINC) 2345–7. The average, minimum, and maximum blood glucose within 24 hours after ICU admission were a priori selected as exposures. Blood glucose levels were also a priori categorized as <60, 60–80, 80–110, 110–140, 140–180, 180–200, and ≥200 mg/dL.
Outcomes
Hospital mortality, ICU mortality, and 28-day mortality were studied as outcomes, among which hospital mortality was chosen as the primary outcome. For patients with multiple ICU admissions during the hospitalization, ICU mortality and lengths of ICU stay only referred to the first ICU hospitalization.
Statistical Analysis
Data were expressed as mean ± standard deviation, median (25th–75th percentiles), or counts (percentages). Associations between each exposure and outcomes were assessed using multivariable logistic regression or Cox regression adjusted for age, sex, ethnicity, type of admission, SAPS II on admission, mechanical ventilation on first day, renal replacement therapy on first day, and Elixhauser Comorbidity Index (SID30). Subgroup analyses stratified by diabetes were also conducted after the adjustment. P values less than 0.05 were considered to indicate statistical significance. IBM SPSS Statistics for Windows, version 25.0 (IBM Corp., Armonk, NY, USA) was used for statistical analyses. The forest plots were plotted out using R package “ggforestplot”.
Results
Baseline Characteristics of the Study Population
14,237 patients were included finally with an average age of 62.9±17.7 years and a mean SAPS II on admission of 34 (26–44). Among the study population, 55.7% (7925/14,237) were male, 20.2% (2872/14,237) had uncomplicated diabetes, and 6.7% (953/14,237) had complicated diabetes, 46.4% (6600/14,237) needed mechanical ventilation on the first day after ICU admission, and 3.5% (500/14,237) needed renal replacement therapy on the first day after ICU admission (Table 1).
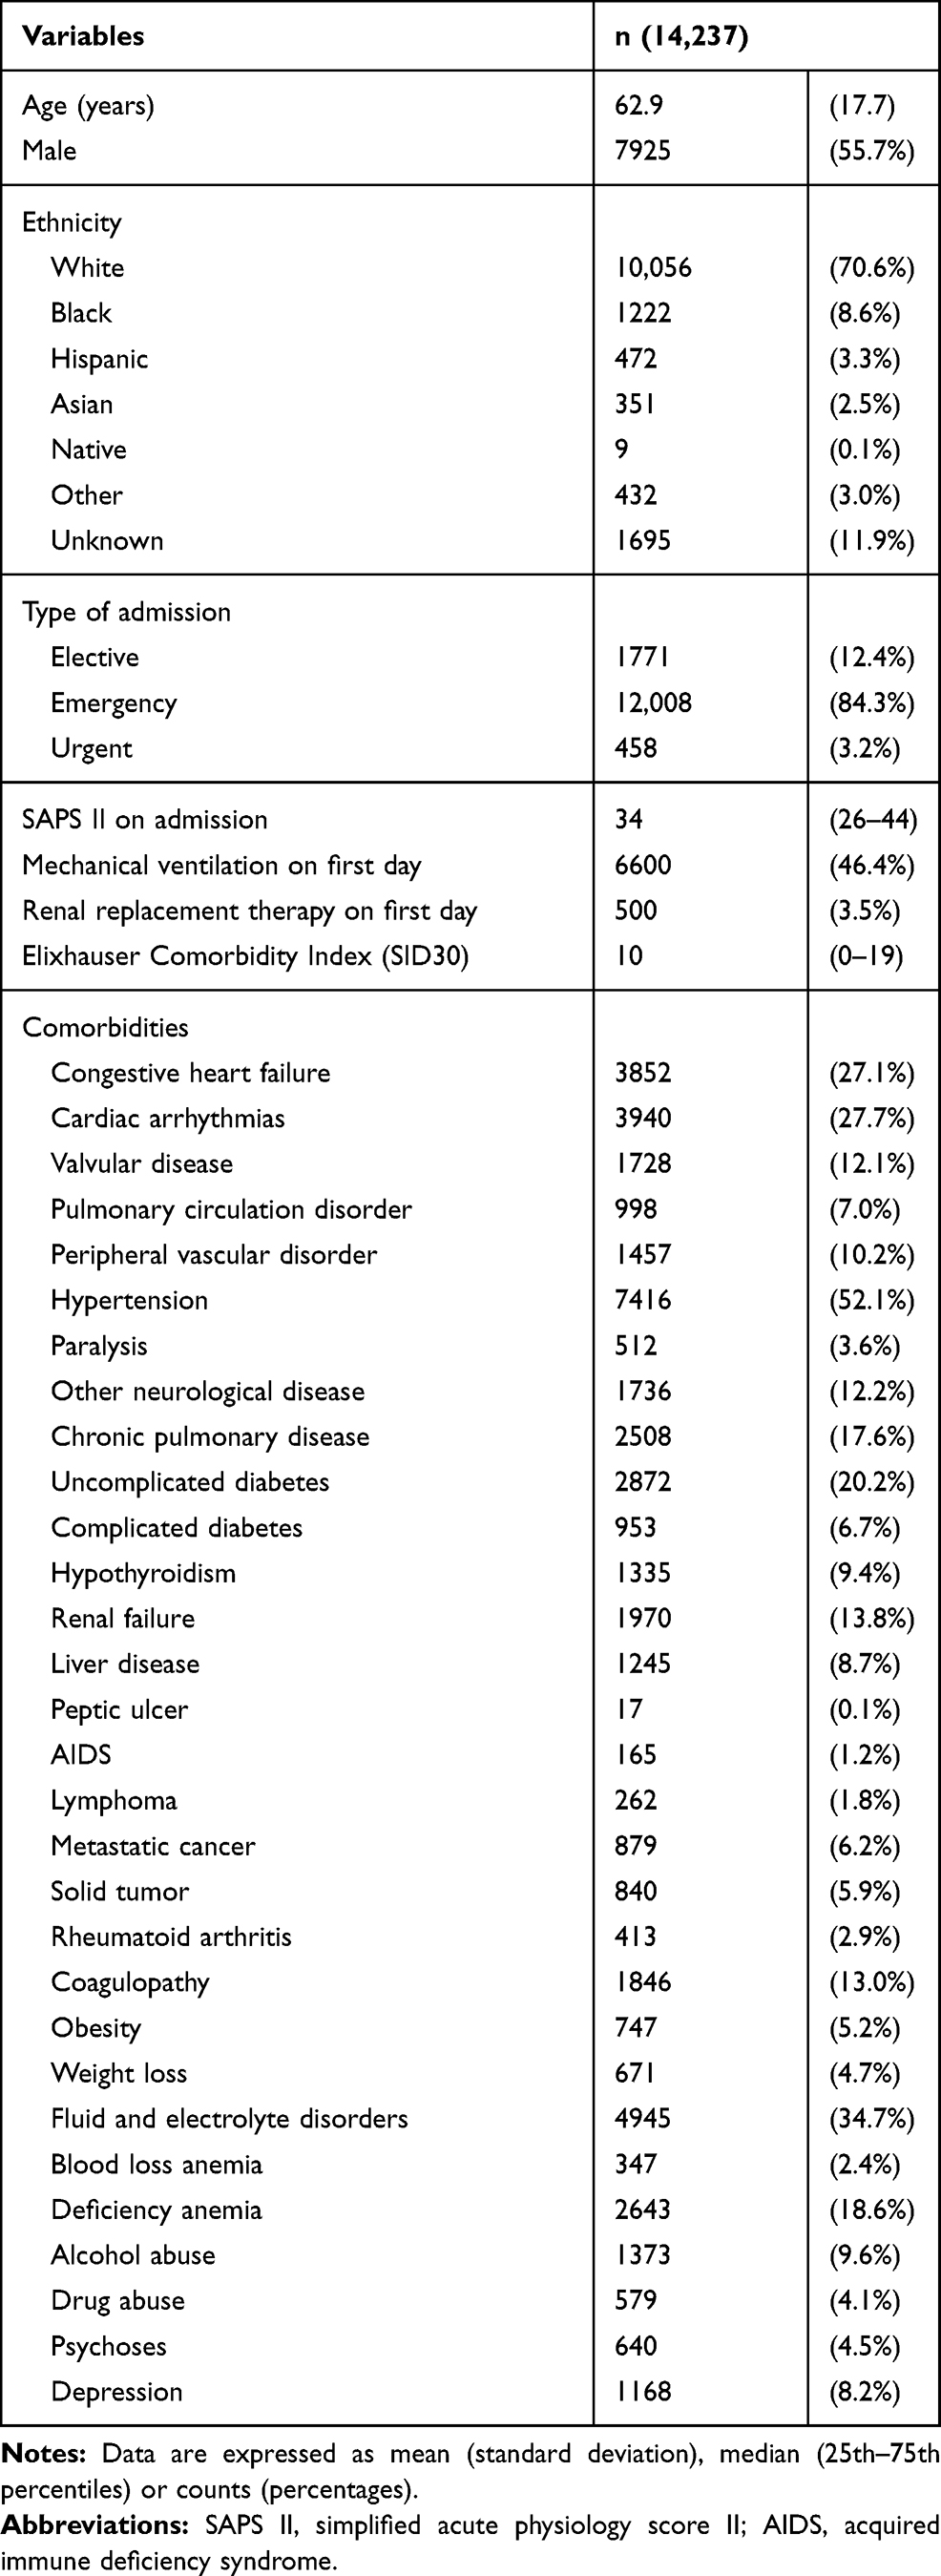 |
Table 1 Baseline Characteristics of the Study Population |
Clinical Outcomes Stratified by Blood Glucose Levels
For average blood glucose and maximum blood glucose, the stratum ranged 110–140 mg/dL had the lowest hospital mortality rate (4.6% and 4.4%, respectively). However, the lowest hospital mortality rate was observed in the stratum with minimum blood glucose ranged 80–110 mg/dL (4.5%), followed by a level ranged 110–140 mg/dL (5.1%). Results of ICU mortality, 28-day mortality, and lengths of ICU or hospital stay were presented in Tables 2 and 3.
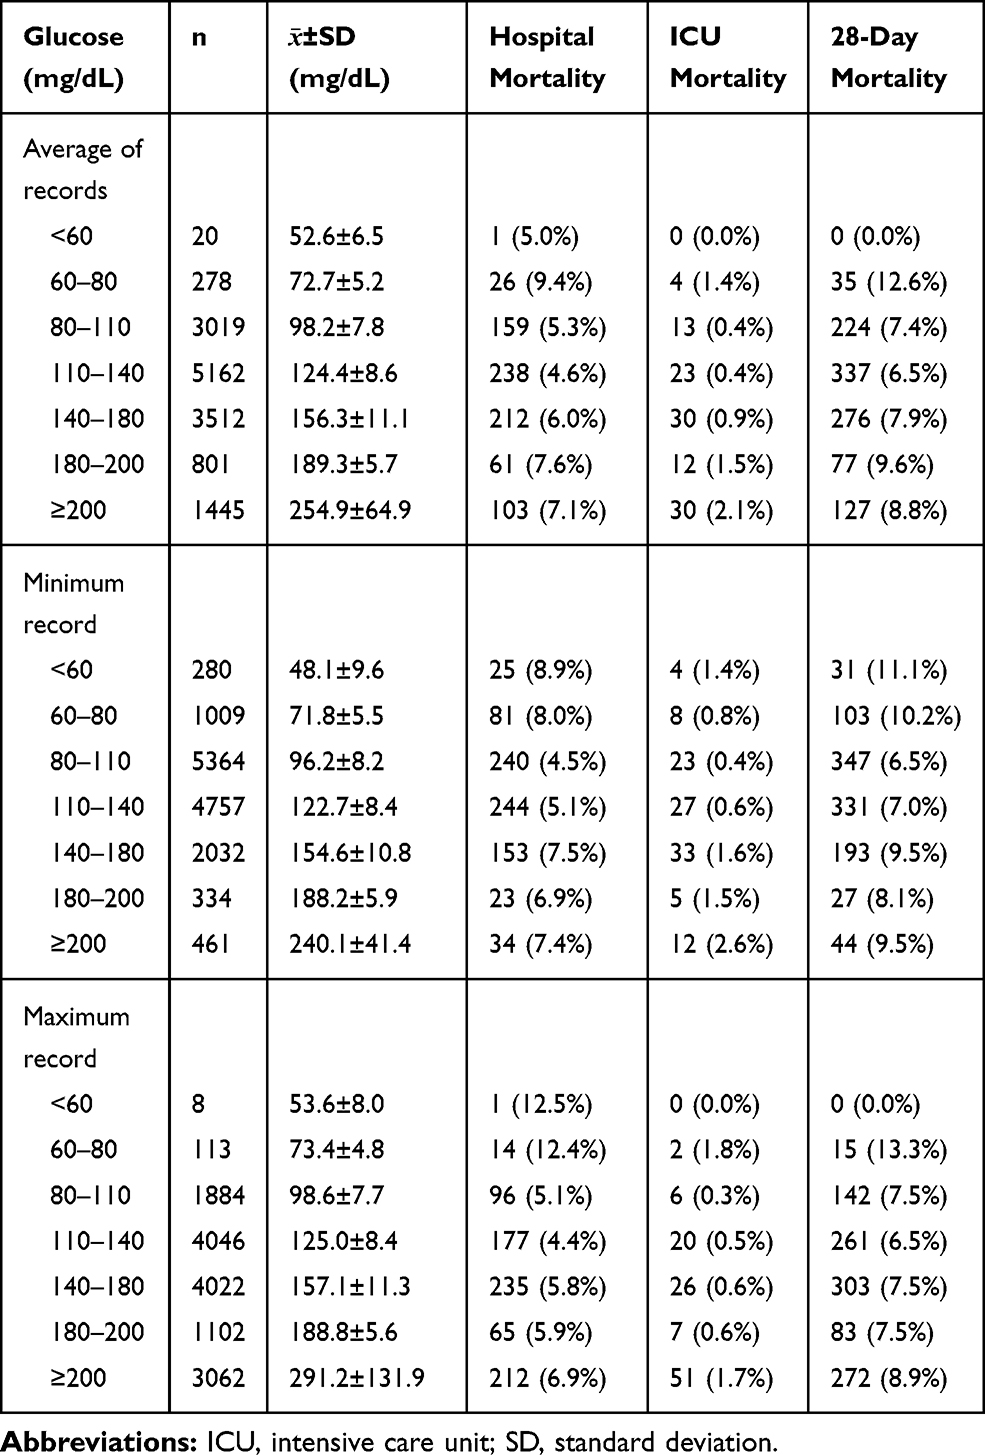 |
Table 2 Clinical Outcomes of the Study Population Stratified by Blood Glucose Levels Within 24 Hours After ICU Admission |
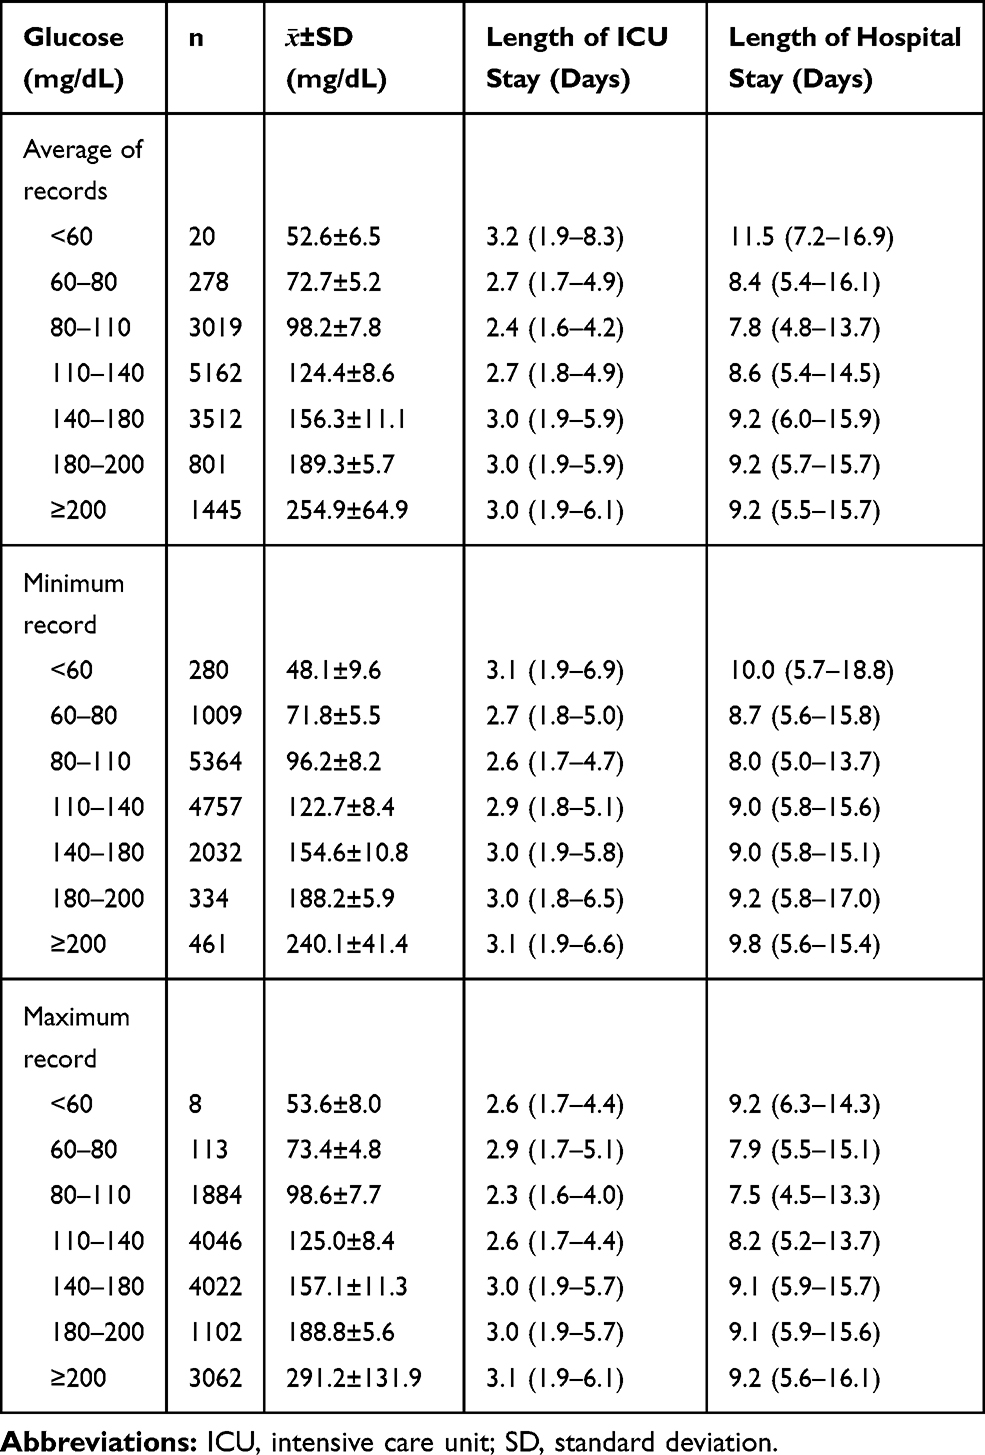 |
Table 3 Lengths of ICU/Hospital Stay of the Study Population Stratified by Blood Glucose Levels Within 24 Hours After ICU Admission |
Associations Between Blood Glucose Levels and Clinical Outcomes
When the stratum of blood glucose ranged 110–140 mg/dL was taken as the reference and after adjusted for confounders including age, sex, disease severity scores and comorbidities, an average blood glucose ranged 110–140 mg/dL and a maximum blood glucose ranged 110–140 mg/dL were both associated with the lowest risk of hospital mortality (Figures 2 and 3). However, a minimum blood glucose ranged 80–110 mg/dL was associated with a lower risk of hospital mortality [odds ratio (OR) 0.82, 95% confidence interval (CI) 0.67–0.99] compared to the reference stratum (110–140 mg/dL), while the other strata were still associated with higher risks of hospital mortality (OR >1) (Figure 4).
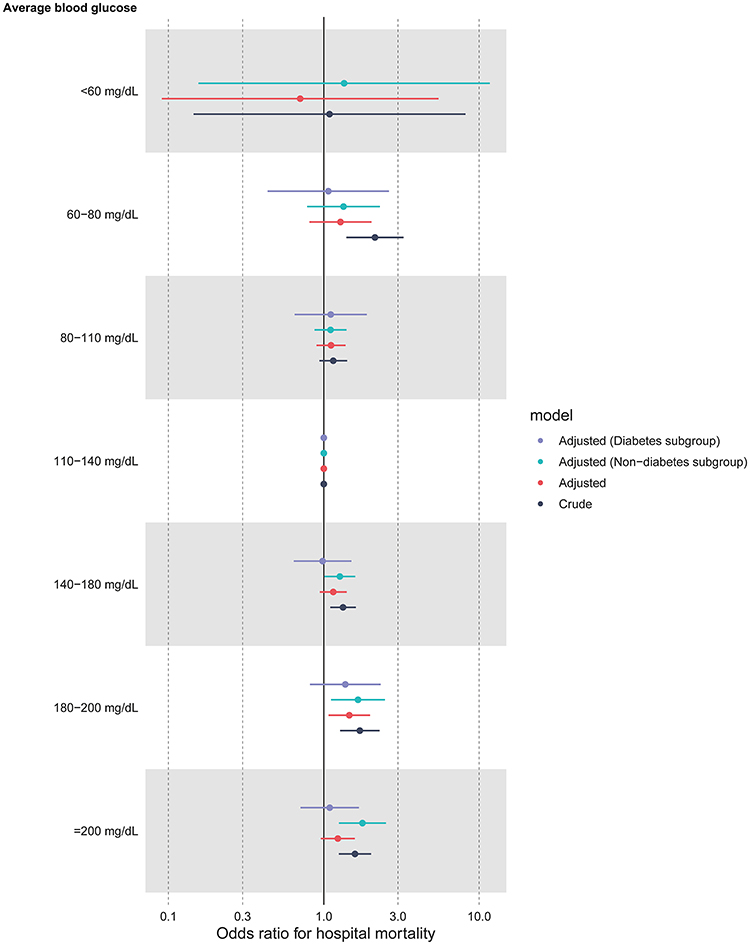 |
Figure 2 Associations between average blood glucose levels within 24 hours after ICU admission and hospital mortality. Notes: Adjusted for age, sex, ethnicity, type of admission, SAPS II on admission, mechanical ventilation on first day, renal replacement therapy on first day, and Elixhauser Comorbidity Index (SID30). |
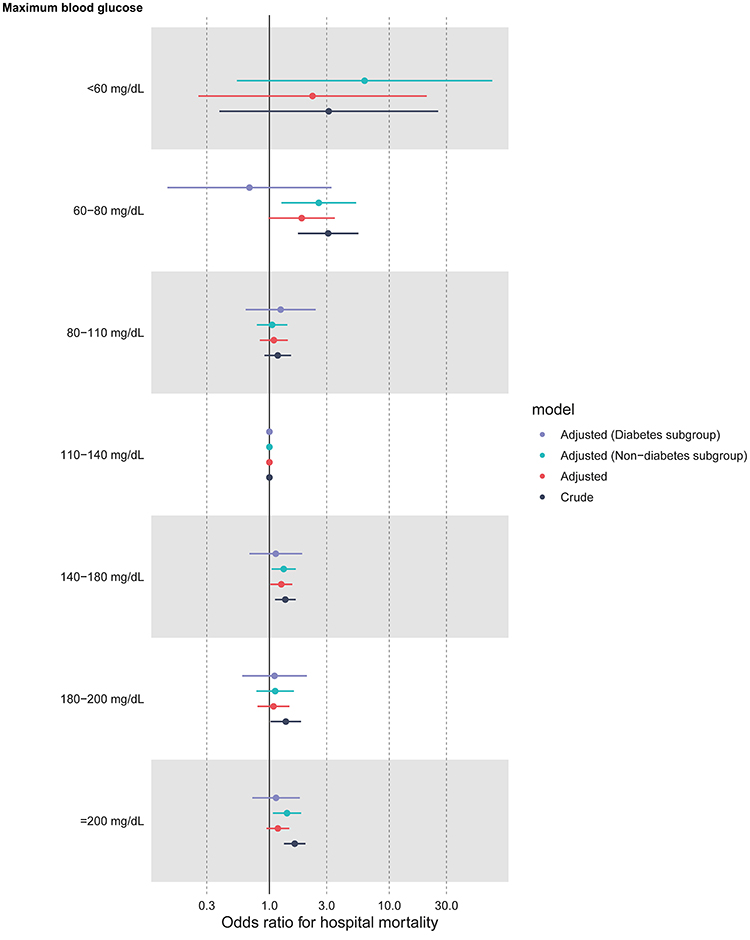 |
Figure 3 Associations between maximum blood glucose levels within 24 hours after ICU admission and hospital mortality. Notes: Adjusted for age, sex, ethnicity, type of admission, SAPS II on admission, mechanical ventilation on first day, renal replacement therapy on first day, and Elixhauser Comorbidity Index (SID30). |
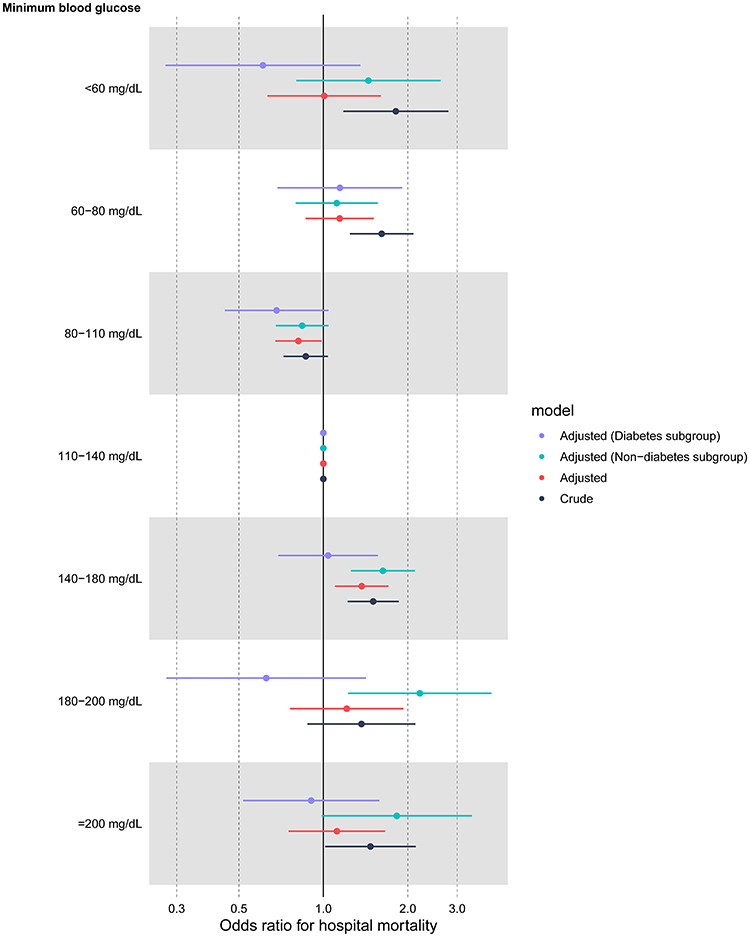 |
Figure 4 Associations between minimum blood glucose levels within 24 hours after ICU admission and hospital mortality. Notes: Adjusted for age, sex, ethnicity, type of admission, SAPS II on admission, mechanical ventilation on first day, renal replacement therapy on first day, and Elixhauser Comorbidity Index (SID30). |
In the subgroup analyses stratified by diabetes, consistent results were found among patients without diabetes, but for patients with diabetes, an average blood glucose ranged 140–180 mg/dL was associated with a lower risk of hospital mortality (OR 0.98, 95% CI 0.64–1.51) compared to the reference stratum (110–140 mg/dL). Detailed estimations for each stratum together with associations with ICU mortality and 28-day mortality are presented in Tables 4–6.
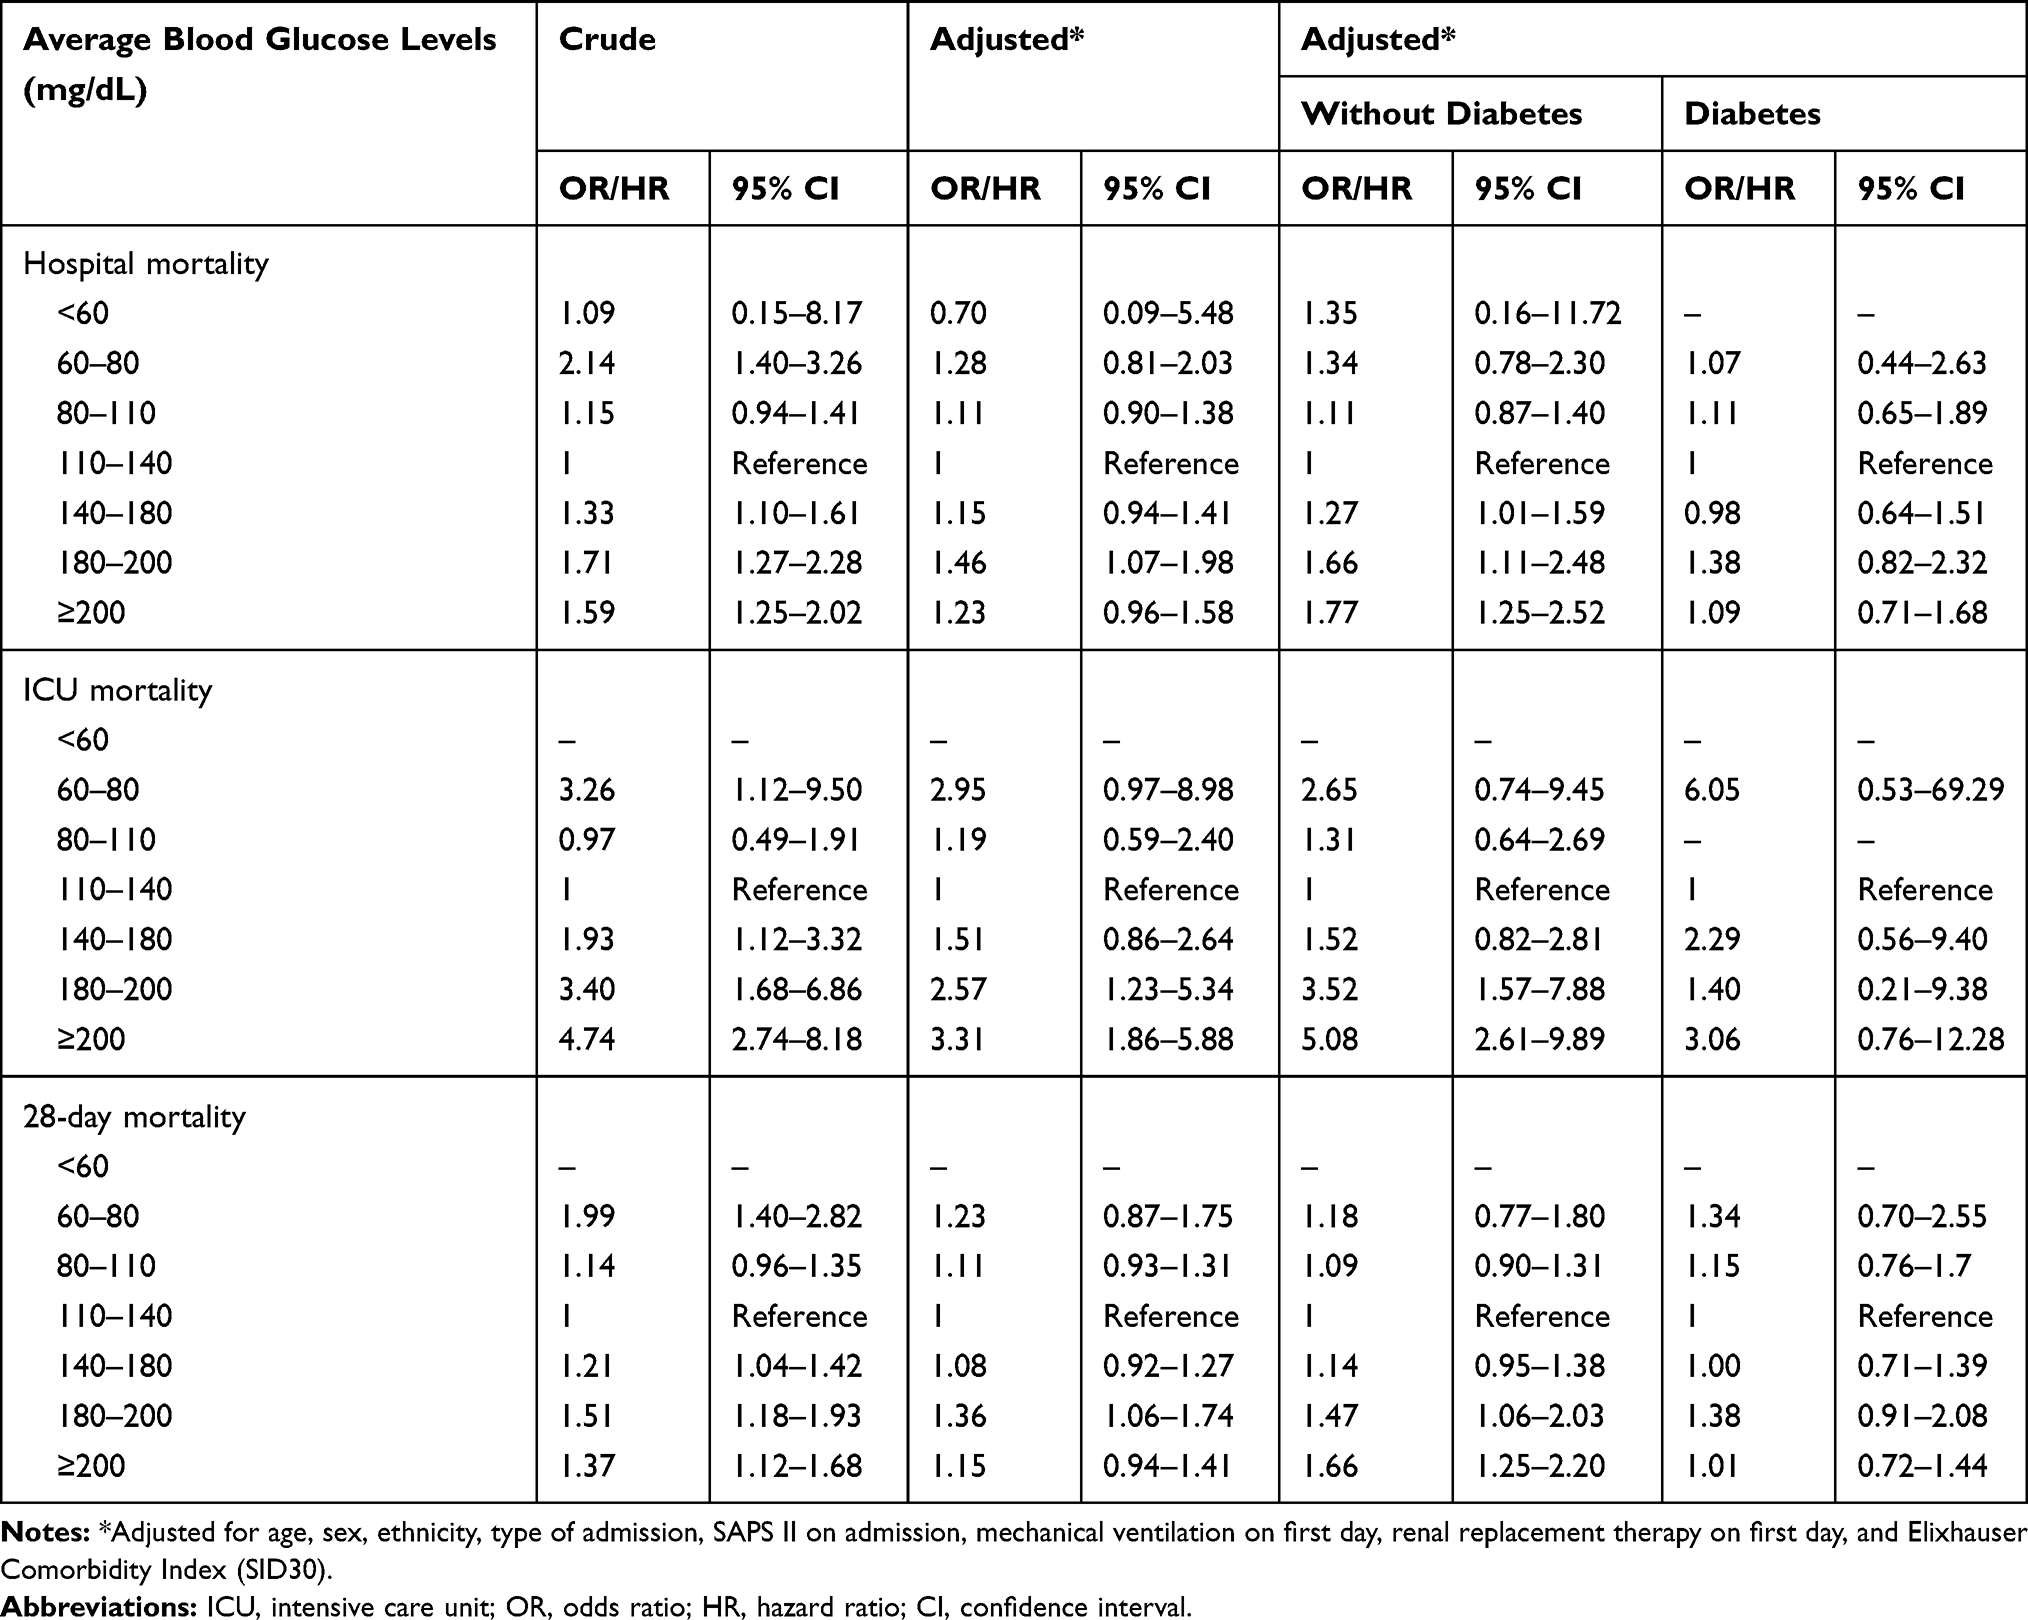 |
Table 4 Associations Between Average Blood Glucose Levels Within 24 Hours After ICU Admission and Clinical Outcomes |
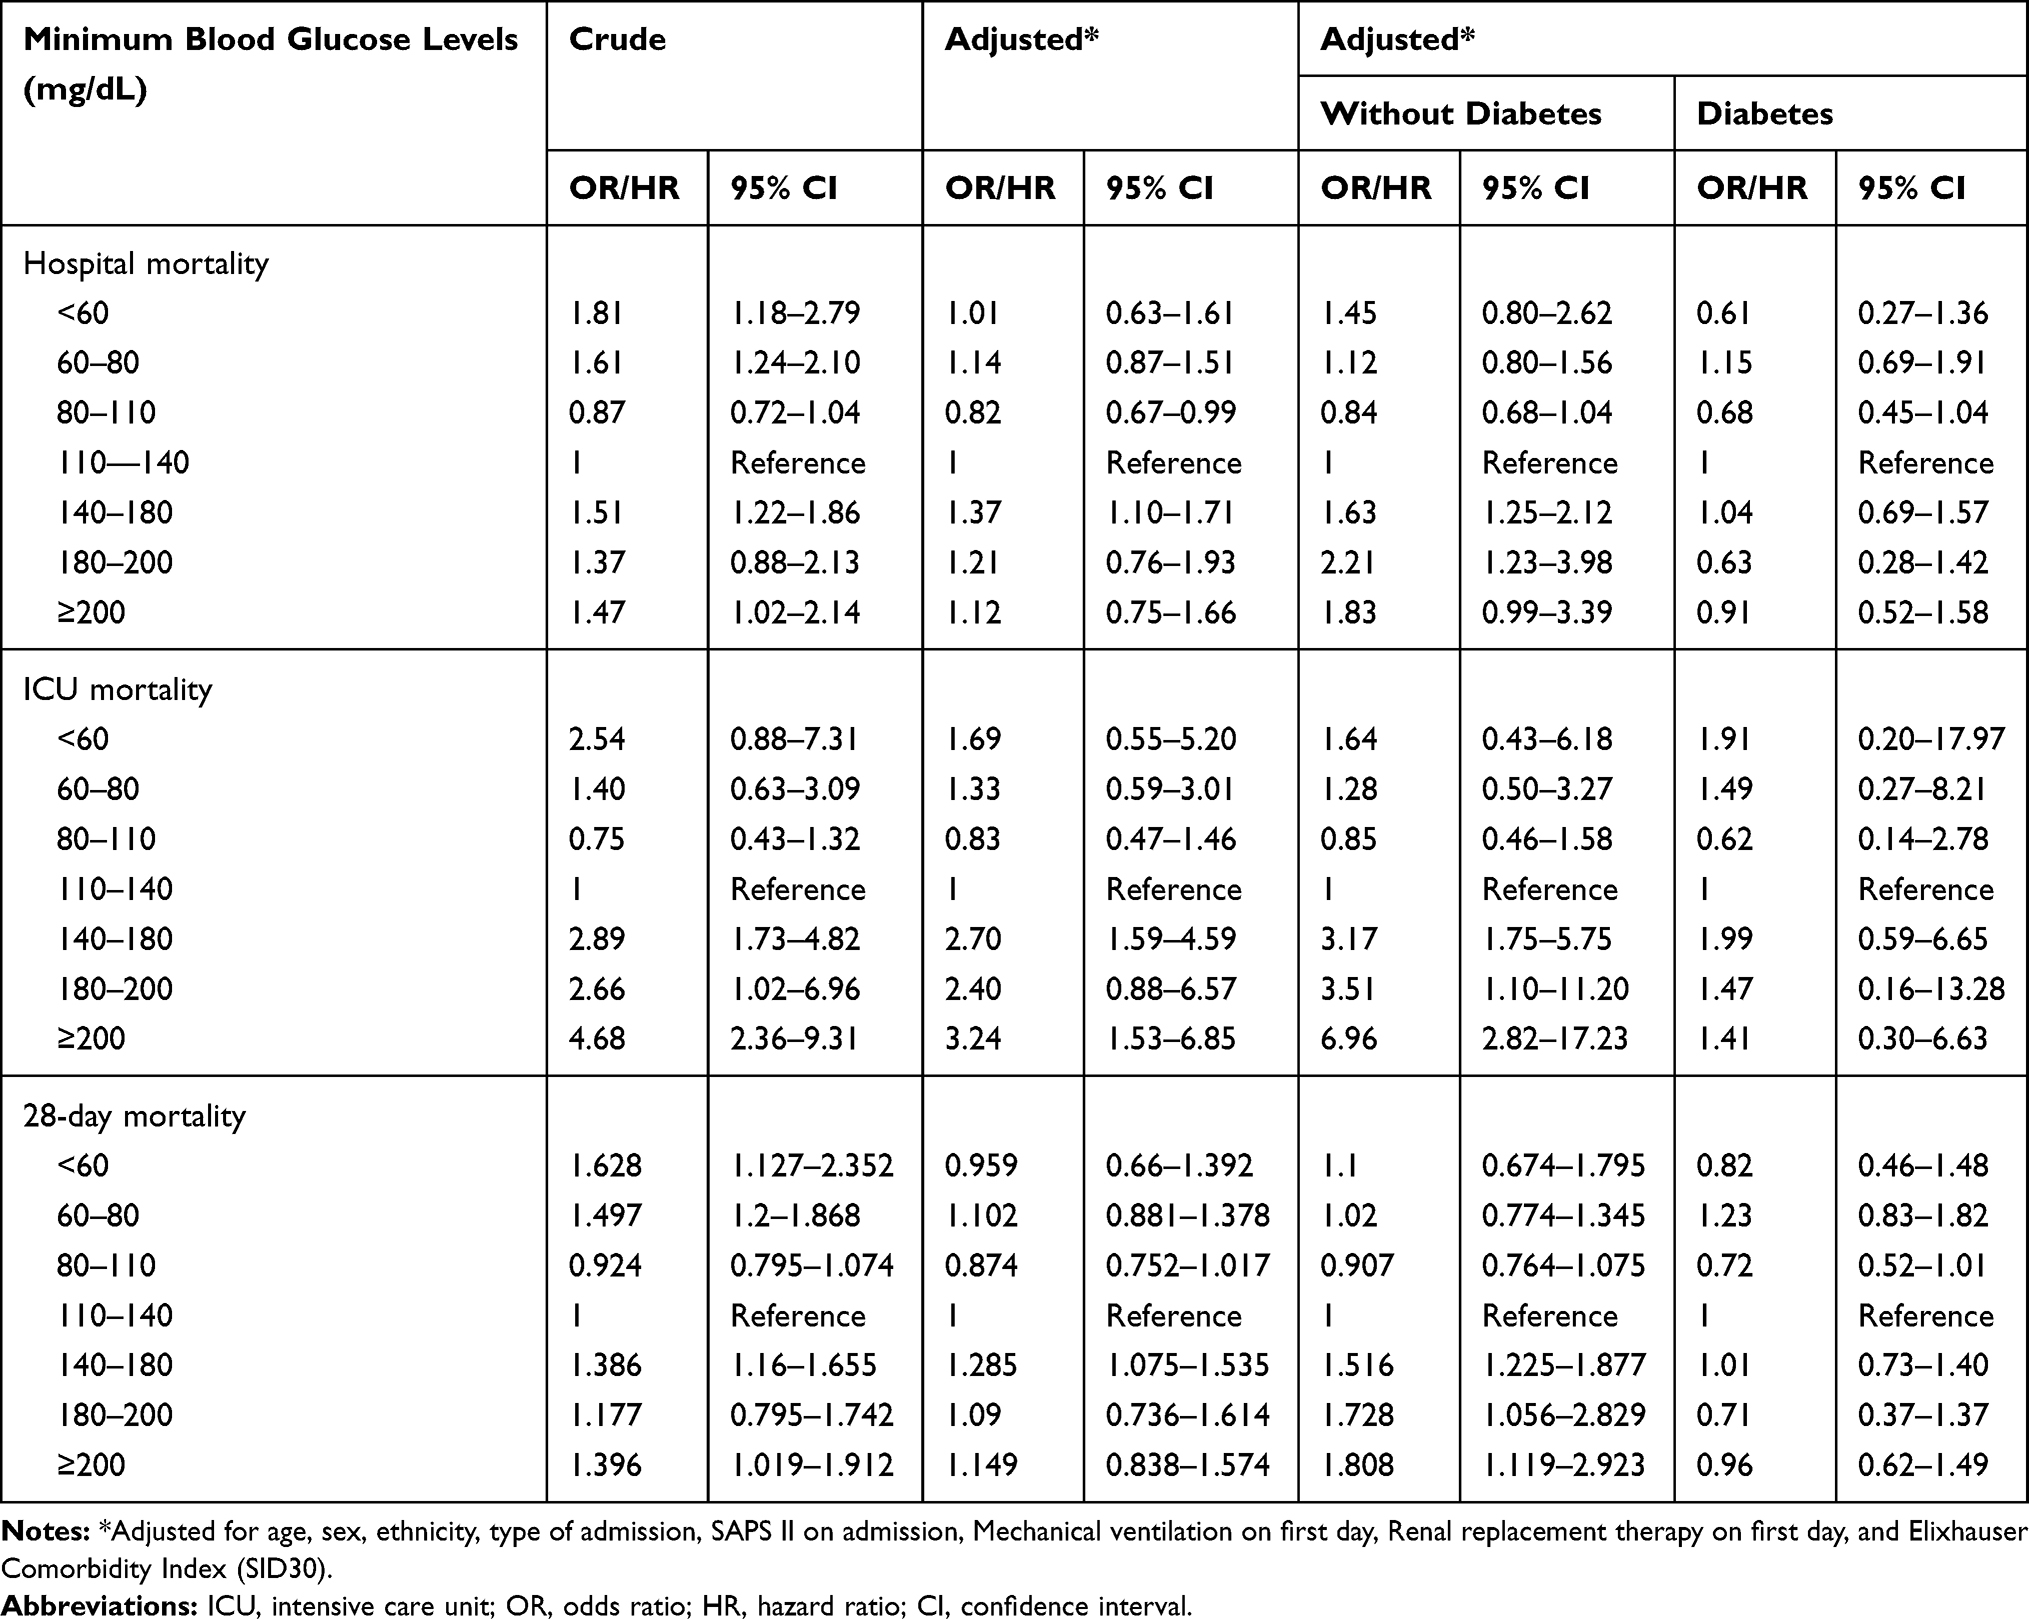 |
Table 5 Associations Between Minimum Blood Glucose Levels Within 24 Hours After ICU Admission and Clinical Outcomes |
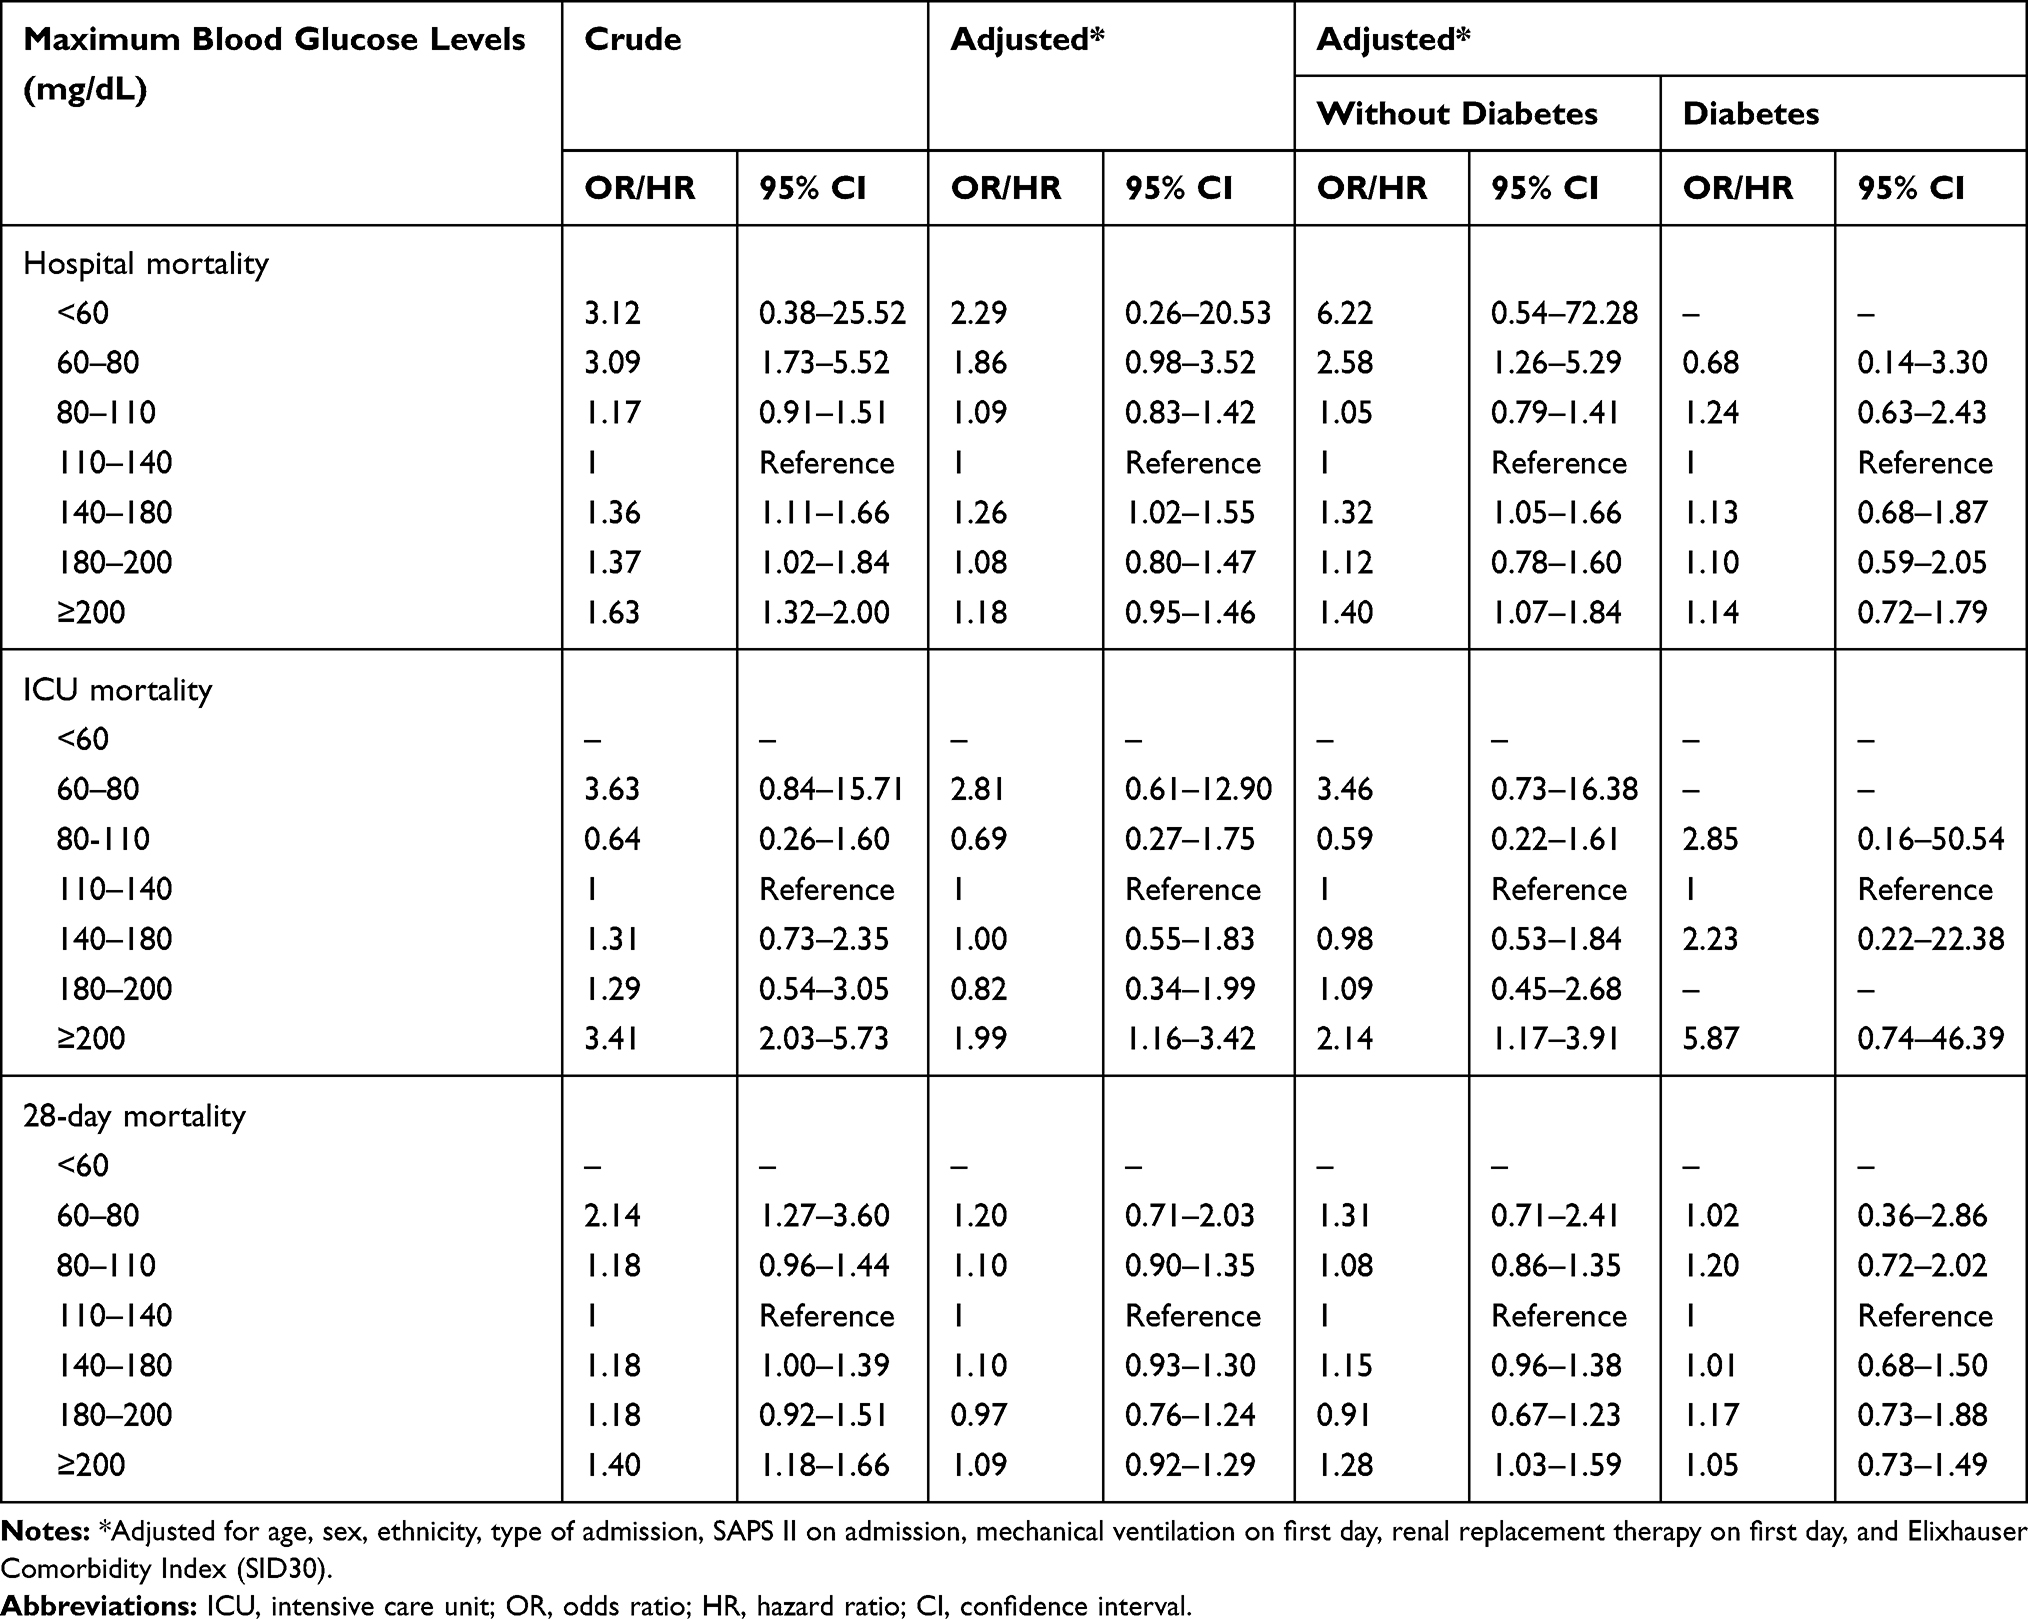 |
Table 6 Associations Between Maximum Blood Glucose Levels Within 24 Hours After ICU Admission and Clinical Outcomes |
Discussion
The study investigated the associations of blood glucose levels within 24 hours after ICU admission with various clinical outcomes using data from a large critical care database, in which about 14,000 mixed ICU patients were included and several potential confounders were adjusted including a disease severity score and a comorbidity score. Results of the study mainly indicated that an average blood glucose ranged 110–140 mg/dL within 24 hours after ICU admission was associated with better prognosis when compared with other ranges, and the association was solid among patients without diabetes.
Although there were already several observational studies available which investigated a similar association, results of our study will be a fair supplement to the evidence about the association between blood glucose levels and prognosis of ICU patients. Compared with other observational studies, our study had some different characteristics. Unlike some studies which only focused on patients with trauma or brain injury,8,10,11,13–15 the study investigated a mixed population of ICU patients and a model including a comorbidity score was employed to adjust for potential confounders. Therefore, results of the study may be seen as an average evaluation of the associations. When compared with observational studies that looked at general population of critically ill patients, the analysis methods and the results of our study were not exactly the same. Krinsley2 retrospectively analyzed data of 1826 mixed ICU patients and compared the mean and maximum glucose between survivors and non-survivors, concluding that patients with a mean glucose ranged 80–99 mg/dL had the lowest hospital mortality; however, our study supported an average glucose ranged 110–140 mg/dL associated with better prognosis, but it should be aware that our study used a different analysis strategy. Instead of treating blood glucose as a continuous variable, in the study it was a priori categorized as <60, 60–80, 80–110, 110–140, 140–180, 180–200, and ≥200 mg/dL; another difference was that only blood glucose records within 24 hours after ICU admission were taken into consideration. The reason why these strata were used was that most of these strata were investigated in various clinical trials.4,21 Lanspa et al12 used a wider range (70–139 mg/dL) as the target and found that the time in targeted blood glucose >80% was associated with reduced mortality especially in nondiabetic patients. To some extent, this conclusion was consistent with our study, since in our study the stratum ranged 110–140 mg/dL and 80–110 mg/dL had the first and second lowest OR for hospital mortality compared with other strata especially in patients without diabetes, but interpreting results of our study should be cautious since only blood glucose within 24 hours after ICU admission was looked at, which might be more related to the illness itself, or put it in other words, might be merely a marker of illness severity. We also evaluated the associations of blood glucose with other clinical outcomes including ICU mortality and 28-day mortality, and results were similar. Although there were also a few clinical trials which investigated the similar association,19–21 results of our study could not be directly compared to them, because the clinical trials were designed and conducted to determine the optimal target of glucose control, while the study aimed to evaluate the association between blood glucose within 24 hours after ICU admission and prognosis.
One more thing that needs to discuss is about the interpretation of the results. As presented in Tables 4–6, there were quite a lot of borderline confidence intervals of the associations between blood glucose levels and clinical outcomes. Although from a statistical point of view the confidence interval of a significant association should not include 1, most of these borderline results suggested a poorer prognosis compared with the reference stratum since they were toward an odds ratio or hazard ratio greater than 1.29
There are some potential limitations of the study. As a retrospective design, variables such as blood glucose levels before hospital admission were unavailable. The average of blood glucose might be affected by the number of blood glucose measurements, which was not taken into consideration in the study. Therapy for controlling blood glucose was also not considered, but since only blood glucose in the first 24 hours after ICU admission was studied, it may be not that important. However, based on the design of the study, it should be award that results of the study should not be seen as an evidence that support a blood glucose ranged 110–140 mg/dL (or 80–140 mg/dL) as the optimal target of glucose control for ICU patients. Due to the concern about limited sample sizes in some blood glucose strata, reasons for ICU admission were also not taken into consideration. In addition, the study did not research other clinical outcomes such as hypoglycemia or nosocomial infection which might be important in clinical practice. The potential association between variability of blood glucose and prognosis might be also an interesting point to explore in further studies.
Conclusion
A range of 110–140 mg/dL for average and maximum blood glucose and a range of 80–110 mg/dL for minimum blood glucose within 24 hours after ICU admission predicted better prognosis especially among patients without diabetes. Further studies especially randomized controlled trials are needed to explore whether this range could be an optimal target for blood glucose control in the early stage after ICU admission.
Abbreviations
ICU, intensive care unit; MIMIC-III, Medical Information Mart for Intensive Care III; SAPS II, Simplified Acute Physiology Score II; LOINC, Logical Observation Identifiers Names and Codes; OR, odds ratio; CI, confidence interval; AIDS, acquired immune deficiency syndrome; SD, standard deviation; HR, hazard ratio.
Funding
This work was supported by the National Natural Science Funds for Young Scholars of China (81800416) and Guangzhou Major Program of the Industry-University-Research Collaborative Innovation (201508020116).
Disclosure
The authors report no conflicts of interest in this work.
References
1. Kosiborod M, Inzucchi SE, Spertus JA, et al. Elevated admission glucose and mortality in elderly patients hospitalized with heart failure. Circulation. 2009;119:1899–1907. doi:10.1161/CIRCULATIONAHA.108.821843
2. Krinsley JS. Association between hyperglycemia and increased hospital mortality in a heterogeneous population of critically ill patients. Mayo Clin Proc. 2003;78:1471–1478. doi:10.4065/78.12.1471
3. Schmeltz LR, DeSantis AJ, Thiyagarajan V, et al. Reduction of surgical mortality and morbidity in diabetic patients undergoing cardiac surgery with a combined intravenous and subcutaneous insulin glucose management strategy. Diabetes Care. 2007;30:823–828. doi:10.2337/dc06-2184
4. van den Berghe G, Wouters P, Weekers F, et al. Intensive insulin therapy in critically ill patients. N Engl J Med. 2001;345:1359–1367. doi:10.1056/NEJMoa011300
5. Dungan KM, Braithwaite SS, Preiser JC. Stress hyperglycaemia. Lancet (London, England). 2009;373:1798–1807. doi:10.1016/S0140-6736(09)60553-5
6. Farrokhi F, Smiley D, Umpierrez GE. Glycemic control in non-diabetic critically ill patients. Best Pract Res Clin Endocrinol Metab. 2011;25:813–824. doi:10.1016/j.beem.2011.05.004
7. Chinsky K. The evolving paradigm of hyperglycemia and critical illness. Chest. 2004;126:674–676. doi:10.1378/chest.126.3.674
8. Bochicchio GV, Sung J, Joshi M, et al. Persistent hyperglycemia is predictive of outcome in critically ill trauma patients. J Trauma. 2005;58:921–924. doi:10.1097/01.ta.0000162141.26392.07
9. Falciglia M, Freyberg RW, Almenoff PL, D’Alessio DA, Render ML.Hyperglycemia-related mortality in critically ill patients varies with admission diagnosis. Crit Care Med.2009;37:3001–3009. doi:10.1097/CCM.0b013e3181b083f7
10. Jeremitsky E, Omert LA, Dunham CM, Wilberger J, Rodriguez A. The impact of hyperglycemia on patients with severe brain injury. J Trauma. 2005;58:47–50. doi:10.1097/01.ta.0000135158.42242.b1
11. Laird AM, Miller PR, Kilgo PD, Meredith JW, Chang MC. Relationship of early hyperglycemia to mortality in trauma patients. J Trauma. 2004;56:1058–1062. doi:10.1097/01.ta.0000123267.39011.9f
12. Lanspa MJ, Krinsley JS, Hersh AM, et al. Percentage of time in range 70 to 139 mg/dl is associated with reduced mortality among critically ill patients receiving IV Insulin infusion. Chest. 2019;156:878–886. doi:10.1016/j.chest.2019.05.016
13. Rovlias A, Kotsou S. The influence of hyperglycemia on neurological outcome in patients with severe head injury. Neurosurgery. 2000;46:
14. Sung J, Bochicchio GV, Joshi M, Bochicchio K, Tracy K, Scalea TM.Admission hyperglycemia is predictive of outcome in critically ill trauma patients. J Trauma.2005;59:80–83. doi:10.1097/01.TA.0000171452.96585.84
15. Yendamuri S, Fulda GJ, Tinkoff GH.Admission hyperglycemia as a prognostic indicator in trauma. J Trauma.2003;55:33–38. doi:10.1097/01.TA.0000074434.39928.72
16. Fahy BG, Sheehy AM, Coursin DB. Glucose control in the intensive care unit. Crit Care Med. 2009;37:1769–1776. doi:10.1097/CCM.0b013e3181a19ceb
17. Qaseem A, Humphrey LL, Chou R, Snow V, Shekelle P, Clinical Guidelines Committee of the American College of P. Use of intensive insulin therapy for the management of glycemic control in hospitalized patients: a clinical practice guideline from the American College of Physicians. Ann Intern Med. 2011;154:260–267. doi:10.7326/0003-4819-154-4-201102150-00007.
18. Chase JG, Desaive T, Bohe J, et al. Improving glycemic control in critically ill patients: personalized care to mimic the endocrine pancreas. Crit Care. 2018;22:182. doi:10.1186/s13054-018-2110-1
19. Brunkhorst FM, Engel C, Bloos F, et al. Intensive insulin therapy and pentastarch resuscitation in severe sepsis. N Engl J Med. 2008;358:125–139. doi:10.1056/NEJMoa070716
20. Finfer S, Chittock DR, Su SY, et al. Intensive versus conventional glucose control in critically ill patients. N Engl J Med. 2009;360:1283–1297. doi:10.1056/NEJMoa0810625
21. Preiser JC, Devos P, Ruiz-Santana S, et al. A prospective randomised multi-centre controlled trial on tight glucose control by intensive insulin therapy in adult intensive care units: the Glucontrol study. Intensive Care Med. 2009;35:1738–1748. doi:10.1007/s00134-009-1585-2
22. Cohen AT, Goto S, Schreiber K, Torp-Pedersen C. Why do we need observational studies of everyday patients in the real-life setting? Eur Heart Jl Suppl. 2015;17:D2–D8. doi:10.1093/eurheartj/suv035
23. Celi LA, Mark RG, Stone DJ, Montgomery RA. Big data” in the intensive care unit. Closing the data loop. Am J Respir Crit Care Med. 2013;187:1157–1160. doi:10.1164/rccm.201212-2311ED
24. Blonde L, Khunti K, Harris SB, Meizinger C, Skolnik NS. Interpretation and impact of real-world clinical data for the practicing clinician. Adv Ther. 2018;35:1763–1774. doi:10.1007/s12325-018-0805-y
25. Johnson AE, Pollard TJ, Shen L, et al. MIMIC-III, a freely accessible critical care database. Sci Data. 2016;3:160035. doi:10.1038/sdata.2016.35
26. Johnson AE, Stone DJ, Celi LA, Pollard TJ. The MIMIC code repository: enabling reproducibility in critical care research. J Am Med Inform Assoc. 2018;25:32–39. doi:10.1093/jamia/ocx084
27. Le Gall JR, Lemeshow S, Saulnier F. A new Simplified Acute Physiology Score (SAPS II) based on a European/North American multicenter study. JAMA. 1993;270:2957–2963. doi:10.1001/jama.270.24.2957
28. Thompson NR, Fan Y, Dalton JE, et al. A new elixhauser-based comorbidity summary measure to predict in-hospital mortality. Med Care. 2015;53:374–379. doi:10.1097/MLR.0000000000000326
29. Hackshaw A, Kirkwood A. Interpreting and reporting clinical trials with results of borderline significance. BMJ. 2011;343:d3340. doi:10.1136/bmj.d3340
 © 2020 The Author(s). This work is published and licensed by Dove Medical Press Limited. The
full terms of this license are available at https://www.dovepress.com/terms
and incorporate the Creative Commons Attribution
- Non Commercial (unported, 3.0) License.
By accessing the work you hereby accept the Terms. Non-commercial uses of the work are permitted
without any further permission from Dove Medical Press Limited, provided the work is properly
attributed. For permission for commercial use of this work, please see paragraphs 4.2 and 5 of our Terms.
© 2020 The Author(s). This work is published and licensed by Dove Medical Press Limited. The
full terms of this license are available at https://www.dovepress.com/terms
and incorporate the Creative Commons Attribution
- Non Commercial (unported, 3.0) License.
By accessing the work you hereby accept the Terms. Non-commercial uses of the work are permitted
without any further permission from Dove Medical Press Limited, provided the work is properly
attributed. For permission for commercial use of this work, please see paragraphs 4.2 and 5 of our Terms.