")
Back to Journals » Diabetes, Metabolic Syndrome and Obesity » Volume 9
Assessment of vitamin D levels in newly diagnosed children with type 1 diabetes mellitus comparing two methods of measurement: a facility's experience in the Middle Eastern country of Bahrain
Authors Al-Haddad F, Rajab M, Al-Qallaf S, Musiager A, Hart K
Received 29 July 2015
Accepted for publication 8 September 2015
Published 25 January 2016 Volume 2016:9 Pages 11—16
DOI https://doi.org/10.2147/DMSO.S93355
Checked for plagiarism Yes
Review by Single anonymous peer review
Peer reviewer comments 3
Editor who approved publication: Professor Ming-Hui Zou
Fatima Ahmed Al-Haddad,1 Mansoor H Rajab,2 S Mahmood Al-Qallaf,3 Abdulrahman O Musaiger,4 Kathryn H Hart5
1Dietetic Unit for Hospitals, 2Pediatric Endocrine and Diabetes Team, Pediatric Department, Salmaniya Medical Complex, 3Pharmacy Program, College of Health Sciences, University of Bahrain, Manama, 4Nutrition and Health Studies Unit Deanship of Scientific Research, University of Bahrain, Sakheer, Kingdom of Bahrain; 5School of Biosciences and Medicine, Department of Nutritional Sciences, University of Surrey, Guildford, UK
Background: The number of children being diagnosed with type 1 diabetes mellitus (T1DM) is on the rise and has more than doubled in the past 10 years in Bahrain. Some studies have linked low vitamin D levels with an increased risk of diabetes. There are concerns regarding the variations in circulating 25(OH)D levels measured by different laboratories and by using different analytical techniques.
Objective: The aim of this study was to evaluate the vitamin D levels of newly diagnosed children with T1DM using the “gold standard method” with high-pressure liquid chromatography–tandem mass spectrometry methods compared to the chemiluminescence micro-particle immunoassay (CMIA) used in a hospital laboratory.
Subjects: Eighteen children, aged 6–12 years, who received a confirmed diagnosis of T1DM in 2014 were chosen as subjects.
Methods: Serum vitamin D levels were assessed in a hospital, while an extra aliquot of blood collected during routine blood collection after acquiring informed written consents from the subjects, and sent to Princess Al-Jawhara Center for Molecular Medicine and Inherited Disorders to be analyzed by ultra-performance liquid chromatography–tandem mass spectrometry (UPLC-MS/MS).
Results: The mean age of the study group was 9±2 years. The mean total of 25(OH)D levels (D3 and D2) assessed by UPLC-MS/MS was 49.7±18.8, whereas the mean total of 25(OH)D levels obtained from the CMIA assay was 44.60±13.20. The difference in classification between the two methods was found to be statistically significant (P=0.004). A Bland–Altman plot showed a poor level of agreement between the two assay methods. The CMIA overestimated insufficient values and underestimated deficiency, when compared to UPLC-MS/MS.
Conclusion: There was a statistically significant difference between the two assay methods with CMIA overestimating vitamin D insufficiency. Clinicians should be prudent in their assessment of a single vitamin D reading, when the gold standard method is not available or feasible.
Keywords: type 1 diabetes, children, vitamin D, Middle East
Introduction
A large number of studies have reported a relationship between vitamin D levels and the risk of osteoporosis, diabetes, cancer, multiple sclerosis, and rheumatoid arthritis.1 Some studies have also linked low vitamin D levels with an increased risk of diabetes,2–4 while other studies have found that children who were regularly supplemented with vitamin D in the first year of life had a reduced risk of developing type 1 diabetes mellitus (T1DM).2
T1DM in children is on the rise worldwide.5 The number of children being diagnosed with T1DM is also on the rise in Bahrain. The number of those newly diagnosed victims has more than doubled in the past 10 years with 25 new cases diagnosed per 100,000 population in 2010.6
Vitamin D is often described as a fat-soluble vitamin, but it also exhibits hormonal properties in its active form through its action via vitamin D receptors found in most tissues in the human body.7 More than 90% of the vitamin D requirement for most people is believed to come from casual exposure to sunlight.8–10 Vitamin D is produced endogenously by the skin via photosynthesis using ultraviolet B light, which converts 7-dehydroxycholesterol to pre-vitamin D3.11 It can also be obtained from the diet or from a dietary supplement; fatty fish and fish liver oils are a good source of the vitamin.12
This research is a substudy of a larger study undertaken by the author to explore dietary and health risk factors of T1DM in children.13,14 The objective of the larger study was to evaluate the association between physiological factors, such as vitamin D levels and lifestyle factors (eg, activity levels and frequency of sunlight exposure) and diabetes prevalence in a small, but representative sample of newly diagnosed children. In this regard, the ideal assay method for determining serum vitamin D levels in this sample of children was subject to considerable debate; hence, this study reports on the experience of assaying vitamin D levels using two different methods to help inform future practice.
Vitamin D levels are tested as part of the routine blood workup for all newly diagnosed children with T1DM admitted at the Salmaniya Medical Complex (SMC), the main governmental hospital in Bahrain. Currently, the hospital laboratory uses an automated chemiluminescence micro-particle immunoassay (CMIA) kit (ARCHITECT; Abbott Laboratories, Abbott Park, IL, USA) to test vitamin D levels. Serum 25(OH)D (25-hydroxy vitamin D), known as calcidiol, is considered a good indicator of vitamin D levels.1,15,16 However, concerns remain regarding the variations in circulating 25(OH)D levels measured by different laboratories and by different analytical techniques as highlighted by Binkley et al.17 Some of the commonly used alternate assays include radioimmunoassay (RIA), enzyme-linked immunosorbent assay, high-performance liquid chromatography (HPLC), liquid chromatography coupled with mass spectrometry (LC-MS), and automated assay using chemiluminescence immunoassay (CLIA).
HPLC is considered as the gold standard assay method for the detection of 25(OH)D levels.18 It is a technique that requires pumps to pass a pressurized liquid solvent, which contains a blood sample mixture through a column filled with a solid adsorbent material. The constituents of the sample mixture pass through the pumps and interact differently with the adsorbent material, thus resulting in varying flow rates and the ultimate separation of the components. Following HPLC, quantification of vitamin D is made possible by UV detection at 264 nm.19 The absorption spectrum is then computed as a chromatogram with retention time being used as a means to identify the compound.15 This process is fully automated and has the ability to separately assay vitamins D2, D3, and D3 metabolites.19 CLIA, on the other hand, involves the attachment of highly specific proteins to magnets in a competitive binding protein assay reaction, which causes the chemical substrate to produce light that is then detected and measured.20 A blood sample is combined with anti-human vitamin D coated micro-particles, which causes the vitamin D to disassociate from its binding protein, thus allowing it to bind to these micro-particles. A conjugate is then added, which produces a chemiluminescent reaction with the antibodies bound to these micro-particles, producing light that can be measured.21 Although studies have compared commercially available assays using CLIA or RIA methods to HPLC,17,22 no studies, to the best of the author’s knowledge, have assessed vitamin D levels of children with T1DM comparing these two methods. In light of the growing evidence of the importance of vitamin D in relation to diabetes, the reliability of 25(OH)D measurements should be evaluated, as these results will ultimately inform the management of those who are found to be insufficient. The aim of this study was to investigate whether there is a significant difference in vitamin D levels in newly diagnosed children with T1DM as measured by the gold standard method using high-performance liquid chromatography tandem mass spectrometry when compared to the CLIA method currently used in the SMC.
Methods
Recruitment and data collection took place from mid-January till the end of March; months considered to be cooler although it should be noted that Bahrain enjoys sunlight all year around with a monthly average of 7 hours of sunlight over the year.23 The inclusion criteria for study subjects were as follows:
- Newly diagnosed children aged 6–12 years with a confirmed diagnosis of T1DM
- Informed, written consent from parents or legal guardian
- Patients were being followed up at the Pediatric Endocrine Unit in the SMC hospital.
The study subjects were 18 (nine males and nine females) children newly diagnosed with T1DM, aged 6–12 years, and admitted to the SMC. This study was approved by the Salmaniya Medical Complex Health Research Ethics Committee. Informed, written consent was obtained from the parents or legal guardian and all children were followed up at the Pediatric Endocrine Unit in the SMC. Vitamin D levels were measured as part of the routine blood collection and analyzed by CMIA at the SMC laboratory; however, an extra blood sample was collected from the study subjects and sent to Princess Al-Jawhara Center for Molecular Medicine and Inherited Disorders in Bahrain to be analyzed by ultra-Performance liquid chromatography tandem mass spectrometry (UPLC-MS/MS).
SPSS Statistical package Version 22 was used for data entry and analysis. A paired sample t-test was performed as a measure of assay association. Chi-squared tests were used to compare the sufficiency classifications of the group between the two methods and Bland–Altman analysis (constructed using MedCal software Version 14.10.2) was used to measure assay agreement. A P-value <0.05 was considered as significant.
Results
The mean age of the study group was 9±2 years with a mean body mass index (BMI) percentile of 54.3±36.9 as shown in Table 1. The mean total 25(OH)D levels (D3 and D2) assessed by UPLC-MS/MS was 49.7±18.8, whereas the mean total 25(OH)D levels assessed by CMIA assay was 44.60±13.20 (see Table 2). The mean total 25(OH)D levels for males was 58.0±14.2 and for females was 41.3±19.7, which is a difference approaching significance (P=0.056). According to the cut off values set by the authors to define hypovitaminosis, 22% of children analyzed using the UPLC-MS/MS method were classified as being deficient with a serum vitamin D level below 30 nmol/L, 28% had insufficient vitamin D levels between 30 and 50 nmol/L and 50% of the children had optimal levels of vitamin D, which is >50 nmol/L as shown in Figure 1. Analysis using CMIA, on the other hand, classified 11% of the children as being deficient, 61% as being insufficient, and only 28% as having optimal levels of vitamin D. The difference in classification between the two methods was found to be statistically significant (P=0.004); there was also a statistically significant difference in the mean vitamin D measurements between the two assays (P=0.048).
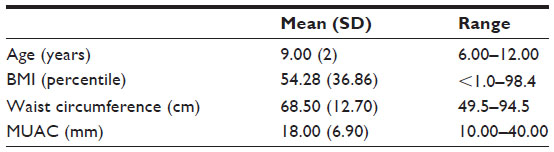 | Table 1 Baseline characteristics of sample children with type 1 diabetes (n=18) recruited to a study of vitamin D analysis |
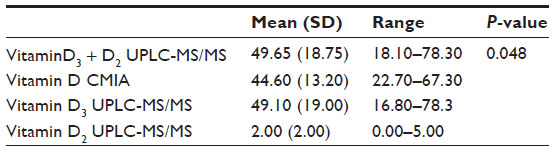 | Table 2 Mean 25-hydroxyvitamin D (25(OH)D) values as assessed by two methods for children diagnosed with type 1 diabetes mellitus (T1DM) (N=18) |
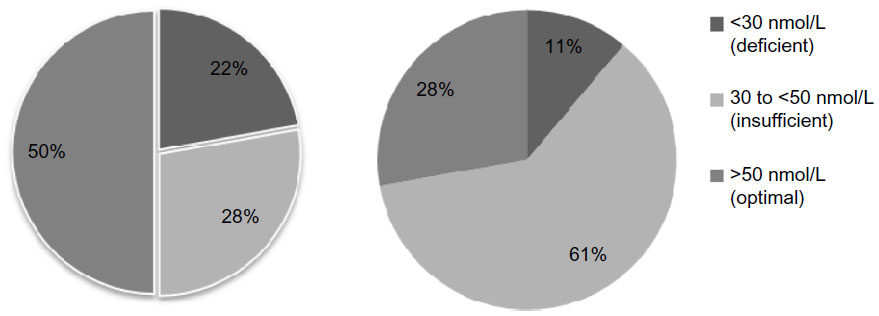 | Figure 1 The percentage of children with T1DM classified as being deficient, insufficient, or having optimal serum levels of vitamin D using UPLC-MS/MS (n=18) and CLIA (n=18) assay methods. |
A Bland–Altman plot, which shows the discrepancies between results for individual samples, was used to reveal the differences between the two methods. The Bland–Altman plot with linear regression analysis with 95% confidence limits is presented in Figure 2. It clearly shows that the CMIA is biased when compared to the UPLC-MS/MS method. CMIA overestimated insufficient values and underestimated deficiency, when compared to UPLC-MS/MS.
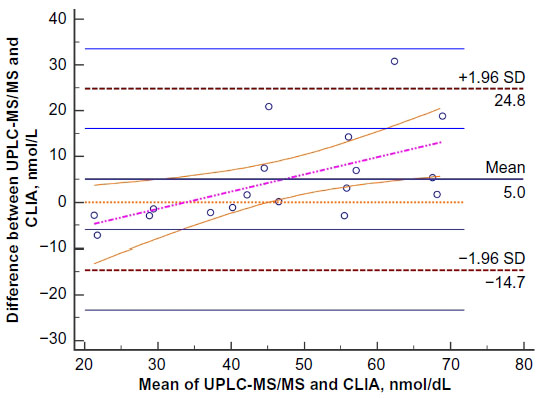 | Figure 2 Bland–Altman plot showing a concentration dependent difference between the UPLC-MS/MS and the CLIA method. |
Discussion
Variations in circulating 25(OH)D levels between assay methods and interlaboratory measurements can potentially confound the diagnosis of hypovitaminosis D.17 There is currently no consensus on the optimal reference to classify moderate to severe insufficiency among clinicians and this may be, in part, due to an inter-method bias.22,24 Furthermore, there is currently no consensus on the vitamin D intake required for optimal health, despite a substantial number of published studies, which aim to determine what constitutes an adequate intake. Many of these studies have unfortunately had mixed outcomes and were lacking in the robust designs needed to develop dietary guidelines.15
The USA Institute of Medicine’s (IOM) most recent recommendation is a recommended dietary intake of 600 IU of vitamin D in children, who are 1 year old and more in order to achieve a 25(OH)D level of 50 nmol/L which, according to IOM, meets the requirements of 97.5% of the healthy population.16 However, there has been recent controversy regarding the accuracy of this estimation.25,26 Indeed, Veugelers and Ekwaru argue that over 8,000 IU of vitamin D is a more accurate estimation of the needs of 97.5% of a healthy population in order to achieve a serum value of 50 nmol or above.25 Furthermore, the study by Heaney et al corroborated these findings and put forth the argument that a total intake of close to 7,000 IU per day is a more accurate recommendation than the 600 IU intake currently suggested by the IOM.
There are a limited number of studies that have looked into the vitamin D levels of children in the Middle Eastern region27–30 and research on the vitamin D status of children with T1DM in the Middle East is even scarcer. In fact, only one study by Bener et al31 exclusively looked at children with T1DM, concluding that vitamin D deficiency was significantly higher in children with T1DM, when compared to healthy controls.
Several studies that have compared commercially available assays using CLIA or RIA methods to HPLC have found low inter-assay agreement.22,32,33 Farrell et al33 describe the variability in results of vitamin D in “state of the art” automated immuno-assays including the ARCHITECT (Abbott Laboratories) (currently used in our facility), which showed the greatest deviation of all assays when compared to the LC-MS/MS. Detection of 25(OH)D levels appears to be largely method-dependent.33,34 Wallace et al in their review of the measurement procedures and limitations of vitamin D assays, conclude that the precision of immunoassays as well as HPLC and LC-MS/MS were comparable in detecting severe vitamin D deficiency, nonetheless the authors highlighted the need for a standard reference method.35
Putting the results of this study into clinical context, we can conclude that (assuming any newly diagnosed child with T1DM with a 25(OH)D level of <50 nmol/L was indicated for supplementation) 50% of the children would require supplementation according to UPLC-MS/MS measurements, when compared to 72% of children according to CMIA measurements. Other studies19 cite an approximate 20% misclassification rate between samples assessed using CLIA and LC-MS/MS with 57% and 41%, respectively, being classified as deficient using a cut-point of 50 nmol/L.
However, deciding on which assay method to use depends on balancing out many factors. First, laboratories that test on a frequent basis and require a higher output may benefit more from a commercially available kit.20 However, it is important to take into consideration that inexperienced users of such commercial kits may introduce more assay variability.17 Furthermore, one must also take into consideration the commercial assays that discriminate between D2 and D3, which may result in an underestimation of vitamin D levels. Second, the cost of the assays is another factor to consider; the cost of running vitamin D assays using HPLC method is currently three times the cost of the CMIA method used in the hospital laboratory.
Since vitamin D levels are implicated in a number of disorders, the wider implication of inaccurate readings in the management of hypovitaminosis D is not limited to children with T1DM. Hence, in light of the multifactorial issues surrounding diagnosis and treatment of hypovitaminosis D, the authors of this paper support the recommendation that clinicians be prudent in their assessment of 25(OH)D measurements as variations exist between the assay methods.17,19
Conclusion
There was a statistically significant difference between the two assay methods with CMIA overestimating vitamin D insufficiency. Clinicians should take care in their assessment of a single vitamin D reading in the treatment of hypovitaminosis D when HPLC, which is considered as the gold standard assay method, is not available or feasible to use.
Acknowledgment
The authors have received a grant from the Dr Ali Al-Khalifa Research Fund.
Disclosure
The authors report no conflicts of interest in this work.
References
Calvo MS, Whiting SJ, Barton CN. Vitamin D intake: a global perspective of current status. J Nutr. 2005;135(2):310–316. | |
Hyppönen E, Läärä E, Reunanen A, et al. Intake of vitamin D and risk of type 1 diabetes: a birth-cohort study. Lancet. 2001;358(9292):1500–1503. | |
EURODIAB Substudy 2 Substudy Group. Vitamin D supplement in early childhood and risk for Type I (insulin-dependent) diabetes mellitus. Diabetologia. 1999;42(1):51–54. | |
Stene L, Joner G. Atopic disorders and risk of childhood-onset type 1 diabetes in individuals. Clin Exp Allergy. 2004;34(2):201–206. | |
Karvonen M, Viik-Kajander M, Moltchanova E, et al. Incidence of childhood type 1 diabetes worldwide. Diabetes Mondiale (DiaMond) Project Group. Diabetes Care. 2000;23(10):1516–1526. | |
Ministry of Health (MOH). Statistic on Type 1 Diabetes in Bahrain [Internet]. Manama, Bahrain: MOH; 2008 [updated August 1, 2015; cited February 19, 2010]. Available from: http://www.moh.gov.bh/PDF/Publications/Statistics/HS2008/PDF/CH09-smc_2008.pdf. Accessed November 17, 2015. | |
Seshadri KG, Tamilselvan B, Rajendran A. Role of vitamin D in diabetes. J Endocrinol Metab. 2011;1(2):47–56. | |
Holick MF. Vitamin D: a millenium perspective. J Cell Biochem. 2003;88(2):296–307. | |
Holick MF. Vitamin D: importance in the prevention of cancers, type 1 diabetes, heart disease, and osteoporosis. Am J Clin Nutr. 2004;79(3):362–371. | |
Holick MF. McCollum Award Lecture, 1994: vitamin D – new horizons for the 21st century. Am J Clin Nutr. 1994;60(4):619–630. | |
Tuorkey MJ, Abdul-Aziz KK. Strategies for diabetes and pathways of vitamin D. Diabetes Metab Synd Clin Res Revs. 2010;4(2):101–110. | |
Holick MF, Chen TC. Vitamin D deficiency: a worldwide problem with health consequences. Am J Clin Nutr. 2008;87(4):1080S–1086S. | |
Al-Haddad FA, Musaiger A, Al-Qallaf M, et al. Children with type 1 diabetes. Bah Med Bull. 2015;37(1):16–19. | |
Al-Haddad F, Musaiger A, Al-Qallaf SM, et al. Dietary intake of children with type 1 diabetes in Bahrain: a case-control study. Int J Child Health Nutr. 2015;4(2):83–89. | |
Roth D. Vitamin D supplementation during pregnancy: safety considerations in the design and interpretation of clinical trials. J Perinatol. 2011;31(7):449–459. | |
Ross AC, Manson JE, Abrams SA, et al. The 2011 report on dietary reference intakes for calcium and vitamin D from the Institute of Medicine: what clinicians need to know. J Clin Endocrinol Metab. 2011;96(1):53–58. | |
Binkley N, Krueger D, Cowgill C, et al. Assay variation confounds the diagnosis of hypovitaminosis D: a call for standardization. J Clin Endocrinol Metab. 2004;89(7):3152–3157. | |
Hollis BW. Editorial: the determination of circulating 25-hydroxyvitamin D: no easy task. J Clin Endocrinol Metab. 2004;89(7):3149–3151. | |
Lai JK, Lucas RM, Clements MS, et al. Assessing vitamin D status: pitfalls for the unwary. Mol Nutr Food Res. 2010;54(8):1062–1071. | |
Hollis BW, Horst RL. The assessment of circulating 25 (OH) D and 1, 25 (OH) 2 D: where we are and where we are going. J Steroid Biochem. 2007;103(3):473–476. | |
US Food and Drug Administration. Access Data: Substancial Equivilance Determination Decision Summary Only [Internet]. New Hampshire, MD: Food and Drug Administration (US); 2008 [updated August 23, 2015; cited August 23, 2015]. Available from: http://www.accessdata.fda.gov/cdrh_docs/reviews/K110619.pdf. Accessed November 17, 2015. | |
Glendenning P, Taranto M, Noble J, et al. Current assays overestimate 25-hydroxyvitamin D3 and underestimate 25-hydroxyvitamin D2 compared with HPLC: need for assay-specific decision limits and metabolite-specific assays. Ann Clin Biochem. 2006;43(1):23–30. | |
Weather-and-Climate. Average Monthly Hours of Sunlight Bahrain, Bahrain; 2015 [updated 2015; cited August 23, 2015]. Available from: https://weather-and-climate.com/average-monthly-hours-Sunshine,Bahrain,Bahrain. Accessed November 17, 2015. | |
Levis S, Gomez A, Jimenez C, et al. Vitamin D deficiency and seasonal variation in an adult South Florida population. J Clin Endocrinol Metab. 2005;90(3):1557–1562. | |
Veugelers PJ, Ekwaru JP. A statistical error in the estimation of the recommended dietary allowance for vitamin D. Nutrients. 2014;6(10):4472–4475. | |
Heaney R, Garland C, Baggerly C, et al. Letter to Veugelers PJ and Ekwaru JP. A statistical error in the estimation of the recommended dietary allowance for vitamin D. Nutrients. 2014; 6:4472–4475; doi: 10.3390/nu6104472. Nutrients. 2015;7(3):1688–1690. | |
Siddiqui AM, Kamfar HZ. Prevalence of vitamin D deficiency rickets in adolescent school girls in Western region, Saudi Arabia. Saudi Med J. 2007;28(3):441–444. | |
Bener A, Al-Ali M, Hoffmann G. High prevalence of vitamin D deficiency in young children in a highly sunny humid country: a global health problem. Minerva Pediatr. 2009;61(1):15–22. | |
Bener A, Ehlayel MS, Tulic MK, et al. Vitamin D deficiency as a strong predictor of asthma in children. Int Arch Allergy Immunol. 2012;157(2):168–175. | |
Dawodu A, Agarwal M, Sankarankutty M, et al. Higher prevalence of vitamin D deficiency in mothers of rachitic than nonrachitic children. J Pediatr. 2005;147(1):109–111. | |
Bener A, Alsaied A, Al-Ali M, et al. Impact of lifestyle and dietary habits on hypovitaminosis D in type 1 diabetes mellitus and healthy children from Qatar, a sun-rich country. Ann Nutr Metab. 2008;53(3–4):215–222. | |
Snellman G, Melhus H, Gedeborg R, et al. Determining vitamin D status: a comparison between commercially available assays. PLoS One. 2010;5(7):e11555. | |
Farrell C-JL, Martin S, McWhinney B, et al. State-of-the-art vitamin D assays: a comparison of automated immunoassays with liquid chromatography–tandem mass spectrometry methods. Clin Chem. 2012;58(3):531–542. | |
Heijboer AC, Blankenstein MA, Kema IP, et al. Accuracy of 6 routine 25-hydroxyvitamin D assays: influence of vitamin D binding protein concentration. Clin Chem. 2012;58(3):543–548. | |
Wallace A, Gibson S, De La Hunty A, et al. Measurement of 25-hydroxyvitamin D in the clinical laboratory: current procedures, performance characteristics and limitations. Steroids. 2010;75(7):477–488. |
 © 2016 The Author(s). This work is published and licensed by Dove Medical Press Limited. The full terms of this license are available at https://www.dovepress.com/terms.php and incorporate the Creative Commons Attribution - Non Commercial (unported, v3.0) License.
By accessing the work you hereby accept the Terms. Non-commercial uses of the work are permitted without any further permission from Dove Medical Press Limited, provided the work is properly attributed. For permission for commercial use of this work, please see paragraphs 4.2 and 5 of our Terms.
© 2016 The Author(s). This work is published and licensed by Dove Medical Press Limited. The full terms of this license are available at https://www.dovepress.com/terms.php and incorporate the Creative Commons Attribution - Non Commercial (unported, v3.0) License.
By accessing the work you hereby accept the Terms. Non-commercial uses of the work are permitted without any further permission from Dove Medical Press Limited, provided the work is properly attributed. For permission for commercial use of this work, please see paragraphs 4.2 and 5 of our Terms.