Back to Journals » Diabetes, Metabolic Syndrome and Obesity » Volume 14
Assessment of Microcirculation in the Type 2 Diabetic and Impaired Glucose Tolerance Feet of Elderly Men by CEUS
Authors Li X, Wu L, Yang Z, Hu Y, Zhou C, Ji R
Received 8 April 2021
Accepted for publication 12 July 2021
Published 11 August 2021 Volume 2021:14 Pages 3647—3652
DOI https://doi.org/10.2147/DMSO.S314727
Checked for plagiarism Yes
Review by Single anonymous peer review
Peer reviewer comments 3
Editor who approved publication: Professor Ming-Hui Zou
Xiaoyu Li,1,* Lin Wu,2,* Zhifang Yang,1 Yunyun Hu,1 Chun Zhou,1 Ri Ji1
1Department of Ultrasound, Ruijin Hospital, Shanghai Jiao Tong University School of Medicine, Shanghai, 200025, People’s Republic of China; 2Department of Geriatrics, Ruijin Hospital, Shanghai Jiao Tong University School of Medicine, Shanghai, 200025, People’s Republic of China
*These authors contributed equally to this work
Correspondence: Chun Zhou; Ri Ji
Department of Ultrasound, Ruijin Hospital, Shanghai Jiao Tong University School of Medicine, Shanghai, 200025, People’s Republic of China
Tel/Fax +86 021 63846590
; Tel +86 18717771587
Email [email protected]; [email protected]
Objective: To evaluate the foot microcirculation in type 2 diabetes mellitus (T2DM) and impaired glucose tolerance patients (IGT) with contrast-enhanced ultrasound (CEUS).
Methods: The study included 37 patients with T2DM but without diabetic foot (DM group), 15 patients with impaired glucose tolerance (IGT group) and 10 elderly males with normal fasting blood glucose (FBS) and negative glucose tolerance tests (control group). Color Doppler flow imaging (CDFI) and CEUS were performed on the right foot great toes for detecting the blood perfusion performance. CEUS images were recorded and parameters of CDFI and flow time-intensity curves (TICs) were analyzed by the Student’s t-test.
Results: There was no significant difference in CDFI parameters pulse index and peak systolic blood flow velocity (PSV) among the three groups (P > 0.05). Compared with control group, CEUS images of IGT and DM groups showed lower microvascular density and were pale. Peak intensity (PI) and area under time-intensity curve (AUC) in control, IGT and DM groups were decreased gradually (PI 46.36± 10.96 vs 35.26± 11.65 vs 28.15± 7.94, P = 0.001, AUC 5.12± 1.02 vs 3.25± 1.60 vs 2.81± 1.20, P = 0.001). The arrival times (AT) and time to peak (TTP) tended to be increased with the extension of DM course, but the difference was not statistically significant (AT, P = 0.260, TTP, P = 0.481).
Conclusion: CEUS, as a noninvasive and valuable technique, could detect the alterations in foot microcirculation of DM and IGT patients.
Keywords: type 2 diabetes mellitus, impaired glucose tolerance, contrast-enhanced ultrasound, microcirculation
Introduction
Diabetic foot was one of the most common and serious complications of diabetes. It had been reported that up to 25% of diabetic patients were at risk of foot ulcer.1 Therefore, early detection of foot microcirculation changes in patients with diabetes mellitus (DM) was very important to prevent the occurrence of diabetic foot. Improving assessment of microcirculation in people with diabetic foot ulcers was an important area for research, as identified in international guidelines (Hinchliffe et al 2016). However, up to now, there was no ideal method to detect the microcirculation changes of feet in DM patients.
Impaired glucose tolerance (IGT) was an early stage of diabetes. IGT could aggravate oxidative stress and damage vascular endothelial cells. Moreover, as an independent risk factor for cardiovascular disease morbidity and mortality, it could also induce the progression of a variety of cardiovascular diseases.1,2 Interventions on the life of people with IGT could delay the onset of type 2 diabetes, reduce microvascular complications, the incidence of cardiovascular and all-cause mortality, and extend life expectancy.3,4 It was known that IGT could cause changes in renal microcirculation,5–7 retinal microcirculation,8 myocardial microcirculation9 and skeletal muscle perfusion.9,10 However, as far as the authors were concerned, there was no relevant report on foot microcirculation of IGT patients.
Contrast-enhanced ultrasound (CEUS) had been more commonly utilized in the clinical practice because it could effectively display microcirculation perfusion.11 In this study, our aim was to investigate the feasibility and clinical application value of CEUS for the assessment of foot microcirculation in type 2 DM (T2DM) and IGT, so as to provide a reliable method to detect abnormal microcirculation changes as early as possible.
Materials and Methods
Patients
All the patients were elderly males in the geriatric department of Ruijin Hospital from May 2014 to August 2017. The criteria for identifying patients with T2DM and IGT primarily followed the World Health Organization (WHO) guidelines in 1999. Thirty-seven patients were diagnosed with T2DM but without diabetic foot or any clinical symptoms of foot (mean age 72.08±9.20 years; range 61–82 years), while 15 patients with IGT (mean age 73.40±8.20 years; range 63–86 years). Patients in DM and IGT groups did not have diabetic microangiopathy, including diabetic nephropathy, neuropathy, or retinopathy. The control group included ten elderly men (mean age 74.2±9.93 years; range 57–87 years), who had normal fasting blood glucose (FBS) and negative glucose tolerance tests. None of the subjects had a lower extremity artery stenosis rate of more than 50%, as confirmed by vascular ultrasound.
Laboratory and Clinical Data
For all subjects, FBS, 2 hours postprandial blood glucose (2hPG), glycosylated hemoglobin (HbA1c),12,13 and blood lipid were detected within 24 hours before CEUS. Body mass index (BMI), cigarette smoking and drinking history, systolic blood pressure (SBP) and diastolic blood pressure (DBP) were recorded. Hypertension was defined mainly as referred to in the guidelines.14–16
Ultrasonic Technique
CDFI and CEUS examinations were carried out by MyLab Twice ultrasound system (Easto, Italy), with an LA 522 linear array transducer. The instrument parameters were set as follows: Frequency = 7.5 MHz, Mechanical index = 0.08, Depth = 3 cm, Focus = 1.6 cm, Gain = 50%. CDFI was performed on the right toe artery of all subjects, and the blood flow parameters PI and PSV were recorded. After that, the subjects were treated with the ultrasound contrast agents (UCAs) SonoVue® (Bracco SpA, Milan, Italy). UCAs suspension was prepared by shaking after adding 5 mL saline bolus; 4.8 mL suspension was administered intravenously through the antecubital vein within 3 to 4 seconds. A real‐time contrast‐enhanced imaging in B and CEUS mode was recorded immediately after injection. The probe was placed stably on the palmar side of the right toe so that the microvascular perfusion could be observed and recorded for 5 minutes. All the images were collected by an ultrasound doctor with more than 10 years’ experience.
CEUS Analysis
For CEUS images, all tissues except the phalanx were regions of interest (ROI) to be analyzed. Qontraxt v3.06 software (AMIDqX3, Bracco) was used for offline quantitative analysis to obtain the time‐intensity curves (TICs). The time of arrival (AT), time to peak (TTP), peak intensity (PI), and area under curve (AUC) of the right toe were recorded.
Statistical Analyses
SPSS 20.0 software package (SPSS, Chicago, IL, USA) was used for the statistical analysis of the obtained results. Categorical variables were expressed as percentages and evaluated by Chi-square test. Continuous variables were presented as mean±standard deviation (x±s) and estimated by Student’s t-test. Statistical significance level was considered as a p-value of <0.05.
Results
Clinical and Laboratory Data
Results of clinical and laboratory data of all subjects are shown in Table 1. Three groups were all matched, as there were significant differences in FBS, 2hPG and HbA1c (P <0.05). Patients with hypertension or hyperlipidemia in DM group were significantly more than those in IGT and control groups, but there was no statistical difference (P >0.05). No significant difference was also found in age, BMI, smoking and drinking history (P >0.05).
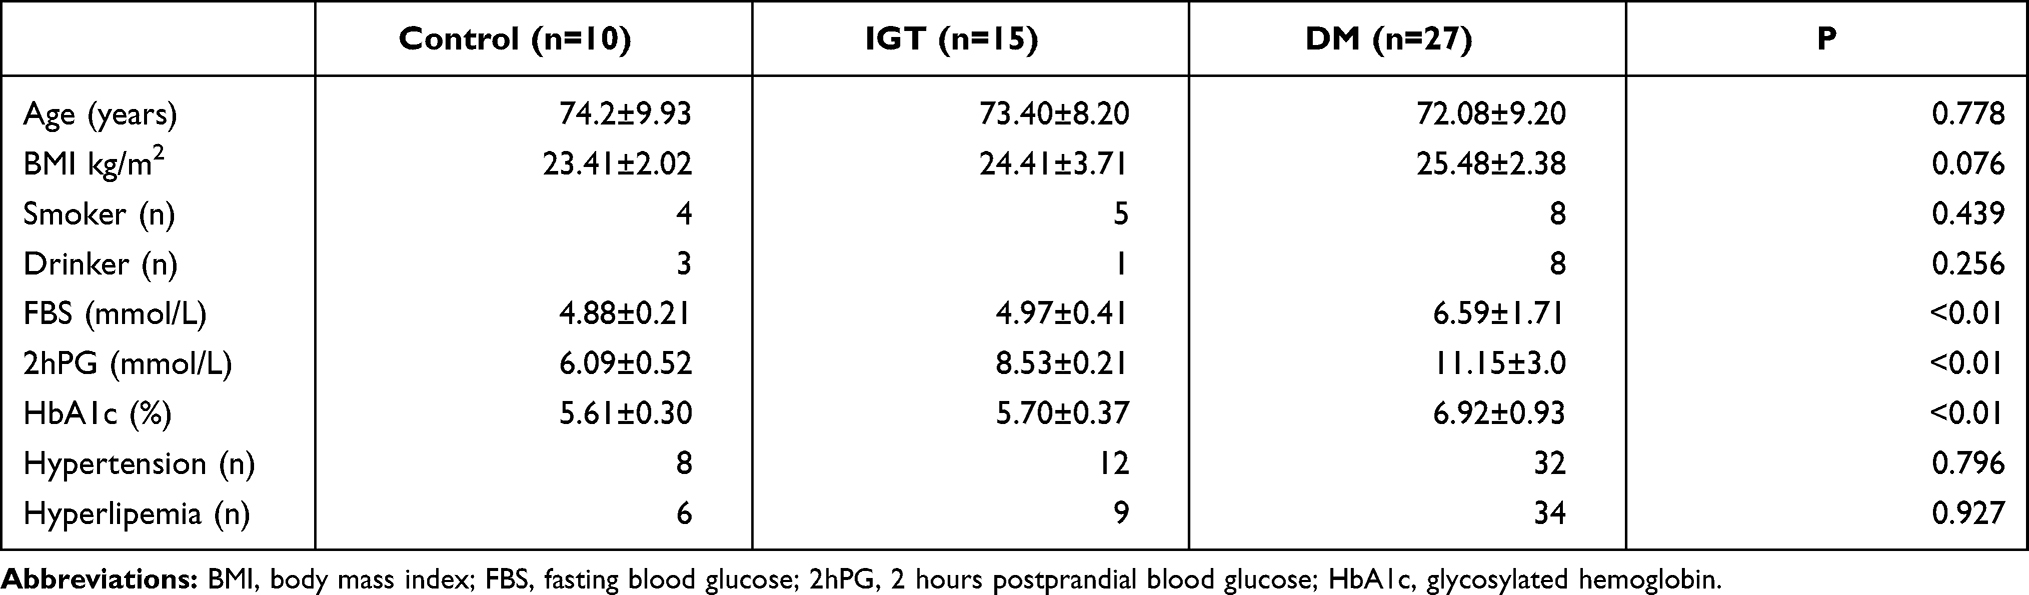 |
Table 1 Subjects’ Descriptive Clinical Characteristics; Data Were Mean±Standard Deviation (SD) and the Corresponding Number of Patients |
CDFI Parameters Analysis
The blood flow parameters PI and PSV of right foot great toes in control, IGT and DM groups are summarized in Table 2. No significant difference was observed in PI (7.63±6.56 vs 5.18±4.72 vs 6.55±6.11, P = 0.646) and PSV (19.14±11.34 vs 18.33±9.92 vs 21.53±15.04, P = 0.222).
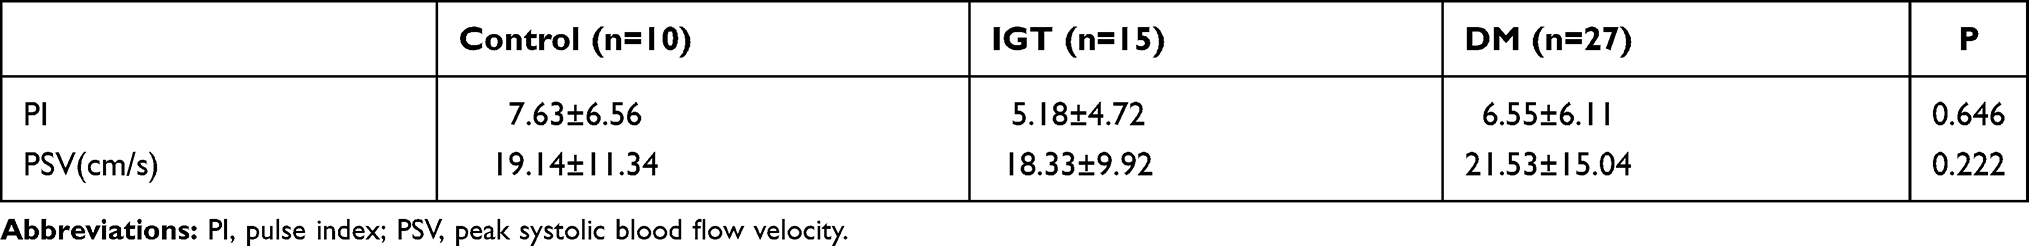 |
Table 2 CDFI Parameters of Right Foot Great Toes in DM, IGT and Control Groups |
CEUS Perfusion Images and Parameter Analysis of TICs
CEUS image of the normal elder male showed that the blood vessels of the right toe were dense and bright (Figure 1A), while those of IGT and DM patients showed sparse and dark (Figure 1B and C). Further, the darkest blood vessels of right toe were found in DM group.
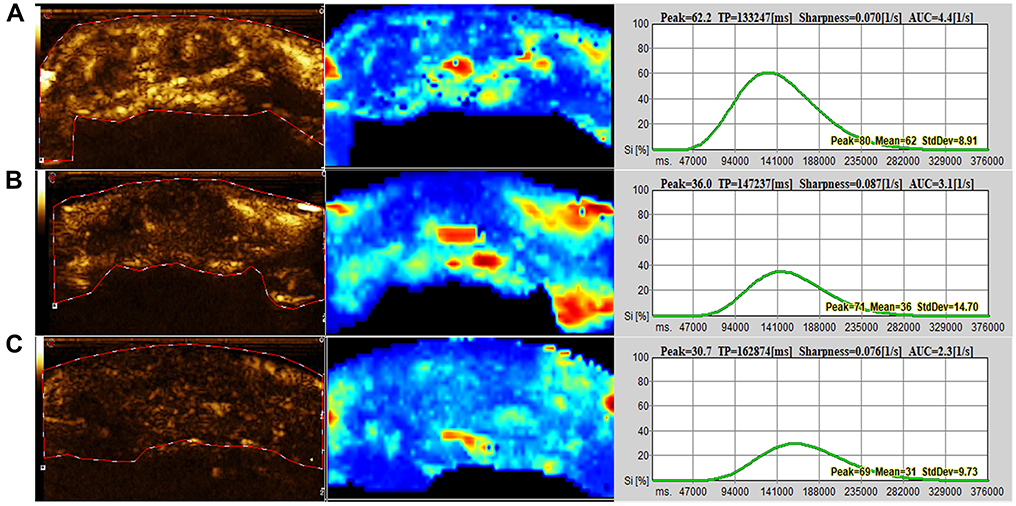 |
Figure 1 (A) The right toe CEUS image of control group in a 61-year-old male showed dense and bright, and PI and AUC of TIC were the largest. (B) A 65-year-old male with IGT who had sparse and dark CEUS signal. (C) The CEUS of a 75-year-old male with T2DM showed darkest image, and the lowest PI and AUC among three groups. |
TICs parameter analysis results are shown in Table 3. Compared with the other control and IGT groups, PI of DM group was significantly shorter (46.36±10.96 vs 35.26±11.65 vs 28.15±7.94, P = 0.001). Similarly, the AUC of DM patients was the smallest among the three groups (2.81±1.20 vs 3.25±1.60 vs 5.12±1.02, P = 0.001). TTP and AT increased with the decrease of glucose tolerance, but there was no statistically significant difference among the control, IGT and DM groups (TTP 136671.8 ± 29121.07 vs 138534.53 ± 48667.88 vs 153940.65 ± 54951.81, P = 0.481; AT 46.00 ± 9.52 vs 50.33 ± 7.18 vs 53.59 ± 12.70, P = 0.260).
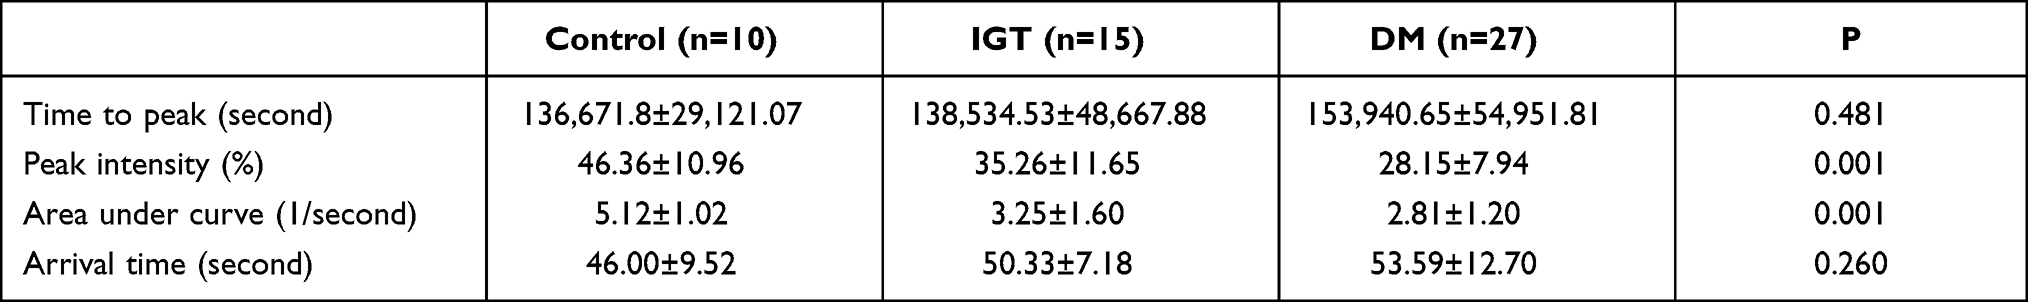 |
Table 3 TICs Parameters of Right Foot Great Toes in DM, IGT and Control Groups; Data Were Mean±Standard Deviation (SD) |
Discussion
Studies had shown that the probability of ulcer in patients with diabetes was as high as 19–34%.17 The number of diabetic patients with foot ulcer in the world would increase by 9.1–26.1 million annually.18 Diabetic foot ulcer was the precursor of amputation and death, but the dysfunction of distal microcirculation in diabetic patients often indicated the occurrence of ulcer. Therefore, every effort should be made to prevent ulcer by detecting the changes of foot microcirculation in diabetic patients as early as possible.
Due to the small diameter of blood vessels in microcirculation (<0.3 mm), conventional imaging methods could not show them. Some novel and promising optical techniques for imaging of microcirculation in the diabetic foot were evaluated, however, such as laser Doppler perfusion imaging, laser speckle contrast imaging, photoacoustic imaging and hyperspectral imaging.19 However, the relevant clinical verifications and values had not been carried out. The current clinical methods such as laser Doppler flowmetry,20,21 nailfold microcirculation index22,23 and capillaroscopy24,25 were all suitable for detecting capillary microcirculation in finger-tip skin due to the limitation of penetration, but could not detect capillary microcirculation in subcutaneous fat and muscle tissue. Doppler flow parameters were also not sensitive indicators of changes in the natural history of diabetes in early periods.26 Ma et al27 adopted enhanced power Doppler imaging (e-Flow) to display the acral arterioles (pulps and nail beds of fingers and toes) and the microcirculatory status. They found that although e-Flow was superior to the conventional ultrasound in improving the sensitivity of blood flow signals, there was uncertainty in the display of microcirculation.
CEUS had been used for the investigation of microvascular function and impairment.28,29 With the microbubble size range of 1.5–2.5 μm, which was smaller than the capillary diameter, the capillaries could be entered to show microcirculation. Based on it, UCAs could provide the excellent spatial and temporal evaluation of lesion vascularity28 to reflect the microcirculation of the lesion effectively. Thus, CEUS of foot toes could reflect the foot microcirculation directly and vividly. In this study, we took the elderly male patients with T2DM and IGT as subjects to evaluate the feasibility and value of CEUS in detecting microcirculation changes of early diabetes. Diabetes complications occurred in none of these patients. And no one included in the study had the plaque stenosis rate of more than 50% in lower extremity arteries. It meant that lower extremity arterial stenosis had no effect on peripheral microcirculation hemodynamics. Blood flow parameters of foot toe arteries were also performed in all subjects before CEUS, but there was no significant difference of PI and PSV among the three groups (P >0.05). The reason might be that CDFI parameters could only detect the blood flow of small vessels, but could not observe the perfusion of capillary microcirculation. Therefore, the change of early microcirculation in diabetes could not be displayed by CDFI.
However, CEUS could indicate abnormal changes in the microcirculation of the toes of IGT and DM patients through the parameters of TICs. As the results of the present study showed, PI (reflecting the blood flow of ROI) and AUC (reflecting the blood flow volume of ROI) in IGT and DM group were significantly lower than those in control group. This indicated that the microcirculation of the foot toes had changed in IGT and DM patients without obvious stenosis of the lower extremity arteries. As a transitional stage of DM, IGT had showed the similar changes of foot microcirculation with DM patients by CEUS. Thus, for IGT patients, we should pay much more attention to the possibility of diabetes complications caused by abnormal blood glucose regulation and provide active monitoring suggestions consciously.
Compared with IGT, PI and AUC of DM patients were further decreased. It showed that the degree of foot microcirculation dysfunction was related to the course. The longer the disease course was, the worse the foot microcirculation was. Previous studies had found that the contrast perfusion time of calf skeletal muscle microvessels in DM patients was prolonged.30,31 AT and TTP of foot toes in the control, IGT and DM groups were gradually prolonged, but there was no statistical difference (p >0.05). The reason might be related to the small sample size of this study. In addition, height, stroke volume and other factors might also affect the AT and TTP parameters.
A few literatures had suggested that the TICs quantitative parameters of CEUS could be affected by the UCAs dose, ROI size, the placement position and instrument setting. In order to get relatively reliable quantitative parameters, the same ultrasound instrument and CEUS quantitative analysis software were adopted throughout the study. Furthermore, the dose and concentration of UCAs and the instrument setting were always kept constant during the examination, so as to obtain perfusion data with comparability and clinical reference value.
There were also some limitations in the study. One was the small size of the sample. The other was that females with DM were not included in this study because there were few female patients in the review, so they were excluded to avoid gender bias. In addition, the changes of microcirculation of toes in different time of DM were not observed. Considering that the lesions of DM were gradually accumulating and aggravating, the manifestations of microcirculation might be different in different stages of the disease. However, it needed to be grouped and compared according to a certain time node, which was conducive to further finding the subtle or sensitive relationship between toe microcirculation and the course of DM.
Conclusions
CEUS could be used to detect the foot microvascular dysfunction of patients with T2DM and IGT, which provided a simple and reliable method for clinical evaluation of foot microcirculation in the early stage of diabetes.
Data Sharing Statement
All data in this study are available from the corresponding authors upon reasonable request.
Ethics Approval and Consent to Participate
This retrospective study was approved by the Ethics Committee of the Ruijin Hospital, Shanghai Jiao Tong University School of Medicine. Patient consent to participate was waived due to the retrospective nature of this study and all identifying data of patients was undistinguishable. The study was carried out in conformity to the Declaration of Helsinki (as revised in 2013).
Author Contributions
All authors made substantial contributions to conception and design, acquisition of data, or analysis and interpretation of data; took part in drafting the article or revising it critically for important intellectual content; agreed to submit to the current journal; gave final approval of the version to be published; and agree to be accountable for all aspects of the work.
Funding
There is no funding to report.
Disclosure
The authors declare that they have no competing interests.
References
1. Yubero-Serrano EM, Delgado-Lista J, Alcala-Diaz JF, et al. A dysregulation of glucose metabolism control is associated with carotid atherosclerosis in patients with coronary heart disease (CORDIOPREV-DIAB study). Atherosclerosis. 2016;253:178–185. doi:10.1016/j.atherosclerosis.2016.07.903
2. Ando T, Okada S, Niijima Y, et al. Impaired glucose tolerance, but not impaired fasting glucose, is a risk factor for early-stage atherosclerosis. Diabet Med. 2010;27(12):1430–1435. doi:10.1111/j.1464-5491.2010.03144.x
3. Gong Q, Zhang P, Wang J, et al.; Da Qing Diabetes Prevention Study Group. Morbidity and mortality after lifestyle intervention for people with impaired glucose tolerance: 30-year results of the Da Qing Diabetes Prevention Outcome Study. Lancet Diabetes Endocrinol. 2019;7(6):452–461. doi:10.1016/S2213-8587(19)30093-2
4. Chen Y, Zhang P, Wang J, et al. Associations of progression to diabetes and regression to normal glucose tolerance with development of cardiovascular and microvascular disease among people with impaired glucose tolerance: a secondary analysis of the 30 year Da Qing Diabetes Prevention Outcome Study. Diabetologia. 2021;64(6):1279–1287.
5. Cheung CY, Ikram MK, Klein R, Wong TY. The clinical implications of recent studies on the structure and function of the retinal microvasculature in diabetes. Diabetologia. 2015;58(5):871–885. doi:10.1007/s00125-015-3511-1
6. Quinn CE, Hamilton PK, McCann AJ, et al. Ocular blood flow analysis detects microvascular abnormalities in impaired glucose tolerance. Microcirculation. 2011;18(7):532–540. doi:10.1111/j.1549-8719.2011.00110.x
7. Ikonomidis I, Lambadiari V, Pavlidis G, et al. Insulin resistance and acute glucose changes determine arterial elastic properties and coronary flow reserve in dysglycaemic and first-degree relatives of diabetic patients. Atherosclerosis. 2015;241(2):455–462. doi:10.1016/j.atherosclerosis.2015.06.006
8. Patel SR, Bellary S, Qin L, Balanos GM, McIntyre D, Gherghel D. Abnormal retinal vascular reactivity in individuals with impaired glucose tolerance: a preliminary study. Invest Ophthalmol Vis Sci. 2012;53(9):5102–5108. doi:10.1167/iovs.12-9512
9. Östlund Papadogeorgos N, Jörneskog G, Bengtsson M, Kahan T, Kalani M. Severely impaired microvascular reactivity in diabetic patients with an acute coronary syndrome. Cardiovasc Diabetol. 2016;15:66. doi:10.1186/s12933-016-0385-6
10. Jones S, Tillin T, Williams S, Eastwood SV, Hughes AD, Chaturvedi N. Type 2 diabetes does not account for ethnic differences in exercise capacity or skeletal muscle function in older adults. Diabetologia. 2020;63(3):624–635. doi:10.1007/s00125-019-05055-w
11. Erlichman DB, Weiss A, Koenigsberg M, Stein MW. Contrast enhanced ultrasound: a review of radiology applications. Clin Imaging. 2020;60(2):209–215. doi:10.1016/j.clinimag.2019.12.013
12. Giglio RV, Lo Sasso B, Agnello L, et al. Recent updates and advances in the use of glycated albumin for the diagnosis and monitoring of diabetes and renal, cerebro- and cardio-metabolic diseases. J Clin Med. 2020;9(11):3634. doi:10.3390/jcm9113634
13. Bellia C, Cosma C, Lo Sasso B, et al. Glycated albumin as a glycaemic marker in patients with advanced chronic kidney disease and anaemia: a preliminary report. Scand J Clin Lab Invest. 2019;79(5):293–297. doi:10.1080/00365513.2019.1613673
14. Shah AS, Newby DE. Less clarity as the fog begins to lift. Heart. 2014;100(14):1073–1074. doi:10.1136/heartjnl-2014-305877
15. Mancia G, Fagard R, Narkiewicz K, et al. 2013 ESH/ESC practice guidelines for the management of arterial hypertension. Blood Press. 2014;23(1):3–16. doi:10.3109/08037051.2014.868629
16. James PA, Oparil S, Carter BL, et al. 2014 evidence-based guideline for the management of high blood pressure in adults: report from the panel members appointed to the Eighth Joint National Committee (JNC 8). JAMA. 2014;311(5):507–520. doi:10.1001/jama.2013.284427
17. Armstrong DG, Boulton AJM, Bus SA, Ingelfinger JR. Diabetic foot ulcers and their recurrence. N Engl J Med. 2017;376(24):2367–2375. doi:10.1056/NEJMra1615439
18. Diabetes atlas. International Diabetes Federation. IDF Diabetes Atlas.
19. Mennes OA, van Netten JJ, Slart RHJA, Steenbergen W. Novel optical techniques for imaging microcirculation in the diabetic foot. Curr Pharm Des. 2018;24(12):1304–1316. doi:10.2174/1381612824666180302141902
20. Dremin V, Kozlov I, Volkov M, et al. Dynamic evaluation of blood flow microcirculation by combined use of the laser Doppler flowmetry and high-speed videocapillaroscopy methods. J Biophoton. 2019;12(6):e201800317. doi:10.1002/jbio.201800317
21. Sorelli M, Francia P, Bocchi L, De Bellis A, Anichini R. Assessment of cutaneous microcirculation by laser Doppler flowmetry in type 1 diabetes. Microvasc Res. 2019;124:91–96. doi:10.1016/j.mvr.2019.04.002
22. Hu G, Zhai F, Mo F, He L, Shen W, Wang H. Effectiveness and feasibility of nailfold microcirculation test to screen for diabetic peripheral neuropathy. Diabetes Res Clin Pract. 2017;131:42–48. doi:10.1016/j.diabres.2017.06.017
23. Fink C, Kilian S, Bertlich I, et al. Evaluation of capillary pathologies by nailfold capillaroscopy in patients with psoriasis vulgaris: study protocol for a prospective, controlled exploratory study. BMJ Open. 2018;8(8):e021595. doi:10.1136/bmjopen-2018-021595
24. Suchkova OV, Gurfinkel YI, Sasonko ML. Parametry mikrotsirkuliatsii pri kompensirovannom i dekompensirovannom sakharnom diabete 2-go tipa [Microcirculatory parameters in compensated and decompensated type 2 diabetes mellitus]. Ter Arkh. 2017;89(10):28–35. Russian.
25. Ocampo-Garza SS, Villarreal-Alarcón MA, Villarreal-Treviño AV, Ocampo-Candiani J. Capillaroscopy: a valuable diagnostic tool. Actas Dermosifiliogr. 2019;110(5):347–352. [English, Spanish]. doi:10.1016/j.ad.2018.10.018
26. Leoniuk J, Lukasiewicz A, Szorc M, Sackiewicz I, Janica J, Lebkowska U. Doppler ultrasound detection of preclinical changes in foot arteries in early stage of type 2 diabetes. Pol J Radiol. 2014;79:283–289. doi:10.12659/PJR.890486
27. Ma F, Zhao B, Zhang H, et al. Usefulness of enhanced power Doppler imaging in monitoring acral microcirculation in type 2 diabetes mellitus and its complications. Cell Biochem Biophys. 2011;61(2):435–441. doi:10.1007/s12013-011-9208-2
28. Ghosh D, Peng J, Sirsi S, Mattrey R, Hoyt K Super-resolution ultrasound imaging of the microvasculature in skeletal muscle: a new tool in diabetes research.
29. Saini R, Hoyt K. Recent developments in dynamic contrast-enhanced ultrasound imaging of tumor angiogenesis. Imaging Med. 2014;6(1):41–52. doi:10.2217/iim.13.74
30. Song Y, Li Y, Wang PJ, Gao Y. Contrast-enhanced ultrasonography of skeletal muscles for type 2 diabetes mellitus patients with microvascular complications. Int J Clin Exp Med. 2014;7(3):573–579.
31. Mancini M, Di Donato O, Saldalamacchia G, Liuzzi R, Rivellese A, Salvatore M. Contrast-enhanced ultrasound evaluation of peripheral microcirculation in diabetic patients: effects of cigarette smoking. Radiol Med. 2013;118(2):206–214. doi:10.1007/s11547-012-0830-x
 © 2021 The Author(s). This work is published and licensed by Dove Medical Press Limited. The
full terms of this license are available at https://www.dovepress.com/terms
and incorporate the Creative Commons Attribution
- Non Commercial (unported, 3.0) License.
By accessing the work you hereby accept the Terms. Non-commercial uses of the work are permitted
without any further permission from Dove Medical Press Limited, provided the work is properly
attributed. For permission for commercial use of this work, please see paragraphs 4.2 and 5 of our Terms.
© 2021 The Author(s). This work is published and licensed by Dove Medical Press Limited. The
full terms of this license are available at https://www.dovepress.com/terms
and incorporate the Creative Commons Attribution
- Non Commercial (unported, 3.0) License.
By accessing the work you hereby accept the Terms. Non-commercial uses of the work are permitted
without any further permission from Dove Medical Press Limited, provided the work is properly
attributed. For permission for commercial use of this work, please see paragraphs 4.2 and 5 of our Terms.