")
Back to Journals » International Journal of General Medicine » Volume 14
Assessment of Markers of Gut Integrity and Inflammation in Non-Celiac Gluten Sensitivity After a Gluten Free-Diet
Authors Dale HF , Johannessen JCH , Brønstad I, Lied GA
Received 11 August 2021
Accepted for publication 8 October 2021
Published 8 December 2021 Volume 2021:14 Pages 9459—9470
DOI https://doi.org/10.2147/IJGM.S333078
Checked for plagiarism Yes
Review by Single anonymous peer review
Peer reviewer comments 2
Editor who approved publication: Dr Scott Fraser
Hanna Fjeldheim Dale,1– 3 Julianne CH Johannessen,1 Ingeborg Brønstad,2,3 Gülen Arslan Lied1– 3
1Centre for Nutrition, Department of Clinical Medicine, University of Bergen, Bergen, Norway; 2Division of Gastroenterology, Department of Medicine, Haukeland University Hospital, Bergen, Norway; 3National Centre of Functional Gastrointestinal Disorders, Haukeland University Hospital, Bergen, Norway
Correspondence: Hanna Fjeldheim Dale
Department of Clinical Medicine, University of Bergen, Jonas Lies vei 65, Bergen, 0521, Norway
Tel + 47 98088495
Email [email protected]
Purpose: Markers for gut integrity and inflammation have received increasing interest as intestinal permeability and innate immune system activation are suggested as possible pathophysiological mechanisms in non-celiac gluten sensitivity (NCGS). We aimed to assess relevant biomarkers in NCGS by analyzing serum levels of gut integrity and permeability markers, pro-inflammatory cytokines and antigliadin IgG in patients with suspected NCGS on a gluten-free diet (GFD), and compare them to serum levels in patients with irritable bowel syndrome (IBS) and healthy controls (HC).
Patients and Methods: Serum samples collected from patients with suspected NCGS on a GFD (n=20, 14 women, 21– 62 years), IBS (n=20, 16 women, 24– 67 years) and HC (n=20, 14 women, 21– 54 years) were analyzed. IBS severity scoring system (IBS-SSS) was applied to evaluate gastrointestinal symptoms.
Results: The IBS-SSS score was higher in subjects with suspected NCGS and IBS patients compared to HC (p< 0.0001). No significant differences were found in the serum levels of any of the gut integrity and permeability markers, cytokines or antigliadin IgG antibodies between the three groups. However, positive correlations were observed between claudin-1 and i-FABP, and between claudin-1 and antigliadin IgG antibodies.
Conclusion: No differences in serum levels of gut integrity and permeability markers, pro-inflammatory cytokines or antigliadin IgG antibodies were found among patients with suspected NCGS on a GFD, IBS and HC.
Keywords: irritable bowel syndrome, gluten, permeability, pro-inflammatory cytokines
Introduction
Non-celiac gluten sensitivity (NCGS) has been defined as
a syndrome characterized by intestinal and extra-intestinal symptoms related to the ingestion of gluten-containing food, in subjects that are not affected by either celiac disease (CD) or wheat allergy. (WA)1
Individuals with NCGS show no signs of prominent enteropathy like patients suffering from CD, and serological markers of CD and WA are normal in the affected persons.1
Gluten has been shown to cause gastrointestinal (GI) symptoms, such as bloating, unsatisfactory stool consistency, abdominal pain and fatigue in sensitive persons.2 Extraintestinal symptoms like tiredness, “foggy mind”, depression, anxiety, headache, joint- and muscle pain, numbness of extremities, dermatitis or skin rash and anemia have also been reported in persons with suspected NCGS.3 However, in recent years, it has been debated whether gluten is the sole cause of the symptoms experienced by patients with NCGS. The fructans in wheat, a carbohydrate classified under the definition of fermentable oligo-, di-, monosaccharides, and polyols, commonly known as FODMAPs, as well as amylase-trypsin inhibitors and wheat germ agglutinins, have also been pointed out as possible factors contributing to the generation of symptoms in NCGS.4–6
FODMAPs are fermented by bacteria in the colon, thereby causing different GI symptoms overlapping with the symptoms seen in NCGS.7 An Italian survey on patients with suspected NCGS showed that approximately half of the patients fulfilled the Roma ІІІ criteria for IBS.3 Skodje et al showed that fructans, which are known triggers of GI symptoms in IBS patients,8,9 were the cause of symptoms in patients with self-reported NCGS and not gluten as first expected.10 Similarly, Biesiekierski et al reported that NCGS patients achieved symptom reduction after being put on a low FODMAP-diet, while they showed no specific responses to gluten provocation.5 As a result of these findings, it is still uncertain whether NCGS is a separate diagnosis or if it is a subgroup of irritable bowel syndrome (IBS) with a fructan-specific reaction.5,10–12
Given the condition’s uncertain etiology, the diagnosis is largely based on excluding other differential diagnoses, such as CD and WA. The lack of known biomarkers makes the diagnostic approach of NCGS vague. A broad range of biomarkers have been investigated, aiming to identify a marker that can be used for the diagnosis of NCGS. As impaired gut integrity and immune activation have been suggested as contributing pathophysiological factors in NCGS,13–18 pro-inflammatory cytokines and markers related to gut integrity and permeability are of particular interest. Some of the markers of permeability highlighted in recent years include zonulin family peptides (ZFP), a family of peptides that have been shown to increase intestinal permeability,19–21 lipopolysaccharide-binding protein (LBP), an acute-phase protein that binds lipopolysaccharide on microbes leading to an enhanced immune response,22 and intestinal fatty acid-binding protein (i-FABP), a cytosolic protein of epithelial cells in the intestine, which is released into the circulation upon enterocyte damage.23 In addition, occludin and claudin-1 are proteins found in tight junction complexes all over the body (including the intestinal barrier) and are found to be downregulated in CD and IBS-D.24,25
We aimed to assess whether LBP, i-FABP, ZFP, occludin, claudin-1, antigliadin IgG antibodies and/or pro-inflammatory cytokines could be relevant biomarkers in NCGS, by comparing serum levels of these markers in a group of patients with suspected NCGS on a gluten-free diet to a group of IBS patients as well as healthy controls (HC).
Patients and Methods
Study Design
The study is a descriptive population study comparing baseline samples from three different population groups. The baseline samples of patients with suspected NCGS on a gluten-free diet (GFD) (n=20) and IBS patients (n=20) were collected during two previous trials by Dale et al,11,26 while the HC (n=20) were recruited during the present study. In addition to comparing the serum levels of the mentioned markers between suspected NCGS patients, IBS patients and HC, we also compared the level of markers between the four patients who received an NCGS diagnosis and the 16 patients with suspected NCGS without a formal diagnosis. Criteria for inclusion in different groups are listed in Table 1, and the inclusion process is shown in Figure 1. The study was conducted according to the guidelines laid down in the Declaration of Helsinki and the Regional Committees for Medical and Health Research Ethics of West Norway (2019/761) approved all procedures involving human. All subjects gave written informed consent.
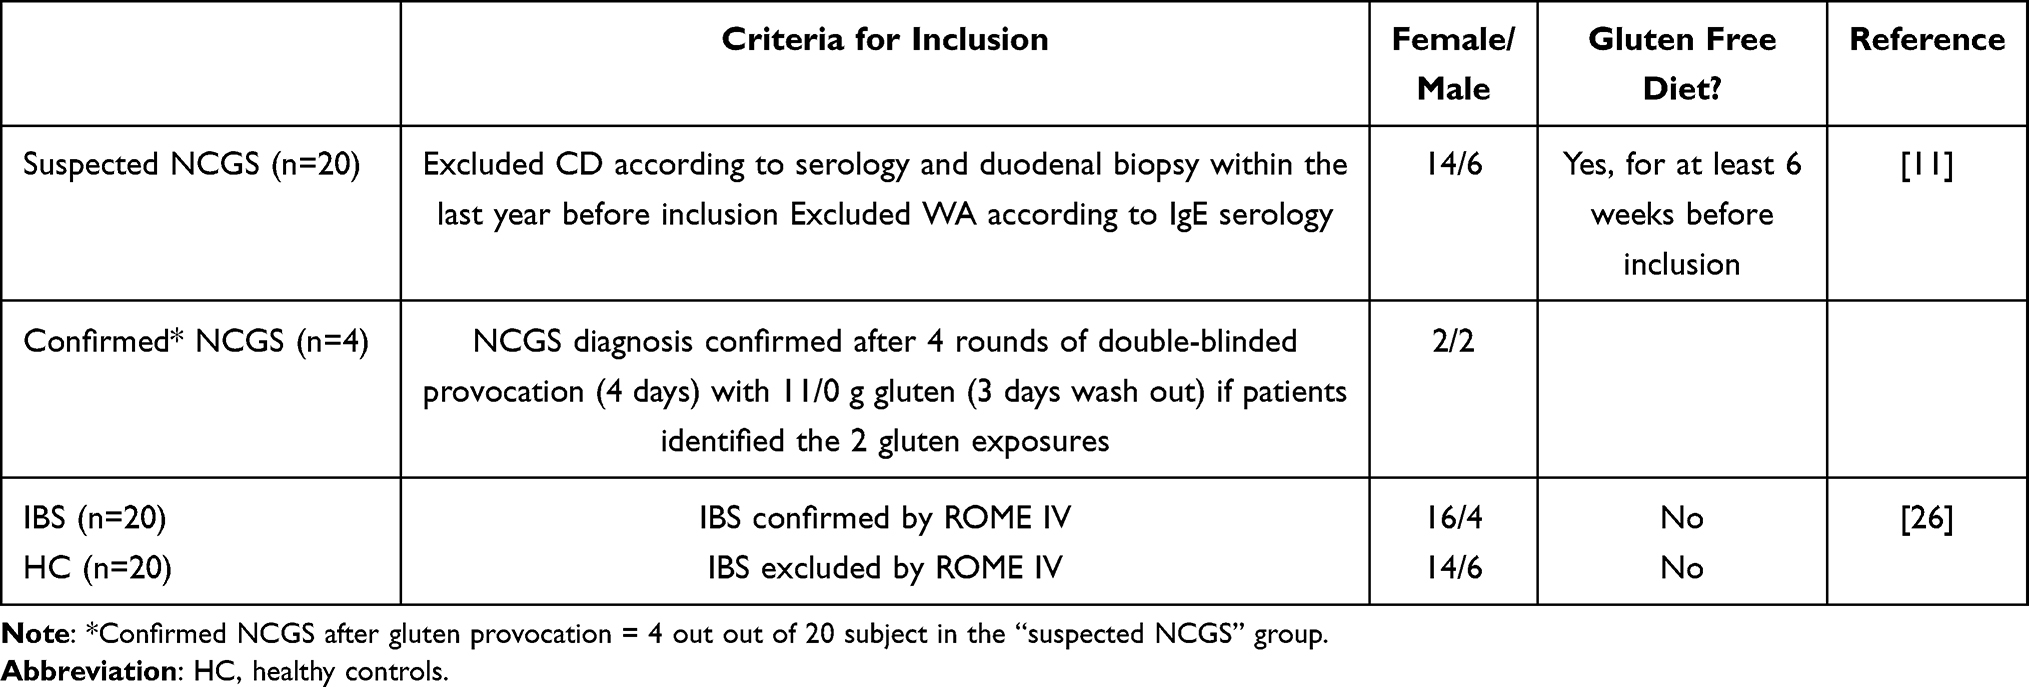 |
Table 1 Background Characteristics and Criteria of Inclusion of Different Groups Included in the Study |
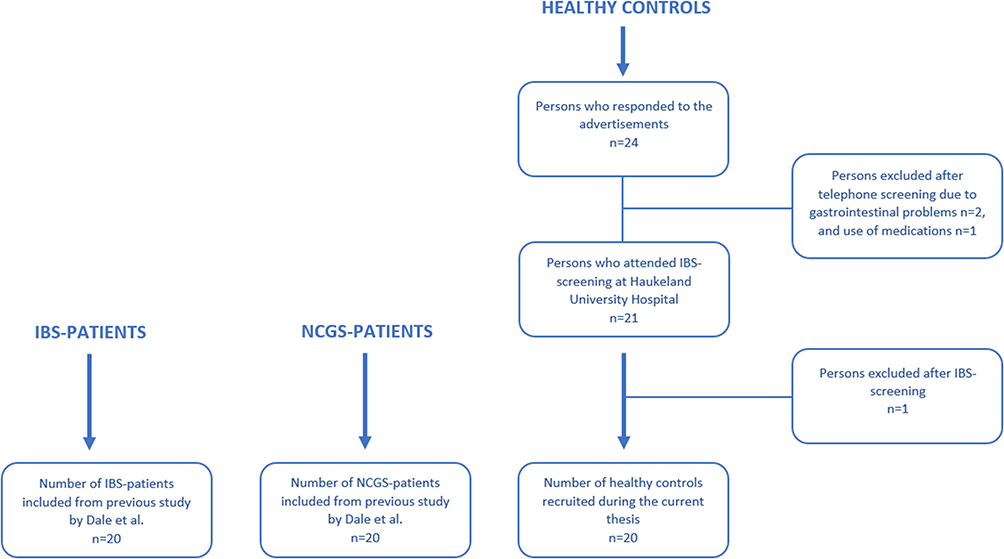 |
Figure 1 Flow chart showing included study participants. |
Patients with Suspected NCGS
Serum samples from patients with suspected NCGS on a GFD included in this study were collected in 2017 in a study by Dale et al.11 The study was a randomized, double-blinded placebo-controlled gluten challenge. After the challenge, four of the 20 patients received a formal NCGS diagnosis as they were able to identify when they received gluten and when they received a placebo in the four test periods.11 The remaining 16 study participants received no formal NCGS diagnosis after the gluten provocation and were therefore suggested to react to other food components, rather than gluten, such as the FODMAP fructans. The baseline serum samples, collected for each of the included patients in 2017, were stored at −80°C until further analysis.11 Baseline samples were taken when the subjects had been on a GFD for at least six weeks, hence do not represent the active state of disease.
Patients with Irritable Bowel Syndrome
The serum samples from IBS patients were collected during a randomized, double-blinded parallel-group trial by Dale et al in 2019.26 A written consent form was sent to the study participants prior to the present study, and 20 of the 28 IBS patients who participated in the previous trial gave written consent to the further use of their baseline serum samples in the current project. All the serum samples collected during the previous trial were stored at −80°C. None of the IBS patients followed a strict low-FODMAP diet.
Healthy Controls
Twenty HC, matched to a group of patients with suspected NCGS, were recruited for the study. Inclusion criteria were signed informed consent, age between 18 and 65 years, no chronic diseases, no known inflammatory bowel disease (IBD) or IBS. Exclusion criteria were known GI diseases/conditions (IBS, CD, IBD), other chronic diseases that affect inflammatory markers in the GI tract, the use of immunosuppressive medications, the use of antibiotics in the last three months, pregnant and/or breastfeeding women. The study participants were requested to maintain a normal diet (no gluten-free diet or low FODMAP-diet) and avoid the use of probiotics for a month preceding the blood sampling.
After giving their written consent, the controls underwent screening for IBS by using the IBS severity scoring system (IBS-SSS).27 A score between 75 and 175 indicates mild symptoms of IBS, while a score between 175 to 300 and >300 indicates moderate and severe IBS-symptoms, respectively.27 Thus, only individuals with a score lower than 75, which suggests no IBS is present, were included. Both height and weight were measured at the meeting to calculate body mass index (BMI), and three serum tubes of blood were collected.
Blood Sampling and Analyses
Blood samples for serum preparation were drawn from a peripheral vein in separator clot activator tubes. The samples were placed at room temperature for 30–60 minutes before centrifugation and centrifuged at 2000 × g for ten minutes. The serum was stored at −80°C until the analyses. All samples from the three population groups were handled similarly and analyzed simultaneously.
LBP, i-FABP, ZFP, occludin, claudin-1, and antigliadin IgG antibodies were analyzed by ELISA methods, while pro-inflammatory cytokines (IL-1β, 2, 4, 5, 6, 8, 10, tumor necrosis factor alfa (TNF-α), interferon-gamma (INF-γ), and granulocyte-macrophage colony-stimulating factor (GM-CSF)) were analyzed with a magnetic 10-plex panel (Table 2). All the analyses were conducted according to the manufacturer’s protocols.
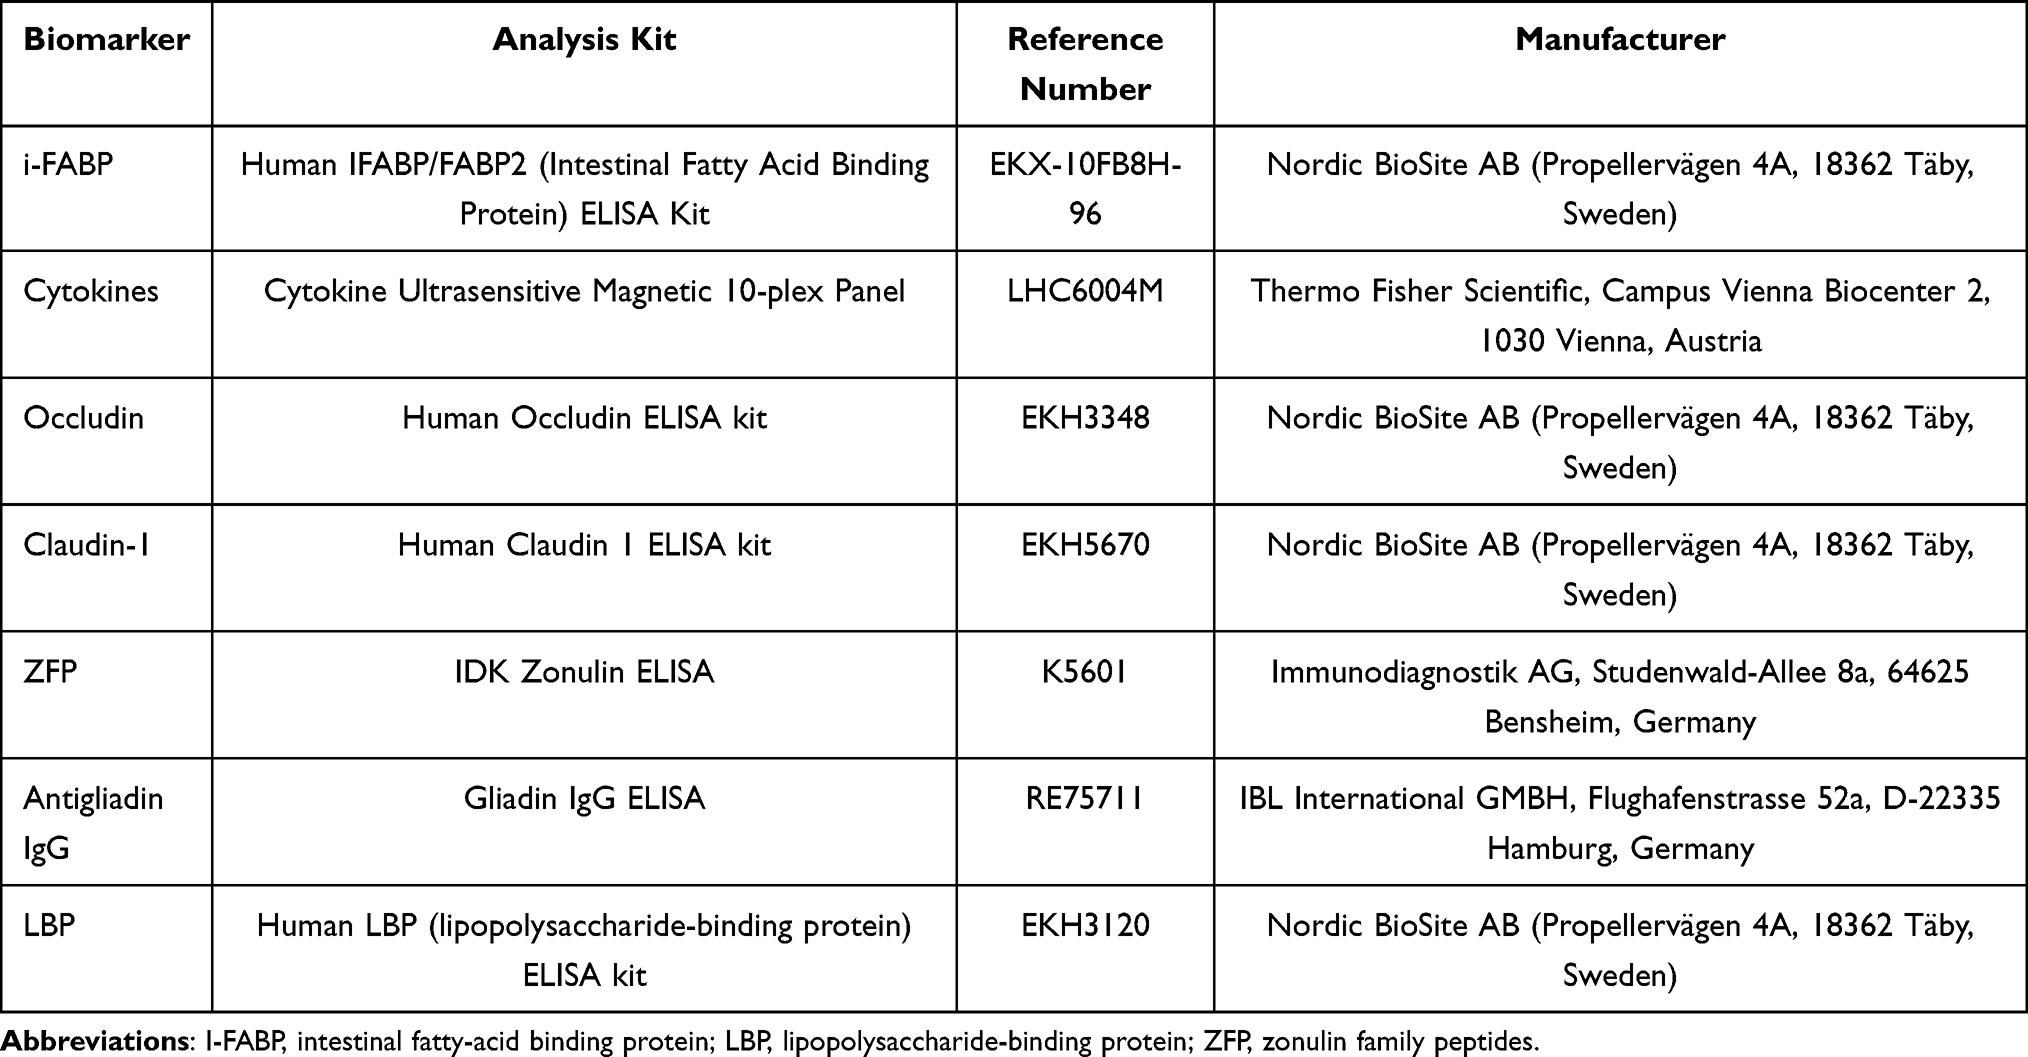 |
Table 2 List of the Various Analysis Kits Used in the Study |
Statistical Analyses
The statistical analysis was conducted in GraphPad Prism 8.0 (GraphPad Software, Inc., San Diego, CA, USA). Differences in serum markers between the groups were evaluated using one-way ANOVA or Kruskal Wallis tests (for normally and non-normally distributed data, respectively). Further, unpaired t-test or Mann–Whitney test (for normally and non-normally distributed data, respectively) were used for the comparison between the four patients diagnosed with NCGS in the previous study by Dale et al11 and the 16 undiagnosed patients with suspected NCGS. A Spearman correlation analysis was performed between the individual serum markers. P-value <0.05 was considered statistically significant.
Results
Participant Characteristics
Both individuals with suspected NCGS and the HC group had a median value of 32.0 years, while the IBS group had a median value of 40.0 years. There were no statistically significant differences in BMI between the three groups. The total IBS-SSS score was significantly higher among the individuals with suspected NCGS and the IBS patients compared to the HC group. The median total IBS-SSS score in the IBS group was 290.0, and 149.0 among persons with suspected NCGS, but the difference was not significant. 14 of the 20 participants in both the suspected-NCGS group and HC group were female, while in the IBS group 16 out of 20 were female. The baseline characteristic data is presented in Table 3.
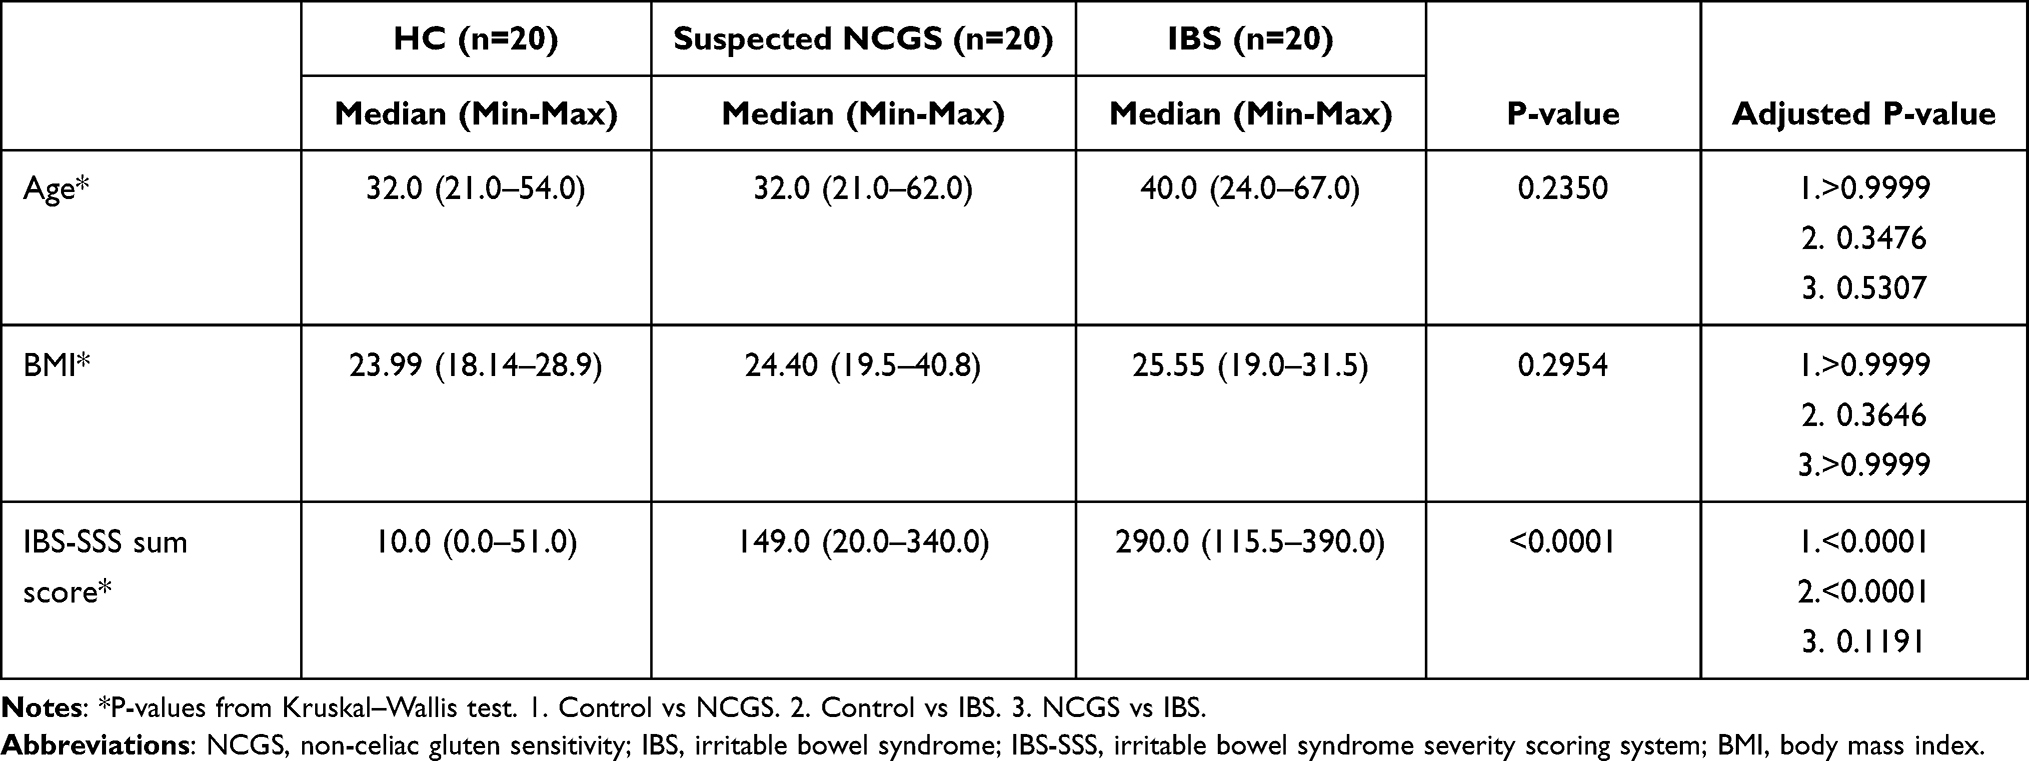 |
Table 3 Characteristics of the Three Different Groups (NCGS Patients, IBS Patients, and Healthy Controls) Included in the Study |
Gut Integrity and Permeability Markers
There were no statistically significant differences between the three groups for any of the gut integrity and permeability markers. The median serum level of ZFP was somewhat lower in the control group compared to the suspected NCGS group and IBS group (39.8 ng mL−1, 42.83 ng mL−1, and 42.5 ng mL−1, respectively). The median values of occludin, claudin-1, i-FABP and LBP, however, were all slightly higher in the HC group compared to the suspected NCGS group and IBS group (occludin: 4.56 ng mL−1, 4.24 ng mL−1, 4.26 ng mL−1; claudin-1: 0.39 ng mL−1, 0.16 ng mL−1, 0.18 ng mL−1; i-FABP: 0.8 ng mL−1, 0.77 ng mL−1, 0.65 ng mL−1; LBP: 5063 ng mL−1, 4994 ng mL−1, 4963 ng mL−1). Data for the different markers are shown in Figure 2.
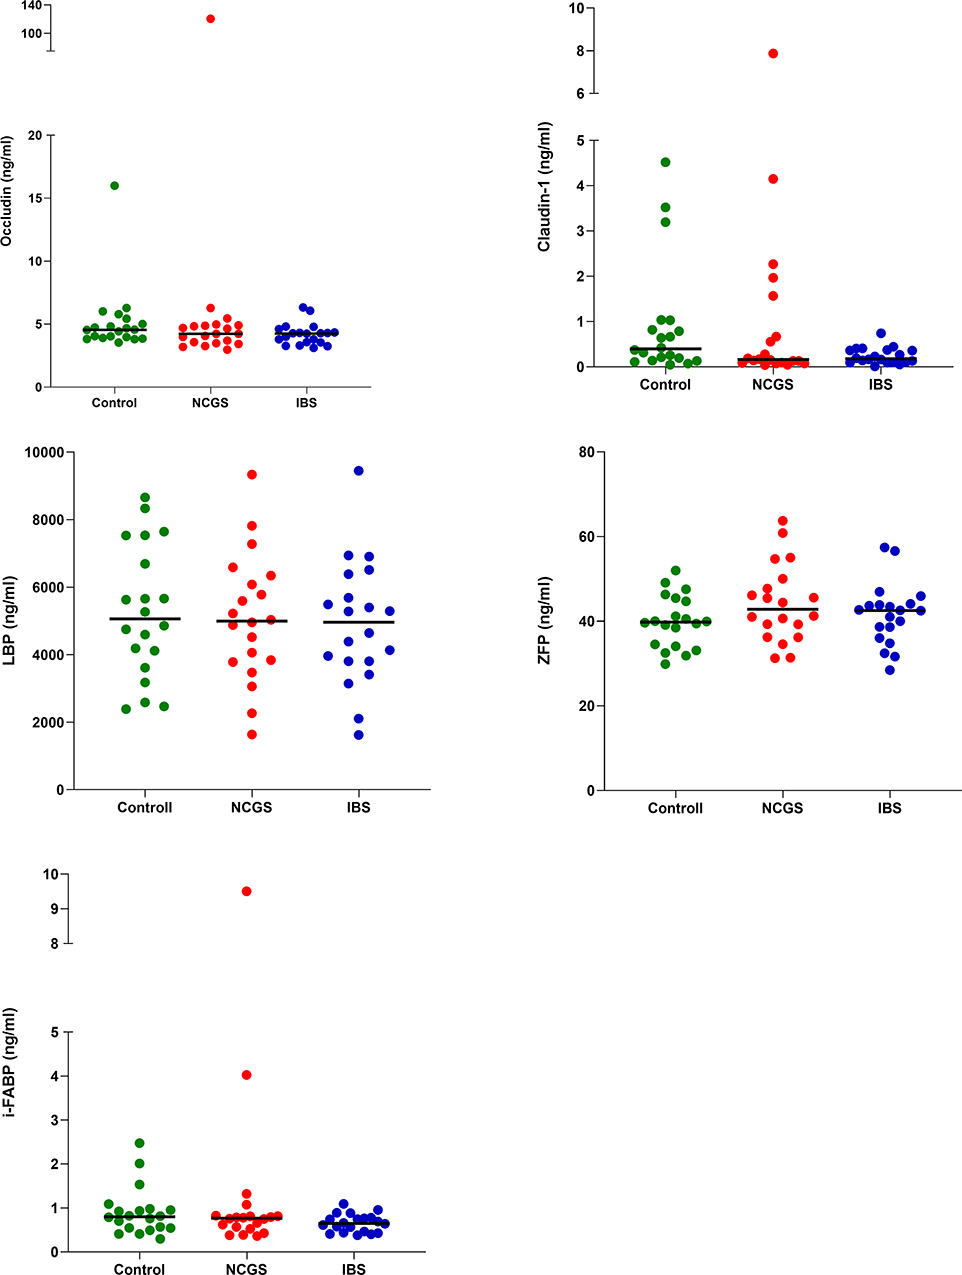 |
Figure 2 Serum levels of occludin, claudin-1, LBP, zonulin and i-FABP in the HC group (n=20), NCGS group (n=20) and IBS group (n=20). Horizontal lines show median values. |
Pro-Inflammatory Cytokines
Of the ten cytokines analyzed, we were only able to detect values for IL-8 with the magnetic 10-plex panel. Therefore, no data are reported for the other cytokines (IL-1β, 2, 4, 5, 6, 10, TNF-α, INF-γ, and GM-CSF). Median serum values of IL-8 were highest among the IBS patients (10.7 pg mL−1). Patients with suspected NCGS showed an intermediate median level of the cytokine (7.1 pg mL−1), while the controls had the lowest median level (6.1 pg mL−1). The difference in serum levels between the three groups was not statistically significant (p=0.39). The serum values of IL-8 in the three groups are illustrated in Figure 3.
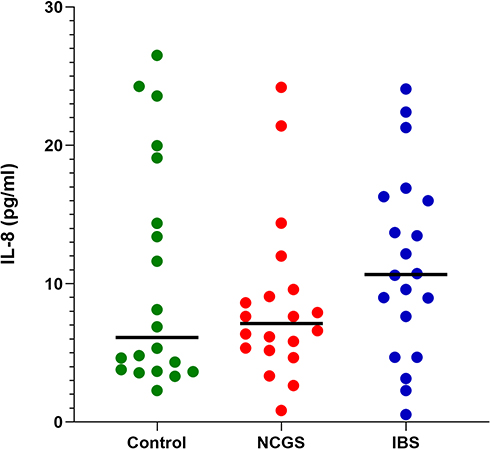 |
Figure 3 Serum levels of IL-8 in the HC group (n=20), NCGS group (n=20) and IBS group (n=20). Horizontal lines show median values. |
Serum Antigliadin IgG Antibodies Levels
The median serum level of antigliadin IgG antibodies was highest among the HC group (3.0 U mL−1). Patients with suspected NCGS showed an intermediary median-level (2.66 U mL−1), while the IBS group had the lowest median level (1.3 U mL−1). Most of the serum values were lower than the reference range of the ELISA kit (Negative cut-off <11.2 U mL−1). No statistically significant difference was observed (p=0.11). The serum levels of antigliadin IgG antibodies are illustrated in Figure 4.
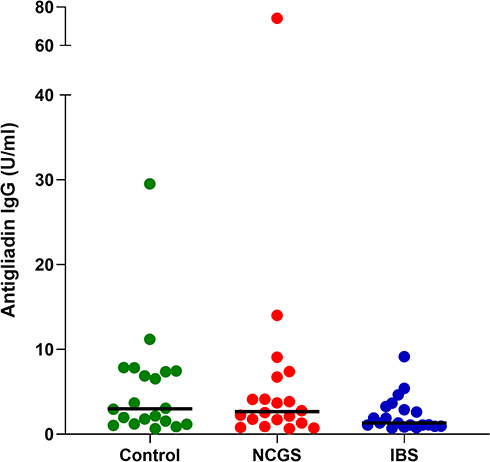 |
Figure 4 Antigliadin IgG. Serum levels in the HC group (n=20), the NCGS group (n=20) and the IBS group (n=20). Horizontal lines show median values. |
NCGS Patients
We investigated whether any differences could be observed between those individuals formerly diagnosed with NCGS and those not diagnosed with NCGS (non-NCGS) after the gluten provocation previously performed by Dale et al.11 Thus, we separated the suspected NCGS group of patients into those diagnosed with NCGS (n=4) and those without an NCGS diagnosis (n=16) based on the published results.11 When comparing the results, the NCGS diagnosed patients showed slightly higher median values of claudin-1 and LBP compared to the patients without a diagnosis (1.06 ng mL−1 vs 0.14 ng mL−1 and 5609 ng mL−1 vs 4994 ng mL−1, respectively). The patients without a diagnosis showed higher serum levels of ZFP and IL-8 than the NCGS diagnosed patients (44.93 ng mL−1 vs 35.4 ng mL−1 and 7.64 pg mL−1 vs 5.51 pg mL−1, respectively). The median levels of occludin, i-FABP, and antigliadin IgG in the diagnosed and non-diagnosed groups were 4.44 ng mL−1 vs 4.16 ng mL−1, 0.79 ng mL−1 vs 0.72 ng mL−1, and 3.33 U mL−1 vs 2.50 U mL−1, respectively. None of the differences was statistically significant. The serum levels of antigliadin IgG antibodies and IL-8, and gut integrity markers in the group with and without NCGS diagnosis are illustrated in Figures 5 and 6, respectively.
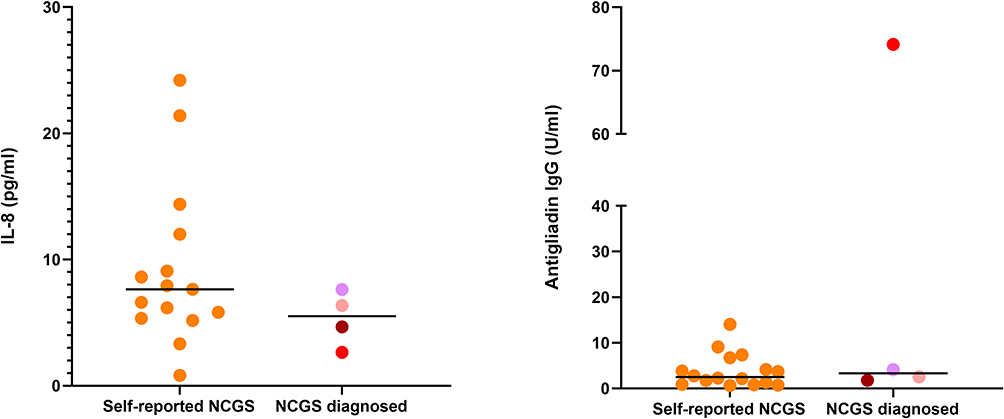 |
Figure 5 Serum levels of IL-8 and antigliadin IgG in NCGS- and non-NCGS patients. Horizontal lines show median values. Each NCGS diagnosed patient is represented by an individual colour. |
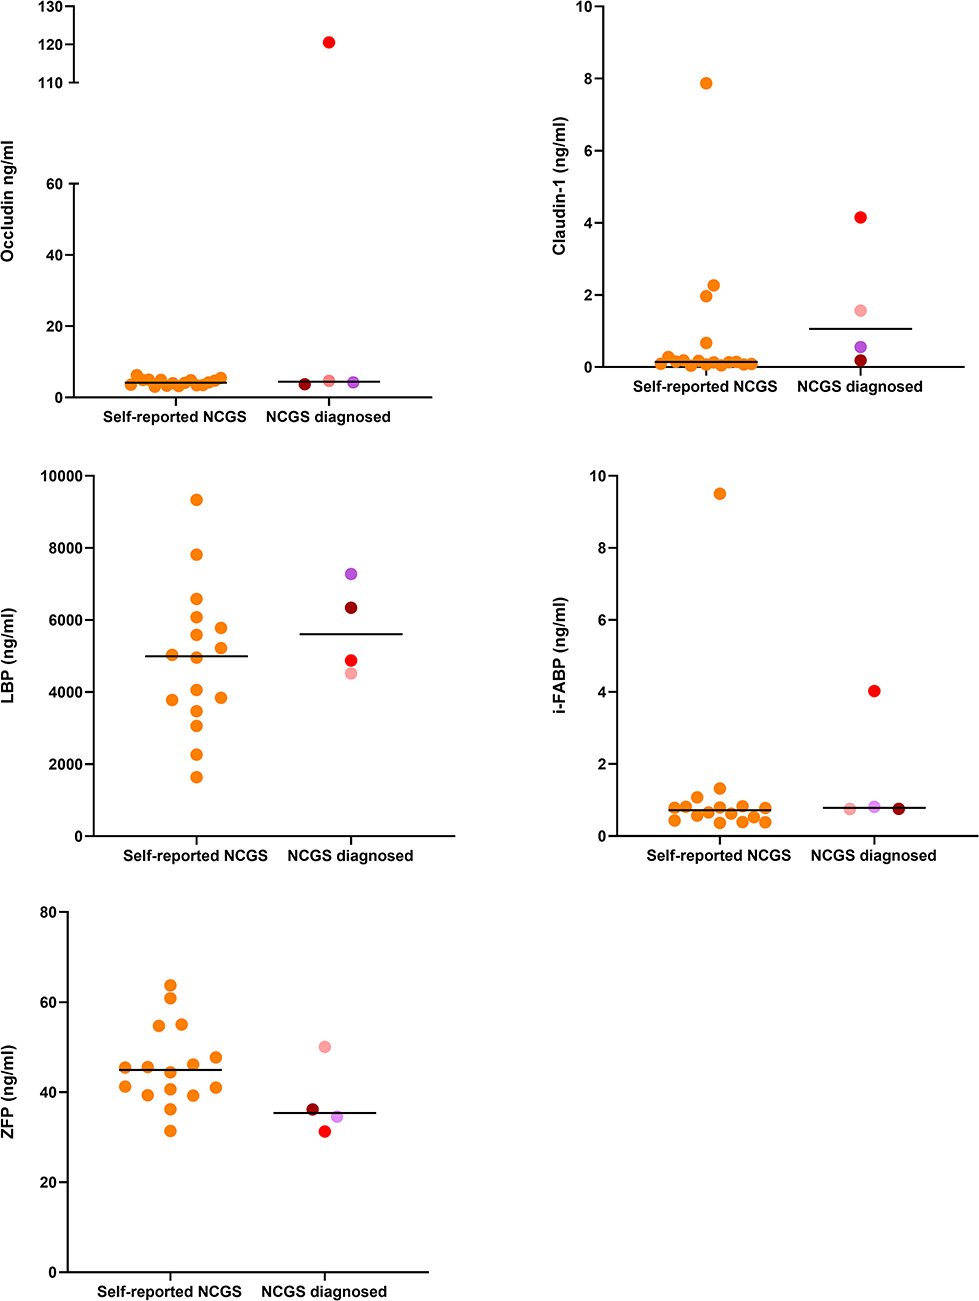 |
Figure 6 Serum levels of markers of gut integrity in NCGS- and non-NCGS patients. Horizontal lines show median values. Each NCGS diagnosed patient is represented by an individual colour. |
We also compared the serum levels of those without a formal NCGS diagnosis and those diagnosed with NCGS to the serum levels measured in the healthy controls and IBS patients. The diagnosed NCGS patients had slightly higher levels of antigliadin IgG, claudin-1 and LBP compared to the other groups, while the non-diagnosed group had the highest serum level of ZFP. When comparing the serum markers from the diagnosed and non-diagnosed NCGS group to those of IBS patients and HC, no significant differences between the groups were observed for any of the investigated markers.
Correlation Analysis
There were highly significant positive correlations between antigliadin IgG antibodies and claudin-1 (r=0.554, p=4.39*10−6), and between claudin-1 and i-FABP (r=0.687, p=1.38*10−9). A positive association between i-FABP and antigliadin IgG antibodies (r=0.347, p=0.007) was also observed. Furthermore, negative correlations were observed between occludin and LBP (r= −0.323, p=0.012) and claudin-1 and ZFP (r= −0.317, p=0.013). The correlation analysis is shown in Figure 7.
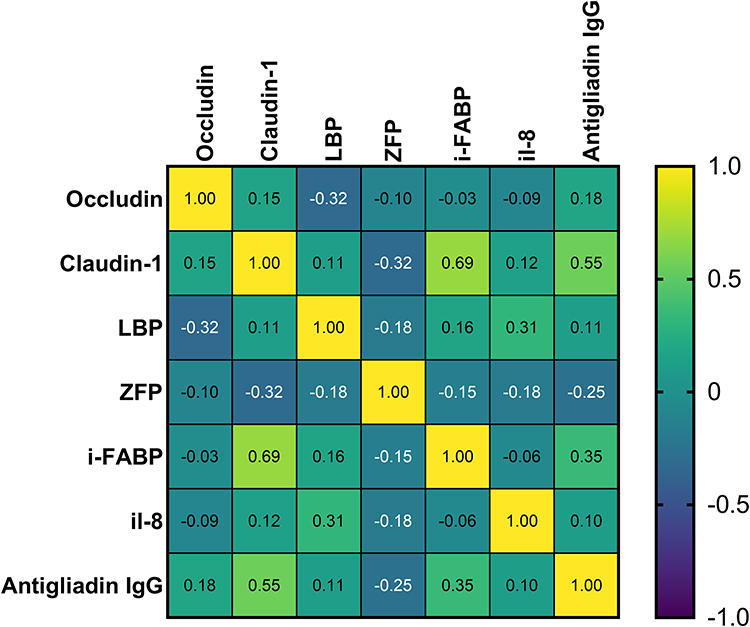 |
Figure 7 Spearman correlation analysis between the individual markers. |
Discussion
The main objective of this study was to investigate serum levels of gut integrity- and permeability markers and pro-inflammatory cytokines, in patients with suspected NCGS, IBS and HC, aiming to identify possible biomarkers for the diagnosis of NCGS. We did not detect any major differences in serum levels of the various markers between the groups, hence observed no clear findings suggesting a possible biomarker for NCGS.
Previous publications have reported conflicting results regarding detected gut integrity- and inflammatory markers in NCGS patients and IBS patients compared to healthy controls.13–18 Some of these studies have indicated that such markers may potentially serve as biomarkers for the diagnosis of NCGS. However, there is large heterogeneity in the studies performed, and for some of the markers investigated in this study, there is a lack of information when it comes to plasma or serum levels. We did not observe the same elevated serum levels of antigliadin IgG, LBP, i-FABP in patients with suspected NCGS as Uhde et al,15 nor elevated serum levels of ZFP as Barbaro et al recently reported.28
Several factors can explain these discrepancies. Patients in the trials of both Uhde et al and Barbaro et al had been eating a gluten-containing diet prior to the inclusion.15,28 The suspected NCGS patients included in our trial had been on a gluten-free diet for at least six weeks before the blood sampling and DBPCFC in 2017. This might contribute to the low serum levels for the different markers in the suspected NCGS group included in our trial. Uhde et al and Barbaro et al also investigated serum levels of LBP, i-FABP, and ZFP, antigliadin IgG antibodies, respectively, in a subset of patients after excluding wheat, barley, and rye for six months.15,28 These serum levels correspond to a greater extent with the included patients with suspected NCGS in our study. Accordingly, different serum levels of the investigated markers might have been detected if our NCGS group had been on a gluten-containing diet before the blood sampling.
Several studies have investigated the expression of occludin and claudin-1 in the intestinal tissue of patients with GI disorders,16,18,25,29 but the existing knowledge about serum or plasma levels of these markers in GI patients is scarce. Hence, our results add new knowledge to this field of research. The positive correlations between claudin-1 and the more well-characterized markers i-FABP and antigliadin IgG are highly interesting when searching for novel serological markers of CD and to understand the mechanisms of impaired gut integrity.
Some previous publications have reported increased levels of pro-inflammatory cytokines in intestinal tissue and immune cells in patients with NCGS.14,29 We did not detect an increased level of such markers in serum samples from NCGS patients compared to IBS patients. The only marker we were able to detect was IL-8, and the serum values of the IBS patients and NCGS patients largely coincided with the serum values from the healthy controls. A study from 2013 investigating serum levels of a broad range of cytokines in three age groups of healthy subjects reported median serum level of IL-8 around 30.9 pg mL−1, 32.6 pg mL−1, and 29.3 pg mL−1 in children aged 1–6 years, 7–17 years and grown-ups 18+, respectively.30 The median levels of IL-8 observed in our study were all lower than these values. This emphasizes that the serum levels of IL-8 detected in the control-, NCGS- and IBS group are not different from the values found in people with normal GI function. Of note, it has to be highlighted that differences in the analysis method between studies make the values challenging to compare, as this might affect the results.
Due to the observed effects of the DBPCFC conducted on this patient group by Dale et al,11 we chose to split the patients with suspected NCGS to compare those who were formally diagnosed with NCGS (n=4) to the non-diagnosed NCGS patients (n=16). This sub-analysis is based on groups with too few subjects to achieve results with any statistical power. However, the analysis was included as we aimed to investigate any possible, differing trends in the level of markers between those who received and those who did not receive an NCGS diagnosis.
Dale et al reported that patients with suspected NCGS experienced an increase in severity of symptoms that did not coincide with when they received gluten during the DBPCFC.11 Overall, the NCGS group in total had an increase in IBS-SSS score from baseline to after placebo (baseline: 170.0 ± 104.1, after placebo: 219.6 ± 102.6, P = 0.023), whereas the after-gluten scores (186.7± 110.3) were comparable to the baseline scores, indicating a response to other things than gluten in particular. The four patients who received the diagnosis after the DBPCFC had generally higher IBS-SSS symptom scores both at baseline (233.8 ± 58.2) and after placebo- (258.1 ± 102.9) and gluten-provocation (259.4 ± 62.6) than the group who did not receive the diagnosis (baseline: 154.6 ± 108.2, after gluten: 158.8 ± 109.3, after placebo: 203.4 ± 98.8) but the group is too small to draw any conclusions.11
Thus, the authors concluded that food components other than gluten could be responsible for the high baseline symptom scores among the patients.11 This questions whether the diagnosis the four patients received is correct, or whether it is a coincidence that they were able to correctly identify when they received gluten.
Overall, our results suggest that the symptoms experienced by the patients with suspected NCGS and IBS patients cannot be related to the serum values of the markers analyzed in the present study. We will also draw the attention that the NCGS patients had been on a gluten-free diet for a minimum of six weeks before the baseline blood sampling, and so their high median symptom score was not related to gluten consumption.
In hindsight, given the findings in other studies and our results, we should have included another NCGS group where the participants were on a normal diet without restricting wheat, barley and rye. We would then have been able to examine whether the serum levels of the various markers are affected by a gluten-containing diet by comparing it with the serum levels of the already included patients with suspected NCGS who were on a gluten-free diet. This is arguably a weakness of the current study. However, as it is not known if the investigated markers are effected by gluten intake, we believe our results are of relevance despite this methodological weakness. In addition, it has to be highlighted that the samples from the three groups compared in the current study were collected at different time points. The difference in storage time was up to 3 years of storage between the NCGS group and the control group. Different storage time of the samples can have affected the analysis results, all though all samples were stored at −80 degrees.
The theories about abnormal gut permeability in NCGS are largely based on studies of cell cultures and intestinal tissue samples.18,31 Thus, it is not certain that the analysis of serum levels is a suitable method for the detection of the investigated gut integrity markers.32 However, searching for potential circulating biomarkers is of importance as an alternative to more invasive sampling methods for proper diagnosis.
More precise guidelines on the existing diagnostic methods could make it easier to compare various DBPCFC studies. The meta-analysis by Molina-Infante et al revealed a large heterogeneity in how the DBPCFCs were organized in previously conducted trials, and also many discrepancies when it came to following the Salerno Experts recommendations.33 Thus, future studies should strive to follow the recommendations from the Expert committee to achieve more comparable results.
Additionally, it is still not clear whether NCGS is a separate diagnosis or if it is a subgroup of IBS. More information on possible biomarkers could contribute both to a greater understanding of the pathophysiological mechanisms behind the condition and, hopefully, provide more accurate diagnostic methods that can shed more light on the assumed relationship between the two conditions. Thus, future studies should investigate the possible biomarkers of NCGS in larger patient groups.
In conclusion, we did not find any differences in serum levels of gut integrity and permeability markers, including pro-inflammatory cytokines among patients with NCGS, IBS, and healthy controls. Neither, no differences were observed between the serum levels of antigliadin IgG in the three groups. Further, studies with larger patient groups are required to evaluate whether the investigated markers can be used as a tool to separate diagnosed NCGS from self-reported NCGS or IBS to achieve a correct diagnosis.
Author Contributions
All authors made a significant contribution to the work reported, whether that is in the conception, study design, execution, acquisition of data, analysis and interpretation, or in all these areas; took part in drafting, revising or critically reviewing the article; gave final approval of the version to be published; have agreed on the journal to which the article has been submitted; and agree to be accountable for all aspects of the work.
Disclosure
The authors report no conflicts of interest in this work.
References
1. Catassi C, Elli L, Bonaz B, et al. Diagnosis of Non-Celiac Gluten Sensitivity (NCGS): the salerno experts’ criteria. Nutrients. 2015;7(6):4966–4977. doi:10.3390/nu7064966
2. Biesiekierski RJ, Newnham DE, Irving MP, et al. Gluten causes gastrointestinal symptoms in subjects without celiac disease: a double-blind randomized placebo-controlled trial. Am J Gastroenterol. 2011;106(3):508–514. doi:10.1038/ajg.2010.487
3. Volta U, Bardella MT, CalabrA A, Troncone R, Corazza GR. An Italian prospective multicenter survey on patients suspected of having non-celiac gluten sensitivity. BMC Med. 2014;12(1). doi:10.1186/1741-7015-12-85
4. Junker Y, Zeissig S, Kim S-J, et al. Wheat amylase trypsin inhibitors drive intestinal inflammation via activation of toll-like receptor 4. J Exp Med. 2012;209:13. doi:10.1084/jem.20102660
5. Biesiekierski JR, Peters SL, Newnham ED, Rosella O, Muir JG, Gibson PR. No effects of gluten in patients with self-reported non-celiac gluten sensitivity after dietary reduction of fermentable, poorly absorbed, short-chain carbohydrates. Gastroenterology. 2013;145(2):320–328.e323. doi:10.1053/j.gastro.2013.04.051
6. Pellegrina CD, Perbellini O, Scupoli MT, et al. Effects of wheat germ agglutinin on human gastrointestinal epithelium: insights from an experimental model of immune/epithelial cell interaction. Toxicol Appl Pharmacol. 2009;237(2):146–153. doi:10.1016/j.taap.2009.03.012
7. Elli L, Roncoroni L, Bardella MT. Non-celiac gluten sensitivity: time for sifting the grain. World J Gastroenterol. 2015;21(27):8221. doi:10.3748/wjg.v21.i27.8221
8. Halmos EP, Power VA, Shepherd SJ, Gibson PR, Muir JG, Diet A. Low in FODMAPs reduces symptoms of irritable bowel syndrome. Gastroenterology. 2014;146(1):67–75.e65. doi:10.1053/j.gastro.2013.09.046
9. Barrett JS, Gearry RB, Muir JG, et al. Dietary poorly absorbed, short-chain carbohydrates increase delivery of water and fermentable substrates to the proximal colon. (Clinical report). Aliment Pharmacol Ther. 2010;31(8):874.
10. Skodje GI, Sarna VK, Minelle IH, et al. Fructan, rather than gluten, induces symptoms in patients with self-reported non-celiac gluten sensitivity. Gastroenterology. 2018;154(3):529–539.e522. doi:10.1053/j.gastro.2017.10.040
11. Dale HF, Hatlebakk JG, Hovdenak N, Ystad SO, Lied GA. The effect of a controlled gluten challenge in a group of patients with suspected non‐coeliac gluten sensitivity: a randomized, double‐blind placebo‐controlled challenge. Neurogastroenterol Motility. 2018;30(8):
12. Vazquez-Roque M, Oxentenko A. Nonceliac Gluten Sensitivity. Mayo Clin Proc. 2015;90(9):1272–1277. doi:10.1016/j.mayocp.2015.07.009
13. Carroccio A, Giannone G, Mansueto P, et al. Duodenal and rectal mucosa inflammation in patients with non-celiac wheat sensitivity. Clin Gastroenterol Hepatol. 2019;17(4):682–690.e683. doi:10.1016/j.cgh.2018.08.043
14. Margit B, Ann-Christin RB, Stig T, et al. Mucosal cytokine response after short-term gluten challenge in celiac disease and non-celiac gluten sensitivity. Am J Gastroenterol. 2013;108(5):842. doi:10.1038/ajg.2013.91
15. Uhde M, Ajamian M, Caio G, et al. Intestinal cell damage and systemic immune activation in individuals reporting sensitivity to wheat in the absence of coeliac disease. Gut. 2016;65(12):1930–1937. doi:10.1136/gutjnl-2016-311964
16. Fritscher-Ravens A, Pflaum T, Mösinger M, et al. Many patients with irritable bowel syndrome have atypical food allergies not associated with immunoglobulin E. Gastroenterology. 2019;157(1):109–118.e105. doi:10.1053/j.gastro.2019.03.046
17. Barbaro M, Cremon C, Caio G, et al. Zonulin serum levels are increased in non-celiac gluten sensitivity and irritable bowel syndrome with diarrhea. Gastroenterology. 2015;148(4):S56–S56. doi:10.1016/S0016-5085(15)30192-X
18. Sapone A, Lammers K, Casolaro V, et al. Divergence of gut permeability and mucosal immune gene expression in two gluten-associated conditions: celiac disease and gluten sensitivity. BMC Med. 2011;9:23. doi:10.1186/1741-7015-9-23
19. Wang W, Uzzau S, Goldblum SE, Fasano A. Human zonulin, a potential modulator of intestinal tight junctions. J Cell Sci. 2000;113(Pt 24):4435. doi:10.1242/jcs.113.24.4435
20. Lammers KM, Lu R, Brownley J, et al. Gliadin induces an increase in intestinal permeability and zonulin release by binding to the chemokine receptor CXCR3. Gastroenterology. 2008;135(1):194–204.e193. doi:10.1053/j.gastro.2008.03.023
21. Fasano A. All disease begins in the (leaky) gut: role of zonulin-mediated gut permeability in the pathogenesis of some chronic inflammatory diseases. F1000Res. 2020;9:69. doi:10.12688/f1000research.20510.1
22. Schumann RR. Function of lipopolysaccharide (LPS)-binding protein (LBP) and CD14, the receptor for LPS/LBP complexes: a short review. Res Immunol. 1992;143(1):11–15. doi:10.1016/0923-2494(92)80074-U
23. Adriaanse MP, Tack GJ, Passos VL, et al. Serum I-FABP as marker for enterocyte damage in coeliac disease and its relation to villous atrophy and circulating autoantibodies. Aliment Pharmacol Ther. 2013;37(4):482–490. doi:10.1111/apt.12194
24. Cardoso-Silva D, Delbue D, Itzlinger A, et al. Intestinal barrier function in gluten-related disorders. Nutrients. 2019;11(10):2325. doi:10.3390/nu11102325
25. Barmeyer C, Schulzke JD, Fromm M. Claudin-related intestinal diseases. Semin Cell Dev Biol. 2015;42:30–38. doi:10.1016/j.semcdb.2015.05.006
26. Dale HF, Jensen C, Hausken T, Valeur J, Hoff DAL, Lied GA. Effects of a cod protein hydrolysate supplement on symptoms, gut integrity markers and fecal fermentation in patients with irritable bowel syndrome. Nutrients. 2019;11(7):1635. doi:10.3390/nu11071635
27. Francis CY, Morris J, Whorwell PJ. The irritable bowel severity scoring system: a simple method of monitoring irritable bowel syndrome and its progress. Aliment Pharmacol Ther. 1997;11(2):395–402. doi:10.1046/j.1365-2036.1997.142318000.x
28. Barbaro MR, Cremon C, Morselli-Labate AM, et al. Serum zonulin and its diagnostic performance in non-coeliac gluten sensitivity. Gut. 2020;69(11):1966–1974. doi:10.1136/gutjnl-2019-319281
29. Vazquez–Roque MI, Camilleri M, Smyrk T, et al. A controlled trial of gluten-free diet in patients with irritable bowel syndrome-diarrhea: effects on bowel frequency and intestinal function. Gastroenterology. 2013;144(5):903–911.e903. doi:10.1053/j.gastro.2013.01.049
30. Kleiner G, Marcuzzi A, Zanin V, Monasta L, Zauli G. Cytokine levels in the serum of healthy subjects. Mediators Inflamm. 2013;2013:434010. doi:10.1155/2013/434010
31. Justin H, Elaine Leonard P, Bruce G, Eric G, Anthony G, Alessio F. Effect of gliadin on permeability of intestinal biopsy explants from celiac disease patients and patients with non-celiac gluten sensitivity. Nutrients. 2015;7(3):1565–1576. doi:10.3390/nu7031565
32. Lau E, Marques C, Pestana D, et al. The role of I-FABP as a biomarker of intestinal barrier dysfunction driven by gut microbiota changes in obesity. Nutr Metab. 2016;13:31. doi:10.1186/s12986-016-0089-7
33. Molina-Infante J, Carroccio A. Suspected nonceliac gluten sensitivity confirmed in few patients after gluten challenge in double-blind, placebo-controlled trials. Clin Gastroenterol Hepatol. 2017;15(3):339–348. doi:10.1016/j.cgh.2016.08.007
 © 2021 The Author(s). This work is published and licensed by Dove Medical Press Limited. The full terms of this license are available at https://www.dovepress.com/terms.php and incorporate the Creative Commons Attribution - Non Commercial (unported, v3.0) License.
By accessing the work you hereby accept the Terms. Non-commercial uses of the work are permitted without any further permission from Dove Medical Press Limited, provided the work is properly attributed. For permission for commercial use of this work, please see paragraphs 4.2 and 5 of our Terms.
© 2021 The Author(s). This work is published and licensed by Dove Medical Press Limited. The full terms of this license are available at https://www.dovepress.com/terms.php and incorporate the Creative Commons Attribution - Non Commercial (unported, v3.0) License.
By accessing the work you hereby accept the Terms. Non-commercial uses of the work are permitted without any further permission from Dove Medical Press Limited, provided the work is properly attributed. For permission for commercial use of this work, please see paragraphs 4.2 and 5 of our Terms.