Back to Journals » International Journal of Chronic Obstructive Pulmonary Disease » Volume 14
Assessment Of Changes In Regional Xenon-Ventilation, Perfusion, And Ventilation-Perfusion Mismatch Using Dual-Energy Computed Tomography After Pharmacological Treatment In Patients With Chronic Obstructive Pulmonary Disease: Visual And Quantitative Analysis
Authors Hwang HJ ![]() , Lee SM
, Lee SM ![]() , Seo JB
, Seo JB ![]() , Lee JS
, Lee JS ![]() , Kim N
, Kim N ![]() , Kim C, Oh SY, Lee SW
, Kim C, Oh SY, Lee SW
Received 29 March 2019
Accepted for publication 5 September 2019
Published 25 September 2019 Volume 2019:14 Pages 2195—2203
DOI https://doi.org/10.2147/COPD.S210555
Checked for plagiarism Yes
Review by Single anonymous peer review
Peer reviewer comments 2
Editor who approved publication: Prof. Dr. Richard Russell
Hye Jeon Hwang,1 Sang Min Lee,1 Joon Beom Seo,1 Jae Seung Lee,2 Namkug Kim,1 Cherry Kim,3 Sang Young Oh,1 Sei Won Lee2
1Department of Radiology and Research Institute of Radiology, Asan Medical Center, University of Ulsan College of Medicine, Songpa-Gu, Seoul 138-736, South Korea; 2Department of Pulmonary and Critical Care Medicine, Clinical Research Center for Chronic Obstructive Airway Diseases, Asan Medical Center, University of Ulsan College of Medicine, Songpa-Gu, Seoul 138-736, South Korea; 3Department of Radiology, Ansan Hospital, Korea University College of Medicine, Danwon-gu, Ansan-si, Gyeonggi-do, Korea
Correspondence: Sang Min Lee
Department of Radiology and Research Institute of Radiology, University of Ulsan College of Medicine, Asan Medical Center, 86 Asanbyeongwon-Gil, Songpa-Gu, Seoul 138-736, South Korea
Tel +82 2 3010 5766
Fax +82 2 476 4719
Email [email protected]
Purpose: To assess changes in regional ventilation (V), perfusion (Q), and V-Q mismatch in patients with chronic obstructive pulmonary disease (COPD) after pharmacologic treatment using combined xenon-enhanced V and iodine-enhanced Q dual-energy CT (DECT).
Patients and methods: Combined V and Q DECT were performed at baseline and after three-month pharmacologic treatment in 52 COPD patients. Anatomically co-registered virtual non-contrast images, V, Q, and V/Qratio maps were obtained. V/Q pattern was visually determined to be matched, mismatched, or reversed-mismatched and compared with the regional parenchymal disease patterns of each segment. DECT parameters for V, Q, and V-Q imbalance were quantified.
Results: The parenchymal patterns on CT were not changed at follow-up. The segments with matched V/Q pattern were increased (80.2% to 83.6%) as the segments with reversed-mismatched V/Q pattern were decreased with improving ventilation (17.6% to 13.8%) after treatment. Changes of V/Q patterns were mostly observed in segments with bronchial wall thickening. Compared with patients without bronchial wall thickening, the quantified DECT parameters of V-Q imbalance were significantly improved in patients with bronchial wall thickening (p < 0.05). Changes in forced expiratory volume in one second after treatment were correlated with changes in the quantified DECT parameters (r = 0.327–0.342 or r = −0.406 and −0.303; p < 0.05).
Conclusion: DECT analysis showed that the V-Q imbalance was improved after the pharmacological treatment in COPD patients, although the parenchymal disease patterns remained unchanged. This improvement of V-Q imbalance may occur mostly in the areas with bronchial wall thickening.
Keywords: chronic obstructive pulmonary disease, dual-energy computed tomography, ventilation-perfusion mismatch, pharmacotherapy
Introduction
Chronic obstructive pulmonary disease (COPD) is characterized by persistent airflow limitation,1–4 and pulmonary vascular changes are accompanied.5 These changes may lead to changes in pulmonary ventilation and perfusion as well as structural changes. Therefore, the comprehensive evaluation of structural and physiological changes of the lung may be important in COPD patients. Dual-energy CT (DECT) can provide high-resolution anatomic information and pulmonary perfusion or ventilation concurrently using the material decomposition theory. Investigators have reported the usefulness of DECT for assessing ventilation or perfusion in patients with various lung diseases, including COPD.6–9 Furthermore, the feasibility of combined ventilation and perfusion imaging with DECT for assessing regional ventilation, perfusion, and ventilation-perfusion mismatch in COPD patients has been reported in previous study.10
The imbalance of alveolar ventilation and perfusion from progressive airflow limitation and emphysema is the leading cause of hypoxemia in COPD.11,12 Hypoxemia in COPD may contribute to diminished quality of life, reduced exercise tolerance, and other adverse sequelae.13 In COPD patients, pharmacologic treatment is used to reduce symptoms and exacerbation of the disease, and to improve health condition and exercise tolerance. Pharmacologic treatment, such as bronchodilator may also affect ventilation-perfusion imbalances. However, it has not been documented at a morphologic level how pharmacologic treatment may affect the regional ventilation and perfusion status, and its imbalance in COPD patients.
The purpose of our study was to assess the changes of regional ventilation and the perfusion status and ventilation-perfusion mismatch in COPD patients after pharmacologic treatment using combined xenon-enhanced ventilation and iodine-enhanced perfusion DECT.
Materials And Methods
Patients
This prospective study was approved by institutional review board of Asan Medical Center (2012–0101) and all procedures were conducted according to the Declaration of Helsinki. Fifty-two male patients with COPD (mean age, 66.9 years; range, 50–82 years) were recruited from the pulmonology clinic from May 2012 to August 2014. Written informed consent was obtained after a full explanation of the study, and disclosure of their clinical information. Among the 52 patients, 21 patients were identical to the study population in the previous report.10
DECT, pulmonary function tests (PFT), six-minute walk distance test (6MWT), and COPD Assessment Test (CAT) questionnaire were obtained at baseline and after three months of pharmacologic treatment. These exams were performed on the same day. The baseline studies were performed after discontinuing the used medication (1-week inhaled corticosteroids (ICS)/long-acting beta2-agonist (LABA) combinations discontinuation, 2-day long-acting muscarinic antagonist (LAMA) discontinuation, or 12 hr inhaled short-acting beta2-agonist discontinuation). After performing baseline studies, all patients were treated with medication (an inhaled LAMA and/or ICS/LABA combinations) in order to maximize the pharmacological treatment effect for three months.
Xenon Ventilation And Iodine Perfusion DECT And Postprocessing
Patients inhaled 30% stable xenon using a xenon gas inhalation system (Zetron V; Anzai Medical, Tokyo, Japan). We monitored xenon concentration in the inhaled and exhaled gas. After the concentration of xenon in the exhaled gas reached 25%, CT scans that covered the full thorax were performed using the SOMATOM Flash CT (Siemens Healthcare, Forchheim, Germany) (55/130 eff. mA at sn140/80 kV). After the ventilation CT scan, patients inhaled the room air for 10 mins to remove the xenon gas from their lungs. Then after administration of a contrast agent, contrast-enhanced perfusion CT was performed covering the full thorax using same CT scanner (89/210 eff. mAs at sn140/80 kV). A fixed scan delay of 30 seconds was used (Figure S1, Supplementary Information). Virtual non-contrast (VNC) images, ventilation and perfusion maps were obtained using Syngo Dual Energy (Siemens Healthcare). To obtain anatomic matches, ventilation CT of follow-up and perfusion CT of baseline and follow-up images were coregistered to ventilation CT images at baseline by an automatic non-rigid registration method of our in-house software.14 Registered maps were generated by using this registration information. For evaluation of the ventilation-perfusion imbalance with V/Qratio, normalization of the xenon attenuation value (V) and the iodine attenuation value (Q) were performed and the normalized V, Q, and V/Qratio maps were generated.10 A detailed description about CT protocol and postprocessing can be found in Appendix S1 and S2 (Supplementary Information).
Visual Analysis
CT images were visually analyzed in consensus by two chest radiologists (S.M.L. and H.J.H. with 10 and eight years of experience in thoracic radiology, respectively). The four axial images sets (VNC image of ventilation CT and co-registered V, Q, and V/Qratio maps) of CT exam was simultaneously displayed using in-house software, and baseline and follow-up CT images were analyzed separately (Figures 1A, B and 2A, B). Image sets were analyzed on a per-segment basis, and 20 segments (ie, right upper lobe: apical, posterior, and anterior segments; right middle lobe: lateral and medial segments; right lower lobe: superior, medial, anterior, lateral, and posterior basal segments; left upper lobe: apicoposterior, anterior, superior lingular, and inferior lingular segments; left lower lobe: superior, anteromedial, lateral, and posterior basal segments) were evaluated in each patient. The regional parenchymal patterns were determined in each segment on VNC images of baseline and follow-up, respectively: (1) normal-looking lung; (2) bronchial wall thickening with or without emphysema; and (3) emphysema. V/Q patterns of each segment on the V/Qratio map of baseline and follow-up were determined: (1) matched V/Q; (2) mismatched V/Q; or (3) reversed-mismatched V/Q.10 The V/Q patterns were defined as follows: (1) matched V/Q having a quantified V/Qratio in the range of −1.0 to +1.0; (2) mismatched V/Q having a quantified V/Qratio above 1.0; and (3) reversed mismatched V/Q having a quantified V/Qratio below 1.0. The V/Qratio pattern was visually determined by the radiologists, but in conjunction with the quantified values of V/Qratio map.
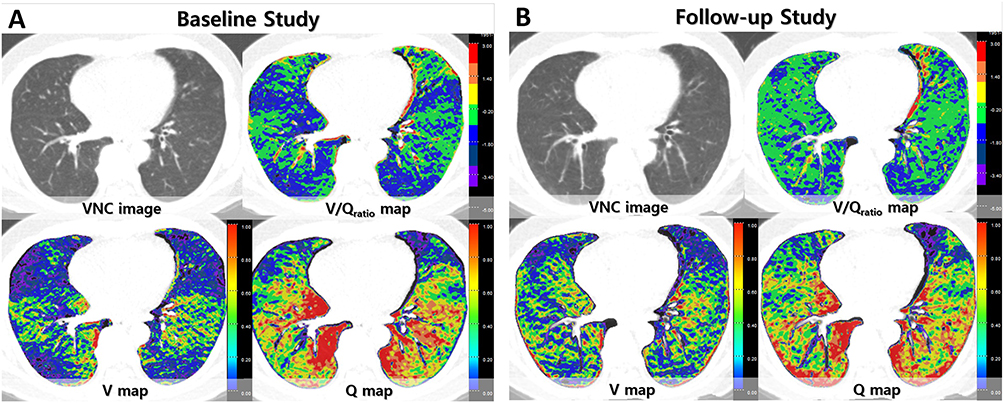 |
Figure 1 A 63-year-old male COPD patient. The sets of four axial images of baseline and follow-up are simultaneously displayed and evaluated using in-house software. On VNC images, mild centrilobular emphysema and bronchial wall thickening is noted. (A) Ventilation is decreased in right middle lobe, both lower lobes, and lingula of left upper lobe, while perfusion is relatively preserved resulting in the reversed V/Q pattern on the V/Qratio map on baseline study. (B) On follow-up images after three months of pharmacologic treatment, the V/Q patterns on V/Q map in these areas are shown as the matched V/Q pattern with improved ventilation. In this patient, quantified V was increased from 0.438 to 0.539 and quantified V/Qratio was increased from −0.981 to −0.473. FEV1 was improved by 0.58 L in this patient on follow-up. |
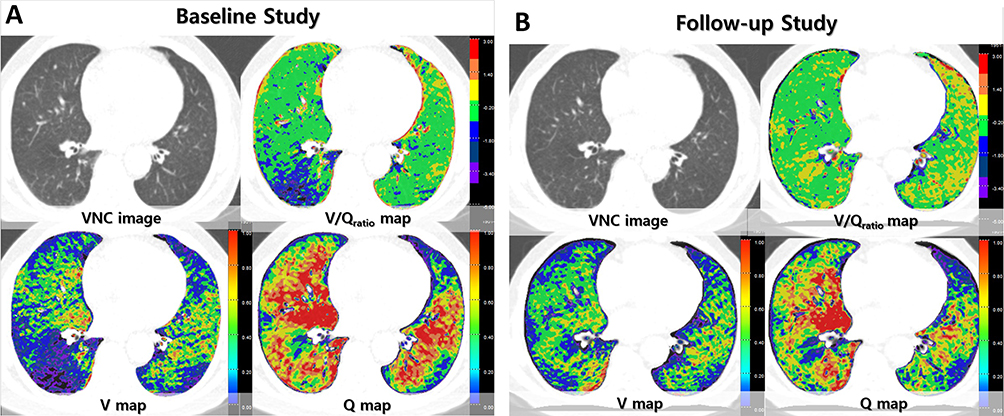 |
Figure 2 A 68-year-old male COPD patient. On a VNC image of xenon ventilation CT, minimal centrilobular emphysema and bronchial wall thickening are notable in bilateral lungs. (A) On baseline study, ventilation is decreased in the superior segment of right lower lobe, while perfusion is preserved resulting in the reversed mismatched V/Q pattern on the V/Qratio map. (B) On follow-up images, ventilation is improved in this area resulting in the matched V/Q pattern on V/Q map. In both upper lobes and left lower lobes, ventilation and perfusion are preserved or relatively increased resulting in the matched V/Q pattern on baseline images, and the matched V/Q pattern is not changed on follow-up. In this patient, quantified V was increased from 0.461 to 0.530 and quantified V/Qratio was increased from −0.888 to −0.462. FEV1 was changed by 0.24 L in this patient on follow up. |
Quantitative Analysis
The mean V and Q values in each pixel were quantified from V and Q maps with in-house software. For describing the effect of V-Q imbalance, the mean V/Qratio, VQMat (the proportion of lung area with matched V/Q) and VQRev (the proportion of lung area with reversed-mismatched V/Q) were quantified. The standard deviation of V/Qratio (V/QSD) was calculated to assess the variability of V/Qratio.
Statistical Analysis
PFT, CAT scores, and quantified DECT parameters in the baseline and follow-up were compared using the paired t-test. The frequency of V/Q patterns in total lung segments and segments with each parenchymal pattern were compared in baseline and follow-up using Wilcoxon-signed rank test. Changes in FEV1 and quantified DECT parameters after treatment were compared between patients with bronchial wall thickening and those without bronchial wall thickening using the student t-test. Pearson correlation analysis was used to compare changes in quantified DECT values and PFT results at baseline and follow-up. Significance was set at P < 0.05.
Results
PFT And Quantified CT Parameters In The Baseline And Follow-Up
FEV1, FEV1/forced vital capacity (FEV1/FVC) and CAT score improved significantly after pharmacologic treatment (P < 0.05). The mean values of the quantified DECT parameters at baseline and follow-up are summarized in Table S1 (Supplementary Information). The mean of quantified DECT parameters was not significantly different at baseline and follow-up.
Changes In V-Q Imbalance On Visual Analysis
A total of 1033 segments from 52 patients were evaluated. Seven segments were excluded from the visual analysis due to total parenchymal collapse or sequelae of previous infection. The most common parenchymal pattern was bronchial wall thickening with or without emphysema (44.9%), followed by normal-looking lung (29.9%) and emphysema (25.2%). The regional parenchymal patterns of each segment on baseline CT did not change on follow-up CT. The most common V/Q pattern of total lung segments was the matched V/Q pattern (80.2%), followed by the reversed-mismatched V/Q pattern (17.6%) in baseline (Figure 3). In segments with each parenchymal pattern, matched V/Q pattern was the most common V/Q pattern. However, reversed-mismatched V/Q pattern was mostly seen the segments with bronchial wall thickening and 32.1% of the segments with bronchial wall thickening showed the reversed-mismatched V/Q pattern (Table 1). After pharmacologic treatment, the segments with the matched V/Q pattern were increased (80.2% to 83.6%) as the segments with the reversed-mismatched V/Q pattern were decreased (17.6% to 13.8%). These changes were mostly observed in the segments with bronchial wall thickening (Figure 3), and 51.7% of segments with reversed-mismatched V/Q pattern in segments with bronchial wall thickening were changed into the matched V/Q pattern with improved ventilation (Table 1). The frequencies of V/Q patterns in total lung segments and segments with bronchial wall thickening were significantly different in baseline and follow-up (P = 0.003 and 0.004), while those in segments with normal-looking lung or emphysema were not significantly different in baseline and follow-up.
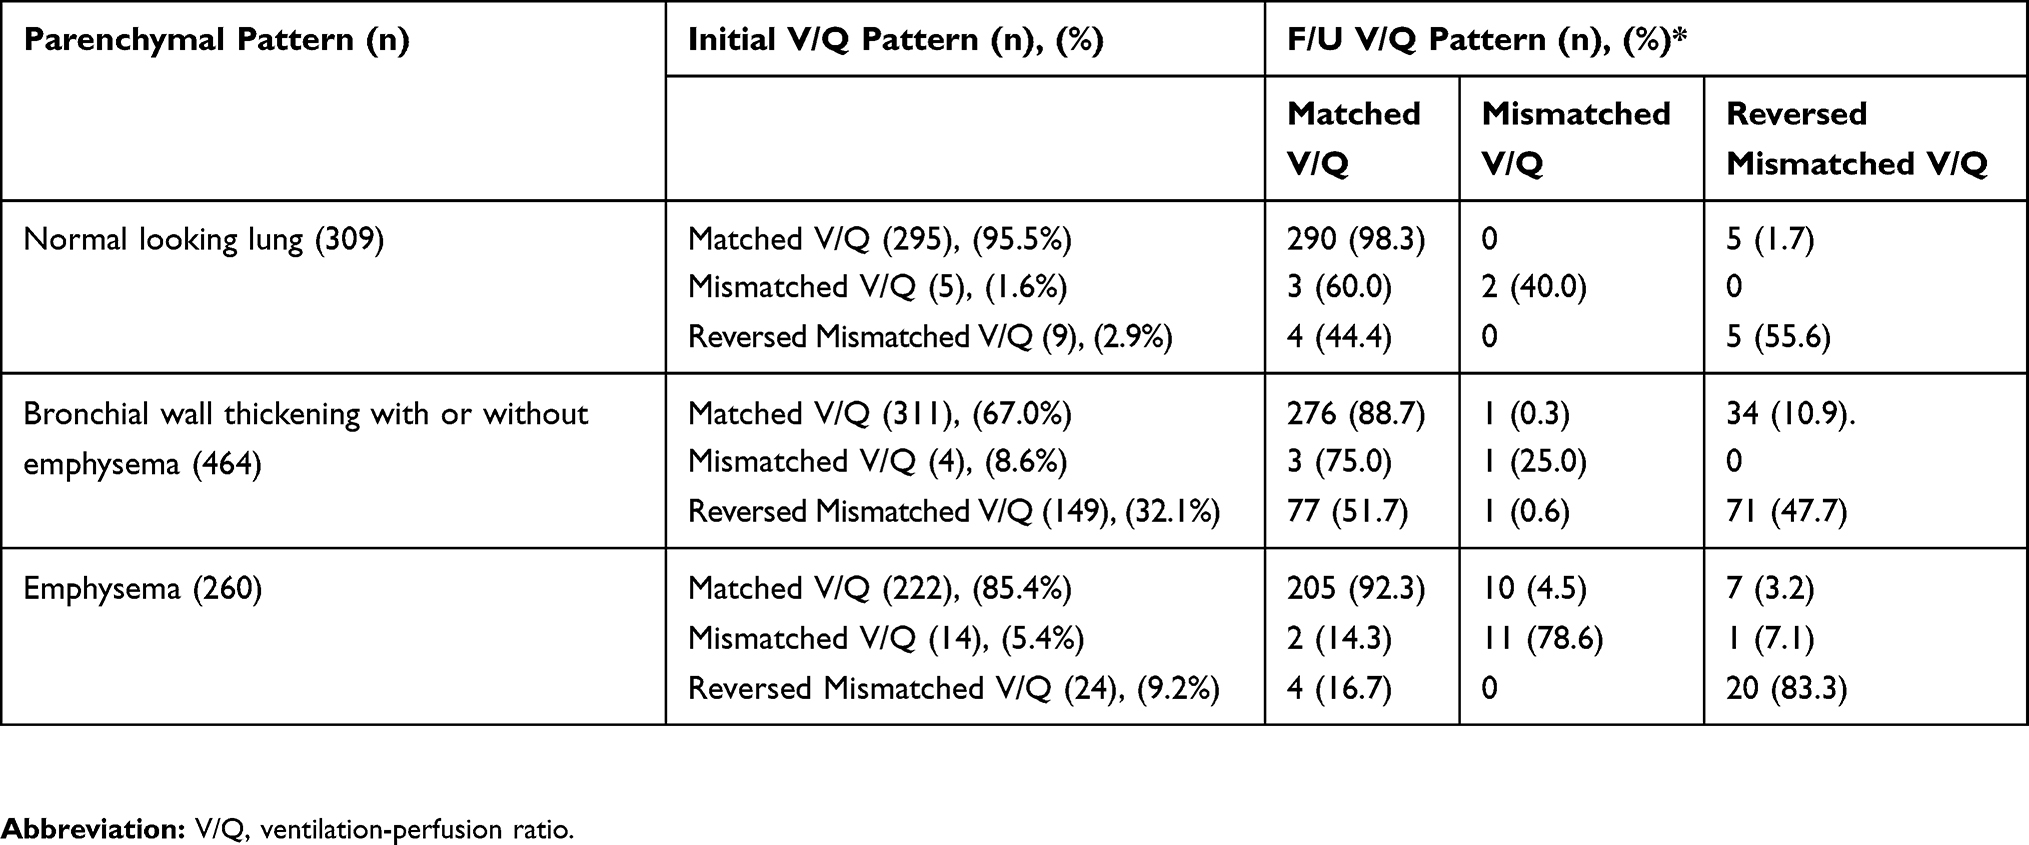 |
Table 1 Visual Analysis Of Changes Of The Regional V/Q Patterns With The Regional Lung Parenchymal Pattern In Baseline And Follow-up |
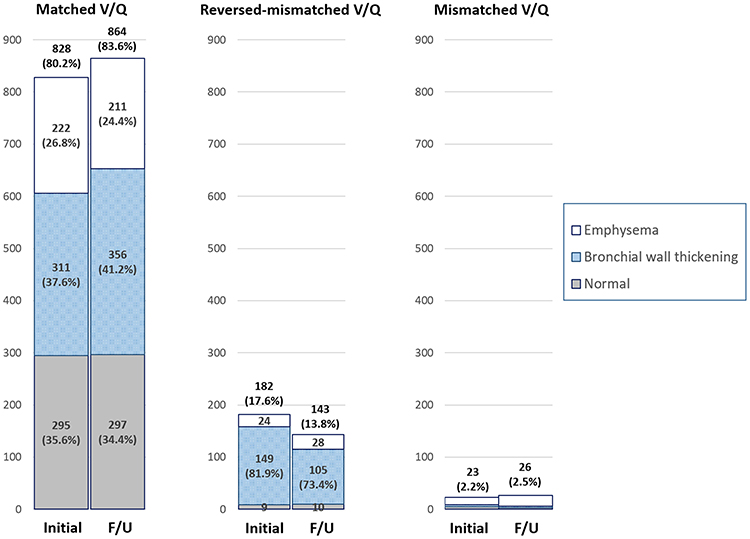 |
Figure 3 Graphs show the regional V/Q patterns with regional lung parenchymal abnormalities seen on baseline and follow-up. A total of 1033 segments were visually assessed. Matched V/Q pattern was most common at both baseline and follow-up. V-Q imbalance pattern (reversed-mismatched and mismatched V/Q patterns) was seen in about 20% of lung segments, and reversed-mismatched V/Q pattern was most common. Reversed-mismatched V/Q pattern was mostly seen in the segments with bronchial wall thickening. After pharmacologic treatment, the segments with the matched V/Q pattern were increased (80.2% to 83.6%) and the segments with the reversed-mismatched V/Q pattern were decreased (17.6% to 13.85%). These changes were mostly observed in the segments with bronchial wall thickening. |
When patients were classified into the patients with or without bronchial wall thickening according to the visual analysis, the patients with bronchial wall thickening showed greater increases in VQMat while greater decreases in VQRev after treatment than patients without bronchial wall thickening (P = 0.012 and 0.005). The mean V/Qratio showed a greater increase and approached the value of zero (V/Q = 1), and the mean V/QSD showed s greater decrease, which indicates that the V/Q distribution changed to a more homogeneous pattern, in patients with bronchial wall thickening than patients without bronchial wall thickening. In addition, the increase of FEV1 was higher in patients with bronchial wall thickening, although this did not reach statistical significance (P = 0.05) (Figure 4A–E).
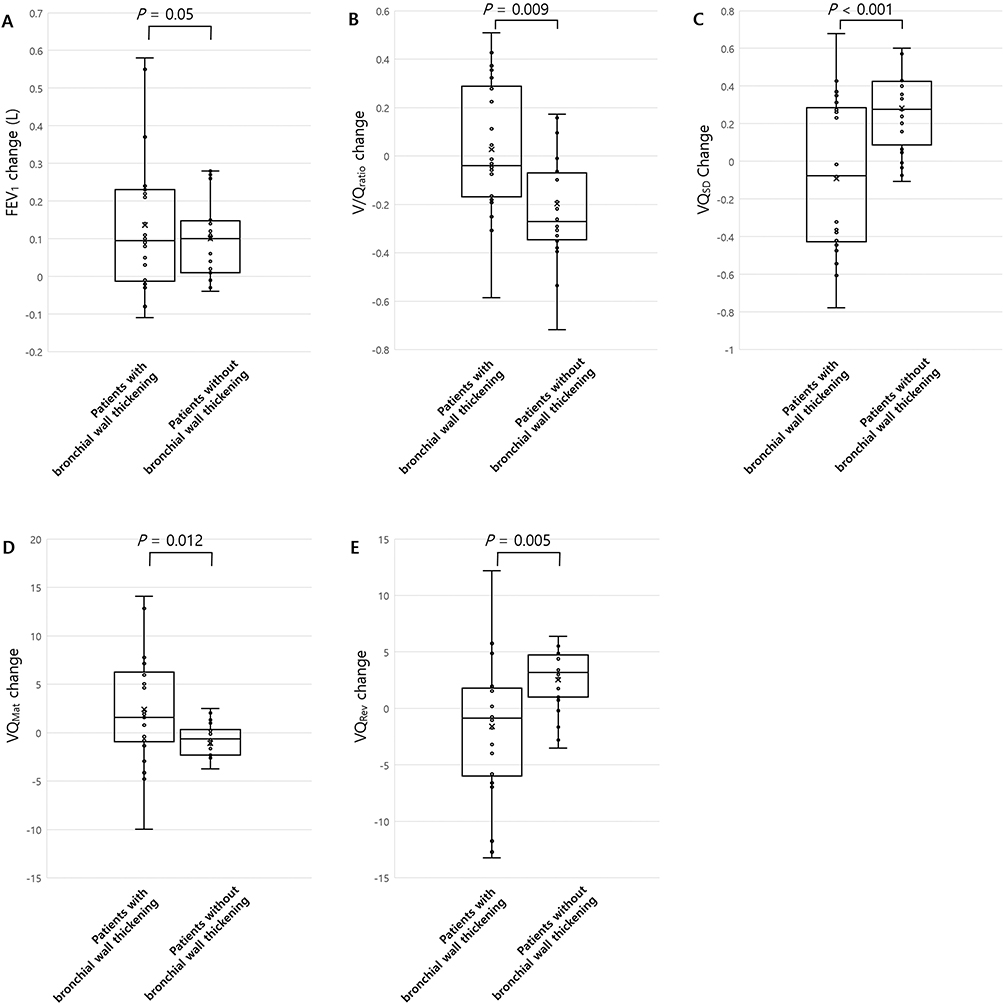 |
Figure 4 Graphs show changes of FEV1 and V-Q imbalance after treatment according to the bronchial wall thickening (A-E). The patients with bronchial wall thickening showed a greater increase in V/Qratio (B), and V/QMat (D) and a greater decreased in V/QSD (C) and V/QRev (E) that those without bronchial wall thickening. The increase in FEV1 (A) was also higher in the patients with bronchial wall thickening, although this did not reach statistical significance. Average value is marked with “x”. |
Quantitative Analysis
The mean values of quantified DECT parameters were moderately correlated with most of the PFT results in baseline and follow-up, respectively (Table S2, Supplementary Information). The changes of the mean V, V/Qratio, and VQMat were positively and moderately correlated with the change of FEV1 (r = 0.327–0.407; P < 0.05), and the changes of the mean V/QSD and VQRev were also moderately and negatively correlated with the change of FEV1 after treatment (r = −0.303 and −0.406; P < 0.05) (Table 2) (Figure S2A–E, Supplementary Information).
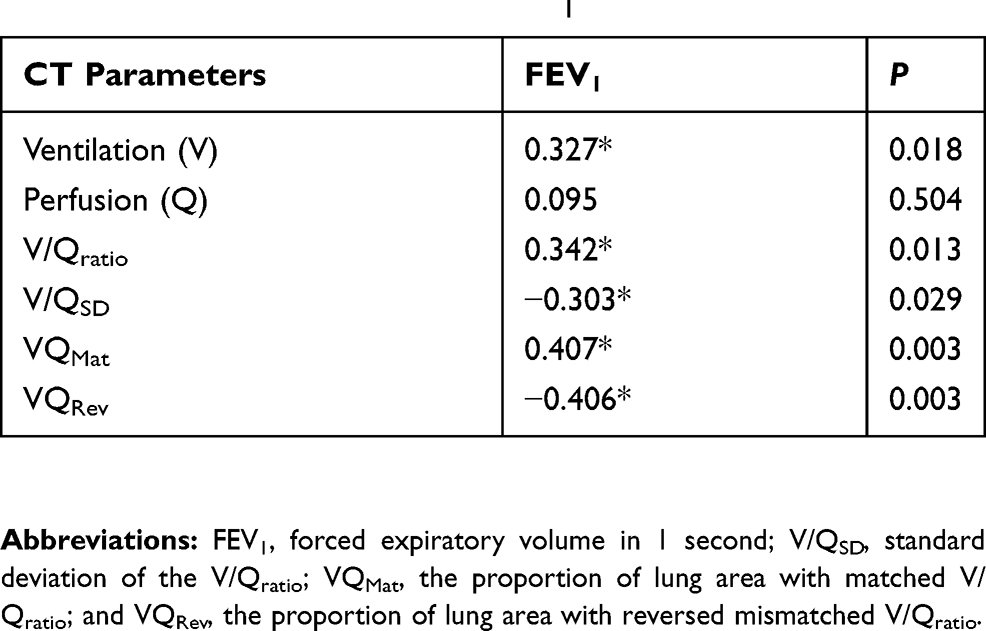 |
Table 2 Correlation Analysis Between Changes In Quantified CT Parameters And Changes In FEV1 |
Discussion
Our study demonstrates that the physiologic changes in pulmonary V, Q, and the V-Q imbalance after pharmacologic treatment in COPD can be assessed using combined xenon V and iodine Q DECT. DECT analysis showed that the V-Q imbalance was improved with improved V after pharmacologic treatment although the regional parenchymal patterns remained unchanged. Moreover, the improvement of V-Q imbalance was mostly observed in the area with bronchial wall thickening. These changes also can be quantified, and changes in the quantified DECT parameters for V or V-Q imbalance after treatment were significantly correlated with changes in FEV1.
Chest CT is the modality of choice for assessing the structural changes in COPD patients. However, in our visual analysis, the structural changes analyzed with parenchymal disease patterns on conventional CT images did not change significantly after treatment. Whereas, V/Q patterns were changed on follow-up, especially in the areas with bronchial wall thickening. It has been reported that V–Q imbalance may proceed to a morphologic abnormality in patients with emphysema, and mild alveolar destruction and/or small airway obstruction causing V–Q imbalance may not be well identified on conventional CT due to the limitation of spatial resolution.15–17 There may have been minute parenchymal changes after pharmacologic treatment in our patients, but they were not detectable by the current conventional CT images. Using the combined xenon ventilation and iodine perfusion DECT, we could analyze the improvement of V-Q imbalance as the response of pharmacologic treatment although the structural changes on conventional CT images were not evident.
The V-Q imbalance is the main cause of arterial hypoxemia in COPD patients.18,19 The segments with V-Q imbalance were seen in approximately 20% of the total lung segments in baseline and the reversed-mismatched V/Q pattern was the most common V-Q imbalance pattern. This V/Q pattern may suggest that ventilation is more severely impaired than perfusion and could be indicative of airway disease with incomplete hypoxic vasoconstriction in COPD patients.20,21 As well in our study, the reversed-mismatched V/Q pattern was mostly seen in the area with bronchial wall thickening. The response to treatment with a bronchodilator has been reported to be more significant in patients with emphysema and bronchial wall thickening in comparison with those with emphysema without bronchial wall thickening.22,23 Our study also showed similar results. These results may be associated with the more significant improvement of V-Q imbalance as the response to pharmacologic treatment in patients with bronchial wall thickening in comparison with those without bronchial wall thickening.
There are a few studies evaluating physiologic changes in V-Q imbalance using imaging modalities in COPD patients.10,20,21,24–26 Compared to other image modalities, DECT has the advantage of providing both physiologic change and high-resolution anatomic information. Hwang et al reported the feasibility of combined xenon ventilation and iodine perfusion DECT for evaluation of V-Q imbalance in COPD patients using the same DECT protocol as our study.10 Lee et al applied this imaging technique in COPD patients who underwent bronchoscopic lung volume reduction (BLVR), and reported the improvement of ventilation and V/Q mismatch after BLVR with DECT analyses.25 These findings are similar to our results in that the improvement of V-Q imbalance on DECT after pharmacologic treatment. This imaging technique may be reproducible and useful in analyzing the physiologic status as well as anatomic status, and its post-treatment changes of the lung in COPD patients.
Various medications are used to reduce symptoms and to improve health status in COPD patients, and a spirometric assessment of FEV1 are used for monitoring of patients.27 However, some authors have reported that FEV1 correlates poorly with the severity of symptoms and has limited usefulness in evaluating the treatment response in individual COPD patients.28–30 COPD is a heterogeneous disease with variable clinical presentations and treatment responses. Therefore, the comprehensive assessment of pulmonary function, symptoms, and high-resolution anatomic information with CT image may be required for adequate evaluation of the treatment response. Clinicians also may need more objective tools for evaluating the treatment response. Regarding the monitoring of COPD patients, visual and quantitative assessment using xenon ventilation and iodine perfusion DECT could provide a supplement to PFT and other parameters in assessing the patient treatment response. However, xenon ventilation and iodine perfusion DECT requires radiation exposure, so that larger clinical studies will be required for both validation and clinical application.
Our study has several limitations. First, we acquired a single-volume DECT scan rather than dynamic CT scan. Regarding perfusion, the Q values from DECT are closely correlated with the regional pulmonary blood flow using dynamic CT.31 However, it is difficult to evaluate the relationship between xenon ventilation obtained from single DECT and dynamic CT because the xenon attenuation from a single breath is too low to be identified with the current CT scan. Considering the complex ventilation process and low contrast of xenon attenuation, we used single DECT scanning with multiple inhalations of xenon gas for ventilation imaging. The quantified V values were significantly correlated with the PFT in our study. Second, although we used the same DECT protocol in baseline and follow-up, various factors that affect ventilation or perfusion may be different when baseline and follow-up CTs were taken. It is known that the distribution of ventilation may be affected by the inspiratory flow rate.32,33 Also large lung volume differences may affect regional perfusion.34 We monitored the xenon inhalation curve and coached the patients constantly inhaling xenon gas. We also coached the patients regarding an appropriate inspiratory level before a CT scan, although attaining rigorous volume control may be difficult. Nevertheless, the quantified DECT parameters were correlated with the PFT in our study. Third, we obtained baseline studies after short discontinuing the used medication for patients’ safety, but the length of discontinuation of bronchodilators may not be enough. Bronchodilation effect may disappear shortly, but there may be still a small bronchodilator effect such as lung deflation. Nevertheless, the improvement of V and V-Q mismatch were demonstrated with DECT in our study. Fourth, we performed the visual assessment for the evaluation of bronchial wall thickening of segment by the experienced thoracic radiologists blinded to the ventilation and perfusion information of segment. However, visual assessment of bronchial wall thickening on CT may not always be reproducible even with an experienced radiologists. Further studies with quantitative analysis of bronchial wall thickening are needed for this issue. Finally, we registered the CT images for obtaining anatomically matched images and assessing the changes of regional V-Q imbalance. During the registration process, misregistration can occur. However, we visually checked all of the registered CT images and there were only minor errors.
In conclusion, combined xenon ventilation and iodine perfusion DECT showed that the V-Q imbalance was improved with improving ventilation after the pharmacological treatment in COPD patients, although the parenchymal disease patterns were not changed. This improvement of V-Q imbalance may occur mostly in the areas with bronchial wall thickening. Combined xenon ventilation and iodine perfusion DECT may be useful tool for analysis of change of V-Q imbalance after pharmacologic treatment in COPD patients.
Disclosure
The authors report no conflicts of interest in this work.
References
1. Newell JD
2. Hogg JC, Macklem PT, Thurlbeck WM. Site and nature of airway obstruction in chronic obstructive lung disease. N Engl J Med. 1968;278(25):1355–1360. doi:10.1056/NEJM196806202782501
3. Mead J, Turner JM, Macklem PT, Little JB. Significance of the relationship between lung recoil and maximum expiratory flow. J Appl Physiol. 1967;22(1):95–108. doi:10.1152/jappl.1967.22.1.95
4. Yanai M, Sekizawa K, Ohrui T, Sasaki H, Takishima T. Site of airway obstruction in pulmonary disease: direct measurement of intrabronchial pressure. J Appl Physiol (1985). 1992;72(3):1016–1023. doi:10.1152/jappl.1992.72.3.1016
5. Barbera JA, Riverola A, Roca J, et al. Pulmonary vascular abnormalities and ventilation-perfusion relationships in mild chronic obstructive pulmonary disease. Am J Respir Crit Care Med. 1994;149(2 Pt 1):423–429. doi:10.1164/ajrccm.149.2.8306040
6. Chae EJ, Seo JB, Goo HW, et al. Xenon ventilation CT with a dual-energy technique of dual-source CT: initial experience. Radiology. 2008;248(2):615–624. doi:10.1148/radiol.2482071482
7. Chae EJ, Seo JB, Lee J, et al. Xenon ventilation imaging using dual-energy computed tomography in asthmatics: initial experience. Invest Radiol. 2010;45(6):354–361. doi:10.1097/RLI.0b013e3181dfdae0
8. Kim WW, Lee CH, Goo JM, et al. Xenon-enhanced dual-energy CT of patients with asthma: dynamic ventilation changes after methacholine and salbutamol inhalation. AJR Am J Roentgenol. 2012;199(5):975–981. doi:10.2214/AJR.11.7624
9. Lee CW, Seo JB, Song JW, et al. Evaluation of computer-aided detection and dual energy software in detection of peripheral pulmonary embolism on dual-energy pulmonary CT angiography. Eur Radiol. 2011;21(1):54–62. doi:10.1007/s00330-010-1903-7
10. Hwang HJ, Seo JB, Lee SM, et al. Assessment of regional xenon ventilation, perfusion, and ventilation-perfusion mismatch using dual-energy computed tomography in chronic obstructive pulmonary disease patients. Invest Radiol. 2016;51(5):306–315. doi:10.1097/RLI.0000000000000239
11. Barbera JA, Roca J, Ferrer A, et al. Mechanisms of worsening gas exchange during acute exacerbations of chronic obstructive pulmonary disease. Eur Respir J. 1997;10(6):1285–1291. doi:10.1183/09031936.97.10061285
12. Sandek K, Bratel T, Hellstrom G, Lagerstrand L. Ventilation-perfusion inequality and carbon dioxide sensitivity in hypoxaemic chronic obstructive pulmonary disease (COPD) and effects of 6 months of long-term oxygen treatment (LTOT). Clin Physiol. 2001;21(5):584–593.
13. Kent BD, Mitchell PD, McNicholas WT. Hypoxemia in patients with COPD: cause, effects, and disease progression. Int J Chron Obstruct Pulmon Dis. 2011;6:199–208. doi:10.2147/COPD.S10611
14. Kim EY, Seo JB, Lee HJ, et al. Detailed analysis of the density change on chest CT of COPD using non-rigid registration of inspiration/expiration CT scans. Eur Radiol. 2015;25(2):541–549. doi:10.1007/s00330-014-3418-0
15. Kuwano K, Matsuba K, Ikeda T, et al. The diagnosis of mild emphysema. Correlation of computed tomography and pathology scores. Am Rev Respir Dis. 1990;141(1):169–178. doi:10.1164/ajrccm/141.1.169
16. Muller NL, Coxson H. Chronic obstructive pulmonary disease. 4: imaging the lungs in patients with chronic obstructive pulmonary disease. Thorax. 2002;57(11):982–985. doi:10.1136/thorax.57.11.982
17. Remy-Jardin M, Remy J, Gosselin B, Copin MC, Wurtz A, Duhamel A. Sliding thin slab, minimum intensity projection technique in the diagnosis of emphysema: histopathologic-CT correlation. Radiology. 1996;200(3):665–671. doi:10.1148/radiology.200.3.8756912
18. Calverley PM. Respiratory failure in chronic obstructive pulmonary disease. Eur Respir J Suppl. 2003;47:26s–30s.
19. Celli BR, MacNee W, Force AET. Standards for the diagnosis and treatment of patients with COPD: a summary of the ATS/ERS position paper. Eur Respir J. 2004;23(6):932–946. doi:10.1183/09031936.04.00014304
20. Jogi J, Ekberg M, Jonson B, Bozovic G, Bajc M. Ventilation/perfusion SPECT in chronic obstructive pulmonary disease: an evaluation by reference to symptoms, spirometric lung function and emphysema, as assessed with HRCT. Eur J Nucl Med Mol Imaging. 2011;38(7):1344–1352. doi:10.1007/s00259-011-1757-5
21. Palmaz JC, Barnett CA, Reich SB, Krumpe PE, Farrer PA. Reverse ventilation–perfusion mismatch. Clin Nucl Med. 1984;9(1):6–9. doi:10.1097/00003072-198401000-00003
22. Fujimoto K, Kitaguchi Y, Kubo K, Honda T. Clinical analysis of chronic obstructive pulmonary disease phenotypes classified using high-resolution computed tomography. Respirology. 2006;11(6):731–740. doi:10.1111/j.1440-1843.2006.00930.x
23. Park HJ, Lee SM, Choe J, et al. Prediction of treatment response in patients with chronic obstructive pulmonary disease by determination of airway dimensions with baseline computed tomography. Korean J Radiol. 2019;20(2):304–312. doi:10.3348/kjr.2018.0204
24. Suga K, Kawakami Y, Koike H, et al. Lung ventilation-perfusion imbalance in pulmonary emphysema: assessment with automated V/Q quotient SPECT. Ann Nucl Med. 2010;24(4):269–277. doi:10.1007/s12149-010-0369-7
25. Lee SW, Lee SM, Shin SY, et al. Improvement in ventilation-perfusion mismatch after bronchoscopic lung volume reduction: quantitative image analysis. Radiology. 2017;285(1):250–260. doi:10.1148/radiol.2017162148
26. Hajian B, De Backer J, Vos W, et al. Changes in ventilation-perfusion during and after an COPD exacerbation: an assessment using fluid dynamic modeling. Int J Chron Obstruct Pulmon Dis. 2018;13:833–842. doi:10.2147/COPD.S153295
27. Vestbo J, Hurd SS, Agusti AG, et al. Global strategy for the diagnosis, management, and prevention of chronic obstructive pulmonary disease: GOLD executive summary. Am J Respir Crit Care Med. 2013;187(4):347–365. doi:10.1164/rccm.201204-0596PP
28. Jones PW. Health status measurement in chronic obstructive pulmonary disease. Thorax. 2001;56(11):880–887. doi:10.1136/thorax.56.11.880
29. Lee JS, Huh JW, Chae EJ, et al. Different therapeutic responses in chronic obstructive pulmonary disease subgroups. Int J Tuberc Lung Dis. 2011;15(8):1104–1110. doi:10.5588/ijtld.10.0553
30. Mahler DA, Harver A. A factor analysis of dyspnea ratings, respiratory muscle strength, and lung function in patients with chronic obstructive pulmonary disease. Am Rev Respir Dis. 1992;145(2 Pt 1):467–470. doi:10.1164/ajrccm/145.2_Pt_1.467
31. Fuld MK, Halaweish AF, Haynes SE, Divekar AA, Guo J, Hoffman EA. Pulmonary perfused blood volume with dual-energy CT as surrogate for pulmonary perfusion assessed with dynamic multidetector CT. Radiology. 2013;267(3):747–756. doi:10.1148/radiol.12112789
32. Bake B, Wood L, Murphy B, Macklem PT, Milic-Emili J. Effect of inspiratory flow rate on regional distribution of inspired gas. J Appl Physiol. 1974;37(1):8–17. doi:10.1152/jappl.1974.37.1.8
33. Pedley TJ, Sudlow MF, Milic-Emili J. A non-linear theory of the distribution of pulmonary ventilation. Respir Physiol. 1972;15(1):1–38. doi:10.1016/0034-5687(72)90002-3
34. Chang H, Lai-Fook SJ, Domino KB, et al. Spatial distribution of ventilation and perfusion in anesthetized dogs in lateral postures. J Appl Physiol (1985). 2002;92(2):745–762. doi:10.1152/japplphysiol.00377.2001
 © 2019 The Author(s). This work is published and licensed by Dove Medical Press Limited. The
full terms of this license are available at https://www.dovepress.com/terms
and incorporate the Creative Commons Attribution
- Non Commercial (unported, 3.0) License.
By accessing the work you hereby accept the Terms. Non-commercial uses of the work are permitted
without any further permission from Dove Medical Press Limited, provided the work is properly
attributed. For permission for commercial use of this work, please see paragraphs 4.2 and 5 of our Terms.
© 2019 The Author(s). This work is published and licensed by Dove Medical Press Limited. The
full terms of this license are available at https://www.dovepress.com/terms
and incorporate the Creative Commons Attribution
- Non Commercial (unported, 3.0) License.
By accessing the work you hereby accept the Terms. Non-commercial uses of the work are permitted
without any further permission from Dove Medical Press Limited, provided the work is properly
attributed. For permission for commercial use of this work, please see paragraphs 4.2 and 5 of our Terms.