
Back to Journals » Risk Management and Healthcare Policy » Volume 19
Assessing the Alignment of Long-Term Care Insurance Benefits and Service Provision: Evidence from Shandong, China and Implications for Implementation Risk
Authors Han Z, Wang X  , Ma H , Qu H
Received 11 January 2026
Accepted for publication 4 May 2026
Published 22 May 2026 Volume 2026:19 591495
DOI https://doi.org/10.2147/RMHP.S591495
Checked for plagiarism Yes
Review by Single anonymous peer review
Peer reviewer comments 2
Editor who approved publication: Dr Keon-Hyung Lee
Zhiyan Han,1 Xinping Wang,2 Huifen Ma,3 Haiyan Qu4
1School of Healthcare Security, Shandong First Medical University, Jinan, People’s Republic of China; 2Teachers College, Columbia University, New York, NY, USA; 3School of Medical Management, Shandong First Medical University, Tai ‘an, People’s Republic of China; 4School of Health Professions, University of Alabama at Birmingham, Birmingham, AL, USA
Correspondence: Huifen Ma, School of Medical Management, Shandong First Medical University, 619, Changcheng Road, Tai ‘an, Shandong, 271016, People’s Republic of China, Email [email protected]
Purpose: This study assesses the alignment between Long-Term Care Insurance (LTCI) benefit levels and service supply across 16 prefecture-level cities in Shandong Province, China. This study aims to identify whether mismatches exist between LTCI benefits and long-term care service supply across cities in Shandong Province.
Methods: Drawing on field investigations and administrative-institutional data (2023– 2024), we developed a composite indicator system covering three dimensions of LTCI benefits, namely benefit breadth, benefit depth, and benefit sustainability, as well as two dimensions of service supply, including institutional capacity and human resources. Entropy weighted TOPSIS was used to derive subsystem scores for benefit level (F1) and service supply (F2). The coupling coordination degree model (CCDM) was then applied to evaluate the quality of alignment, and an obstacle degree model was used to identify key barriers.
Results: Substantial intercity disparities were observed in both LTCI benefit levels (F1: 0.237– 0.798) and service supply (F2: 0.049– 0.695). Only one city achieved a well-coordinated status (D = 0.863), while most remained at primary or lower coordination stages. Distinct structural patterns emerged, including benefit-led, service-led, and dual-low development types. Obstacle analysis identified human resource capacity (accounting for 36.9% of obstacles in leading cities) and insufficient payment standards as the dominant barriers to coordination.
Conclusion: The LTCI system in Shandong is characterized by significant intercity heterogeneity and structural mismatches between policy design and service delivery. Our analysis identifies human resource capacity and payment standards as the dominant obstacles that hinder the effective translation of insurance funding into accessible care. Policy efforts should prioritize integrated coordination through dynamic payment adjustments and human resource stabilization to ensure the long-term sustainability and equity of the system.
Keywords: long-term care insurance, long-term care service supply, coupling coordination, implementation risk, China
Introduction
Population ageing and rising disability prevalence have expanded long-term care needs worldwide.1,2 In response, numerous nations have developed long-term care financing arrangements, primarily through social insurance, tax-funded schemes, or mixed models.3–5 International experience suggests that the performance of long-term care policy depends not solely on financing and benefit structure, but also on the ability of service systems to deliver promised entitlements through adequate provider capacity, bed availability, and a stable care workforce.6–8 In this study, “policy design” refers to the design of LTCI benefits, including coverage scope, reimbursement generosity, and financing sustainability, whereas “service provision” refers to the actual supply capacity of long-term care services, including institutions, beds, and care workers. When benefit expansion outpaces service capacity, formal coverage may not translate into effective access, creating a significant implementation risk in long-term care policy. In the absence of sufficient financial protection, an increase in service capacity may result in restricted use and underutilization of resources. It should be noted that LTCI benefits should not exceed the financial capacity of service providers, ensuring that entitlements are both feasible and practically accessible. Aligning LTCI benefits with service provision is essential, as mismatches can prevent entitlements from being realized, reduce resource efficiency, and undermine equity in access.
China has rapidly transitioned into an era of population ageing and has faced increasing demand for long-term care among older adults with disabilities and dementia.9,10 In response, China has initiated Long-Term Care Insurance (LTCI) as an important social policy instrument to consolidate financing and purchase professional care services. The program aims to reduce financial and caregiving burdens on families.11–13 However, the effectiveness and sustainability of China’s LTCI system are likely to vary across local contexts because cities differ in economic development, fiscal capacity, demographic pressure, and the established long-term care service infrastructure.14–16 These differences create a tangible risk that LTCI benefit levels and service supply capacity may not develop in a coordinated manner, potentially resulting in entitlement realization gaps, inefficient resource allocation, and unequal access across areas. Identifying such mismatches is important because it helps policymakers determine whether coordination problems arise from insufficient benefit design, inadequate service capacity, or both, thereby supporting more targeted policy adjustment.
Prior research has measured benefit levels and assessed long-term care resources, but typically examines benefits and service supply separately.16,17 Our study integrates both dimensions into a unified analytical framework that simultaneously links LTCI benefit design and service supply while diagnosing the specific coordination barriers. This approach allows us to identify whether gaps arise from insufficient benefit design, inadequate service capacity, or both, highlighting the novelty and policy relevance of this research. Furthermore, existing evidence often lacks specificity regarding which characteristics most impede coordinated development, a limitation that our study addresses to inform focused and effective policy responses.
Shandong Province provides a relevant case for addressing these issues. Alongside Jilin, Shandong is one of only two provinces designated by the central government as a principal contact province for the LTCI pilots. The 2020 joint guidance issued by the National Healthcare Security Administration and the Ministry of Finance explicitly designated Jilin and Shandong as the two primary contact provinces mandated to continue LTCI pilot programs within the national policy framework. The document further specifies that any expansion of the pilots requires central government approval.18 This principal contact province status enhanced the institutional basis for province-level coordination and policy learning and enabled Shandong to be a particularly policy-relevant setting to examine how LTCI evolved from city-based experimentation to more comprehensive and integrated implementation strategies. Consistent with this province-level scaling, Shandong subsequently attained comprehensive geographic representation, incorporating all 16 prefecture-level cities into the national LTCI pilot arrangement.19,20 This full coverage enables meaningful within-province comparisons across diverse socioeconomic and health system contexts. Although direct generalization should be made with caution, the Shandong case may provide practical lessons for other provinces in China and developing countries with emerging LTCI systems. These lessons include aligning benefit design with service capacity, prioritizing human resource development, and optimizing regional resource allocation to reduce entitlement gaps and improve service efficiency.
Accordingly, this study assesses the alignment between LTCI benefit levels and long-term care service supply across all 16 prefecture-level cities in Shandong Province. Using a composite indicator system, we apply the entropy-weighted TOPSIS method and the coupling coordination degree model to measure the interplay between insurance benefits and service capacity. Additionally, we utilize an obstacle degree model to identify impediments to coordination. This comprehensive analysis provides empirical data for formulating region-specific policies that reduce implementation risks and promote sustainable LTCI development.
Materials and Methods
Data Sources and Collection
Data for this study were primarily collected through field research and direct institutional data collection across the 16 prefecture-level cities in Shandong Province. To ensure the timeliness and granularity of the analysis, data were obtained from: 1) Demographic and socioeconomic indicators, which were extracted from internal annual compilations and official statistical bulletins (2023–2024) issued by municipal Bureaus of Statistics; 2) LTCI operational data, including enrollment figures, fund revenue/expenditure, and specific benefit parameters, which were retrieved directly from the internal management information systems of municipal Healthcare Security Administrations; 3) Service supply data, such as the number of designated long-term care beds and facility counts, which were compiled from official administrative records provided by municipal Civil Affairs Bureaus. All data were validated by relevant local authorities to ensure cross-city consistency and accuracy. No missing values were present in the final dataset, and data completeness was checked during data collection and verification. Descriptive statistics of these indicators are summarized in Supplementary Table S1.
This study was based on aggregated administrative and institutional data collected for routine management and policy evaluation purposes. No individual-level identifiable data was accessed, and no direct interaction with human participants was involved. According to national regulations and institutional guidelines, studies of this nature are exempt from ethical review. This exemption was confirmed by the Ethics Committee of Shandong First Medical University; therefore, formal ethical approval and informed consent were not required.
Construction of the Indicator System
To assess the alignment between LTCI policy design and long-term care service provision, we constructed an evaluation framework consisting of two interrelated components: LTCI benefit level and long-term care service supply. The indicator system is presented in Table 1.
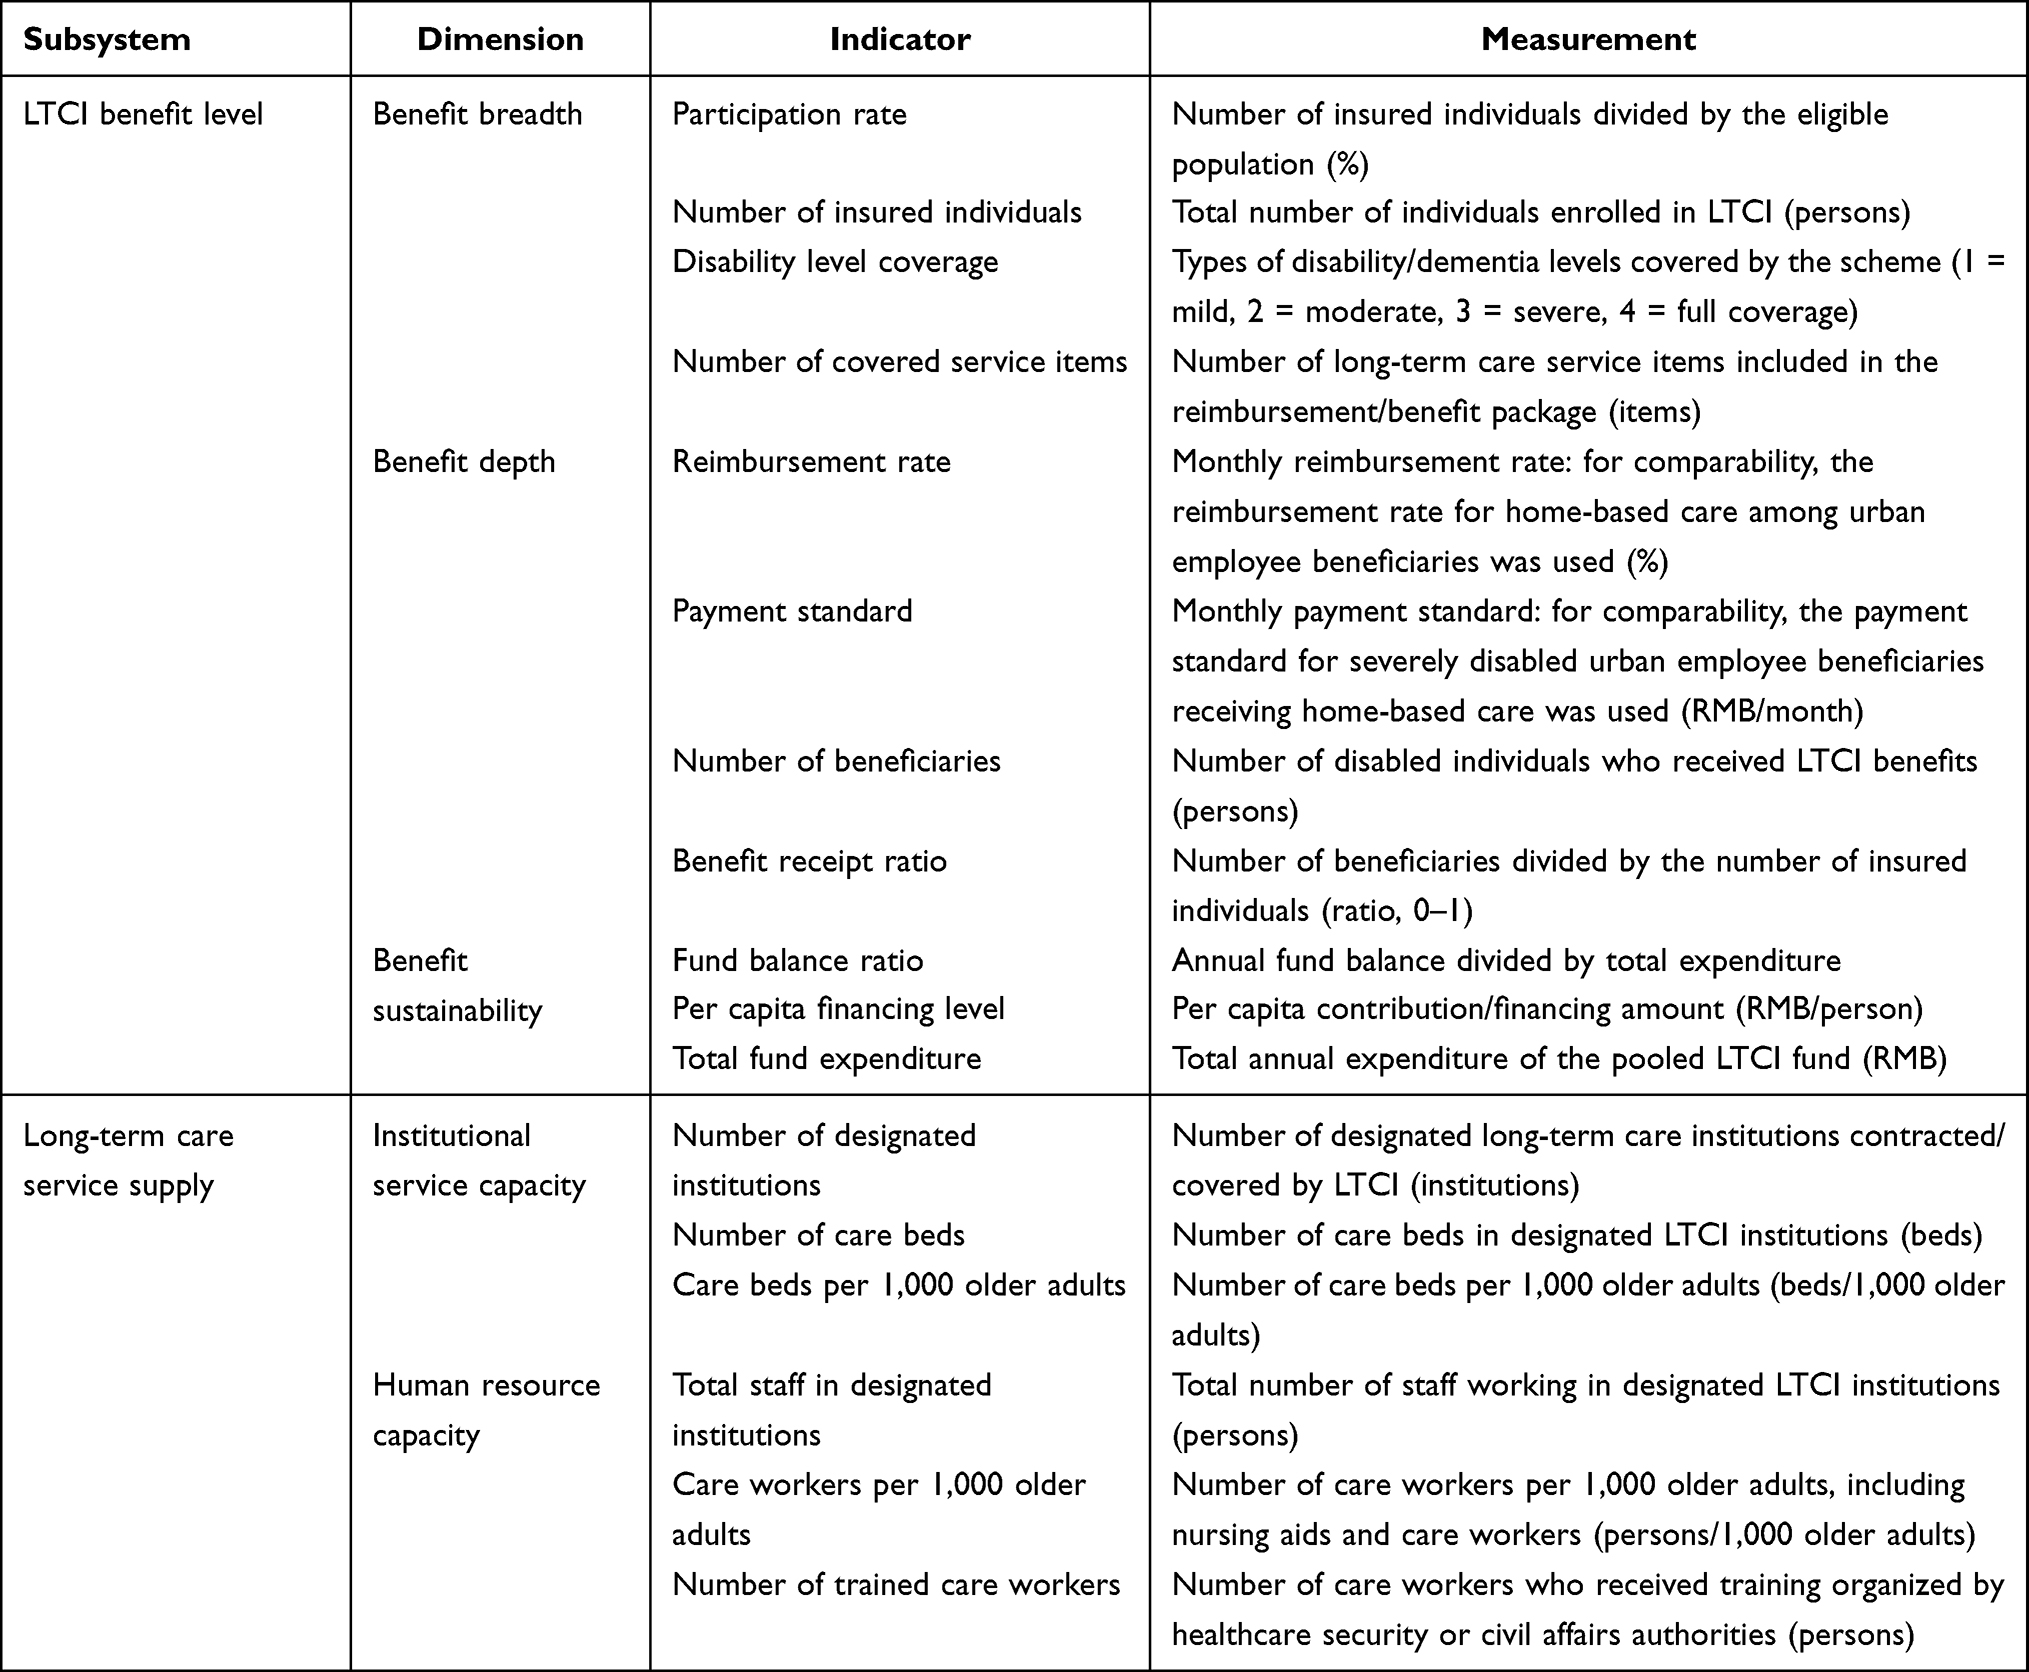 |
Table 1 Indicator System for Evaluating LTCI Benefit Level and Long-Term Care Service Supply in Shandong Province, China |
The indicator system was developed with reference to prior studies on LTCI policy evaluation and long-term care system performance assessment, while also being adapted to the institutional characteristics of China’s LTCI system and the availability of comparable city-level administrative data.21,22 In this study, the LTCI benefit level subsystem was organized into three dimensions, namely benefit breadth, benefit depth, and benefit sustainability, to reflect coverage scope, realized benefit generosity and penetration, and fund sustainability. Participation rate and number of insured individuals were retained simultaneously because they capture distinct dimensions of coverage. Participation rate reflects relative penetration while the number of insured individuals reflects absolute scale, both critical for assessing benefit breadth. The benefit depth dimension was intended to capture not only the generosity of financial protection, such as reimbursement rate and payment standard, but also the extent to which insured individuals received benefits in practice. Accordingly, the number of beneficiaries and the benefit receipt ratio were included as indicators of realized benefit penetration rather than financial generosity alone. The long-term care service supply subsystem reflects the capacity of service provision through two dimensions: institutional resources (physical infrastructure, including designated buildings and beds) and human resources (availability and training of care personnel). This classification aligns policy requirements for designated LTCI providers and encompasses the fundamental inputs necessary to convert insurance benefits into tangible care.
Analytical Methods
Entropy-Weighted TOPSIS Method
The entropy-weighted Technique for Order Preference by Similarity to Ideal Solution (TOPSIS) method was applied to calculate the composite scores of the two dimensions: the LTCI benefit level score (F1) and the long-term care service supply score (F2).23,24 This method was selected because it allows multiple heterogeneous indicators to be aggregated into comparable composite scores while reducing subjective weighting bias. Entropy weighting derives indicator weights from the degree of variation across cities, and TOPSIS evaluates the relative performance of each city by comparing its distance from the ideal and negative ideal solutions.
- Indicator normalization. To eliminate differences in units and scales across indicators, the original data xij were normalized using the min-max approach to obtain the dimensionless matrix zij. All indicators in this study were treated as positive indicators, with higher values indicating better performance. Details on indicator polarity are provided in Supplementary Table S2.
- Entropy-based weighting. Based on the normalized matrix, the proportion for city i on indicator j was calculated as

and the information entropy of indicator j was computed as

The entropy weight was then derived as

so that indicators with greater cross-city variation (ie., higher information content) received larger weights.
(3) TOPSIS closeness. The weighted normalized matrix was constructed as

The positive ideal solution (best performance on each indicator) and the negative ideal solution (worst performance on each indicator) were identified, and the Euclidean distances from each city to the positive and negative ideal solutions were denoted by Si⁺ and Si−, respectively. The relative closeness was calculated as

where a larger Ci indicates better overall subsystem performance.
(4) Subsystem scores. The composite score of each component for each city was defined as

Coupling Coordination Degree Model
To examine the interaction and coordination between the LTCI benefit level and long-term care service supply, the Coupling Coordination Degree Model (CCDM) was employed.25
Let F1 and F2 denote the composite scores of the two components (benefit level and service resource supply), respectively. The coupling degree (C) was calculated to reflect the interaction intensity between the two subsystems:

To incorporate the overall development level, the comprehensive index (T) was defined as:

Where α and β are the weights of the two subsystems. In the baseline analysis, α and β were both set to 0.5 because LTCI benefit level and service supply were treated as conceptually co-essential dimensions of coordinated development, and no strong theoretical basis was available for assigning greater importance to either subsystem.
The coupling coordination degree (D) was then computed as:

A larger D indicates a higher level of coordinated development. Cities were further classified into different coordination stages based on D. The criteria used to classify D values into coordination categories are provided in Supplementary Table S3.
Obstacle Degree Model
To identify the key factors constraining coordinated development, the Obstacle Degree Model was employed.26 Based on the normalized indicator matrix zij (higher values indicate better performance) and the indicator weights wj, the deviation degree of indicator j in city i was defined as:

The obstacle contribution of indicator j in city i was then calculated by combining its weight with its deviation:

Finally, the obstacle degree (percentage contribution) of each indicator to the overall barrier was computed as:
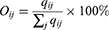
A larger Oij indicates that indicator j contributes more strongly to the constraints on development in city i. The dominant obstacle factors were identified by ranking Oij, and obstacle patterns were further summarized at both provincial and city levels.
Statistical Analysis
All statistical analyses were performed using STATA version 18.0 (Stata Corp, College Station, TX, USA).
Results
Measurement of LTCI Benefit Level and Long-Term Care Service Resource Supply
Marked inter-city disparities were observed in both the LTCI benefit level (F1) and long-term care service supply (F2). Overall variation was more pronounced for service supply than for benefit levels, indicating substantially greater inter-city heterogeneity in long-term care service provision (Figure 1).
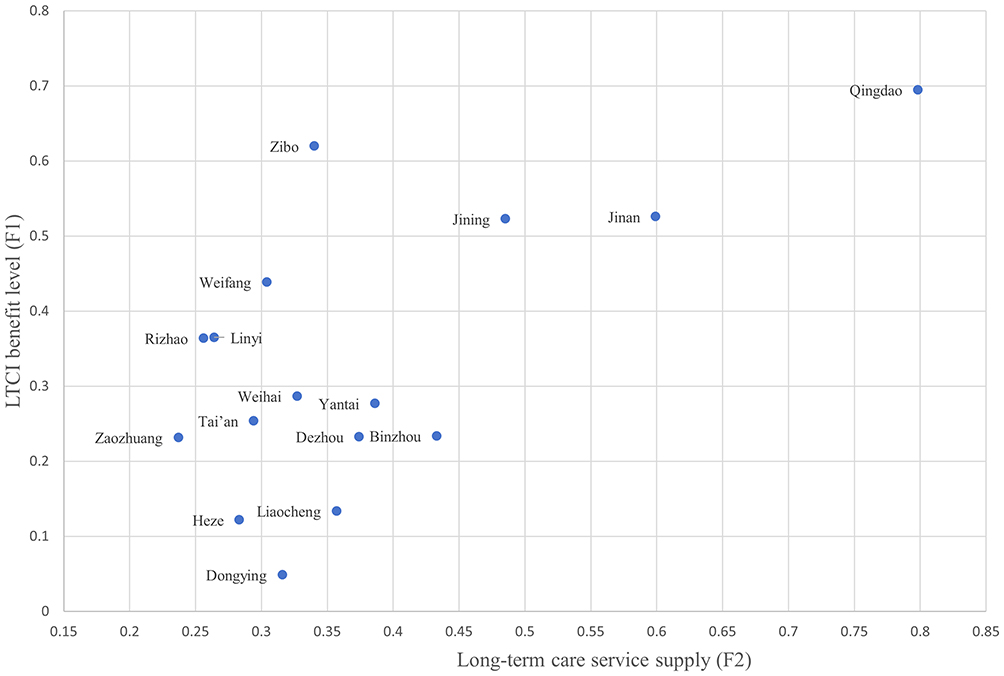 |
Figure 1 Composite scores and rankings of LTCI benefit level (F1) and long-term care service supply (F2) across 16 prefecture-level cities in Shandong Province, China. |
F1 ranged from 0.237 to 0.798 (range = 0.561), with the highest scores observed in Qingdao (0.798), followed by Jinan (0.599) and Jining (0.485). In contrast, Zaozhuang (0.237), Linyi (0.264), and Rizhao (0.256) ranked at the lower end of the distribution. F2 showed even greater dispersion, ranging from 0.049 to 0.695 (range = 0.646). Qingdao (0.695) and Zibo (0.620) recorded the highest service supply scores, followed by Jinan (0.526) and Jining (0.523), whereas Dongying (0.049), Heze (0.122), and Liaocheng (0.134) consistently scored lowest.
Joint consideration of F1 and F2 revealed distinct structural patterns across cities.
Qingdao, Jinan, and Jining demonstrated strong performance in both subsystems; Zibo exhibited relatively strong service supply but comparatively lower benefit levels; Binzhou showed relatively higher benefit levels but weaker service supply; and Dongying, Heze, and Liaocheng performed poorly across both subsystems.
Coupling Coordination Between LTCI Benefits and Service Resource Supply
Overall, coupling alignment across the 16 cities exhibited significant hierarchical patterns and low prevalence of high-level coordination. The alignment status varied widely, with only a small minority of cities (18.75%) achieving intermediate or higher coordination levels, while the majority remained concentrated in the lower coordination categories or faced risks of maladjustment (Table 2).
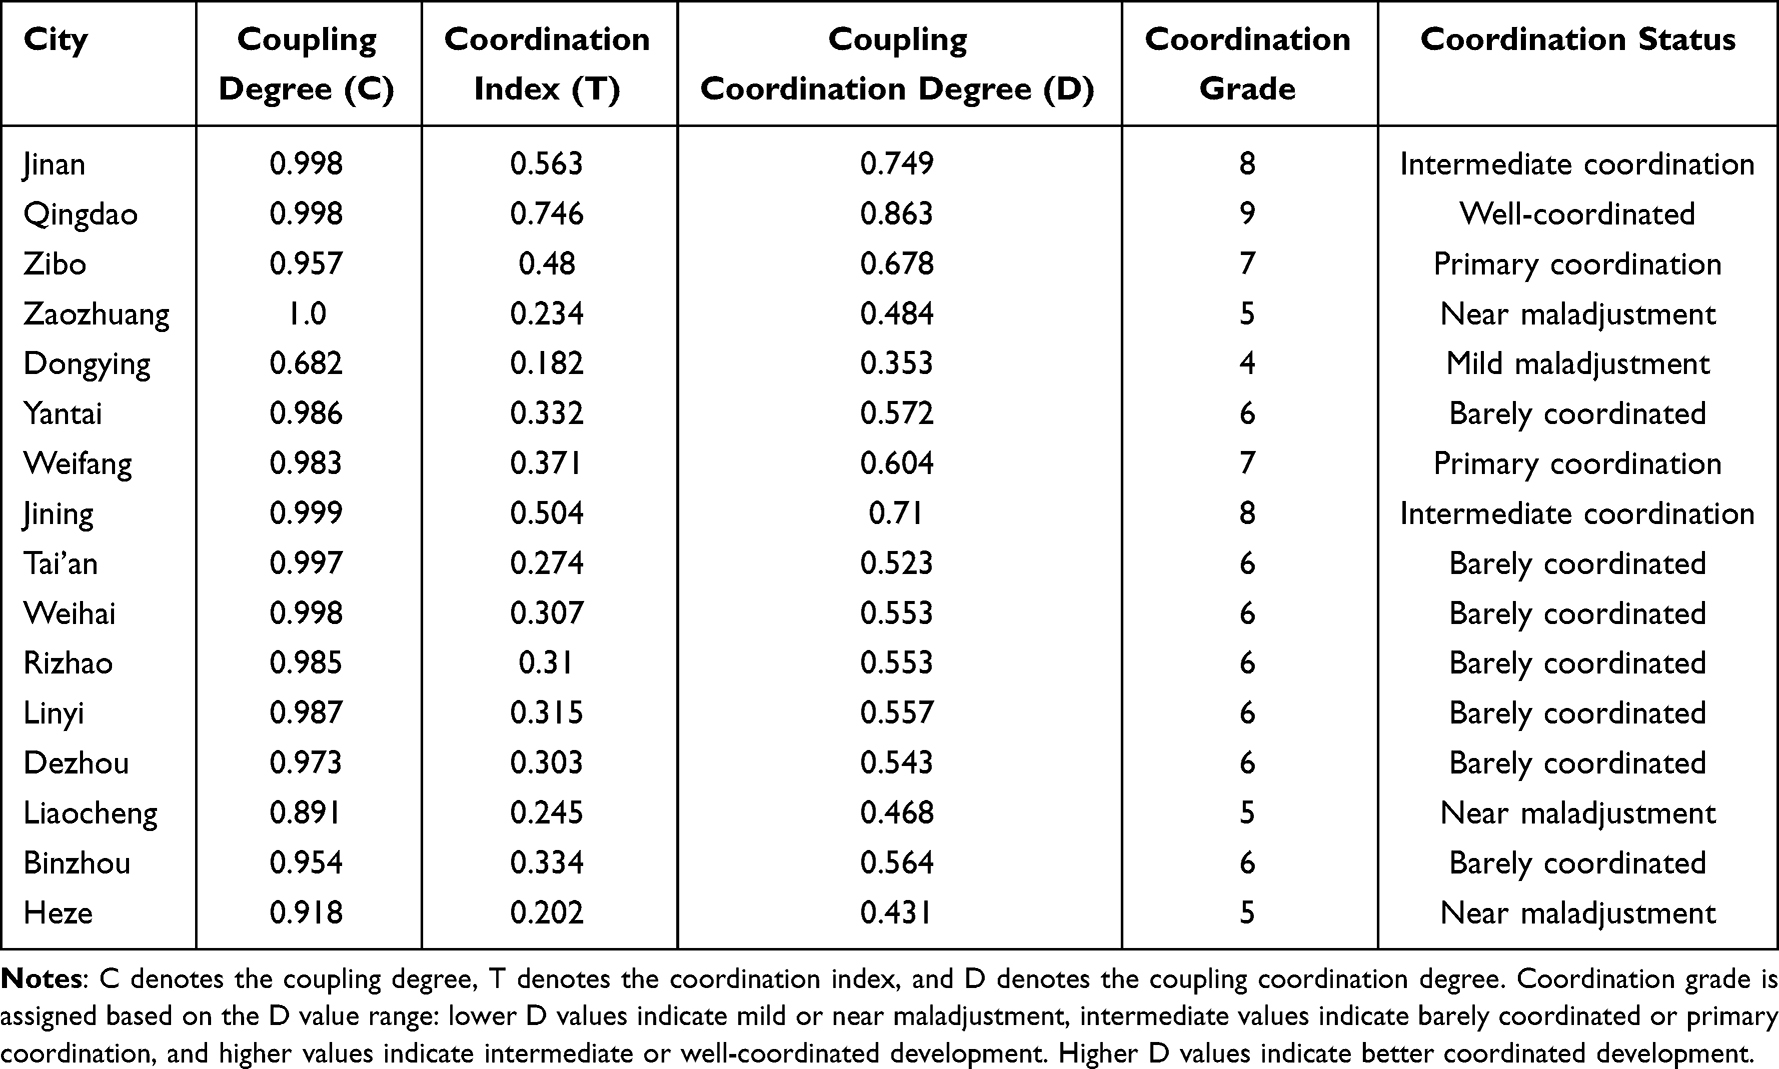 |
Table 2 Results of Coupling Coordination Between LTCI Benefit Level and Long-Term Care Service Supply Across 16 Prefecture-Level Cities in Shandong Province, China |
Only Qingdao reached a well-aligned status (D = 0.863), while Jinan (0.749) and Jining (0.710) achieved intermediate coordination. Most cities were concentrated in primary or barely coordinated stages, whereas Zaozhuang (0.484), Liaocheng (0.468), and Heze (0.431) fell into a near-maladjustment category, and Dongying had the lowest coordination degree (0.353), indicating mild maladjustment.
Spatially, coordination levels were relatively higher in the Jiaodong Peninsula and lower in western and northern Shandong. Based on the relative magnitudes of F1 and F2, Qingdao exhibited a high-benefit–high-supply pattern with a relative benefit-led tendency (F1 slightly exceeding F2). Jinan and Jining showed a synchronous pattern (F1 ≈ F2), whereas cities with low coordination were mainly characterized by dual-low development in both benefits and service supply.
Obstacles to Coordinated Development
The results of the Obstacle Degree Model are summarized in Table 3. Human resource constraints within the service supply subsystem and insufficient benefit depth within the insurance subsystem were the dominant barriers to improving coordination at the provincial level.
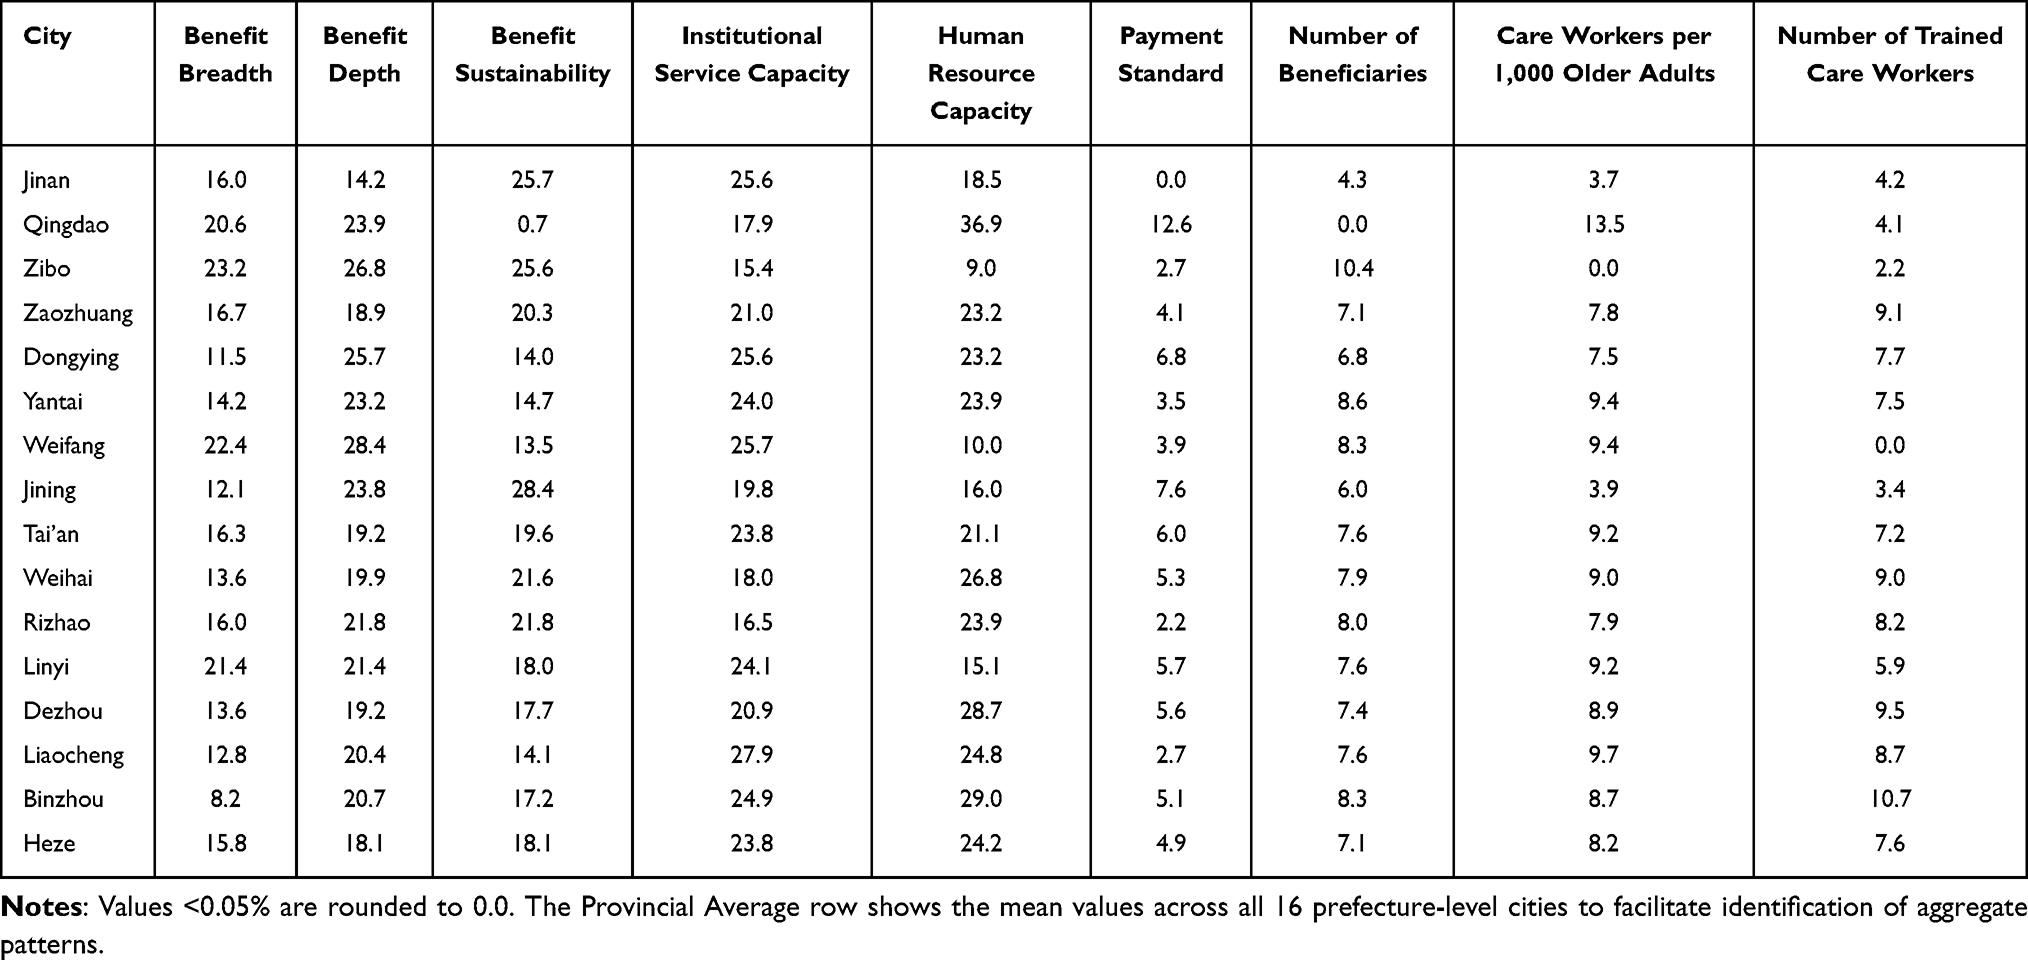 |
Table 3 Results of Obstacle Degrees for LTCI Benefit Level and Long-Term Care Service Supply in Shandong Province, China (%) |
In the service supply subsystem, the most prominent constraints were associated with human resource availability, particularly indicators capturing the density of care workers per 1,000 older adults and the availability of trained care workers.
Within the benefit subsystem, payment standards and the number of beneficiaries emerged as primary constraint factors. Substantial heterogeneity was observed across cities: in Qingdao, human resource shortages were the leading obstacle (36.9%), whereas Jinan and Jining were more constrained by benefit sustainability indicators, including fund balance and financing level, together with pressures from institutional resources. In lower-coordination cities such as Zaozhuang, Heze, and Liaocheng, obstacle contributions were more evenly distributed across benefit breadth, benefit depth, and human resource capacity, indicating the presence of multiple concurrent constraints. Dongying was primarily constrained by limited service supply capacity, particularly shortages in care beds and institutional staffing, corresponding to a resource-constrained pattern.
Discussion
Principal Findings
This study assessed the alignment between LTCI benefit levels and long-term care service supply across all 16 prefecture-level cities in Shandong Province. The results reveal substantial inter-city heterogeneity in both subsystems and, more importantly, structural mismatches between benefits and service capacity. These mismatches are not merely descriptive disparities; they represent policy implementation risks that may undermine entitlement realization, efficiency of resource allocation, and the overall performance and legitimacy of the LTCI system. By integrating composite measurement with coordination assessment and obstacle diagnosis, this study moves beyond ranking cities to identify where coordination breaks down, and which constraints are most amenable to policy intervention.
These findings regarding significant regional heterogeneity align with recent studies, which documented the uneven distribution of long-term care resources and fiscal capacity across Chinese cities.27–29 However, this study extends the existing literature by demonstrating that high resource levels do not necessarily translate into effective system performance. While previous research has often examined benefit expansion and service capacity in isolation,30–32 the application of the coupling coordination framework in this study reveals that structural mismatches between these dimensions are a more critical determinant of policy efficacy than the absolute level of development. Furthermore, the identification of human resource capacity as the dominant obstacle corroborates international evidence,33,34 underscoring that human resource shortages function as the universal “binding constraint” that limits the translation of insurance funding into accessible care.
Coordination Patterns as Implementation Risks
Two typical mismatch patterns observed in the province imply distinct risk profiles for LTCI governance.
First, in cities where benefit levels outpace service capacity, the primary risk is entitlement realization. Several cities, notably Binzhou, Dongying, and Heze, exhibit this pattern, highlighting where targeted policy interventions are most needed. In such settings, insured individuals may struggle to convert policy entitlements into actual service, as local service capacity is insufficient to absorb the resulting demand.34,35 This high benefit, low supply pattern may lead to implementation gaps, reduced user satisfaction, and pressure for ad hoc policy adjustments.
Second, in cities where service capacity exceeds benefit levels, the system encounters underutilization and efficiency risk, illustrated by Zibo. When payment standards or reimbursement design are insufficient to generate effective demand, existing institutional capacity may remain idle, resulting in a mismatch between infrastructure investment and service uptake.36,37 Such high supply, low benefit settings may also weaken providers’ incentives for quality improvement if the benefit package does not support stable service utilization.38,39
Cities with dual low development, such as Dongying, Heze, and Liaocheng, are exposed to a low-level trap risk, where limited financing and weak service capacity mutually reinforce each other and constrain the system’s ability to scale.40,41 Collectively, these patterns underscore a central policy implication that expanding benefits or expanding supply in isolation is unlikely to be sustainable.42,43 Therefore, the core objective of LTCI system management should prioritize coordination over unilateral expansion.
Key Constraints
The Obstacle Degree Model reveals that barriers to long-term care coordination are primarily concentrated in two domains: human resource capacity and benefit depth. On the supply side, the persistent shortage of trained care workers suggests a structural human resource bottleneck rather than a short-term gap. This finding aligns with previous studies in other contexts, which identify staffing constraints in nursing homes as a binding constraint on policy effectiveness.33 On the benefit side, constraints related to payment standards and the number of actual beneficiaries highlight a critical gap between formal coverage and service use, where enrollment does not consistently translate into actual utilization. These two sets of constraints interact dynamically: enhancing benefits without corresponding improvements in human resource capacity may intensify service bottlenecks, while expanding capacity without adequate benefit design can weaken effective demand and limit realized access. In addition to these technical and policy constraints, political factors also shape the implementation of LTCI recommendations. Local government incentives, budgetary priorities, and cross-ministerial coordination can influence how cities respond to structural constraints and adopt policy guidance. Integrating a political economic perspective helps contextualize persistent barriers and highlights governance mechanisms that could facilitate more effective implementation.
Policy Recommendations
A risk management approach informs the design of a coordinated package with three priorities, tailored to city typology.
First, it is essential to enhance and stabilize service supply. In high-benefit, high-supply cities such as Qingdao, interventions should focus on human resource stabilization and capacity building through standardized training, certification pathways, and retention incentives.
Second, recalibrating the depth of benefits is necessary to improve entitlement realization while ensuring fiscal sustainability. In high-benefit, low-supply cities such as Binzhou and Dongying, priority should be given to adjusting benefit and payment standards to better reflect care intensity and local service costs, as well as introducing governance mechanisms to improve access and fiscal oversight.
Third, strategic purchasing should align service supply with benefit design to reduce implementation risks. In dual-low development cities such as Heze and Liaocheng, contracting and payment arrangements should link provider reimbursement to measurable service delivery and staffing levels, supported by routine joint monitoring frameworks to ensure benefits match local capacity trajectories.
Strengths and Contributions
This study makes three contributions that enhance its policy relevance and transferability. First, it analyzes the complete set of prefecture-level cities in Shandong Province, which avoids sample selection bias and provides administratively meaningful evidence base for provincial planning and performance management. Second, it integrates a coherent measurement and diagnostic sequence that supports implementation-oriented interpretation. Specifically, the entropy-weighted TOPSIS method generates comparable subsystem scores; the coupling coordination model evaluates the degree of alignment between subsystems; and obstacle diagnosis identifies the most constraining factors that affect coordination outcomes. This structured progression from measurement to evaluation to diagnosis is consistent with RMHP’s focus on evidence that informs implementation, risk management, and actionable policy design. Third, the study translates regional heterogeneity into decision-relevant insights by mapping coordination patterns and constraint structures across cities. This allows for the design of context-specific interventions, whether in settings where benefits outpaced service supply exceeds benefits, or where both remain underdeveloped, thereby linking observed patterns to distinct risk profiles and differentiated policy priorities.
Limitations and Future Research
Several limitations should be considered. First, the analysis is based on cross-sectional data, which supports comparisons across cities but does not capture the dynamic evolution of coordination in response to policy reforms over time. In addition, the cross-sectional design does not allow causal inference regarding the direction of the relationship between LTCI benefit level and service supply, nor does it allow the reciprocal relationship between the two subsystems to be formally tested. Because the study covered all 16 prefecture-level cities in Shandong Province, the analysis should be understood as a province-wide census rather than a sample-based inference. While this strengthens the completeness of within province comparison, the findings should be generalized to other provinces with caution, particularly because Shandong, as a principal contact province for LTCI pilots, has specific policy support and implementation conditions that may differ from those of provinces with other fiscal or infrastructure contexts. Future work using longitudinal panel data could examine whether benefit adjustments and human resource policies translate into measurable improvements in coordination trajectories. Second, the indicator system is constrained by the scope of publicly available administrative statistics. While it reflects key dimensions, such as financing, coverage, and service capacity, it fails to fully capture qualitative aspects, including service quality, user experience, continuity of care, and functional outcomes. Future studies could incorporate facility-level quality metrics and beneficiary-reported measures, supplemented by qualitative interviews, to clarify the relationship between coordination and realized care outcomes. Third, the analytical framework summarizes complex systems into composite scores and coordination indices, which enhances comparability but may obscure within-city variation and provider-level mechanisms. In addition, although equal subsystem weights were adopted in the baseline analysis, the robustness of coordination rankings under alternative weighting schemes was not formally tested in this study. Future research could combine the current macro-level assessment with micro-level data, such as facility staffing patterns and claims-based utilization, to examine how specific implementation features shape coordination and risk in different local contexts.
Conclusion
Overall, Shandong Province remains at a stage of low-level coordination, with distinct structural patterns across cities. Benefit-led cities such as Binzhou face entitlement realization risks, service-led cities such as Zibo risk underutilized capacity, and dual-low cities such as Dongying encounter a double trap of limited benefits and weak supply. Policy interventions should be tailored to city typologies to address the identified risks. Measures include dynamic payment adjustments linked to local wage indices, care intensity, or capacity trajectories, as well as targeted human resource stabilization. Low coordination also has practical implications for fiscal sustainability and public trust, highlighting the need for integrated, context-sensitive strategies.
Funding
This study was supported by Shandong First Medical University (Shandong Academy of Medical Sciences) (KZ2024114).
Disclosure
The authors report no conflicts of interest in this work.
References
1. World Health Organization. Ageing and health. WHO Fact sheet. Available from: https://www.who.int/news-room/fact-sheets/detail/ageing-and-health.
2. United Nations Department of Economic and Social Affairs, Population Division. World Population Ageing. 2023. New York: United Nations; Available from: https://www.un.org/development/desa/pd/sites/www.un.org.development.desa.pd/files/undesa_pd_2024_wpa2023-report.pdf.
3. World Health Organization. Long term care financing: how countries finance long term care. Brief 3. 2024. Available from: https://wkc.who.int/resources/publications/i/item/long-term-care-financing-how-countries-finance-ltc.
4. Llena Nozal A, Barszczewski J, Rauet Tejeda J. How do countries compare in their design of long term care provision? A typology of long term care systems. OECD Health Working Papers No. 182. OECD Publishing; 2025. doi:10.1787/44f5453a-en.
5. Lee SH, Chon Y, Kim YY. Comparative analysis of long term care in oecd countries: focusing on long term care financing type. Healthcare. 2023;11(2):206. doi:10.3390/healthcare11020206
6. OECD. Long term care settings. In: health at a Glance 2025: OECD Indicators [Internet]. Paris: OECD Publishing; 2025. Available from: https://www.oecd.org/en/publications/2025/11/health-at-a-glance-2025_a894f72e/full-report/long-term-care-settings_9f4aa221.html.
7. OECD. Who Cares? Attracting and Retaining Care Workers for the Elderly. Paris: OECD Publishing; 2020. Available from: https://www.oecd.org/en/publications/who-cares-attracting-and-retaining-elderly-care-workers_92c0ef68-en.html.
8. Stone RI. Who will care for us? addressing the long term care human resource crisis [Internet]. Washington (DC): Urban Institute; 2015. Available from:
9. Feng Z, Glinskaya E, Chen H, et al. Long-term care system for older adults in China. Lancet. 2020;396(10259):1367–12. doi:10.1016/S0140-6736(20)32136-X
10. Liu Y, Wu Y, Chen Y, et al. Projection for dementia burden in China to 2050.Lancet. Reg Health West Pac. 2024;50:101158.
11. Ministry of Human Resources and Social Security of the People’s Republic of China. Guiding opinions on initiating the long-term care insurance pilots. 2016. Available from: http://www.mohrss.gov.cn/xxgk2020/fdzdgknr/zlbmxgwj/ylbx/201607/t20160705_242951.html.
12. World Bank Group. Understanding China’s long-term care insurance pilots: what is going on? do they work? and where to go next? Technical Note. Washington (DC): World Bank Group; 2019. Available from: https://documents.worldbank.org/en/publication/documents-reports/documentdetail/496061563801421452.
13. Pei X, Yang W, Xu M. Examining the impact of long-term care insurance on the care burden and labor market participation of informal carers: a quasi-experimental study in China. J Gerontol B Psychol Sci Soc Sci. 2024;79(5):gbae023. doi:10.1093/geronb/gbae023
14. Li Q, Chen Y, Zhang Y, et al. Evaluation of China’s long-term care insurance policies. Front Public Health. 2024;12:1252817. doi:10.3389/fpubh.2024.1252817
15. Du K, Liu Y, Hu Y. Evaluation of long-term care insurance pilot city policies in China: a cross-sectional study. Front Public Health. 2025;13:1570794. doi:10.3389/fpubh.2025.1570794
16. Yao Y, Yin S, Chen W, et al. Impact of long-term care insurance on medical expenditure and utilization and the comparison between different pilot schemes: evidence from China. BMC Public Health. 2025;25:1379. doi:10.1186/s12889-025-22610-w
17. Wang Y, Wang W, Zhang Y, et al. A quantitative evaluation study of China’s Long-Term Care insurance policies based on the PMC index model: a case study of 16 pilot policy texts. PLoS One. 2025;20(4):e0321057. doi:10.1371/journal.pone.0321057
18. National Healthcare Security Administration of the People’s Republic of China. Ministry of Finance. Guiding Opinions on Expanding the Pilot Program of the Long Term Care Insurance System. 2020. Available from: https://www.nhsa.gov.cn/art/2020/9/16/art_37_3586.html.
19. Shandong Provincial Healthcare Security Administration. 2020 Shandong province healthcare security development statistical bulletin. Available from: https://ybj.shandong.gov.cn/module/download/downfile.jsp?classid=0&filename=d533783feae0428fabe33a5e0af97865.pdf.
20. Jin W, Wang J, Hu X. Preference of urban and rural older people in Shandong Province for long-term care insurance: based on discrete choice experiment. Front Public Health. 2024;12:1445273. doi:10.3389/fpubh.2024.1445273
21. Kim H, Jeon B. Developing a framework for performance assessment of the public long-term care system in Korea: methodological and policy lessons. Health Res Policy Syst. 2020;18(1):27. doi:10.1186/s12961-020-0529-8
22. OECD. Health at a Glance 2023: OECD Indicators. 2023. Available from: https://www.oecd.org/en/publications/2023/11/health-at-a-glance-2023_e04f8239/full-report.html.
23. Hwang CL, Yoon K. Multiple Attribute Decision Making: Methods and Applications. New York: Springer-Verlag; 1981.
24. Shannon CE. The mathematical theory of communication. MD Comput. 1997;14(4):306–317.
25. Lai Z, Ge D, Xia H, et al. Coupling coordination between environment, economy and tourism: a case study of China. PLoS One. 2020;15(2):e0228426. doi:10.1371/journal.pone.0228426
26. Zhang Y, Ma H, Wang Q, et al. Multicity comparative assessment and optimized management path of sustainability of the economy-energy-environment system: a case study of core cities in China’s three major economic circles. Integr Environ Assess Manag. 2024;20(3):875–887. doi:10.1002/ieam.4851
27. Chen B, Zhu X, Wang H, et al. The financing sustainability of long-term care insurance: an example from Nanning, China. Front Public Health. 2025;13. 1454037. doi:10.3389/fpubh.2025.1454037
28. Li X, Qin W, Jiang H, et al. Spatial equity and factors that influence the distribution of elderly care institutions in China. Int J Health Geogr. 2025;24(1):2.PMID: 40038664; PMCID: PMC11877872. doi:10.1186/s12942-025-00389-8
29. Yang C, Huang J, Yu J. Inequalities in resource distribution and healthcare service utilization of long-term care in China. Int J Environ Res Public Health. 2023;20(4):3459. doi:10.3390/ijerph20043459
30. Lei X, Bai C, Hong J, et al. Long-term care insurance and the well-being of older adults and their families: evidence from China. Soc Sci Med. 2022;296:114745. doi:10.1016/j.socscimed.2022.114745
31. Zhang T, Hu Z, Zhang K, et al. The impact of long-term care insurance on household expenditures of the elderly: evidence from China. PLoS One. 2025;20(4):e0316758. doi:10.1371/journal.pone.0316758
32. Huang Z, Jian A, Wang J, Chen H. The effects of public long-term care insurance on the long-term care industry in China: a quasi-experimental study. BMC Geriatr. 2025;25(1):276. doi:10.1186/s12877-025-05933-6
33. Heger D, Herr A, Lückemann M, et al. Personnel shortages and the provision of long-term care: an empirical analysis of German nursing homes. Eur J Health Econ. 2025;26(9):1539–1555. doi:10.1007/s10198-025-01782-7
34. OECD. Beyond Applause? Improving Working Conditions in Long-Term Care. Paris: OECD Publishing; 2023. doi:10.1787/27d33ab3-en
35. Chen S, Li L, Jiao L, et al. Long-term care insurance in China: current challenges and recommendations. J Glob Health. 2024;14:03015. doi:10.7189/jogh.14.03015
36. Zhang L, Han Y, Fang Y. Non-human and human service efficiency of long-term care facilities in China. Front Public Health. 2023;11:1066190. doi:10.3389/fpubh.2023.1066190
37. Zhu Z, Bai C. Assessing the role of long-term care insurance in shaping living arrangements of older adults: evidence from China. Health Policy Plan. 2025;40(6):641–651. doi:10.1093/heapol/czaf027
38. Konetzka RT, Skira MM, Werner RM. Incentive design and quality improvements: evidence from state medicaid nursing home pay-for-performance programs. Am J Health Econ. 2018;4(1):105–130. doi:10.1162/ajhe_a_00095
39. Hackmann MB, Pohl RV, Ziebarth NR. Patient versus provider incentives in long term care. Am Econ J Appl Econ. 2024;16(3):178–218. doi:10.1257/app.20210264
40. Guo L, Wei H, Tao Q, et al. Coupling coordination evaluation and influencing factors analysis of older adult care service resource supply and demand in China. Front Public Health. 2025;13:1662064. doi:10.3389/fpubh.2025.1662064
41. Ma M, Shi L, Xie W, et al. Coupling coordination degree of healthcare resource supply, demand and elderly population change in China. Int J Equity Health. 2024;23(1):147. doi:10.1186/s12939-024-02236-x
42. Hanson K, Barasa E, Honda A, et al. Strategic purchasing: the neglected health financing function for pursuing universal health coverage in low- and middle-income countries comment on “what’s needed to develop strategic purchasing in healthcare? policy lessons from a realist review“. Int J Health Policy Manag. 2019;8(8):501–504. doi:10.1186/s12939-024-02236-x
43. World Health Organization. Long-term care financing: aligning financing and delivery in long-term care. Lessons for low- and middle-income settings: brief 5. 2024. Available from: https://fctc.who.int/resources/publications/i/item/aligning-financing-and-delivery-in-long-term-care.
 © 2026 The Author(s). This work is published and licensed by Dove Medical Press Limited. The
full terms of this license are available at https://www.dovepress.com/terms
and incorporate the Creative Commons Attribution
- Non Commercial (unported, 4.0) License.
By accessing the work you hereby accept the Terms. Non-commercial uses of the work are permitted
without any further permission from Dove Medical Press Limited, provided the work is properly
attributed. For permission for commercial use of this work, please see paragraphs 4.2 and 5 of our Terms.
© 2026 The Author(s). This work is published and licensed by Dove Medical Press Limited. The
full terms of this license are available at https://www.dovepress.com/terms
and incorporate the Creative Commons Attribution
- Non Commercial (unported, 4.0) License.
By accessing the work you hereby accept the Terms. Non-commercial uses of the work are permitted
without any further permission from Dove Medical Press Limited, provided the work is properly
attributed. For permission for commercial use of this work, please see paragraphs 4.2 and 5 of our Terms.