Back to Journals » Clinical Epidemiology » Volume 13
Assessing Techniques for Quantifying the Impact of Bias Due to an Unmeasured Confounder: An Applied Example
Authors Barberio J ![]() , Ahern TP, MacLehose RF, Collin LJ, Cronin-Fenton DP
, Ahern TP, MacLehose RF, Collin LJ, Cronin-Fenton DP ![]() , Damkier P
, Damkier P ![]() , Sørensen HT
, Sørensen HT ![]() , Lash TL
, Lash TL ![]()
Received 31 March 2021
Accepted for publication 22 June 2021
Published 27 July 2021 Volume 2021:13 Pages 627—635
DOI https://doi.org/10.2147/CLEP.S313613
Checked for plagiarism Yes
Review by Single anonymous peer review
Peer reviewer comments 3
Editor who approved publication: Professor Vera Ehrenstein
Julie Barberio,1 Thomas P Ahern,2 Richard F MacLehose,3 Lindsay J Collin,1 Deirdre P Cronin-Fenton,4 Per Damkier,5 Henrik Toft Sørensen,4 Timothy L Lash1
1Rollins School of Public Health, Emory University, Atlanta, GA, USA; 2The Robert Larner College of Medicine, University of Vermont, Burlington, VT, USA; 3University of Minnesota, Minneapolis, MN, USA; 4Aarhus University Hospital, Aarhus, Denmark; 5Odense University Hospital, Odense, Denmark
Correspondence: Julie Barberio
Rollins School of Public Health, Emory University, Atlanta, GA, USA
Email [email protected]
Purpose: To compare the magnitude of bias due to unmeasured confounding estimated from various techniques in an applied example.
Patients and Methods: We examined the association between dibutyl phthalate (DBP) and incident estrogen receptor (ER)-positive breast cancer in a Danish nationwide cohort (N=1,122,042). Cox regression analyses were adjusted for age and active drug compounds contributing to DBP exposure. We estimated the hazard ratios (HRs) that would have been observed had one of the DBP sources been unmeasured and calculated the strength of confounding by comparing to the fully adjusted HR. We performed a quantitative bias analysis (QBA) of the “unmeasured” confounder, using external information to specify the bias parameters. Upper bounds on the bias were estimated and E-values were calculated.
Results: The adjusted HR for incident ER-positive breast cancer among women with high-level (≥ 10,000 cumulative milligrams) versus no DBP exposure was 2.12 (95% confidence interval 1.12 to 4.05). Removing each DBP source in isolation resulted in negligible change in the HR. The bias estimates from the QBA ranged from 1.00 to 1.01. The estimated maximum impact of unmeasured confounding ranged from 1.01 to 1.51. E-values ranged from 3.46 to 3.68.
Conclusion: The impact of bias due to simulated unmeasured confounding was negligible, in part, because the unmeasured variable was not independent of controlled variables. When a suspected confounder cannot be measured in the study data, our exercise suggests that QBA is the most informative method for assessing the impact. E-values may best be reserved for situations where uncontrolled confounding emanates from an unknown confounder.
Keywords: bias analysis, unmeasured confounding, the E-value
Introduction
Confounding occurs when the effect of an exposure on an outcome becomes mixed with the effect of another variable on the outcome and arises from the resulting lack of comparability between contrasted exposure groups.1 A confounder is a variable in a minimally sufficient set of variables that will leave no open backdoor path between the exposure and the outcome.2 Valid estimation of a causal effect of an exposure on an outcome requires that all confounding be controlled. When an investigator is aware of the identity of a potential confounder, but was unable to collect data on that variable, it is said to be an unmeasured confounder (as opposed to an unknown confounder, ie, a confounding variable about which the investigator is unaware). With unmeasured confounding, an investigator lacks the data necessary to control for the effect of confounding in the analysis phase (ie, via restriction, stratification, standardization, or regression) and therefore the observed association may be biased. The resulting bias may be in any direction and of any magnitude, making it particularly important to evaluate the potential impact of unmeasured confounding on study results.
There are few approaches available for assessing the impact of bias due to unmeasured confounding. The quantitative bias analysis approach for an unmeasured confounder aims to adjust an observed association between a dichotomous exposure and a dichotomous outcome to reflect the results that would have been obtained had the uncontrolled variable been available for adjustment. This is often achieved through use of information from external sources.1,3 The methods of Ding and VanderWeele4 and Flanders and Khoury5 place bounds on the maximum magnitude of the potential bias due to unmeasured confounding under different assumptions. Finally, VanderWeele and Ding developed the E-value as a method to estimate the minimum strength of association an unmeasured confounder would need to have with both the exposure and outcome to make the observed association null upon adjustment for the confounder.6 These approaches conventionally make a simplifying assumption that the unmeasured confounder is independent of controlled confounders, which is seldom true in practice. It is more likely that an uncontrolled confounder is indirectly, partially controlled for via the control of correlated, measured confounders in an analysis. Consequently, these methods may overestimate the impact of bias due to unmeasured confounding.
Through an applied example, we reproduced the analysis of a published pharmacoepidemiology study regarding the association between exposure to dibutyl phthalate (DBP) and incident estrogen receptor (ER)-positive breast cancer in a Danish nationwide cohort of women followed from January 1, 2005 to December 31, 2015 (N=1,122,042).7 Phthalates, which are endocrine disruptors, have been hypothesized to be associated with breast cancer via ER signaling.8–13 Many, but not all, drugs within a given drug class contain DBP in the capsules for the purposes of achieving delayed or extended release properties (ie, receipt of a prescription for a medication that may be formulated with DBP is not deterministic of an individual’s cumulative DBP exposure).14 Among other results, Ahern et al reported the rate of incident ER-positive breast cancer among women with high-level DBP exposure (≥10,000 cumulative milligrams) to be nearly twice the rate among those unexposed after adjusting for age, menopausal status, and drug classes contributing to DBP exposure (hazard ratio [HR] 1.9, 95% confidence interval [CI] 1.1 to 3.5). Our approach followed the same modeling procedures that yielded this observation but simulated the series of DBP-contributing medications as “unmeasured” confounders (ie, pretended that information on each DBP-contributing medication was unavailable in the study data).
The objective of this study was to compare the magnitude of bias due to unmeasured confounding estimated from various bias models with the true value of this magnitude calculated using the study population. We sought to evaluate whether conventional methods for modeling bias from an unmeasured confounder overestimate the magnitude of bias, largely because they treat the unmeasured confounder as being independent of controlled variables. We hypothesized that the observed strength of bias due to confounding by withholding individual confounders from the model would be negligible, and that the various bias models would produce overestimates of the strength of confounding.
Materials and Methods
This analysis used data from a published population-based study of the association between phthalate exposure and breast cancer incidence in a Danish nationwide cohort. The data sources have been described in detail elsewhere.7 Briefly, the population of all living female residents of Denmark without a recorded history of cancer or exposure to phthalate-contributing medications between January 1, 1995 and January 1, 2005 (ie, no exposure or outcome prior to cohort entry; N=1,122,042) was identified through a linkage of the Danish Civil Registration System, the Danish Cancer Registry, and the Danish National Prescription Registry.15 Cases of incident invasive breast cancer was ascertained from the Danish Cancer Registry and ER status was retrieved from the Danish Breast Cancer Group Registry.16 Phthalate-containing oral medications were identified via query of drug product excipient data in the Danish Medicines Agency internal pharmaceutical database.
Incidence of ER-positive breast cancer was modeled by fitting cause-specific Cox regression models with a 1-year exposure lag.17 Exposure was defined as the number of cumulative milligrams (mg) of DBP contained in all prescriptions filled by a patient (calculated as the mass of phthalate per capsule multiplied by the fill quantity of each redeemed prescription) during each year of follow-up, beginning on January 1, 2005. For the present study, DBP exposure was modeled as time-varying, updated yearly, and dichotomized as 10,000 mg or more versus no exposure (ie, the two most extreme exposure categories from the original analysis. Patients with DBP exposure less than 10,000 mg were not included in the analysis). Follow-up was censored upon the occurrence of a competing event: diagnosis of a non-breast malignancy (except non-melanoma skin cancer), diagnosis of ER-negative breast cancer, death, emigration from Denmark, or reaching the end of follow-up on December 31, 2015.
The following variables were included in each regression model: age (defined at baseline); menopausal status, dichotomized as premenopausal (age younger than 55 years) or postmenopausal (age 55 years or older); and drug substances (ie, active ingredients) contributing to phthalate exposure, characterized with annually updated indicator variables based on the fifth level of the Anatomic Therapeutic Chemical (ATC). The following drug substances (ATC codes) contributed to DBP exposure: bisacodyl (A06AB02), budesonide (A07EA06), diclofenac (M01AB05), diclofenac combinations (M01AB55), lithium (N05AN01), mesalamine (A07EC02), and multi-enzymes (A09AA02). Importantly, both phthalate-containing and phthalate-free pharmaceutical products in Denmark represented each drug in this list during the study period. The original study had Institutional Review Board approval from the University of Vermont.
Data Analysis
We separately used each drug in the set of drug substances contributing to DBP exposure (bisacodyl, budesonide, diclofenac, diclofenac combinations, lithium, mesalamine, and multi-enzyme) as the simulated unmeasured confounders (Ci, where i=bisacodyl, budesonide, diclofenac, diclofenac combinations, lithium, mesalamine, multi-enzymes). It is implausible that age would be unavailable in most analyses. Therefore, age was controlled in the models and was not modeled as an unmeasured confounder. Although menopausal status was included in multivariable models in the original analysis, it was not included in the present analysis because age (which was used as a proxy to classify menopausal status) likely effectively controls for any potential confounding of the association between phthalate exposure and incident breast cancer due to menopausal status. For each Ci, we employed various methods to quantify the impact of Ci being “unmeasured”: estimating the actual magnitude of confounding, performing a quantitative bias analysis to estimate the impact of the uncontrolled Ci,1 estimating limits for the maximum effect of Ci,4,5 and calculating the E-value associated with Ci.6
The Strength of Confounding
The true magnitude of confounding for each Ci was directly estimated via analysis of the original dataset, in which all variables Ci are available. A series of hazard ratios were computed using Cox regression models for incident ER-positive breast cancer among women with high-level DBP exposure (≥10,000 mg) versus women unexposed to DBP: (1) The crude hazard ratio ( ); (2) the hazard ratios with an added adjustment variable for each Ci alone (
 ); (3) the hazard ratios with added adjustment variables for all confounders except Ci (ie, age and the remaining six DBP-contributing drug substances; (
 ); (4) the hazard ratio with added adjustment variables for age and all seven DBP-contributing drug substances (
 ). The magnitude of confounding was estimated by the relative risk due to confounding, which was calculated using two methods. First, to estimate the magnitude of bias due to confounding by Ci that is present in the crude model (
 ), we computed the ratio of
  to
to  . Second, we computed the ratio of
  to HRadjusted to estimate the magnitude of bias due to confounding by Ci that remains when all other confounders were adjusted (
 ).
).
Quantitative Bias Analysis
We performed a quantitative bias analysis to estimate the magnitude of bias due to each Ci when viewed as the “unmeasured” confounder.1 This process required specification of the following bias parameters: the odds ratio for the association between the confounder and DBP exposure ( , the odds ratio for the association between the confounder and incident ER-positive breast cancer among those who were not exposed (
 ), and the prevalence of the confounder among those with neither exposure nor disease (pi). This information is not readily available, as is typical in bias analyses of unmeasured confounders. We therefore sought suitable surrogate information, as is standard practice.
The association between each DBP-contributing medication class and DBP exposure ( ) was estimated based on data from the United States National Health and Nutrition Examination Survey (NHANES) program.18 The following NHANES files from 1999 to 2014 were used: Demographic Variables and Sample Weights, Prescription Medications, Phthalates – Urine, and Body Measures. Our analysis was restricted to the subset of female NHANES participants for whom urinary phthalate laboratory data were available. We followed published methods to estimate exposure to DBP (in mg per kilogram per day) from the urinary concentrations of monobutyl phthalate (MBP), the main DBP metabolite, recorded in NHANES.19,20 This value was then converted into an estimate of annual DBP exposure and dichotomized into those with high-level annual DBP exposure (women with annual DBP exposure at or above the 99th percentile, emulating the proportion of women with high-level exposure achievement in Ahern et al7) versus those unexposed to DBP (women with annual DBP exposure below the threshold of assumed environmental exposure, calculated as the 90th percentile of exposure among women unexposed to any medication classes containing DBP21). Women with mid-level DBP exposure (ie, those with annual DBP exposure levels above the threshold for unexposure but below the threshold for high-level exposure) were excluded from this analysis. Women were considered exposed to each medication class if they reported having taken the medication (identified based on the NHANES standardized generic prescription medication names), accompanied by a prescription, in the month preceding the NHANES exam (and otherwise were considered to be unexposed). All medications of interest are available as both phthalate-containing and phthalate-free products (ie, a woman could be using a phthalate-free formulation of the medication of interest and therefore remain unexposed to DBP). Participants were able to report up to 23 medications.
  was calculated as the crude odds ratio for the association between each medication and high-level DBP exposure, using weighted frequencies produced from sampling weights provided by NHANES. For all medications with zero participants in any of the medication use and DBP exposure combinations, the odds ratio was calculated by pooling the data across all medications.
The association between each DBP-contributing medication and incident ER-positive breast cancer among those who were not exposed to DBP ( ) could not be directly estimated due to the lack of previous literature and available databases containing these variables. Instead, the primary medical indication for the drug, as determined by the ATC code therapeutic subgroup, was used as a proxy for each medication. These primary indications were then matched to a comorbid disease category as described by Ording et al22 as follows: bisacodyl: other diseases of the digestive system; budesonide: Crohn’s disease and ulcerative colitis; diclofenac: osteoporosis with and without fracture, rheumatoid arthritis and other inflammatory polyarthropathies; diclofenac combinations: osteoporosis with and without fracture, rheumatoid arthritis and other inflammatory polyarthropathies; lithium: schizophrenia, schizotypal, and delusional disorders; mesalamine: Crohn’s disease and ulcerative colitis; multi-enzyme: acute pancreatitis and other diseases of the pancreas. The corresponding odds ratio estimates for the associations between each comorbid disease category and incident breast cancer reported by Ording et al22 were used for
  . For medications with more than one primary indication, inverse variance weighting was used to pool the appropriate odds ratio estimates.
The prevalence of each DBP-contributing medication (pi) was estimated via publicly available, aggregated Finnish drug consumption statistics from 2015 from the Fimea database.23 Although the equivalent Danish data are publicly available, to be consistent with the use of external sources for the other bias parameters we decided to estimate this parameter using data from another Nordic country. Drug consumption in defined daily doses per 1,000 inhabitants per day, based on medicine sales (according to ATC codes) by drug wholesalers to pharmacies and hospitals, was used to estimate the proportion of daily users in the population. It was not possible to stratify the drug consumption data based on DBP exposure status or ER-positive breast cancer status (ie, to compute the prevalence of DBP-contributing medication among those unexposed and non-diseased). However, for the purposes of this exercise, we felt that the available overall prevalence value provided a sufficient bias parameter estimate.
Using these values for the bias parameters, the bias due to uncontrolled confounding by Ci was estimated according to the following quantitative bias analysis (QBA) formula:1  =
= 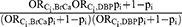 . It is worth noting that if pi =1 or pi=0, then
  =1, as there is no bias due to confounding by a particular variable when there is no variation in its value in a population.
As a supplementary analysis, this bias estimate was used to calculate the bias-adjusted hazard ratio accounting for adjustment of the “unmeasured” confounder.
Bounds on the Strength of Confounding
The methods of Ding and VanderWeele were used to calculate the upper limits of the bias due to unmeasured confounding by Ci using the values of the bias parameters specified above according to the formula:4 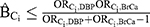 .
.
The methods of Flanders and Khoury were used to calculate such limits as the minimum of the following factors:5 (1)  ; (2)
; (2)  ; (3)
; (3)  ; (4)
; (4)  ; (5)
; (5)  .
.
The E-Value
The E-value was calculated for each Ci using the original dataset to assess the minimum strength of association that Ci would need to have with high-level DBP exposure and with incident ER-positive breast cancer to fully explain away the observed association, conditional on the other covariates and assuming no other source of unmeasured confounding. The formula in VanderWeele and Ding was used to compute the E-value (for an HR with a rare outcome), using  as our observed HR when Ci is “unmeasured” as follows:6
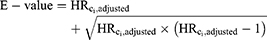
 and
and  , equal to each other and solving for this combined effect (the E-value).4 For the purposes of this example, we assumed age and all of the DBP-contributing medications to be sufficient to control for confounding of the association between DBP and ER-positive breast cancer. Each E-value therefore corresponds to the impact of Ci alone, rather than the impact of a hypothetical set of unmeasured confounders.
Results
As previously described,7 the cohort consisted of 1,122,042 women. In total, 20,180 cases of ER-positive breast cancer were diagnosed during 10,077,043 person-years of follow-up (cumulative incidence=2.00 cases per 1,000 person-years).
The Strength of Confounding
The crude hazard ratio ( ) for incident ER-positive breast cancer among women with high-level DBP exposure (≥10,000 mg) versus women unexposed to DBP was 1.85 (95% CI 1.02 to 3.34). Following adjustment only for Ci in isolation, the magnitude of the hazard ratio changed very little. The estimated bias due to confounding (
 ) ranged from 0.94 to 1.00, indicating that little to no bias would be expected were any of the Ci unmeasured (see Table 1).
 |
Table 1 Comparison of the Strength of Confounding of the Association Between Exposure to Dibutyl Phthalate (DBP) and Incident Estrogen Receptor (ER)-Positive Breast Cancer Due to Medications Contributing to DBP Exposure According to Various Bias Models. (Hazard Ratio Fully Adjusted for Age and All DBP-Contributing Medications: 2.12 [95% Confidence Interval 1.12 to 4.05]) |
After adjusting for all confounders, the hazard ratio ( ) for incident ER-positive breast cancer among women with high-level DBP exposure versus women unexposed to DBP was 2.12 (95% CI 1.12 to 4.05). This differs from the estimate obtained in the original analysis (1.9, 95% CI 1.1 to 3.5) due to the omission of menopausal status as a confounder in the present analysis. Removing each Ci in isolation resulted in negligible change of the hazard ratio. The estimated bias due to confounding (
 ) ranged from 0.95 to 1.00, suggesting the magnitude of bias due to unmeasured confounding by any of the Ci would have been small (see Table 1).
Quantitative Bias Analysis
The values of the bias parameters specified for each Ci are displayed in Table 1.
Of 82,091 studied NHANES participants, 21,003 had laboratory urinary phthalate data available. Of these participants, 10,660 were females. Cumulative annual DBP exposure could not be estimated for 100 female participants due to missing information on body weight (n=99) or creatinine (n=1). Among females with an estimated cumulative annual DBP value, 105 were considered to be exposed to high-level DBP (1%) and 9,493 (90%) were considered unexposed to DBP. The remaining 962 women with mid-level DBP exposure were excluded from analysis. Exposure to at least one of the DBP-contributing medications of interest was reported by 99 females. One female participant reported use of bisacodyl; 43 reported use of budesonide; 29 reported use of diclofenac; 5 reported use of diclofenac combination; 15 reported use of lithium; 8 reported use of mesalamine; and 0 reported use of multi-enzymes. We were only able to directly calculate a crude odds ratio for the association between lithium and high-level DBP exposure ( =3.63) and the association between mesalamine and high-level DBP exposure (
 =218.44). All other medications had no females who were both exposed to the medication and exposed to DBP; the
  for these medications was therefore calculated from the pooled data across all 7 medications (
 =4.63).
For estimating  , the DBP-contributing medications were matched to comorbid disease categories as a proxy. The corresponding odds ratio estimates for the associations between each comorbid disease category and incident breast cancer as reported by Ording et al22 are displayed in Table 1.
Using aggregated publicly available Finnish registry data on drug consumption in 2015, the overall prevalence of each Ci was calculated as displayed in Table 1.
Using these values for the bias parameters and the QBA method, the bias due to uncontrolled confounding by Ci ( ) was estimated to range between 1.00 and 1.01 for the DBP-contributing medications (see Table 1). The subsequent bias-adjusted hazard ratios accounting for adjustment of Ci are displayed in Supplementary Table 1.
Bounds on the Strength of Confounding
The upper limit of bias due to unmeasured confounding by each Ci, calculated using the specified bias parameters, was found to range from 1.01 to 1.32 according to the methods of Ding and VanderWeele4 and from 1.01 to 1.51 according to the methods of Flanders and Khoury5 (see Table 1).
The E-Value
Using Cox regression models, which included all confounders except Ci ( ), we estimated that the minimum association that the simulated unmeasured confounder Ci would need to have with both DBP exposure and incident ER-positive breast cancer to explain away the full DBP-breast cancer association to range from 3.46 to 3.68 (see Table 1).
Discussion
In this applied example, we conducted analyses in which known, measured confounders were simulated as “unmeasured” and compared the magnitude of bias due to unmeasured confounding estimated from various bias models with the true value calculated from the study population. Removing each “unmeasured” DBP-contributing medication variable in isolation resulted in negligible changes in the HR of the association between DBP exposure and incident ER-positive breast cancer (ie, relative bias due to confounding ranged from 0.95 to 1.00). We believe this was partially due to a lack of independence between the unmeasured variable and the other controlled variables. Additionally, it is also important to note that there is no strong evidence that links the DBP-contributing medications or their indications to incidence of breast cancer, therefore these variables are not expected to be strong confounders of the association between DBP exposure and incident ER-positive breast cancer. Comparing the HR adjusted only for age (1.94, 95% CI 1.07 to 3.50) to the HR for adjusted for age plus all DBP-contributing medications (2.12, 95% CI 1.12 to 4.05), the relative bias due to this set of confounders is estimated to be only 0.91.
Bias parameters, specified based on external information, were used to conduct a quantitative bias analysis and to bound the magnitude of bias due to the “unmeasured” confounder. The relative bias due to uncontrolled confounding based on the quantitative bias analysis was estimated to be near null (ie, ranged from 1.00 to 1.01), which accurately represents our conclusions based on the data from the study population. These bias estimates did not appear to overestimate the true magnitude of the bias as was expected, which is likely attributable to the low prevalence of the “unmeasured” variables (ie, all DBP-contributing medications had an estimated prevalence of less than 0.5%).
The estimated maximum impact of bias due to unmeasured confounding ranged from 1.01 to 1.32 according to methods of Ding and VanderWeele4 and from 1.01 to 1.51 according to methods of Flanders and Khoury.5 These estimated bounds, which are quite similar, suggest the impact of bias due to confounding by the “unmeasured” variable to be small. While these values do provide an overestimate of the magnitude of the bias, they are meant to serve as an indication of the maximum relative bias and therefore this is expected. Overall, the conclusions from these bounds are aligned with the reference values from the study population.
Finally, the computed E-values (for HRs with a rare outcome) indicated that the strength of association between an “unmeasured” confounder and DBP, and with incident ER-positive breast cancer, would need to be in the range of 3.46 to 3.68 or larger to explain away the observed DBP-breast cancer associations. It is apparent that these large E-values, in contrast with the near-null estimates of confounding bias from the quantitative bias analysis and the bounding factors, are uninformative regarding the actual relative bias due to uncontrolled confounding observed in this example. This is due, importantly, to the different purpose served by the E-values as compared to the quantitative bias analysis and bounding factors. While the quantitative bias analysis and bounding techniques used in this example estimate the magnitude of the bias by making assumptions about the strength of association between the confounder and exposure and the confounder and outcome, the E-value instead focuses on the strength of the unmeasured confounder necessary to reduce the observed association to the null (assuming the confounder has the same association with the exposure and outcome). That is, the relatively large E-values in this example only indicate that if the confounder had the same effect on the exposure and the outcome, this shared magnitude of association would have to be relatively large to completely explain away the observed association. It does not tell us how the observed association would change if the confounder had a different magnitude of effect for the exposure and outcome, or if the shared effect were less than the E-value. Both of these are likely true in this example, and the quantitative bias analysis approach we implemented directly answers this question: the confounder adjusted effect would not differ much from the unadjusted effect.
Overall, in this applied example, we observed the estimated bias due to unmeasured confounding from the quantitative bias analysis and bounding techniques to be the most informative regarding the true magnitude of the near-null bias. The large E-values, however, were not particularly useful. There are extreme assumptions behind the E-value that diminish its utility in this example. The E-value assumes the effect of the confounder on the exposure ( and the effect of the confounder on the outcome (
 to be equal. In this example, however, these confounder associations were very different: the values estimated for
  ranged between 1.01 and 1.51 while the values estimates for
  ranged between 3.32 and 218.44. Additionally, the E-value does not require specification of the prevalence of the unmeasured confounders; instead, the bound is obtained by assuming a worst case scenario. Namely, that the prevalence of the confounder among the exposed could be as high as 100%. A confounder with a prevalence this high is typically implausible. In this example, we estimated the prevalence of the unmeasured confounders to all be less than 0.5%. Were such a low prevalence used, we would find that an even more extreme confounder (with a larger shared confounder-exposure and confounder-disease association) would be required to reduce the observe effect to the null.
There are several strengths of our approach. First, our use of several techniques for quantifying the impact of bias due to an unmeasured confounder allowed for a side-by-side comparison of the results. Furthermore, through use of a data source in which information on the “unmeasured” variables was available, we were able to calculate the strength of confounding directly by comparing HRs before and after exclusion of the “unmeasured” variable from the regression. This approach facilitated a comparison of results from various techniques for quantifying the impact of bias due to an unmeasured confounder to a reference value of the true strength of confounding.
Our approach, however, is not without limitations. The use of external information for the bias parameters may have produced imperfect bias-adjusted estimates. Despite having information available on each of these bias parameters in the study population, we chose to treat this exercise as authentically as possible and therefore presumed that data on each “unmeasured” variable was unavailable in our data source. We sought external sources that provided the best estimates of these bias parameters, but some of our bias parameters (eg, the use of primary medical indication as a proxy for the DBP-contributing drugs) may be inaccurate. This highlights the nuances of the quantitative bias analysis approach. Additionally, while we observed negligible impact of bias due to unmeasured confounding, this may be attributable to either the low prevalence of the “unmeasured” variables or the modest associations of the “unmeasured” variable with ER-positive breast cancer. Furthermore, it is important to note that, while our analyses have addressed unmeasured confounding due to DBP-contributing substances, there may still remain unmeasured confounding in the association between DBP and ER-positive breast cancer due to other unmeasured variables (eg, socioeconomic status, comorbidities, medication use history). We made a simplifying assumption for the purposes of this analysis that age and the DBP-contributing substances were sufficient to control for confounding, thus lending meaningful interpretation of the E-value as a measure of the impact of each individual unmeasured confounder. In the situation where additional unmeasured confounders exist, however, the E-value would instead be capturing the impact of the set of unmeasured confounders. Next, we estimated the true strength of confounding, which served as a reference point for the estimates obtained from the bias models, by removing each DBP-contributing medication from the Cox regression models in isolation and estimating the HRs in the presence of this “unmeasured” confounding. These estimates therefore depend on the correct classification and specification of the DBP-contributing medications, the failure of which may have resulted in residual confounding. Finally, our analyses are the result of analyzing one specific dataset and while the results are instructive, in other datasets with alternative correlation structures results would be expected to differ.
Conclusion
Overall, in this example, the true impact of bias due to unmeasured confounding as estimated using the study population was negligible. This was accurately reflected by the results of the quantitative bias analysis1 and the bounds on the maximum strength of confounding according to Ding and VanderWeele4 and Flanders and Khoury.5 The E-values were far less informative about the practical implication of uncontrolled confounding. The computation of the E-value only required input of the observed HRs, whereas the other methods used external information specific to the unmeasured confounder of interest. It appears that the addition of such external information, despite being imperfectly estimated, allowed us to more successfully estimate the near-null impact of the uncontrolled confounders. This suggests that when an investigator recognizes the identity of an unmeasured confounder and wants to quantify its potential impact on the observed association, it is beneficial to go through the quantitative bias analysis process and estimate the nature of the unmeasured confounder rather than making no assumptions about the confounder and calculating the E-value. We suggest that when knowledge about a potential unmeasured confounder is available, quantitative bias analysis is the most informative technique to investigate the impact from an uncontrolled confounder. E-values may best be reserved for situations in which the identity of an unmeasured confounder is truly unknown.
Funding
This work was supported in part by Susan G. Komen for the Cure (CCR13264024) awarded to Thomas P. Ahern and the US National Library of Medicine (R01LM013049) awarded to Timothy L Lash. Lindsay J. Collin and Timothy L. Lash were supported in part by awards from the US National Cancer Institute (F31CA239566 and R01CA166825, respectively). Thomas P. Ahern was supported in part by an award from the US National Institute of General Medical Sciences (P20 GM103644).
Disclosure
Julie Barberio's doctoral stipend and tuition are supported by an award to Emory University from Amgen, Inc. The Department of Clinical Epidemiology, Aarhus University Hospital, receives funding for other studies from companies in the form of research grants to (and administered by) Aarhus University. None of these studies have any relation to the present study. Timothy L. Lash is a member of the Methods Advisory Council for Amgen, Inc, for which he is compensated as a consultant. Lindsay J. Collin reports grants from NCI and NCATS during the conduct of the study. The authors report no other conflicts of interest in this work.
References
1. Lash TL, Fink AK, Fox MP. Unmeasured and unknown confounders. In: Applying Quantitative Bias Analysis to Epidemiologic Data. Springer; 2009:59–78.
2. VanderWeele TJ, Shpitser I. On the definition of a confounder. Ann Stat. 2013;41(1):196–220. doi:10.1214/12-AOS1058
3. Greenland S. Basic methods for sensitivity analysis of biases. Int J Epidemiol. 1996;25(6):1107–1116. doi:10.1093/ije/25.6.1107
4. Ding P, VanderWeele TJ. Sensitivity analysis without assumptions. Epidemiology. 2016;27(3):368–377. doi:10.1097/EDE.0000000000000457
5. Flanders WD, Khoury MJ. Indirect assessment of confounding: graphic description and limits on effect of adjusting for covariates. Epidemiology. 1990;1(3):239–246. doi:10.1097/00001648-199005000-00010
6. VanderWeele TJ, Ding P. Sensitivity analysis in observational research: introducing the E-value. Ann Intern Med. 2017;167(4):268–274. doi:10.7326/M16-2607
7. Ahern TP, Broe A, Lash TL, et al. Phthalate exposure and breast cancer incidence: a Danish nationwide cohort study. J Clin Oncol. 2019;37(21):1800–1809. doi:10.1200/JCO.18.02202
8. Chen FP, Chien MH, Chern IY. Impact of low concentrations of phthalates on the effects of 17beta-estradiol in MCF-7 breast cancer cells. Taiwan J Obstet Gynecol. 2016;55(6):826–834. doi:10.1016/j.tjog.2015.11.003
9. Chen FP, Chien MH. Lower concentrations of phthalates induce proliferation in human breast cancer cells. Climacteric. 2014;17(4):377–384. doi:10.3109/13697137.2013.865720
10. van Meeuwen JA, Korthagen N, de Jong PC, Piersma AH, van den Berg M. (Anti)estrogenic effects of phytochemicals on human primary mammary fibroblasts, MCF-7 cells and their co-culture. Toxicol Appl Pharmacol. 2007;221(3):372–383. doi:10.1016/j.taap.2007.03.016
11. Okubo T, Suzuki T, Yokoyama Y, Kano K, Kano I. Estimation of estrogenic and anti-estrogenic activities of some phthalate diesters and monoesters by MCF-7 cell proliferation assay in vitro. Biol Pharm Bull. 2003;26(8):1219–1224. doi:10.1248/bpb.26.1219
12. Harris CA, Henttu P, Parker MG, Sumpter JP. The estrogenic activity of phthalate esters in vitro. Environ Health Perspect. 1997;105(8):802–811. doi:10.1289/ehp.97105802
13. Hong EJ, Ji YK, Choi KC, Manabe N, Jeung EB. Conflict of estrogenic activity by various phthalates between in vitro and in vivo models related to the expression of Calbindin-D9k. J Reprod Dev. 2005;51(2):253–263. doi:10.1262/jrd.16075
14. Hauser R, Duty S, Godfrey-Bailey L, Calafat AM. Medications as a source of human exposure to phthalates. Environ Health Perspect. 2004;112(6):751–753. doi:10.1289/ehp.6804
15. Schmidt M, Schmidt SAJ, Adelborg K, et al. The Danish health care system and epidemiological research: from health care contacts to database records. Clin Epidemiol. 2019;11:563–591. doi:10.2147/CLEP.S179083
16. Christiansen P, Ejlertsen B, Jensen M-B, Mouridsen H. Danish breast cancer cooperative group. Clin Epidemiol. 2016;8:445–449. doi:10.2147/CLEP.S99457
17. Lau B, Cole SR, Gange SJ. Competing risk regression models for epidemiologic data. Am J Epidemiol. 2009;170(2):244–256. doi:10.1093/aje/kwp107
18. Kim C, Werther W, Iskander KS, Gruber M, Mezzi K. Demographic and clinical characteristics of multiple myeloma (MM) patients treated with carfilzomib-based regimens in a real world setting. Blood. 2017;130(Supplement 1):5441.
19. Koch HM, Drexler H, Angerer J. An estimation of the daily intake of di(2-ethylhexyl)phthalate (DEHP) and other phthalates in the general population. Int J Hyg Environ Health. 2003;206(2):77–83. doi:10.1078/1438-4639-00205
20. Hernández-Díaz S, Mitchell AA, Kelley KE, Calafat AM, Hauser R. Medications as a potential source of exposure to phthalates in the US population. Environ Health Perspect. 2008;117(2):185–189. doi:10.1289/ehp.11766
21. Kelley KE, Hernández-Díaz S, Chaplin EL, Hauser R, Mitchell AA. Identification of phthalates in medications and dietary supplement formulations in the United States and Canada. Environ Health Perspect. 2012;120(3):379–384. doi:10.1289/ehp.1103998
22. Ording AG, Garne JP, Nyström PMW, et al. Hospital recorded morbidity and breast cancer incidence: a nationwide population-based case-control study. PLoS One. 2012;7(10):e47329–e47329. doi:10.1371/journal.pone.0047329
23. Fimea Finnish Medicines Agency. Drug consumption statistics. Consumption 2020; https://www.fimea.fi/web/en/databases_and_registeries/consumption.
 © 2021 The Author(s). This work is published and licensed by Dove Medical Press Limited. The
full terms of this license are available at https://www.dovepress.com/terms
and incorporate the Creative Commons Attribution
- Non Commercial (unported, 3.0) License.
By accessing the work you hereby accept the Terms. Non-commercial uses of the work are permitted
without any further permission from Dove Medical Press Limited, provided the work is properly
attributed. For permission for commercial use of this work, please see paragraphs 4.2 and 5 of our Terms.
© 2021 The Author(s). This work is published and licensed by Dove Medical Press Limited. The
full terms of this license are available at https://www.dovepress.com/terms
and incorporate the Creative Commons Attribution
- Non Commercial (unported, 3.0) License.
By accessing the work you hereby accept the Terms. Non-commercial uses of the work are permitted
without any further permission from Dove Medical Press Limited, provided the work is properly
attributed. For permission for commercial use of this work, please see paragraphs 4.2 and 5 of our Terms.