")
Back to Journals » Nature and Science of Sleep » Volume 15
Assessing Resilience to Sleep Loss Among the Italian Population: A 13-Item Model of the Iowa Resistance to Sleeplessness Test (iREST)
Authors Viselli L , Festucci F , Pino MC, D'Atri A, Salfi F, Amicucci G, Corigliano D, Naccarato F , Ferrara M , Tempesta D
Received 16 June 2023
Accepted for publication 10 October 2023
Published 11 October 2023 Volume 2023:15 Pages 811—821
DOI https://doi.org/10.2147/NSS.S426255
Checked for plagiarism Yes
Review by Single anonymous peer review
Peer reviewer comments 2
Editor who approved publication: Prof. Dr. Ahmed BaHammam
Lorenzo Viselli,1,* Fabiana Festucci,1,* Maria Chiara Pino,1 Aurora D’Atri,1 Federico Salfi,1 Giulia Amicucci,1,2 Domenico Corigliano,1,2 Federica Naccarato,1 Michele Ferrara,1 Daniela Tempesta1
1Department of Biotechnological and Applied Clinical Sciences, University of L’Aquila, L’Aquila, Italy; 2Department of Psychology, Sapienza University of Rome, Rome, Italy
*These authors contributed equally to this work
Correspondence: Michele Ferrara, Department of Biotechnological and Applied Clinical Sciences, University of L’Aquila, L’Aquila, Italy, Email [email protected]
Purpose: The present study aimed to validate the Italian version of the Iowa Resistance to Sleeplessness Test (iREST), a 16-item self-report assessing resilience to sleep debt in the affective, cognitive, and somatic domains.
Participants and Methods: We examined its factor structure, assessed internal consistency and criterion validity, and established test-retest reliability on 768 Italian native speakers (65.8% of women) with a mean age of 25.98 years old.
Results: Confirmatory factor analysis (CFA) revealed a new 13-item structure for the Italian iREST (iREST-13), demonstrating more satisfactory goodness-of-fit values, and exhibiting good internal consistency (Cronbach’s α ranging from 0.73 to 0.89), relative to the 16-item original version. Results supported the iREST convergent validity, showing significant independence from established measures of sleep; low correlations with conceptually unrelated measures supported divergent validity, indicating that the iREST effectively measures resistance to sleeplessness without confounding with other constructs. Lastly, test-retest reliability was evaluated by administering the iREST to the same sample with a 2-week interval: the significant correlations supported its temporal stability.
Conclusion: Further studies are needed to evaluate the applicability of the iREST in diverse populations and explore its relationship with objective sleep measures. Nevertheless, the Italian iREST provides a valuable tool for assessing resistance to sleep loss, offering insights into individual differences in resilience. Additionally, the iREST can assist in identifying individuals who require interventions to enhance resilience to sleep debt, as well as help clinicians evaluate the impact of chronic sleep disruption and deliver targeted interventions.
Keywords: sleeplessness, resilience, sleep loss, vulnerability, individual differences, Italian validation
Introduction
Proper sleep is essential to maintain health and optimize overall functioning during wakefulness, and an estimated 7–9 hours of total sleep is recommended.1 However, in Italy, one out of three individuals sleep an insufficient number of hours. In a study conducted from February to March 2019, Varghese et al interviewed 3120 Italians and found a widespread prevalence of insufficient sleep. On average, participants reported getting 7 hours of sleep per night, with 30% of individuals sleeping ≤6 hours per night.2
Chronic lack of sleep is a widespread problem in modern societies. When sleep is shortened or disrupted, it can lead to many adverse consequences, including impaired neurocognitive performance, such as attentional and memory processes, dysregulated emotional responses,3,4 increased somatic symptoms, like dizziness and cardiac dysregulation,5 and compromised impulse control, such as overeating and being quick-tempered.6 Moreover, sleeplessness can lead to fatigue, daytime sleepiness, mood disturbances, and overall decreased well-being.7 Nevertheless, research showed that the detrimental effect of partial sleep deprivation on cognitive performances could be mitigated by physical activity. In this context, a study by Taheri and Irandoust (2020) demonstrated that engaging in low-intensity aerobic training in the morning effectively mitigated the detrimental consequences of partial sleep deprivation, leading to an enhancement in impaired cognitive performance.8 Similarly, research conducted by Paryab et al indicated that administering melatonin treatment 30 minutes before a training session resulted in notable improvements in reaction time, static/dynamic balance, anaerobic power, and lactic acid levels among athletes experiencing 4 or 24-hour sleep deprivation.9
However, the impact of sleep loss can vary among individuals,10 with some individuals seemingly more resilient than others. Genetic factors, such as variations related to sleep regulation and cognitive development,11 play a significant role in this vulnerability.12 While these factors can help to predict differences in cognitive impairments resulting from sleep loss, they only explain a portion of the observed variability. In fact, despite the susceptibility to sleep loss differs between individuals, it has trait-like characteristics, meaning that it remains relatively stable within individuals.13 Moreover, the within-subjects variability in resistance to sleeplessness does not appear consistent in all domains.5,14 Indeed, intraindividual variability seems to cluster along three dimensions that reflect self-evaluation of mood, cognitive processing, and behavioral alertness:5 for example, subjects who show resistance in the affective domain might not show the same resistance in the cognitive one.
In order to gain valuable insights into vulnerability factors and predict individuals’ tolerance to sleep debt, Krizan and Hisler developed the Iowa Resistance to Sleeplessness Test (iREST© Zlatan Krizan, Ph.D.; Garrett Hisler, Ph.D.; Iowa State University Research Foundation, Inc.),15 a 16-item self-report questionnaire measuring the consequences of sleep loss across the cognitive (6 items), socio-affective (6 items), and physiologic (4 items) domains. Individuals are asked to answer questions that assess their feelings and reactions on days following a two-hour sleep loss compared to their usual well-rested days. The answers are recorded on a 5-point Likert scale, ranging from “almost always” (1) to “rarely or never” (5), and higher values indicate more resistance to sleep loss. Krizan and Hisler examined the psychometric properties of the iREST and showed appropriate indices: Cronbach’s alphas were 0.87 for the affective subscale, 0.90 for the cognitive subscale, 0.77 for the physiological subscale, and 0.92 for the full-scale, indicating a high degree of internal consistency; correlations with other self-report measures supported construct validity.
Given these promising psychometric values, we aimed to validate an Italian version of the iREST to address the lack of a suitable test for the evaluation of the impact of sleep loss. To date this is the first attempt to validate the iREST in the Italian language, and, to the best of our knowledge, it is also the first validation in a language other than English.
In order to address our goal, we asked and obtained formal authorization from Iowa State University to translate the iREST; then, we examined its factor structure, assessed its reliability in terms of internal consistency, and established its construct validity by comparing iREST scores with scores on other questionnaires. We also assessed the Test-Retest Reliability by administering the same test to the same subjects two weeks apart to measure consistency over time.
Method
Participants
Seven hundred and sixty-eight participants (65.8% of women), with a mean age of 25.98 years old (SD = 9.06; ranging from 18 to 66), were recruited to complete an online survey. Inclusion criteria encompassed Italian as the first language and a minimum age of 18 years old. The employment status of the sample was: university student (61.72%), employed (22.79%), self-employed (4.43%), unemployed (3.65%), Ph.D. student (3.52%), homemaker (1.95%), high school student (1.82%), and retired (0.13%). The mean years of education were 14.44 (SD = 2.30). Participation was anonymous and voluntary.
The study was approved by the institutional review board of the University of L’Aquila (protocol n. 41772/2022) and was performed according to the principles established by the Declaration of Helsinki.
Procedure
To validate the iREST, an online set of questionnaires was employed using Google Forms and distributed among university students in L’Aquila. Participants were encouraged to share the survey with their relatives and friends to expand the sample size. The survey was open for participation from December 12, 2022, to January 11, 2023. A total of four hundred and sixty-three participants (60.29%) from the initial sample took part in a second administration, two weeks later, to assess the temporal stability of the Italian version of the iREST.
The online survey started with a digital consent form describing the nature of the study. Following that, participants were asked for their demographic information (age, gender, occupation, education), then the set of questionnaires was presented. Despite the anonymous nature of the survey, participants’ phone numbers and email addresses were collected to facilitate a recall for the second administration, but this information was not connected to their individual responses. On average it took approximately 15 minutes to complete the entire survey.
Measures
The iREST is a 16-item self-report questionnaire developed to assess individuals’ susceptibility to sleep loss across affective, cognitive, and somatic domains. Items responses are given on a 5-point Likert scale ranging from 1 (almost always) to 5 (rarely or never). Scores for the affective, cognitive, and somatic domains are calculated by summing responses at the relative items. Domain scores can be summed giving rise to a total general resistance factor (range 16–80). In each domain as for the general factor, a higher score indicates more resistance to sleep loss. The authors showed an appropriate degree of internal consistency for this measure: Cronbach’s alphas were 0.87 for the affective subscale, 0.90 for the cognitive subscale, 0.77 for the physiological subscale, and 0.92 for the full-scale. The iREST has been adapted into Italian through the back-translation method, to ensure the semantic equivalence of the Italian and the English versions. For the present study, two authors independently translated the iREST from English to Italian and reached an agreement on a common version, which was then back-translated from Italian to English by a bilingual individual. Finally, two experts in psychological research discussed any discrepancies with the translators until a consensus was reached.15
The Pittsburgh Sleep Quality Index (PSQI) is a 19-item questionnaire utilized to assess sleep quality embracing seven dimensions (subjective sleep quality, sleep latency, sleep duration, habitual sleep efficiency, sleep disturbance, sleep medication, and daytime dysfunction). Each item is scored between 0 and 3, giving rise to a total sleep quality score (range 0–21). Higher scores reflect more severe sleep difficulties. The Italian version of this measure shows an internal consistency coefficient (α) of 0.83.16
The Insomnia Severity Index (ISI; α = 0.75) is a 7-item screening tool widely used to evaluate insomnia symptoms severity. Each item is scored on a 5-point Likert scale (0–4), and the sum leads to a total insomnia severity score. A higher ISI score (range 0–28) indicates worse insomnia symptoms.17
The reduced Morningness-Eveningness Questionnaire (rMEQ) is a 5 items questionnaire adopted to identify circadian typologies. The 5 items assess an individual’s preferred times of activities, sleep, and waking hours. Through scoring rules, a total score (range 4–25) can be calculated to classify the chronotype. Lower values indicate a preference for eveningness, while higher values indicate a preference for morningness. The validation of this measure showed an α = 0.71.18
The Italian validation of the Dysfunctional Beliefs and Attitudes about Sleep Questionnaire (DBAS-30) showed an α = 0.85. This measure identifies and evaluates different sleep/insomnia-related cognition through 30 self-reported items. Each item is scored on an 11-point Likert scale (0–10) from strongly disagree to strongly agree. Five scales regarding different sleep/insomnia-related cognition can be derived from DBAS. Specifically, misattribution or amplification of insomnia consequences, diminished perception of control and predictability of sleep, unrealistic sleep expectations, misconceptions about the causes of insomnia, and faulty beliefs about sleep-promoting practices. For each scale, a higher score indicates a greater presence of dysfunctional beliefs about sleep. Moreover, a total score can be calculated by summing the scale responses.19
The General Decision-Making Style (GDMS) is a 25-item questionnaire structured in 5 scales representing different decision-making styles (rational, α = 0.70; intuitive, α = 0.76; dependent, α = 0.84; avoidant, α = 0.81; spontaneous, α = 0.78). Items responses are given on a 5-point Likert scale ranging from strongly disagree to strongly agree. A higher score in each dimension indicates a greater tendency toward that decision-making style.20
The Difficulties in Emotion Regulation Scale (DERS-20) is a 20-item questionnaire widely adopted to analyze individual differences in emotional regulation, namely the ability to recognize, accept, and cope with emotional experiences. The items are scored on a 5-point Likert scale ranging from 1 (almost never) to 5 (almost always), leading to 5 dimensions of emotional regulation difficulties. These dimensions are non-acceptance of emotional responses (Non-acceptance), difficulties engaging in goal-directed behavior (Goals), impulse control difficulties (Impulse), lack of emotional clarity (Clarity), and lack of emotional awareness (Awareness). Moreover, a total score can be derived by summing subscale scores, with higher scores indicating greater emotion regulation difficulties. The internal consistency coefficient of the Italian version of the DERS-20 is α = 0.90, and its dimensions range between 0.84 and 0.92.21
The Big Five Inventory (BFI-10) is a 10-item questionnaire utilized to measure personality traits based on the Big Five Model of personality. Assessed personality traits include openness, conscientiousness, extraversion, agreeableness, and neuroticism. Participants rate each item on a 5-point Likert scale ranging from 1 (strongly disagree) to 5 (strongly agree). The trait score is the sum of each relative item, a higher score indicates a higher level of the trait. The internal consistency of the BFI-10 was assessed using the Spearman-Brown coefficients, which were >0.50.22
Statistical Analysis
Descriptive statistics were performed on age, gender, employment status, and years of education. To validate the Italian version of the iREST we analyzed the factor structure via confirmatory factor analysis (CFA), and the internal consistency reliability through Cronbach’s alpha coefficients. Moreover, as in Krizan and Hisler,15 the existence of a general latent factor was evaluated through Structural Equation Modeling (SEM). Criterion validity was tested via Pearson correlation analysis between iREST scores and the above-cited questionnaires. Finally, we assessed the temporal stability running Pearson correlations between the two different iREST scores collected with a 2-week interval.
Model goodness-of-fit was evaluated via several indices: the comparative fit index (CFI), the Tucker-Lewis coefficient (TLI), the standardized root mean squared residual (SRMR), and the root mean square error of approximation (RMSEA). CFI and TLI values close to 1 show a very good fit, while 1 represents a perfect fit.23,24 SRMR values ≤.05 are considered acceptable.25 For RMSEA we considered acceptable values ranging between 0.05 and 0.08.26 Eventually, to directly compare the fit of models, the Akaike information criterion (AIC) score was used: AIC penalizes the model complexity and lower AIC values indicate better fit.27 Moreover, the Bayes information criterion (BIC) was used to apply a higher penalty to complex models than the ones applied by the AIC: again, lower BIC values indicate better fit.28
Jamovi (version 2.3.21)29 was adopted to perform all the above-mentioned analyses.
Results
The Italian 13-Item Version of the iREST (iREST-13)
The CFA performed on the Italian version of the iREST to test the model proposed by Krizan and Hisler showed unsatisfactory fit indices.15 Specifically, the Comparative Fit Index (CFI) and Tucker-Lewis index (TLI) indicate poor fit.18,20 Moreover, the Root Mean Square Error of Approximation (RMSEA) was unacceptable since the value was greater than 0.1.20 Only the Standardized Root Mean Square Residual (SRMR) fit index showed an acceptable fit.20 Since only one fit index was acceptable, we did not consider the model fit satisfactory. Then, post-hoc model performances were conducted to assess potential issues in the evaluated model.
Post-hoc model performance results highlighted elevated modification indices (MI) for three pairs of items. Specifically, the pair of items 5 and 6 of the affective subscales (MI=230,64), the pairs of items 2 and 3 (MI=262.90), and items 4 and 5 (MI=193.69) of the cognitive subscale. It is inadequate to modify the model based solely on modification indices.30 Thus, statistical and judgmental criteria were followed to assess the validity of the items.21 Items redundancy was hypothesized due to high semantic similarity between the pairs of items with high MI. Redundancy was assessed for each subscale via inter-item correlation setting a cut-off value of 0.7.31,32 For the pairs of items with an inter-item correlation above the critical value of 0.7, the one with the lowest factors loading in the CFA was removed to reduce redundancy.
Inter-item correlations for each iREST subscale are reported in Tables 1–3 for the affective, cognitive, and somatic subscales respectively.
 |
Table 1 Pearson Correlation Matrix Among the Affective Subscale Items |
 |
Table 2 Pearson Correlation Matrix Among the Cognitive Subscale Items |
 |
Table 3 Pearson Correlation Matrix Among the Somatic Subscale Items |
The inter-item correlations between items 5 and 6 of the affective subscale (r = 0.701), between items 2 and 3 (r = 0.738), and between items 4 and 5 of the cognitive subscale (r = 0.834) were higher than the critical value of 0.7. Based on the factor loading reported in Table 4, item 5 of the affective subscale, and items 2 and 5 of the cognitive subscale were removed from the questionnaire to reduce redundancy. Consequently, a 13-item Italian version of the iREST turned out.
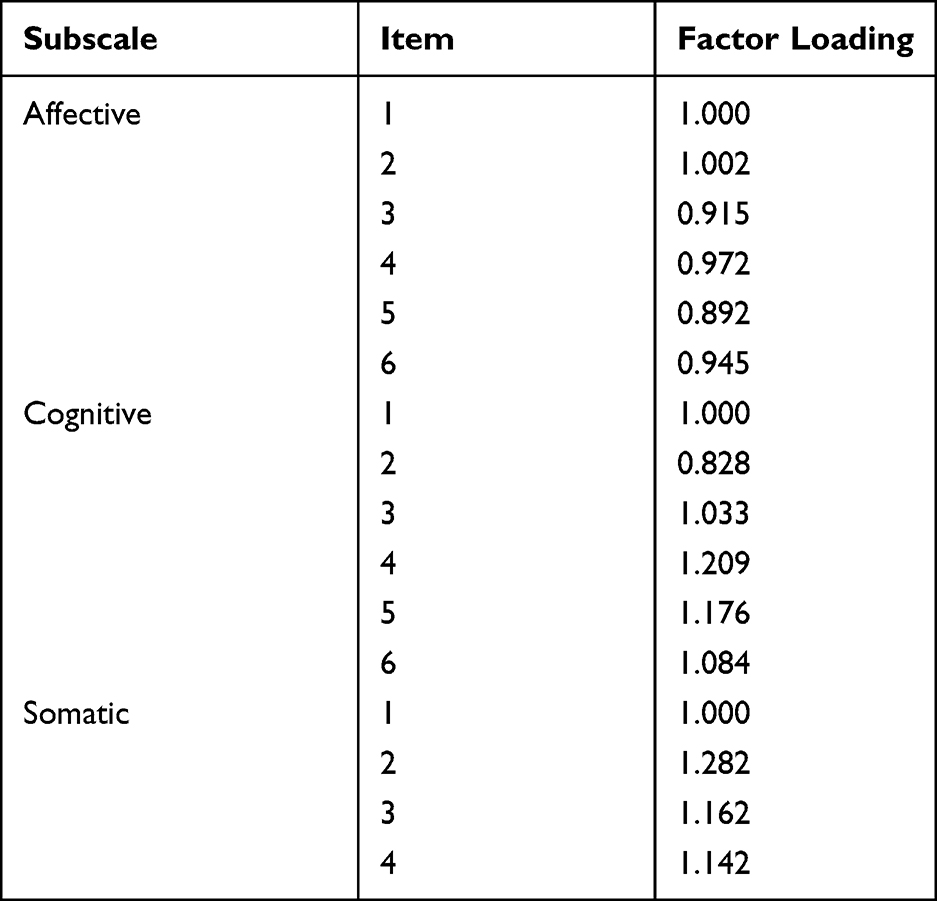 |
Table 4 Items Factor Loading of the Italian Version of the iREST |
After scale pruning due to item redundancy, the model quality of the 13-item variant of the Italian version of the iREST was tested through CFA, showing good model fit indices. Specifically, the CFI and TLI indicate a close fit.16,18 Moreover, the SRMR was under the critical value of 0.05,20 and the RMSEA was reasonably good since the value was <0.08.20 Measures of comparative fit were also adopted to assess the accuracy of the 13-item variant of the Italian version of the iREST over the 16-item one. Akaike Information Criterion (AIC) and Bayesian Information Criterion (BIC) measures of comparative fit suggested the 13-item as the better-performing model since lower AIC and BIC values indicate better fit. For a complete view of the goodness-of-fit values, the reader can refer to Table 5.
 |
Table 5 Measures of Comparative Fit for the 16-Item and the 13-Item Version for the Italian iREST |
Considering these fit indices, we decided to adopt the 13-item variant of the Italian iREST (iREST-13). Consequently, all the below-reported analyses were conducted on the 13-item model, whose factor structure can be found in Figure 1.
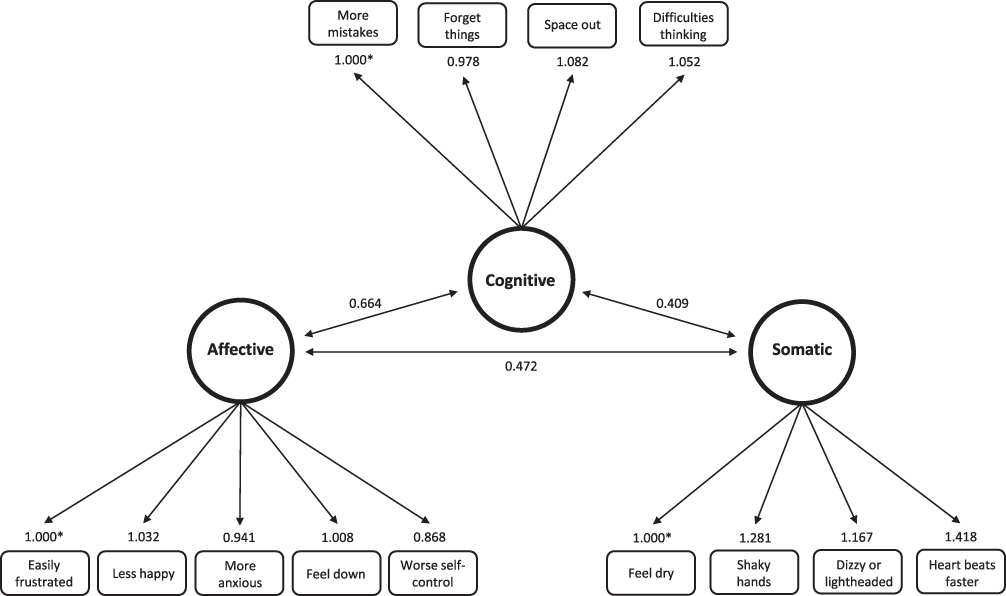 |
Figure 1 Factor structure of the 13-item version of the Italian iREST (iREST-13). Items factor loadings are reported above each item; the asterisks indicate that the relationships are fixed at 1 as the referring value. Values on the lines linking the factors represent Pearson correlations. |
Structural Equation Modelling (SEM)
The general resistance latent factor accounted for substantial proportions of variance of the inferior affective (R2 = 0.88), cognitive (R2 = 0.75), and somatic factors (R2 = 0.41). The values of the variance explained by the general resistance factor in the iREST-13 are nearly identical to those reported by Krizan and Hisler (Affective R2 = 0.83, Cognitive R2 = 0.74, Somatic R2 = 0.48).15
Construct Validity
Here we discuss the subscales of the iREST-13. For a complete view of all the correlations, the reader can refer to Table 6.
 |
Table 6 Correlations Between the Italian iREST-13 and Other Questionnaires |
Firstly, we ran correlations between the iREST-13 and PSQI, ISI, and DBAS scores, which support convergent validity. All the iREST-13 subscales negatively correlate with the PSQI: lower PSQI scores (better sleep quality) are significantly (p<0.001) associated with higher affective (r = −0.302), cognitive (r = −0.165), and somatic (r = −0.315) resistance. Similarly, higher ISI scores are significantly (p<0.001) associated with the affective (r = −0.409), cognitive (r = −0.285), and somatic (r = −0.394) subscales of the iREST-13. Lastly, the iREST-13 shows significant (p<0.001) negative correlations also with the DBAS in all its domains: affective (r = −0.463), cognitive (r = −0.385), and somatic (r = 0.310). Pearson correlations showed no relationship between the resistance to sleep loss and chronotype (rMEQ).
To evaluate divergent validity, we calculated Pearson correlations between iREST-13 and a scale measuring emotional coping (DERS-20) and decision-making styles (GDMS). The GDMS domains show low significant correlations with the iREST-13 domains. Particularly, the affective domain of the iREST-13 shows negative correlations with the dependent (r = −0.152; p<0.01), avoidant (r = −0.202; p<0.001), and spontaneous (r = −0.103; p<0.05) domains of the GDMS. At the same time, the cognitive domain of the iREST-13 shows negative correlations with the dependent (r = −0.154; p<0.001), and avoidant (r = −0.211; p<0.001) domains of the GDMS. Lastly, the somatic domain of the iREST-13 shows a negative correlation only with the avoidant (r = −0.112; p<0.05) domain of the GDMS. The iREST-13 domains also show significant correlations with the DERS overall scores: affective (r = −0.335, p<0.001), cognitive (r = −0.257; p<0.001), and somatic (r = −0.261; p<0.001).
We also ran correlations between the iREST-13 and the BFI-10 scores to evaluate the relationship between resistance to sleep loss and personality traits. We observed that the conscientiousness domain of the BFI-10 shows low but significant correlations with the affective (r = 0.154; p<0.001), cognitive (r = 0.171; p<0.001), and somatic (r = 0.096; p<0.01) subscales of the iREST-13. At the same time, the somatic subscale of the iREST-13 also correlates with the agreeableness (r = 0.084; p<0.05) and openness (r = −0.101; p<0.01) subscales of the BFI-10. Lastly, the openness subscale also correlates with the affective domain of the iREST-13 (r = −0.083; p<0.05).
Test-Retest Reliability
Pearson correlation coefficient computed between the iREST-13 scores obtained with a 2-week interval shows good temporal stability: affective subscale r = 0.72 (p<0.001); cognitive subscale r = 0.73 (p<0.001); somatic subscale r = 0.67 (p<0.001); overall scale r = 0.76 (p<0.001).
Internal Consistency Reliability
Reliability coefficients for the 13-item iREST-13 range from acceptable (α>0.73) to good (α>0.89) internal consistency. Specifically, the affective domain showed an α = 0.82, the cognitive domain showed an α = 0.88, the somatic domain showed an α = 0.73, and the overall scale showed an α = 0.89. The reader can refer to Table 7 for the presentation of Cronbach’s α if item dropped.
 |
Table 7 Current Cronbach’s Alpha (α) Internal Reliability Coefficients for the iREST-13, and Cronbach’s α if Item Dropped |
Discussion
Our study aimed to validate the Italian version of the iREST by Krizan and Hisler,15 in order to provide a self-report measure able to identify individuals more resistant to sleep loss across three different domains: affective, cognitive, and somatic. Unlike the original paper, our CFAs revealed that the 16-item structure does not adequately represent the Italian version of the iREST. Thus, we are putting forth a new 13-item model (iREST-13), which demonstrates improved goodness-of-fit values when applied to our dataset.
Our results support the psychometric validity and temporal stability of the iREST-13. The structure of scale scores indicates the presence of a general resistance factor, as well as distinct factors associated with affective, cognitive, and somatic domains. Moreover, the iREST-13 exhibits a satisfactory level of internal consistency, as evidenced by Cronbach’s α values ranging from 0.73 to 0.89. This indicates that the subscales of the iREST-13 effectively assess individuals’ resistance to sleeplessness across the affective, cognitive, and somatic domains.
Similarly to the original questionnaire, the iREST-13 captures unique aspects of individual differences not assessed in other validated questionnaires. In fact, Pearson correlations confirmed the appropriate convergent validity of the iREST-13 that showed significant correlations with established measures of sleep quality, insomnia, and beliefs about sleep. Specifically, the results revealed that individuals reporting higher iREST-13 scores, indicating greater resistance to sleep loss, also reported better sleep quality (PSQI), fewer insomnia symptoms (ISI), and fewer dysfunctional beliefs about sleep (BDAS). These results suggest that the iREST-13 demonstrates a significant level of independence from established measures of sleep, providing evidence of its convergent validity: the measures align with the same underlying construct but they do not overlap, since they evaluate sleep in distinct ways. On the other hand, consistent with the original study, there was no significant relationship between the iREST-13 and the rMEQ, suggesting that the subjective resistance to the effects of sleep loss is unrelated to chronotype.
To investigate the divergent validity of the iREST-13, our study incorporated the assessment of correlations with conceptually unrelated measures. The results indicated low correlations with the decision-making measure (GDMS), indicating strong divergent validity. This suggests that the iREST-13 effectively measures the construct it is intended for (resistance to sleeplessness) without delving into unrelated constructs. However, the correlations between the iREST-13 and the DERS-20 appear to be relatively high to be considered for divergent validity. The substantial relationship observed could potentially be attributed to the well-known mutual influence between sleep and emotions,33,34 or it might be due to the presence of the affective domain in the iREST-13 design.
We also ran correlations between the iREST-13 and the BFI-10: with a few exceptions, it appears that personality traits have minimal influence on resistance to sleep loss. Notably, individuals who exhibit higher levels of conscientiousness generally display greater resistance to sleep loss. Additionally, individuals with higher scores of agreeableness seem to cope better with sleeplessness in terms of somatic experience than in other domains. Furthermore, less resistant individuals, particularly in the affective and somatic domains, tend to be more open to new experiences. However, the correlations between the iREST-13 and the BFI-10 are <0.2, indicating a very weak relationship, which might support the divergent validity but cannot provide a solid basis for discussing the relationship between resistance to sleep loss and personality traits.
Lastly, we analyzed the test-retest reliability, examining the correlations between the two administrations of the iREST-13 with a 2-week interval. The results revealed significant correlations, indicating that the measure is stable over time. This temporal consistency suggests that the iREST-13 yields reliable results, making it a valuable tool for evaluating resistance to sleep loss.
Some limitations of our study must be acknowledged. Firstly, our sample predominantly consisted of healthy adults across a broad age range, raising questions about the applicability of the Italian iREST-13 to clinical and younger populations. Further studies are needed to assess its suitability in these specific contexts. Secondly, it is important to consider that the iREST-13 relies on self-report measures, and it may be subjected to response biases. Self-reported functioning reflects individuals’ perception of their own capacities compared to the investigated domain. Consequently, the actual ability of the subject can be over- or underestimated.35 While we validated the iREST-13 using self-report measures, it would be useful to expand the investigation by exploring the relationship between iREST-13 scores and objective measures, such as electrophysiological and behavioral indicators of sleep loss. Furthermore, an inherent limitation of this questionnaire is its assessment of resistance to sleeplessness, which is based on a specific two-hour nightly sleep loss scenario, potentially limiting its applicability. However, the literature reports intraindividual stability in individuals’ response to varying amounts of sleep debt:5,36 for example, individuals who express greater vulnerability to total sleep deprivation (TSD) also express greater vulnerability to sleep restriction, suggesting that the resistance to sleep loss may be a trait-like characteristic.11 Therefore, it would be interesting to include the iREST-13 in different sleep manipulation protocols to further investigate its sensitivity.
In conclusion, the ability to maintain emotional composure, persevere through frustration, and exercise self-control can be influenced by sleep loss, and these aspects should demonstrate individual different consequences, ie in alertness, mood, and cognitive performance. Assessing individual resistance to sleep loss may help to promote well-being, especially in the working context; moreover, it may facilitate the identification of people more resistant to sleep loss, providing a cost-effective evaluation of individuals who require support to improve resilience and well-being. By effectively identifying individuals who are likely to exhibit resilience in complex psycho-behavioral responses, work performance can be optimized, adverse events minimized, and well-being promoted even in the face of sleep disruption. At a broader population level, such a measure could identify individuals who would benefit from interventions aimed at promoting resilience and well-being in case of sleep loss. At a clinical level, considering the reciprocal relationship between sleep and psychopathology, tools like this could benefit clinicians in assessing the impact of chronic sleep disruption on individuals with mental health disorders. By employing such tools, clinicians can gain valuable insights into the interplay between sleep and psychopathology, enabling them to better comprehend how sleep disturbances contribute to the development, maintenance, or exacerbation of mental health conditions. With this understanding, clinicians can then deliver more effective interventions to their patients, aiming to alleviate the distressing symptoms associated with both sleep disruption and psychopathology. Ultimately, the integration of such measures into clinical practice had the potential to enhance the overall effectiveness of treatment approaches, leading to improved outcomes and better quality of life for individuals grappling with the complex interrelationship of sleep and mental health.
Data Sharing Statement
The data and materials used in this study are available to researchers on request by contacting the corresponding author.
Acknowledgments
We would like to thank the participants of this study for their time and effort. Thanks to Andrew Reay MacKay for his help with the back-translation.
Funding
This research did not receive any specific grant from funding agencies in the public, commercial, or not-for-profit sectors.
Disclosure
The authors declare no conflicts of interest in this work.
References
1. Hirshkowitz M, Whiton K, Albert SM, et al. National Sleep Foundation’s sleep time duration recommendations: methodology and results summary. Sleep Health. 2015;1(1):40–43. doi:10.1016/j.sleh.2014.12.010
2. Varghese NE, Lugo A, Ghislandi S, Colombo P, Pacifici R, Gallus S. Sleep dissatisfaction and insufficient sleep duration in the Italian population. Sci Rep. 2020;10(1):17943. doi:10.1038/s41598-020-72612-4
3. Balter LJT, Sundelin T, Holding BC, Petrovic P, Axelsson J. Intelligence predicts better cognitive performance after normal sleep but larger vulnerability to sleep deprivation. J Sleep Res. 2022;32:e13815. doi:10.1111/jsr.13815
4. Lowe CJ, Safati A, Hall PA. The neurocognitive consequences of sleep restriction: a meta-analytic review. Neurosci Biobehav Rev. 2017;80:586–604. doi:10.1016/j.neubiorev.2017.07.010
5. Ablin JN, Clauw DJ, Lyden AK, et al. Effects of sleep restriction and exercise deprivation on somatic symptoms and mood in healthy adults. Clin Exp Rheumatol. 2013;31(6 Suppl 79):S53–S59.
6. Greer SM, Goldstein AN, Walker MP. The impact of sleep deprivation on food desire in the human brain. Nat Commun. 2013;4:2259. doi:10.1038/ncomms3259
7. Basit H, Damhoff TC, Huecker MR. Sleeplessness And Circadian Disorder. In: StatPearls. StatPearls Publishing; 2022.
8. Taheri M, Irandoust K. Morning exercise improves cognitive performance decrements induced by partial sleep deprivation in elite athletes. Biol Rhythm Res. 2020;51(4):644–653. doi:10.1080/09291016.2019.1576279
9. Paryab N, Taheri M, H’Mida C, et al. Melatonin supplementation improves psychomotor and physical performance in collegiate student-athletes following a sleep deprivation night. Chronobiol Int. 2021;38(5):753–761. doi:10.1080/07420528.2021.1889578
10. Floros O, Axelsson J, Almeida R, et al. Vulnerability in executive functions to sleep deprivation is predicted by subclinical attention-deficit/hyperactivity disorder symptoms. Biol Psychiatry Cogn Neurosci Neur. 2021;6(3):290–298. doi:10.1016/j.bpsc.2020.09.019
11. Satterfield BC, Stucky B, Landolt HP, Van Dongen HPA. Unraveling the genetic underpinnings of sleep deprivation-induced impairments in human cognition. Prog Brain Res. 2019;246:127–158. doi:10.1016/bs.pbr.2019.03.026
12. Kuna ST, Maislin G, Pack FM, et al. Heritability of performance deficit accumulation during acute sleep deprivation in twins. Sleep. 2012;35(9):1223–1233. doi:10.5665/sleep.2074
13. Rupp TL, Wesensten NJ, Balkin TJ. Trait-like vulnerability to total and partial sleep loss. Sleep. 2012;35(8):1163–1172. doi:10.5665/sleep.2010
14. Wei Y, Blanken TF, Van Someren EJW. Insomnia really hurts: effect of a bad night’s sleep on pain increases with insomnia severity. Front Psychiatry. 2018;9:377. doi:10.3389/fpsyt.2018.00377
15. Krizan Z, Hisler G. The Iowa Resistance to Sleeplessness Test (iREST). Sleep Health. 2021;7(2):229–237. doi:10.1016/j.sleh.2020.12.002
16. Curcio G, Tempesta D, Scarlata S, et al. Validity of the Italian version of the Pittsburgh sleep quality index (PSQI). Neurol Sci. 2013;34(4):511–519. doi:10.1007/s10072-012-1085-y
17. Castronovo V, Galbiati A, Marelli S, et al. Validation study of the Italian version of the Insomnia Severity Index (ISI). Neurol Sci. 2016;37(9):1517–1524. doi:10.1007/s10072-016-2620-z
18. Natale V, Esposito MJ, Martoni M, Fabbri M. Validity of the reduced version of the morningness-eveningness questionnaire. Sleep Biol Rhythms. 2006;4(1):72–74. doi:10.1111/j.1479-8425.2006.00192.x
19. Coradeschi D, Novara C, Morin CM. Dysfunctional beliefs and attitudes about sleep questionnaire: versione italiana ed analisi della fedeltà. Psicoter Cogn Comport. 2000;6:33–44.
20. Gambetti E, Fabbri M, Bensi L, Tonetti L. A contribution to the Italian validation of the general decision-making style inventory. Pers Individ Dif. 2008;44:842–852. doi:10.1016/j.paid.2007.10.017
21. Lausi G, Quaglieri A, Burrai J, Mari E, Giannini AM. Development of the DERS-20 among the Italian population: a study for a short form of the difficulties in emotion regulation scale. MJCP. 2020;8(2). doi:10.6092/2282-1619/mjcp-2511
22. Guido G, Peluso AM, Capestro M, Miglietta M. An Italian version of the 10-item big five inventory: an application to hedonic and utilitarian shopping values. Pers Individ Dif. 2015;76:135–140. doi:10.1016/j.paid.2014.11.053
23. Hu L-T, Bentler PM. Fit indices in covariance structure modeling: sensitivity to under-parameterized model misspecification. Psychol Methods. 1998;3(4):424–453. doi:10.1037/1082-989X.3.4.424
24. Bentler PM, Bonett DG. Significance tests and goodness of fit in the analysis of covariance structures. Psychol Bull. 1980;88(3):588–606. doi:10.1037/0033-2909.88.3.588
25. Diamantopoulos A, Siguaw JA. Introduction to LISREL: A Guide for the Uninitiated. London: SAGE Publications, Inc; 2000.
26. MacCallum RC, Browne MW, Sugawara HM. Power analysis and determination of sample size for covariance structure modeling. Psychol Methods. 1996;1(2):130–149. doi:10.1037/1082-989X.1.2.130
27. Byrne BM. Structural Equation Modeling with LISREL, PRELIS, and SIMPLIS: Basic Concepts, Applications, and Programming. New York, NY: Psychology Press; 2013.
28. Schwarz G. Estimating the dimension of a model. Anna Stat. 1978;6(2):461–464. doi:10.1214/aos/1176344136
29. The Jamovi Project. Jamovi (Version 2.3) [Computer Software]; 2023. Available from: https://www.jamovi.org.
30. Scott SG, Bruce RA. The Development and Assessment of a New Measure. Educ Psychol Meas. 1995;55:818–831. doi:10.1177/0013164495055005017
31. Alhija FAN. Factor Analysis: an Overview and some contemporary advances. In: International Encyclopedia of Education. Elsevier; 2010:162–170. doi:10.1016/B978-0-08-044894-7.01328-2
32. Woods CM, Edwards MC. Factor analysis and related methods. Stat Methods Med Res. 2011;27:174–201. doi:10.1016/S0169-7161(07)27012-9
33. Tempesta D, Socci V, De Gennaro L, Ferrara M. Sleep and emotional processing. Sleep Med Rev. 2018;40:183–195. doi:10.1016/j.smrv.2017.12.005
34. Vandekerckhove M, Wang YL. Emotion, emotion regulation and sleep: an intimate relationship. AIMS Neurosci. 2017;5(1):1–17. doi:10.3934/Neuroscience.2018.1.1
35. Coman L, Richardson J. Relationship between self-report and performance measures of function: a systematic review. Can J Aging. 2006;25(3):253–270. doi:10.1353/cja.2007.0001
36. Asai T, Kaneita Y, Uchiyama M, et al. Epidemiological study of the relationship between sleep disturbances and somatic and psychological complaints among the Japanese general population. Sleep Biol Rhythms. 2006;4(1):55–62. doi:10.1111/j.1479-8425.2006.00197.x
 © 2023 The Author(s). This work is published and licensed by Dove Medical Press Limited. The full terms of this license are available at https://www.dovepress.com/terms.php and incorporate the Creative Commons Attribution - Non Commercial (unported, v3.0) License.
By accessing the work you hereby accept the Terms. Non-commercial uses of the work are permitted without any further permission from Dove Medical Press Limited, provided the work is properly attributed. For permission for commercial use of this work, please see paragraphs 4.2 and 5 of our Terms.
© 2023 The Author(s). This work is published and licensed by Dove Medical Press Limited. The full terms of this license are available at https://www.dovepress.com/terms.php and incorporate the Creative Commons Attribution - Non Commercial (unported, v3.0) License.
By accessing the work you hereby accept the Terms. Non-commercial uses of the work are permitted without any further permission from Dove Medical Press Limited, provided the work is properly attributed. For permission for commercial use of this work, please see paragraphs 4.2 and 5 of our Terms.