Back to Journals » Infection and Drug Resistance » Volume 11
Assessing health burden risk and control effect on dengue fever infection in the southern region of Taiwan
Authors Cheng YH ![]() , Lin YJ
, Lin YJ ![]() , Chen SC
, Chen SC ![]() , You SH
, You SH ![]() , Chen WY
, Chen WY ![]() , Hsieh NH
, Hsieh NH ![]() , Yang YF, Liao CM
, Yang YF, Liao CM ![]()
Received 31 March 2018
Accepted for publication 15 June 2018
Published 6 September 2018 Volume 2018:11 Pages 1423—1435
DOI https://doi.org/10.2147/IDR.S169820
Checked for plagiarism Yes
Review by Single anonymous peer review
Peer reviewer comments 5
Editor who approved publication: Dr Eric Nulens
Yi-Hsien Cheng,1 Yi-Jun Lin,2 Szu-Chieh Chen,3,4 Shu-Han You,5 Wei-Yu Chen,6,7 Nan-Hung Hsieh,8 Ying-Fei Yang,9 Chung-Min Liao9
1Institute of Computational Comparative Medicine (ICCM), Department of Anatomy and Physiology, College of Veterinary Medicine, Kansas State University, Manhattan, KS, USA; 2Institute of Food Safety and Health Risk Assessment, National Yang-Ming University, Taipei, Taiwan, Republic of China; 3Department of Public Health, Chung Shan Medical University, Taichung, Taiwan, Republic of China; 4Department of Family and Community Medicine, Chung Shan Medical University Hospital, Taichung, Taiwan, Republic of China; 5Institute of Food Safety and Risk Management, National Taiwan Ocean University, Keelung, Taiwan, Republic of China; 6Department of Biomedical Science and Environmental Biology, Kaohsiung Medical University, Kaohsiung, Taiwan, Republic of China; 7Research Center for Environmental Medicine, Kaohsiung Medical University, Kaohsiung, Taiwan, Republic of China; 8Department of Veterinary Integrative Biosciences, College of Veterinary Medicine and Biomedical Sciences, Texas A&M University, College Station, TX, USA; 9Department of Bioenvironmental Systems Engineering, National Taiwan University, Taipei, Taiwan, Republic of China
Background: The high prevalence of dengue in Taiwan and the consecutive large dengue outbreaks in the period 2014–2015 suggest that current control interventions are suboptimal. Understanding the effect of control effort is crucial to inform future control strategies.
Objectives: We developed a framework to measure season-based health burden risk from 2001 to 2014. We reconstructed various intervention coverage to assess the attributable effect of dengue infection control efforts.
Materials and methods: A dengue–mosquito–human transmission dynamic was used to quantify the vector–host interactions and to estimate the disease epidemics. We used disability-adjusted life years (DALYs) to assess health burden risk. A temperature-basic reproduction number (R0)–DALYs relationship was constructed to examine the potential impacts of temperature on health burden. Finally, a health burden risk model linked a control measure model to evaluate the effect of dengue control interventions.
Results: We showed that R0 and DALYs peaked at 25°C with estimates of 2.37 and 1387, respectively. Results indicated that most dengue cases occurred in fall with estimated DALYs of 323 (267–379, 95% CI) at 50% risk probability. We found that repellent spray had by far the largest control effect with an effectiveness of ~71% in all seasons. Pesticide spray and container clean-up have both made important contributions to reducing prevalence/incidence. Repellent, pesticide spray, container clean-up together with Wolbachia infection suppress dengue outbreak by ~90%.
Conclusion: Our presented modeling framework provides a useful tool to measure dengue health burden risk and to quantify the effect of dengue control on dengue infection prevalence and disease incidence in the southern region of Taiwan.
Keywords: dengue, DALYs, modeling, infection, control intervention
Introduction
Southern Taiwan with relatively high temperatures and relative humidity year-round forms an ideal condition for the female mosquito (Aedes aegypti)-transmitted dengue.1,2 Despite its importance, current knowledge on the nature and drivers of changing dengue infection in southern Taiwan is unclear. The effect of dengue control interventions on A. aegypti infection prevalence is also poorly understood. Moreover, the high prevalence of dengue in southern Taiwan and the consecutive large dengue outbreaks in the period 2014–2015 suggest that current control strategies are suboptimal.
Mathematical modeling is an essential tool to address public concerns relating to an ever-expanding number of emerging diseases and to explore the importance of biological and ecological characteristics on disease transmission.3,4 Mathematical models are useful tools in controlling infectious disease, allowing us to optimize the use of limited resources or simply to target control measures more efficiently.4 A variety of mathematical models have been proposed for enhancing our understanding of the interactions between the mosquito−human population dynamics and dengue transmission.4–9
For vector-borne diseases, the vectorial capacity and the basic reproduction number (R0) are usually used to characterize the critical components involved in vector–human transmission dynamics.10–13 The vectorial capacity captures key components of an insect’s role in pathogen transmission,10 whereas R0 quantitatively characterizes the average number of secondary cases that are generated by a primary infectious case via the vectors in an entirely susceptible population.11 R0 is also a key epidemiological determinant that establishes threshold criteria for control practices and provides an index for the intensity of control interventions necessary to contain an outbreak.11 It is recognized that temperature fluctuations have significant impacts on the time when mosquitoes become infectious and consequently affect vectorial capacity, R0, and disease burden.14–17
Fraser et al18 derived a control measure model from von Foerster equation-based criteria for the likely success of public control measures in containing outbreaks of infectious diseases. The R0 and the proportion of asymptomatic infectious (q) are two major determinants indicating whether the disease is under control. The Fraser’s control measure model has been applied to evaluate the control effectiveness for several infectious diseases such as severe acute respiratory syndrome (SARS), HIV, smallpox, and influenza,1,2,18 but not yet for dengue.
Recently, the parameter of disability-adjusted life years (DALYs) estimates the amount of time, ability, or activity of an individual lost because of disease-induced disability or death.19 These composite measures incorporate several estimates, including the incidence, prevalence, duration of a particular condition, as well as the outcome of a specific disease, either disability or premature death. Hence, a DALY represents 1 year lost of healthy life.19 Nowadays, several studies have used DALYs to estimate the disease burden of dengue in various regions, including Mexico,20 USA,21 Southeast Asia,22 and globally.23
It is estimated, on average, 115.3 (range 6.3–934.3) DALYs per million population annually were lost to dengue for the period 1998–2014 in Taiwan.24 In epidemic years, direct costs associated with dengue result mostly from hospitalization (86.09%), followed by emergency (7.77%), outpatient (6.10%), and drug costs (0.03%).24 For indirect costs, lost productivity due to death (70.76%) was the dominant contributor. Overall, the costs were 12.3 times higher in epidemic years than those in nonepidemic years (Wilcoxon rank sum test, P<0.05).24
Taken together, the relationship among temperature, vectorial capacity, R0, and disease burden in terms of DALYs lost is still poorly understood in Taiwan. A better understanding of the complex relationship is helpful for designing more effective public control programs. Therefore, this study aims 1) to explore the temperature–R0–DALYs relationship; 2) to examine the impacts of temperature on the risk of dengue health burden in terms of DALYs lost; and 3) to evaluate the effectiveness of various control interventions to design more effective control strategies for achieving the optimal containment of dengue epidemics. To achieve these goals, we developed an integrated framework with a combination of a dengue–mosquito–human transmission model, probabilistic risk assessment, and multi-efficacy control model.
Materials and methods
Surveillance data
Continual daily monitoring of temperatures were adopted from the Air Quality Monitoring Network, Environmental Protective Administration, Taiwan (Republic of China) (Taiwan Environmental Protection Administration).25 To appraise the effects of temperature variation on dengue disease burden, this study first extracted and analyzed daily minimum, maximum, and mean temperatures and further properly transformed them into monthly temperature time-series in the period 2001–2014. Here the monthly minimum (Tmin), maximum (Tmax), and mean (Tmean) temperatures are defined as the lowest, highest, and averaged daily temperatures of a specific month.
Kaohsiung, located in southern Taiwan with a typical tropical climate, the second largest metropolitan with dense populations, is a major dengue epidemic area with ~ >50% confirmed dengue cases each year. Officially notifiable data on the monthly dengue cases in Kaohsiung in the period 2001–2014 were obtained from the Centers for Disease Control, Taiwan (Republic of China) (Taiwan Centers for Disease Control [CDC]).26 The period was chosen because of data availability as well as encompassing two notable epidemics in 2002 and 2014 with, respectively, 4,813 of 5,388 (89%) and 15,058 of 15,754 (96%) dengue cases in Kaohsiung. Confirmed dengue cases were further implemented to derive DALYs to quantify the impacts of dengue on disease burden in Kaohsiung.
Temperature–R0–DALYs relationship
The previously developed dengue–mosquito–human transmission model16,27 was adopted to describe the dynamics of vector–host interactions and to estimate the disease epidemics. The essential features of the mosquito–human transmission model are depicted in Figure 1. There are four compartments constituting mosquito population dynamics including 1) pre-adult mosquitoes composed of eggs, larvae, and pupae and 2) adult mosquitoes that can be divided into susceptible (Sm), exposed but not yet infectious (Em), and infectious dengue virus-carrying mosquitoes (Im) based on infectious status (Figure 1A). On the other hand, the susceptible-exposed infectious recovery compartmentalized disease transmission model was implemented to simulate the dengue virus transmission within human populations (Figure 1B).
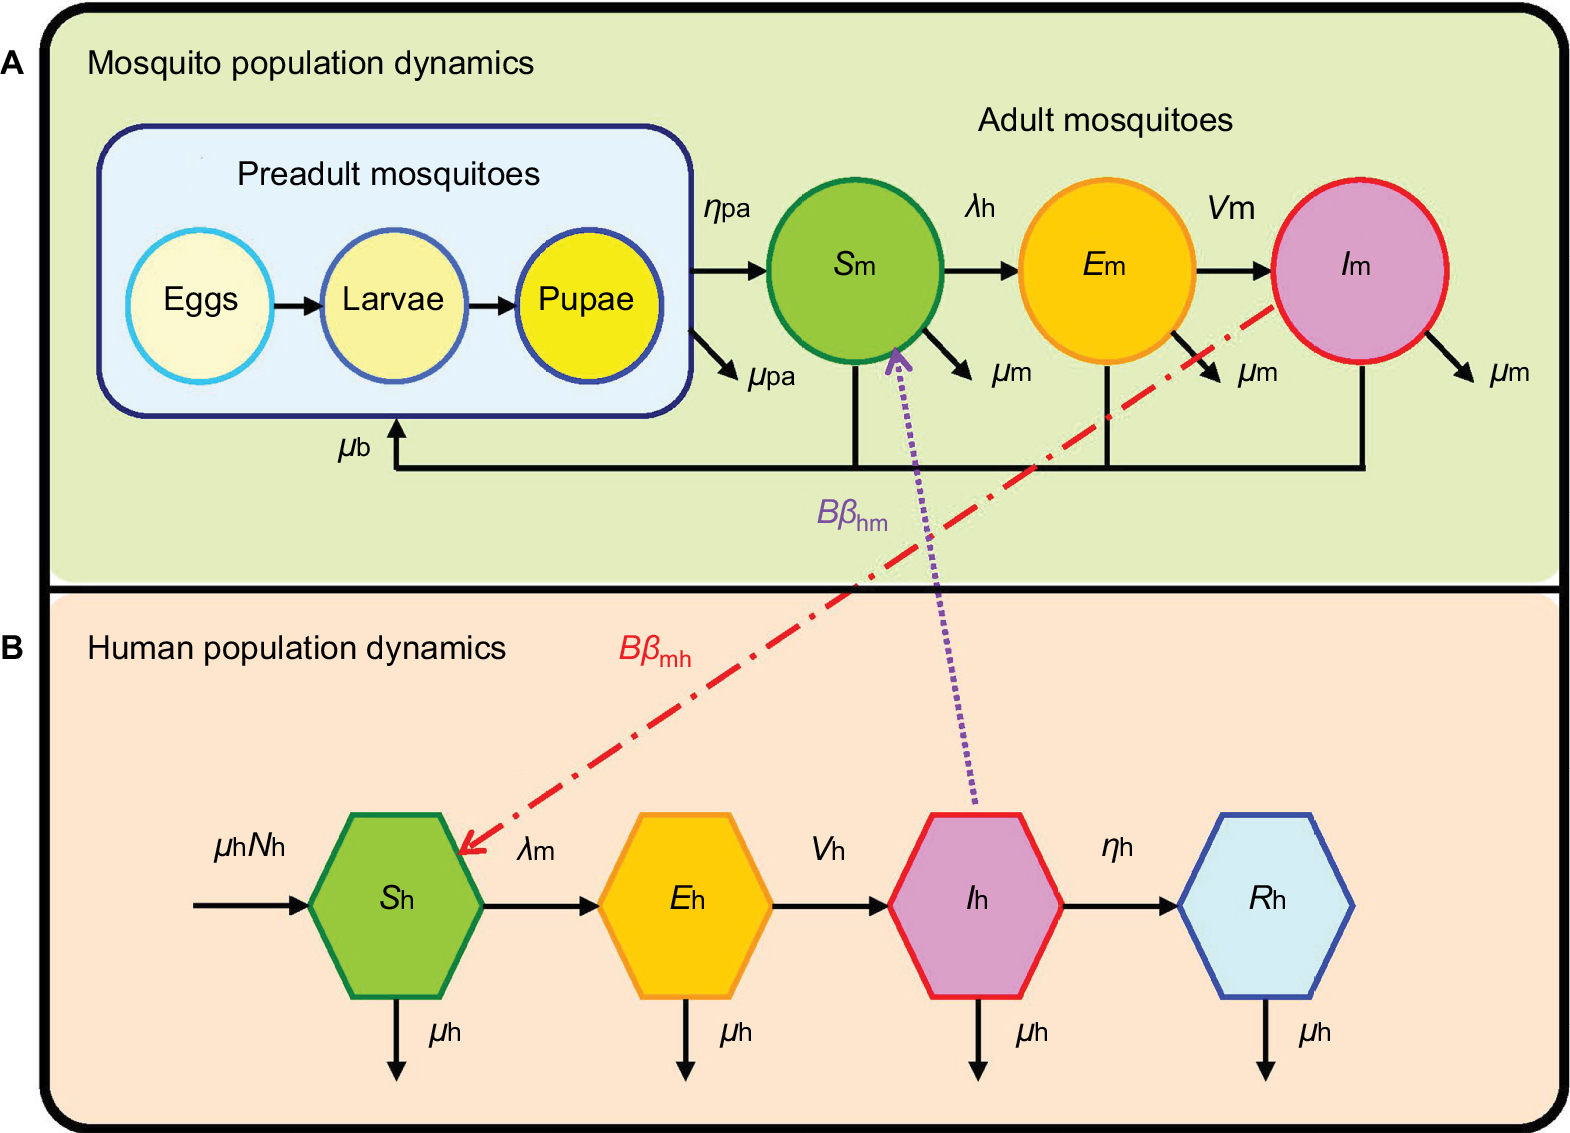 | Figure 1 Schematic demonstrating the interactive transmission dynamics of (A) mosquito and (B) human population dynamics. |
To account for the impact of temperature on the epidemics of vector–host interactive dynamics, we selected three temperature-dependent parameters including larvae survival proportion (SL), extrinsic incubation rate (𝒱m), and female mosquito death rate (μm) for mosquito populations based on the previously published studies to construct temperature-basic reproduction number (R0) profile.5,15,28,29 A previous study16 has been validated with observed dengue incidence rates during 2004–2009 in southern Taiwan, this study directly applied the validated compartmentalized mosquito–human transmission dynamic model to estimate the temperature-varied R0 by incorporating optimally fitted temperature-dependent and derived constant parameter estimates as16,27
|
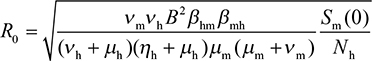
where βmh and βhm represent transmission probabilities from mosquito to human and from human to mosquito per mosquito bite, 𝒱m and 𝒱h stand for extrinsic and intrinsic incubation rates, ie, the reciprocals of mean periods in dengue viral shedding for mosquito and human, respectively, B is daily mosquito biting rate, μm and μh are death rates for female mosquitoes in adult stage and human, Sm(0) represents susceptible female mosquitoes that can be estimated by the product of female mosquitoes surrounding a human (m), SL, as well as total people in Kaohsiung (Nh), and ηh is the dengue fever recovery rate for human.
Note that R0 represents transmission potency of dengue virus in the vector–host dynamic model constituted with transmissibility of dengue from mosquito to human (Rmh) and from human to mosquito (Rhm) populations (ie, R02=Rmh×Rhm).16,27 R0>1 indicates that dengue fever is epidemically spreading within the human populations with increasing incidences, whereas R0<1 means the disease is dying out. An average R0 of 1 implies that the disease is in endemic equilibrium.
In addition, to investigate the contribution of each parameter to the variance of temperature-dependent R0, uncertainty and sensitivity analyses were conducted using Monte Carlo (MC) simulation by a commercial software Crystal Ball (Version 2000.2, Decisionerring, Inc., Denver, CO, USA). Specifically, each parameter was defined with an optimally fitted distribution (ie, lognormal distribution) by assigning with either its mean and SD or mean and 95% CI values (ie, define assumption). Temperature-dependent R0 was then assigned as the integrated forecast of each defined parameter distribution that can be estimated using Eq. (1). A total of 10,000 iterations were performed in the MC simulation through Crystal Ball to ensure the stability of probability distributions. A built-in function, sensitivity analysis, in Crystal Ball was then adopted to examine the contribution of each parameter to the variance of temperature-dependent R0.
This study estimated DALYs lost by each confirmed dengue case in Kaohsiung in the period 2001–2014 by using Murray’s equation as19
|
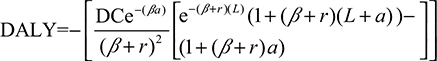
where D is the disability weight (D=1 for premature death, 0 for perfect health), C and β are parameters from an age-weighted function, and a is the age at onset of the disease, L is the duration of the disability or years of life lost due to premature death, and r is the social discount rate used for discounting years of health life in the future. The incorporation of a discount rate in the calculation of DALYs reflects a similar practice in economic analysis and gives policymakers incentives to invest society’s resources in currently available health interventions for immediate benefit, though they may be less effective than from saving resources for possible future eradication programs.19
Disabilities are then classified into six categories or grades, with each grade allocated a scalar value weighting between 0 and 1. The lower the value, the less impact the disability has on a person’s life.19 Dengue cases were classified into different age groups at 0, 1, 2, 3, 4, 5–9, 10–14, 15–19, 20–24, 25–29, 30–34, 35–39, 40–44, 45–49, 50–54, 55–59, 60–64, 65–69 and >70 years, based on data collected from Taiwan CDC (2015).26
To capture the relationship among temperature, R0, and model-derived temperature-associated DALYs were estimated. Specifically, monthly DALYs during 2001–2014 were estimated using Eq. (2), but only mean temperatures ranging from 17°C to 31°C paired with nonzero DALY estimates were selected to establish the temperature-basis DALY relationships using the curve fitting software TableCurve 2D (Version 5.01, AISN Software Inc., Mapleton, OR, USA). Likewise, temperature–R0 relationships were constructed under the same temperature range of 17°C–31°C using TableCurve 2D. A three-dimensional model was then constructed to describe the temperature–R0–DALYs relationship. TableCurve 3D packages (Version 4.0, AISN Software Inc., Mapleton, OR, USA) was used to perform the model-fitting techniques. The optimal model was selected based on the least squares criterion from a set of linear and nonlinear models provided by TableCurve 3D packages.
Health burden risk assessment
To better assess dengue disease burden risk based on epidemics in the period 2001–2014, seasons including summer (June–August), fall (September–November), and winter (December–February) were selected since there were none or only sporadic dengue cases occurring in spring (March–May). DALYs was selected to represent the health burden caused by dengue epidemics and outbreaks in the risk assessment. We applied a probabilistic risk assessment to quantify the impact of temperature on the risk of DALYs during different seasons.
Combined with season-specific temperature and R0, the DALYs estimates could be further obtained by the temperature–R0–DALYs relationship. We then conducted a MC simulation to capture the probabilistic distribution of DALYs. A total of 10,000 iterations were performed in the MC simulation through Crystal Ball to ensure the stability of probability distributions, and resulted in the cumulative distribution function of DALYs as Ф(DALYs). Hence, the exceedance risk (ER) profiles could be obtained by 1– Ф(DALYs), standing for the probability that an estimated DALY would exceed a specified magnitude.
Control measures modeling
To effectively contain dengue disease burden, this study implemented a multi-efficacy control curve2,18 conceived with critical elements including R0, the asymptomatic infectious proportion (θ), as well as efficacy for each control measure (εi). The multi-efficacy R0–θ control curve can be expressed in a mathematical equation as2
|
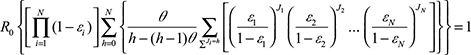
where εi represents control efficacy of different control strategies, and h and J are integers. Based on the algorithm in estimating θ,1,2,18 we then defined and estimated θ for dengue as
|
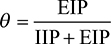
where EIP and IIP represent extrinsic and intrinsic incubation periods in mosquitoes and humans, respectively, in that the total infectious period of dengue existing in both mosquito and human populations (ie, mean duration of dengue viral shedding) can be expressed as the summation of IIP and EIP.
On the other hand, to achieve the optimal containment of dengue spread, this study took into account numerous combinations of control measures including life-shortening Wolbachia infection (εW),30 water container clean-up (εC),31 pesticide spray (εS),31 and repellent use (εR).32,33 An area under R0–θ control curve represents a controllable ratio (ie, dengue is under contained) whereas the above-curve area indicates an uncontrollable ratio of dengue disease relative to the total R0–θ rectangular area of dengue.
Results
Time series of temperature and dengue burden
Table 1 lists parameter values essential in estimating monthly total DALYs. We assigned D as 0.197 and 0.542 and L as 4.015 and 14.016 for dengue fever and dengue hemorrhagic fever/dengue shock syndrome cases, respectively. The DALYs for each age-specific category and degree of severity were multiplied by the number of cases in each year and then summed to give annual totals.
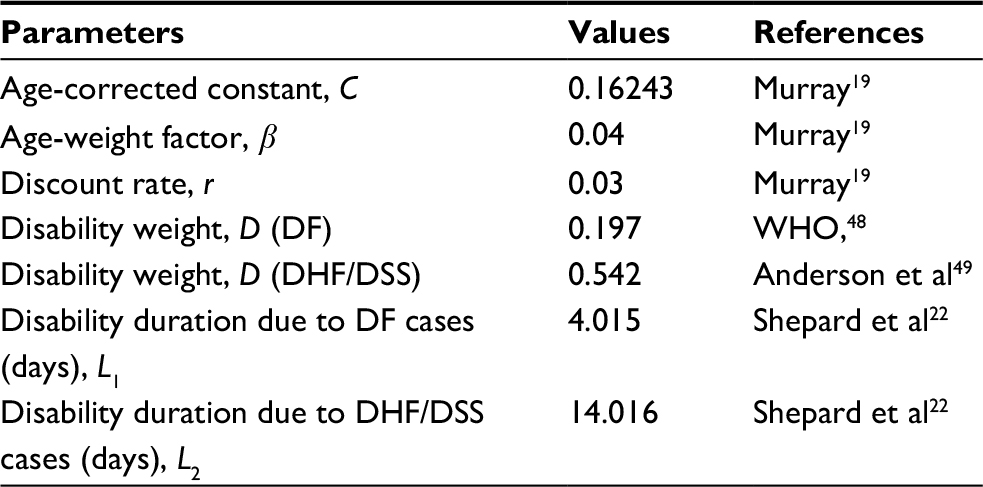 | Table 1 Input parameters of DALYs estimations Abbreviations: DF, dengue fever; DHF, dengue hemorrhagic fever; DSS, dengue shock syndrome. |
Figure 2 shows the time series of the monthly temperature and monthly burden of dengue in the period 2001–2014. The highest monthly temperature was 38.01°C in September 2008, whereas the lowest temperature was 7.24°C in March 2009. In the period 2001–2014, the average monthly temperatures were 16.82°C–30.80°C. The estimated monthly burden of dengue was less than 1,325 DALYs in the period 2001–2014, however, the estimated burden was particularly higher with 4,858 DALYs in November 2014, due to the emerging epidemics of confirmed dengue cases in Kaohsiung. After the highest Tmax, the maximum value of the estimated total DALYs may occur (Figure 2).
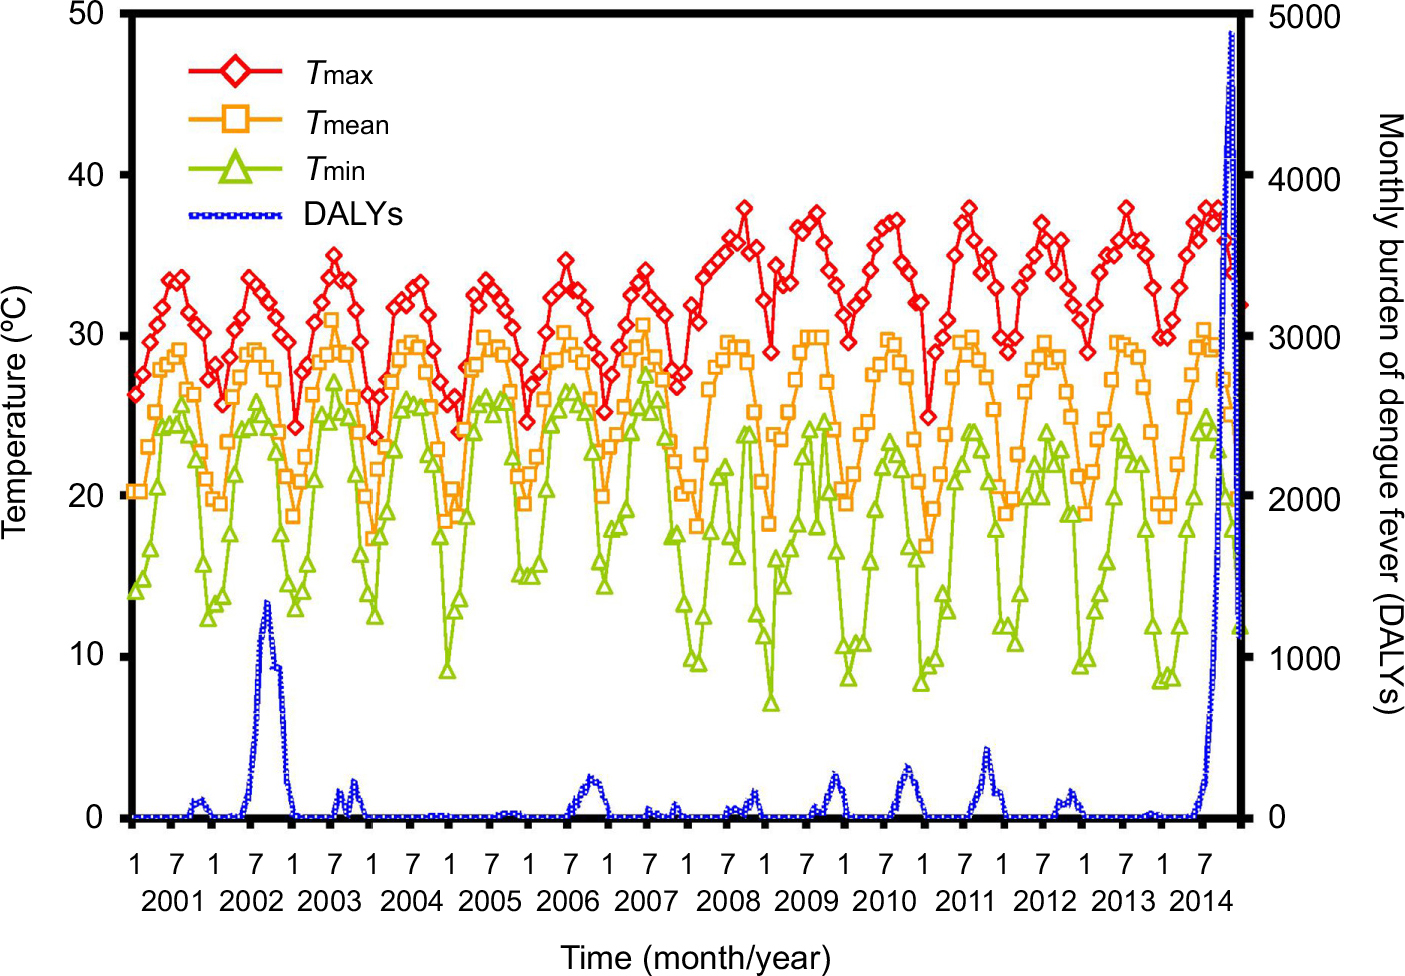 | Figure 2 Monthly time-series estimates in temperature and total DALYs in 2001–2014, where the symbols diamond, square, and triangle represent monthly maximum, mean, and minimum temperatures, respectively. Abbreviations: DALYs, disability-adjusted life years; Tmax, maximum temperature; Tmean, mean temperature; Tmin, minimum temperature. |
Temperature-dependent R0 and DALYs estimates
Figures 3A and B reveal that simple nonlinear equations could appropriately describe the temperature-dependent extrinsic incubation rate (𝒱m) (r2=0.75, P<0.001) and female mosquito death rate (μm) (r2=0.86, P<0.001). We also showed that the logistic equation was capable of well describing the relationship between temperature and larvae survival percentage (SL) (r2=0.83, P<0.001, Figure 3C). The fitted equations with parameters (Eqs. (T1)–(T3)) are listed in Table 2. Results showed that in the interval of 10°C–35°C, the extrinsic incubation rate increased with temperature (Figure 3A). By contrast, an opposite result was found in the female mosquito death rate, which decreased with elevated temperature between 10°C and 20°C and subsequently increased slightly after 20°C (Figure 3B). Moreover, Figure 3C reveals that the peak value of larvae survival was found to be 89.4% at 24°C with an increasing phase in the interval of 0°C–24°C with a falling phase after the peak.
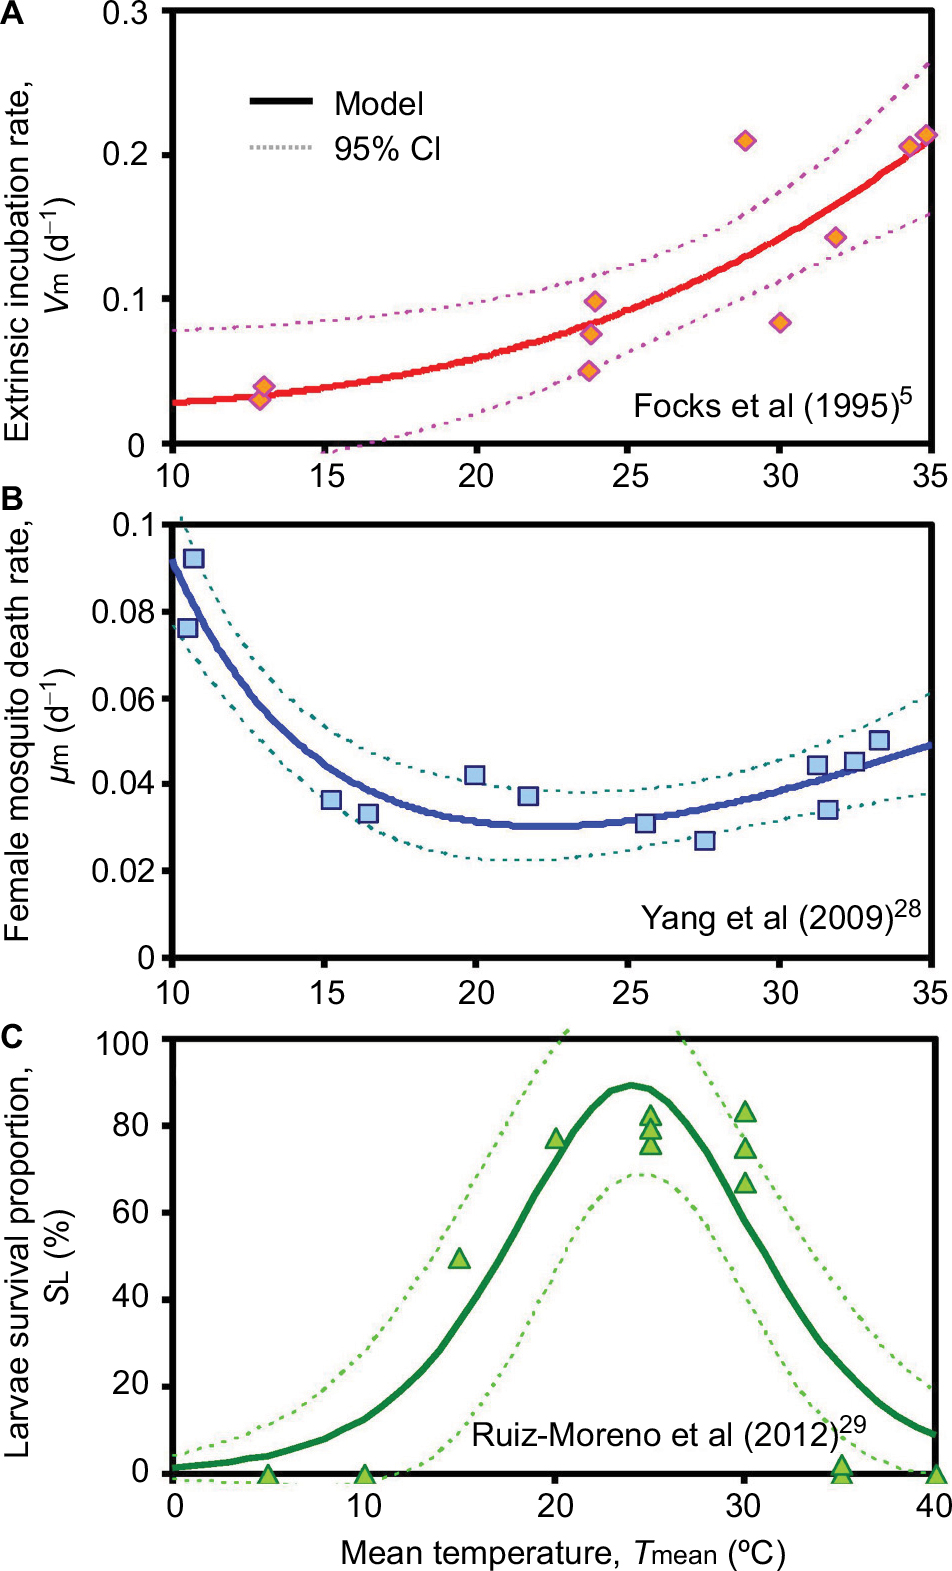 | Figure 3 Relationships showing temperature dependency for (A) extrinsic incubation rate, (B) female mosquito death rate, and (C) larvae survival percentage used in vector-host interactive transmission model. Abbreviations: νm, extrinsic incubation rate; μm, female mosquito death rate; SL, larvae survival percentage. |
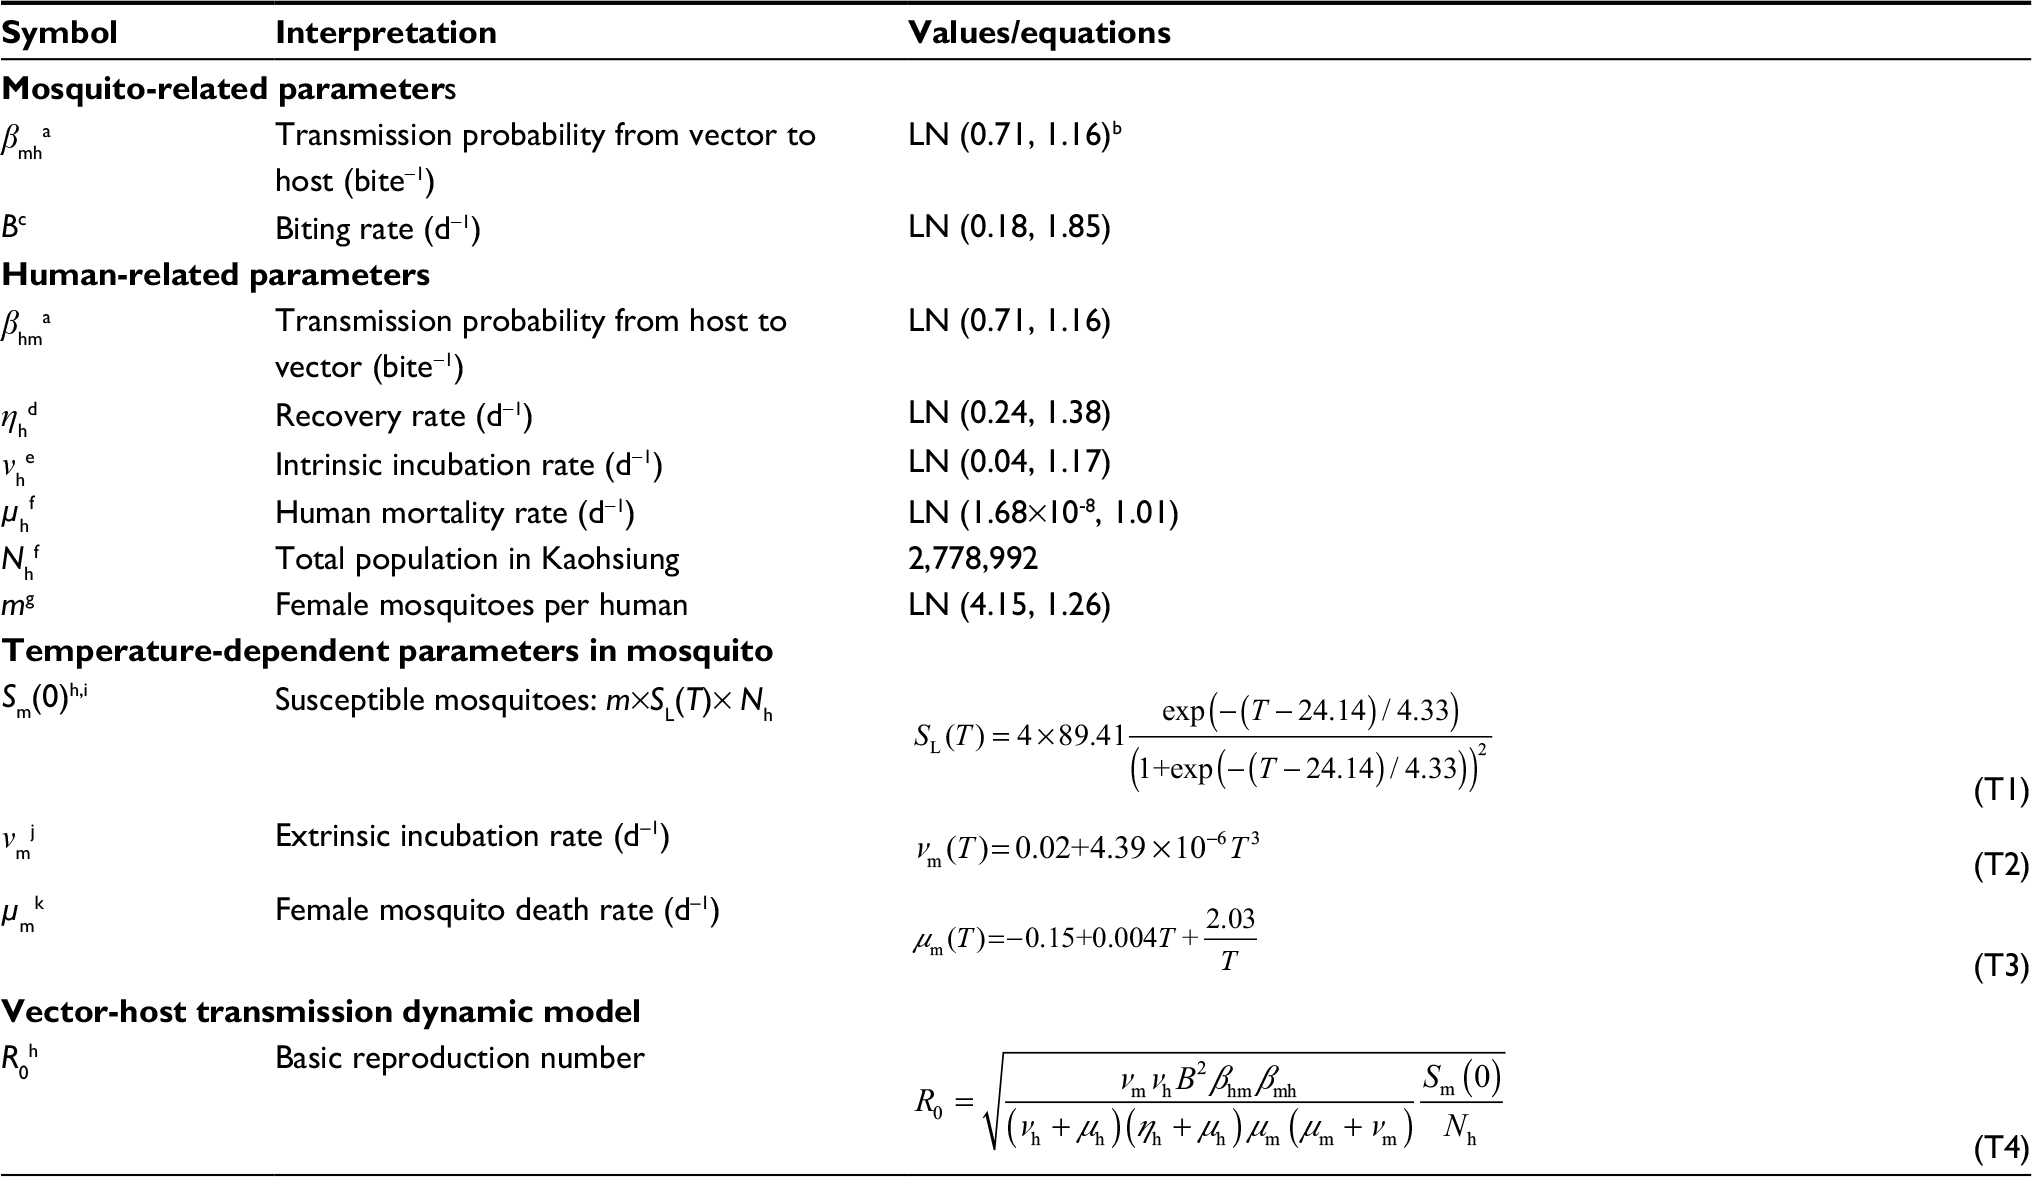 | Table 2 Parameters and equations used to estimate temperature-dependent basic reproduction number (R0) Notes: aEstimated from Newton and Reiter.50 bLognormal distribution with geometric mean and geometric SD. cEstimated based on Focks et al.51 dEstimated from Harn.52 eEstimated from Hsieh and Ma.53 fAdopted from Department of Household Registration, Ministry of the Interior, Taiwan, Republic of China (https://www.moi.gov.tw/stat/node.aspx?cate_sn=&belong_sn=6463&sn=6465). gEstimated from Padmanabha et al.54 hAdopted from Dumont et al.27 iSL(T) was estimated from Ruiz-Moreno et al.29 jEstimated based on Focks.5 kEstimated based on Yang et al.28 Abbreviations: LN, lognormal; gm, geometric mean; gsd, geometric SD. |
Figure 4 demonstrates the uncertainty and sensitivity analysis result for contribution of simultaneous variation in each parameter to the variance of temperature-derived R0. Biting rate (B) alone contributes positively to the overall highest R0 variance with a fraction of 0.88 followed by female mosquitoes surrounding a human (m) of –0.06, human recovery rate (ηh) of 0.03, and similar fractional contribution of per bite transmission probability from human to mosquito and from mosquito to human (βhm and βmh) of 0.01. Whereas the fractional contribution to the overall R0 variance of the rest parameters add up to ~0.01. It is noticeable that this study has considered the temperature-varied disease epidemics (measured by R0), the temperature-dependent parameters (ie, μm, 𝒱m, and SL) merely contribute to <0.01 variance of R0. However, the temperature-dependent parameters facilitate constructing and characterizing the temperature–R0 relationships of different seasons.
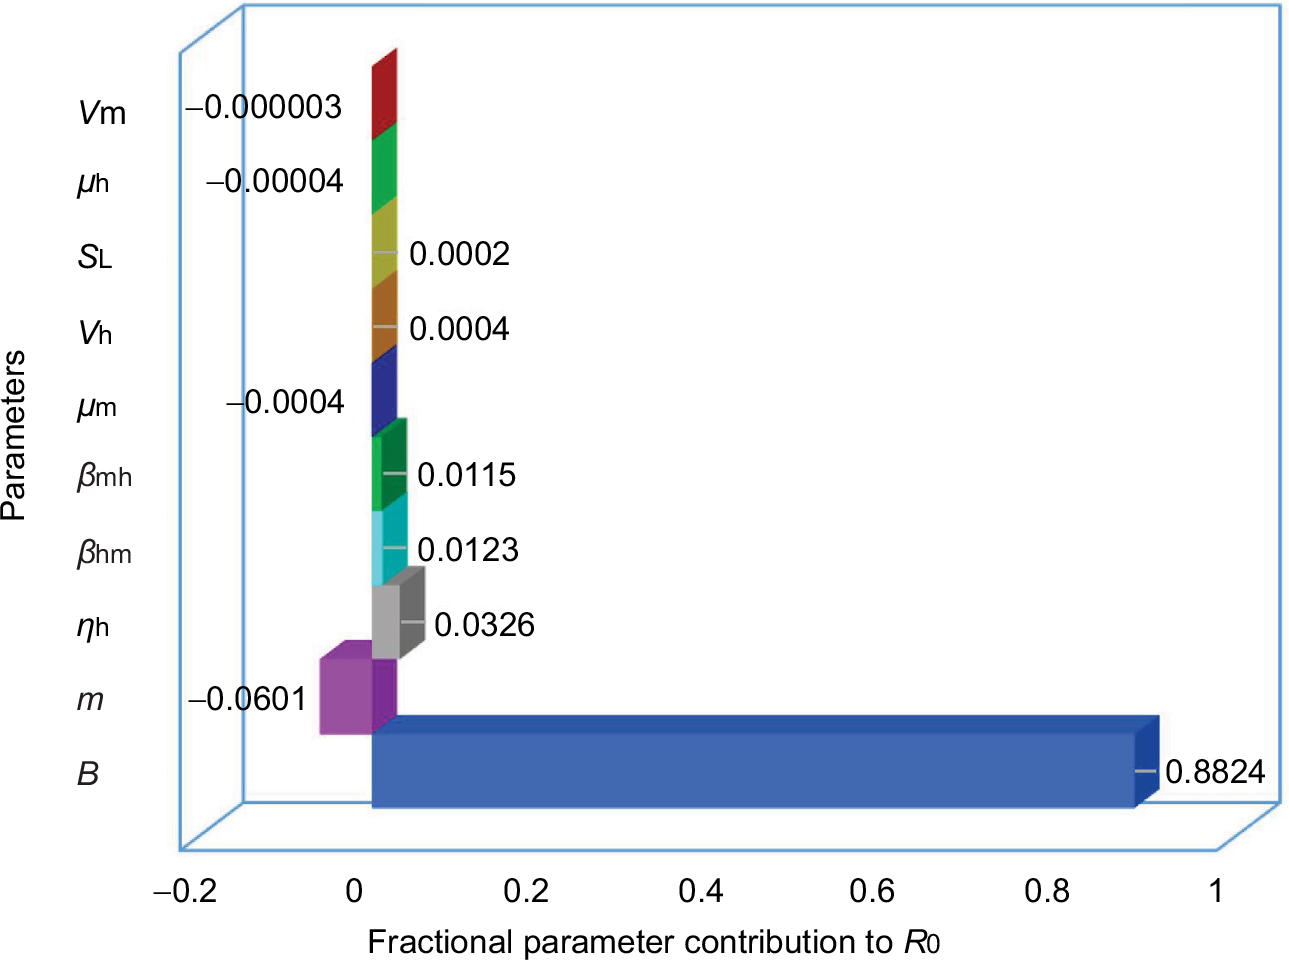 | Figure 4 Uncertainty and sensitivity analysis of fractional parameter contribution to variance of temperature-dependent R0. Abbreviations: B, biting rate; βhm, transmission probability from host; βmh, transmission probability from vector; 𝒱h, intrinsic incubation rate; 𝒱m, extrinsic incubation rate; μh, human mortality rate; μm, female mosquito death rate; ηh, human recovery rate; SL, larvae survival percentage; m, the number of female mosquitoes surrounding a human. |
Figure 5 presents the best-fitted results of temperature–R0–DALYs relationship by using three-dimensional models. The optimally fitted models and associated parameter values were listed in Table 3. Results highlighted that the R0 and DALYs increased with temperature but turned to decline at a specific temperature. For instance, the highest estimates of R0 (2.37) and DALYs (2532.02) were found in the fall at 25°C and then decreased dramatically (Figure 5B). Compared to fall and winter, summer had the lowest DALYs with the estimated range from 0.78 at 17°C to 248.27 at 29°C (Figure 5A). In winter, a peak DALY of 270.44 was observed at 20°C, and meanwhile, the R0 estimate was 2.08 (Figure 5C). We also summarized data to obtain the overall temperature–R0–DALYs relationship by pooling temperature data, DALYs, and R0s from seasons including summer, fall, and winter (Figure 5D). We found that R0 and DALYs peaked at 25°C with estimates of 2.37 and 1386.56, respectively (Figure 5D).
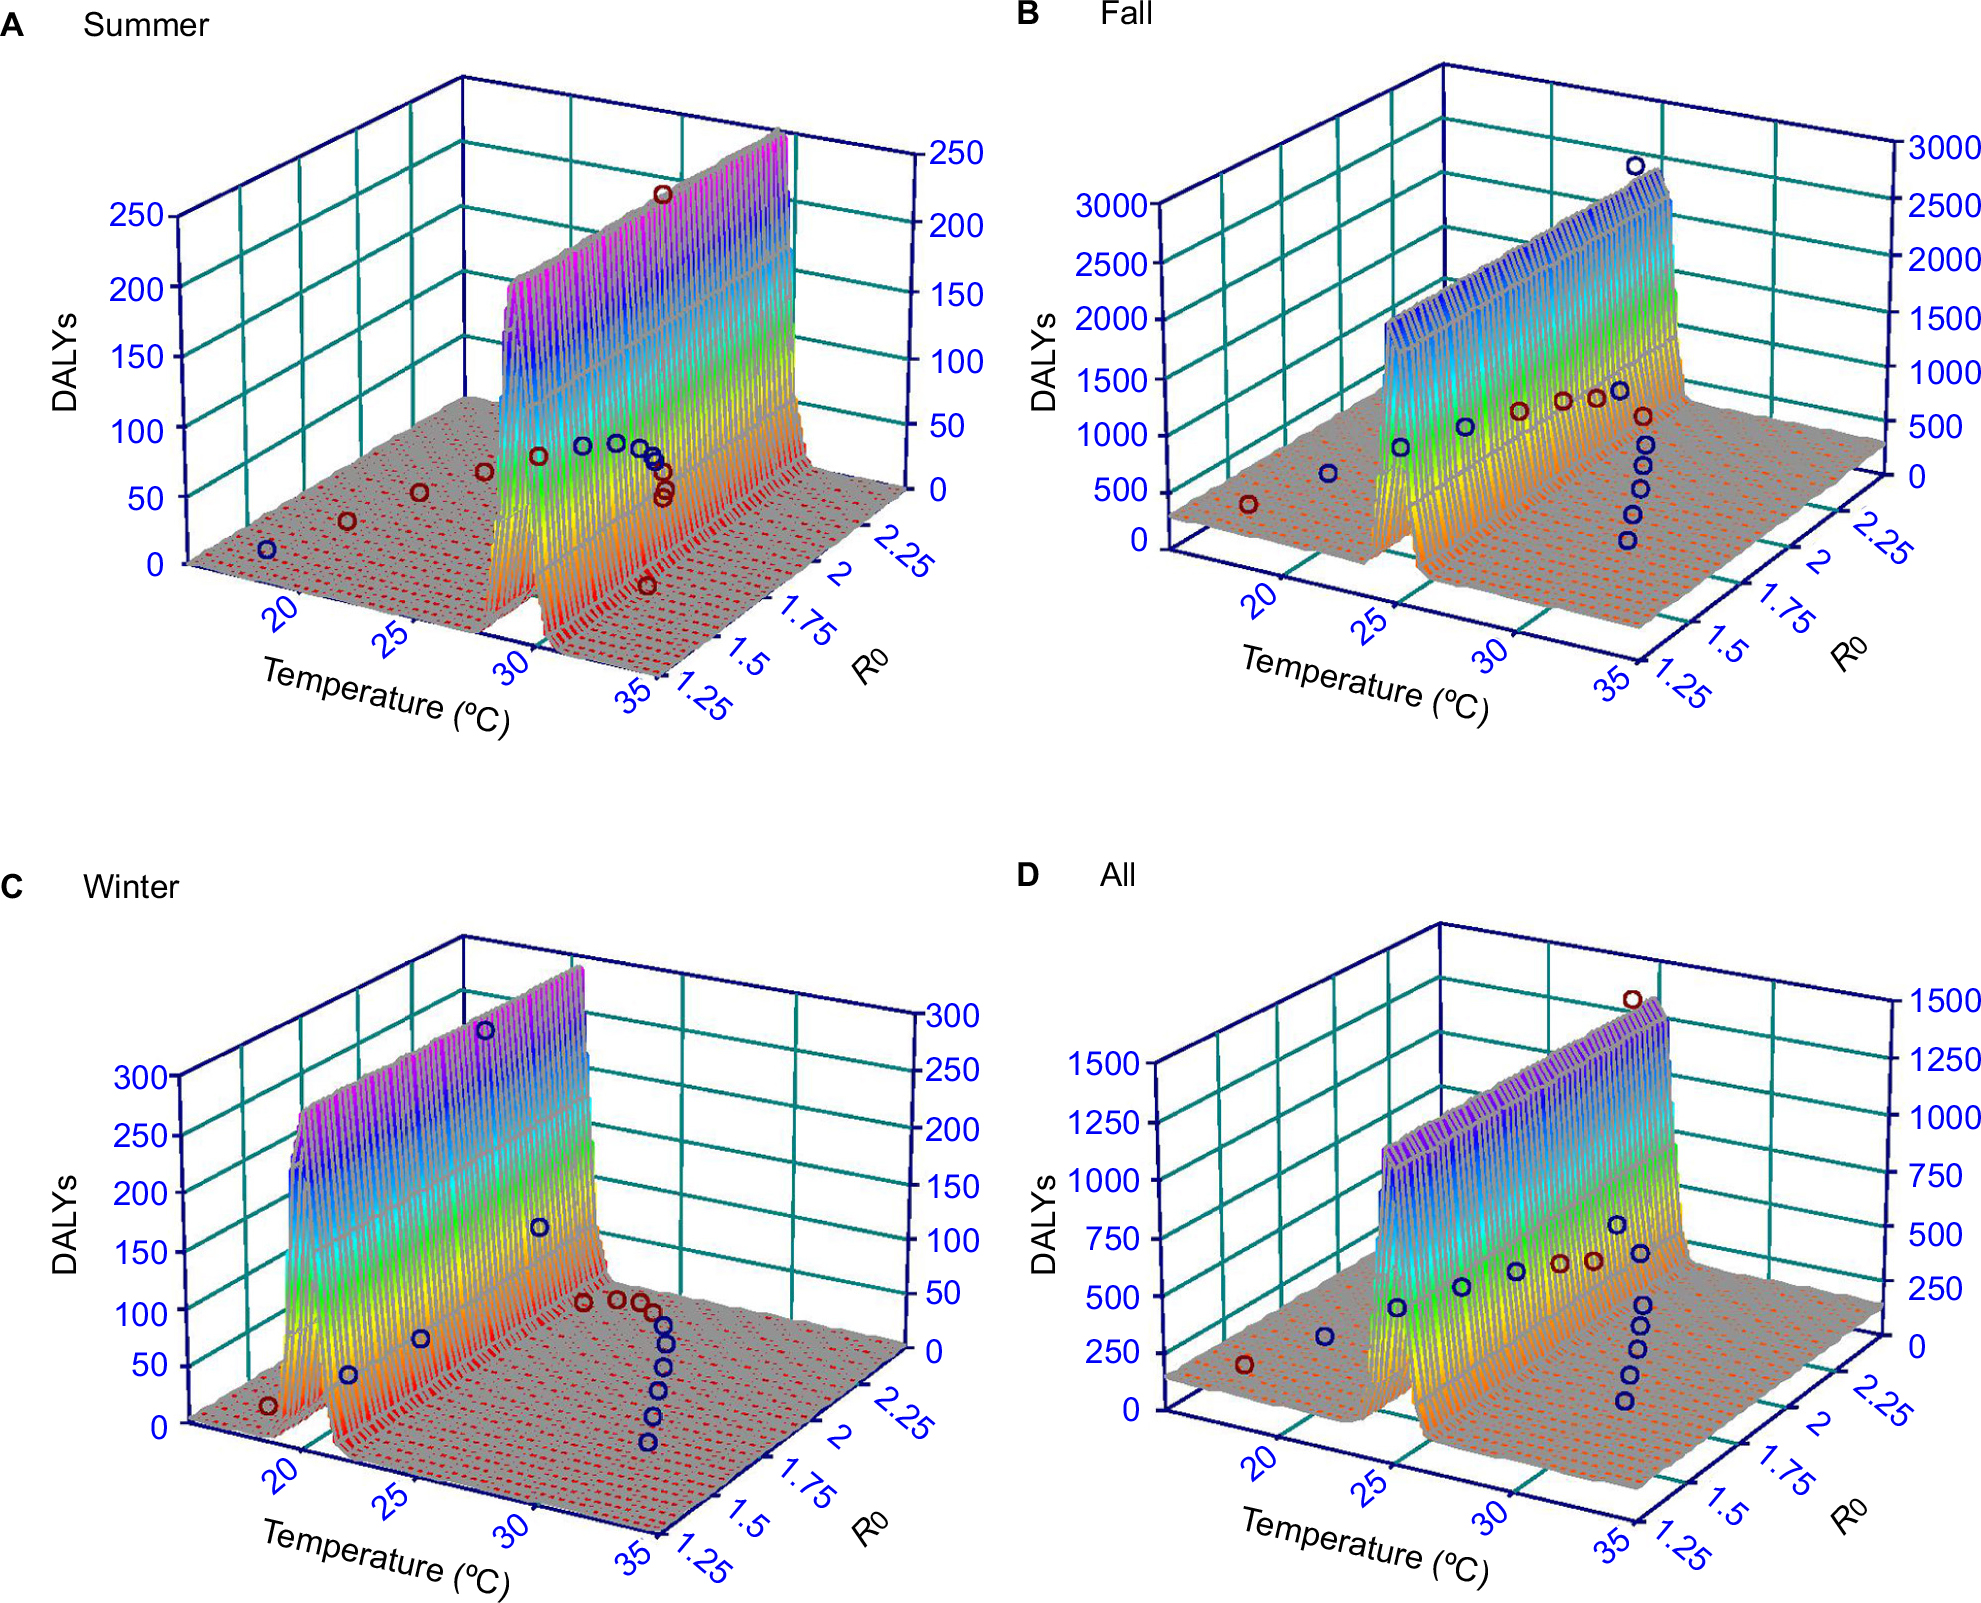 | Figure 5 Three-dimensional interactive diagrams demonstrating relationships among monthly average temperature, R0, and DALYs in seasons (A) summer, (B) fall, (C) winter, and (D) all seasons, respectively. Abbreviations: R0, basic reproduction number; DALYs, disability-adjusted life years. |
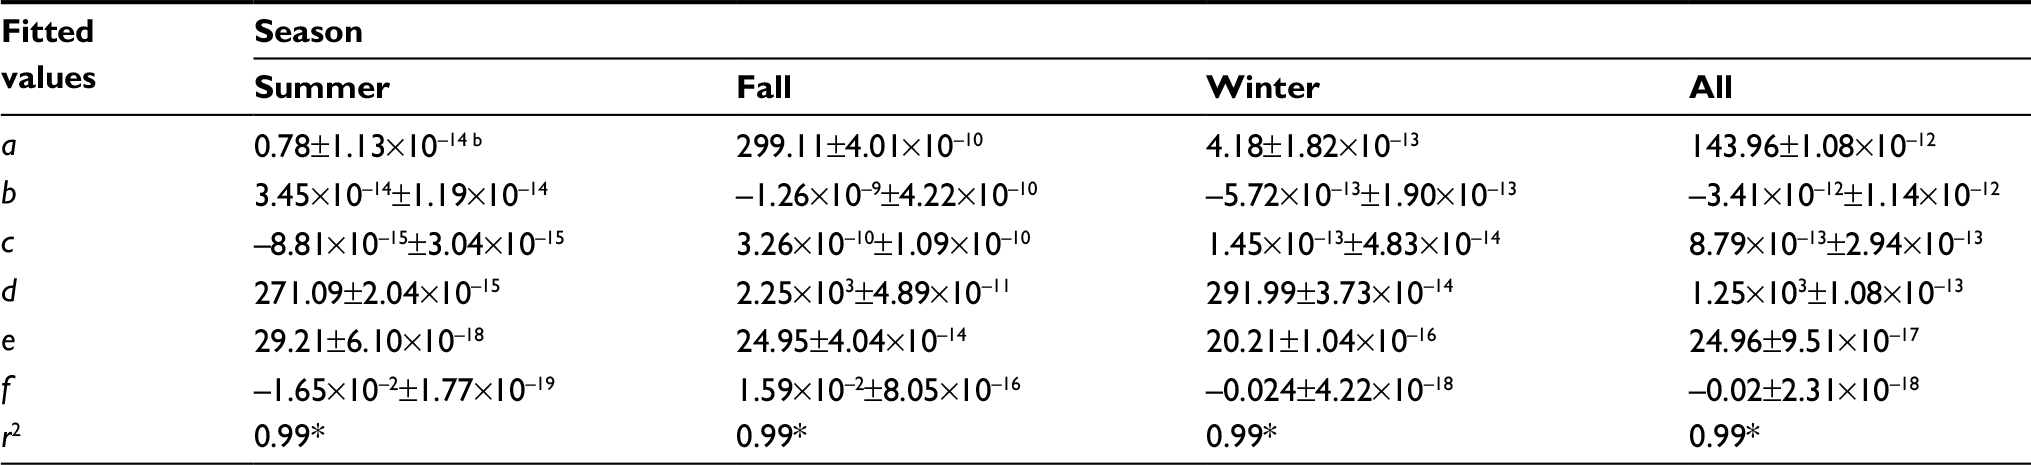 | Table 3 Optimal fitted three-dimensional models describing temperature–R0–DALYs relationshipa Notes: aOptimal three-dimensional model: DALY(T,R0) = a + bR0 + cR02 + d exp(–0.5×ln(T/e)/f)2, where DALY(T, R0) is the dengue caused DALYs varied with temperature (T) and R0, b and c are fitted parameters demonstrating the quadratic relationships between temperature and R0, a, d, e, and f represent the fitted parameters to describe the lognormal relationships between temperature and DALY that demonstrate the baseline DALY, peak DALY, location of peak DALY, and the geometric SD of DALY, respectively. bMean±SE. *P<0.001. Abbreviations: DALYs, disability-adjusted life years; SE, standard error; R0, basic reproduction number. |
Dengue burden risk estimates
To capture temperature and R0 variability featured dengue burden risk (DALYs), we began with estimating the season-varied temperature and R0. Figure 6A shows temperature distributions for seasons summer (TS), fall (TF), and winter (TW) as well as the whole temperatures (TAll) in the period 2001–2014. Among all temperature distributions, TS has the lowest variation in temperature estimates of 29.16°C (95% CI: 28.05–30.32) followed by TW, TF, and TAll, respectively, with estimates of 20.04°C (17.28–23.26), 26.07°C (21.97–30.87), and 24.98°C (18.37–34.14). Accordingly, variations of R0 estimates follow the same trend that R0,F > R0,All > R0,W > R0,S with medians and range values of 2.28 (95% CI: 1.67–2.47), 2.26 (1.21–2.47), 2.09 (1.46–2.43), and 1.92 (1.73–2.10), respectively (Figure 6B).
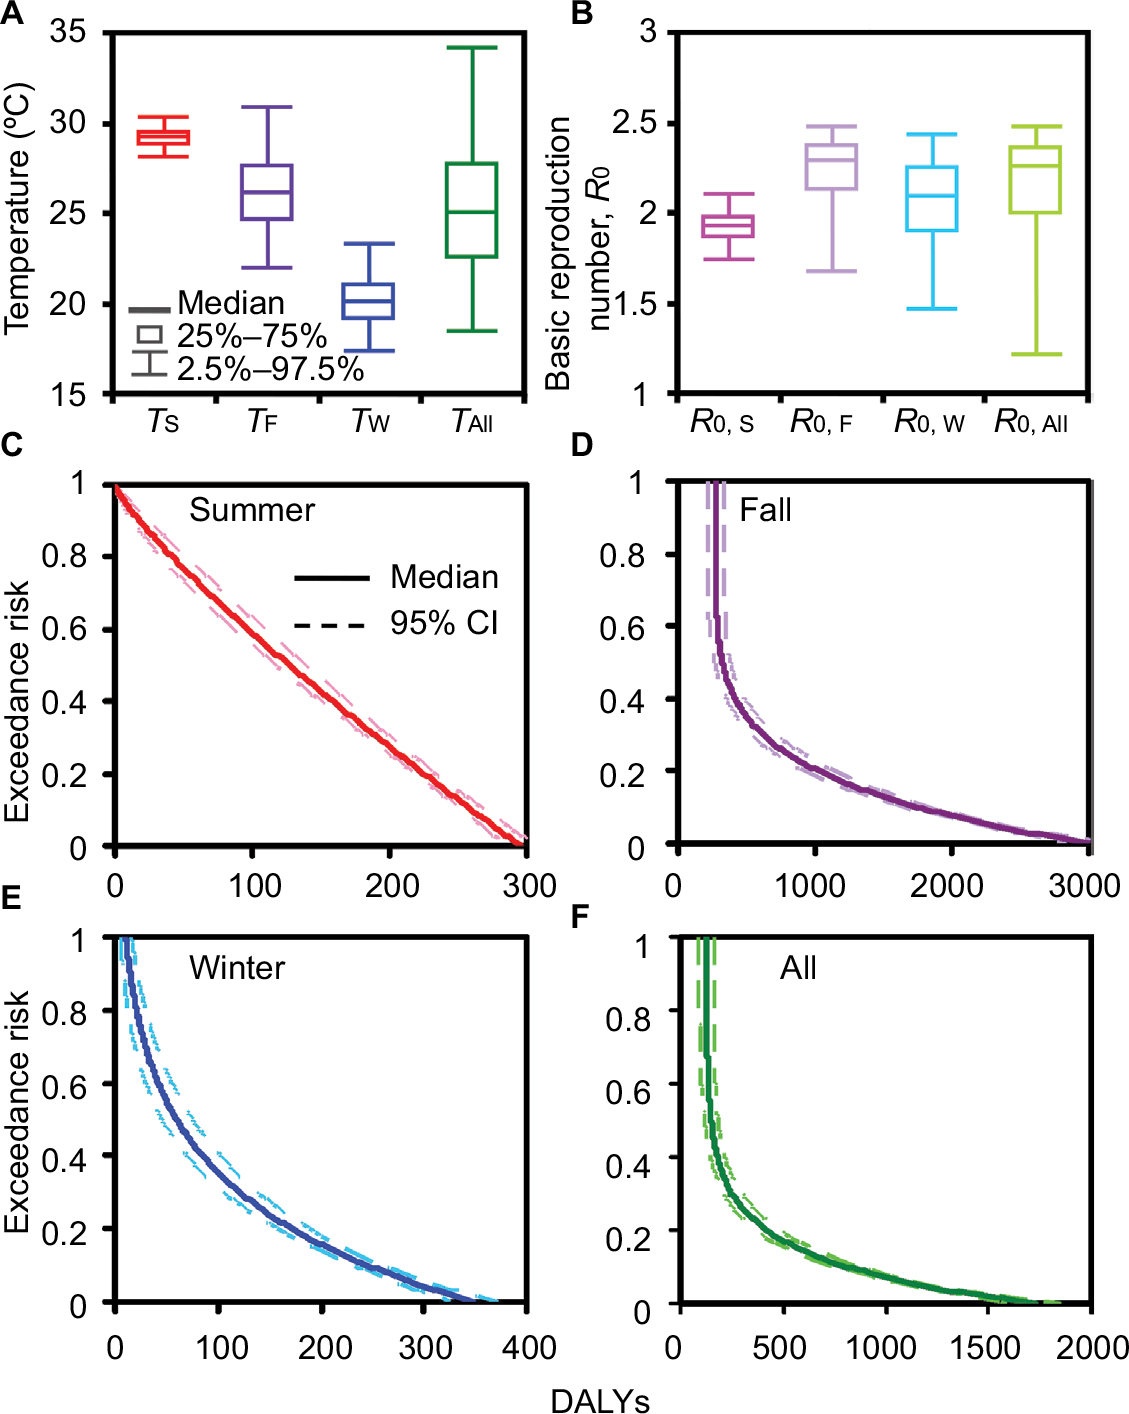 | Figure 6 Box-and-Whisker plots showing estimated median and range values for (A) season-varied temperature and (B) R0. Exceedance risk profiles indicating season-based DALYs occurring with different risk probabilities in (C) summer, (D) fall, (E) winter, and (F) all seasons. Abbreviations: R0, basic reproduction number; DALY, disability-adjusted life years. |
Figure 6C–F displays ER profiles conceived with DALYs-based dengue health burden given temperature and R0 variability. Generally, most dengue cases occurred in the fall with a risk probability of 50% (ER=0.5) and had DALYs estimates of 323 (95% CI: 267–379) (Figure 6D and Table 4), whereas the least dengue cases were likely to occur in winter with DALYs estimates of 60 (45–75) (Figure 6E and Table 4). Taking all seasons into consideration, DALYs estimates were more likely (ER=0.8), likely (ER= 0.5), and less likely (ER =0.2) to be 127 (95% CI: 91–163), 148 (115–181), and 419 (358–479), respectively (Figure 6F and Table 4).
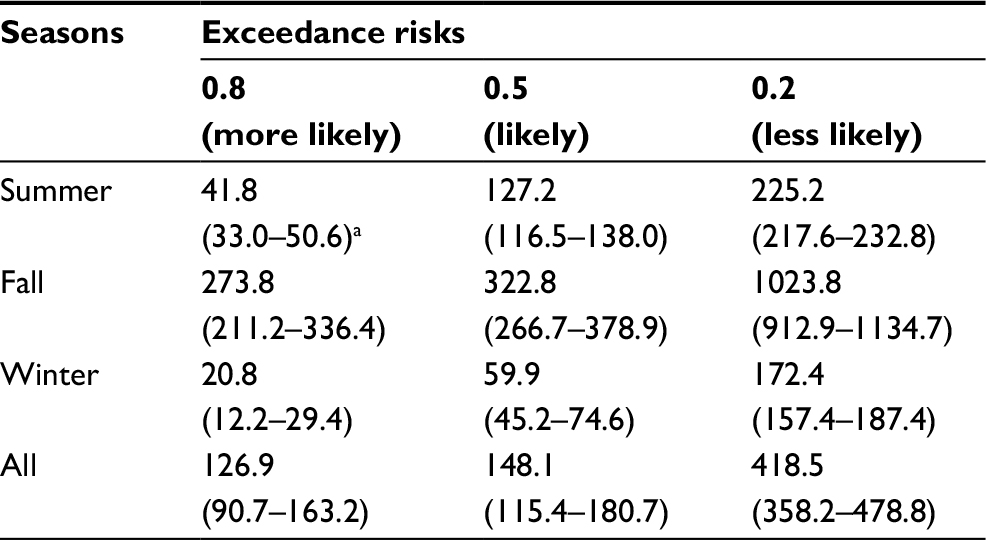 | Table 4 Temperature and basic reproduction number (R0) variations-based DALYs with exceedance risks at 0.8, 0.5, and 0.2 Notes: aMedian (95% CI). Abbreviation: DALYs, disability-adjusted life years. |
Dengue control effectiveness
Figure 7A–D displays season-varied R0–θ rectangles constituted of 95% CIs of R0 and θ (0.15–0.64), respectively, as well as control curves considering multiple control measure combinations. To effectively control dengue outbreak, this study only considered the highest control efficacy of individual and combined control measures in which efficacies were 0.4 (εW), 0.42 (εC), 0.51 (εS), and 0.98 (εR), respectively.
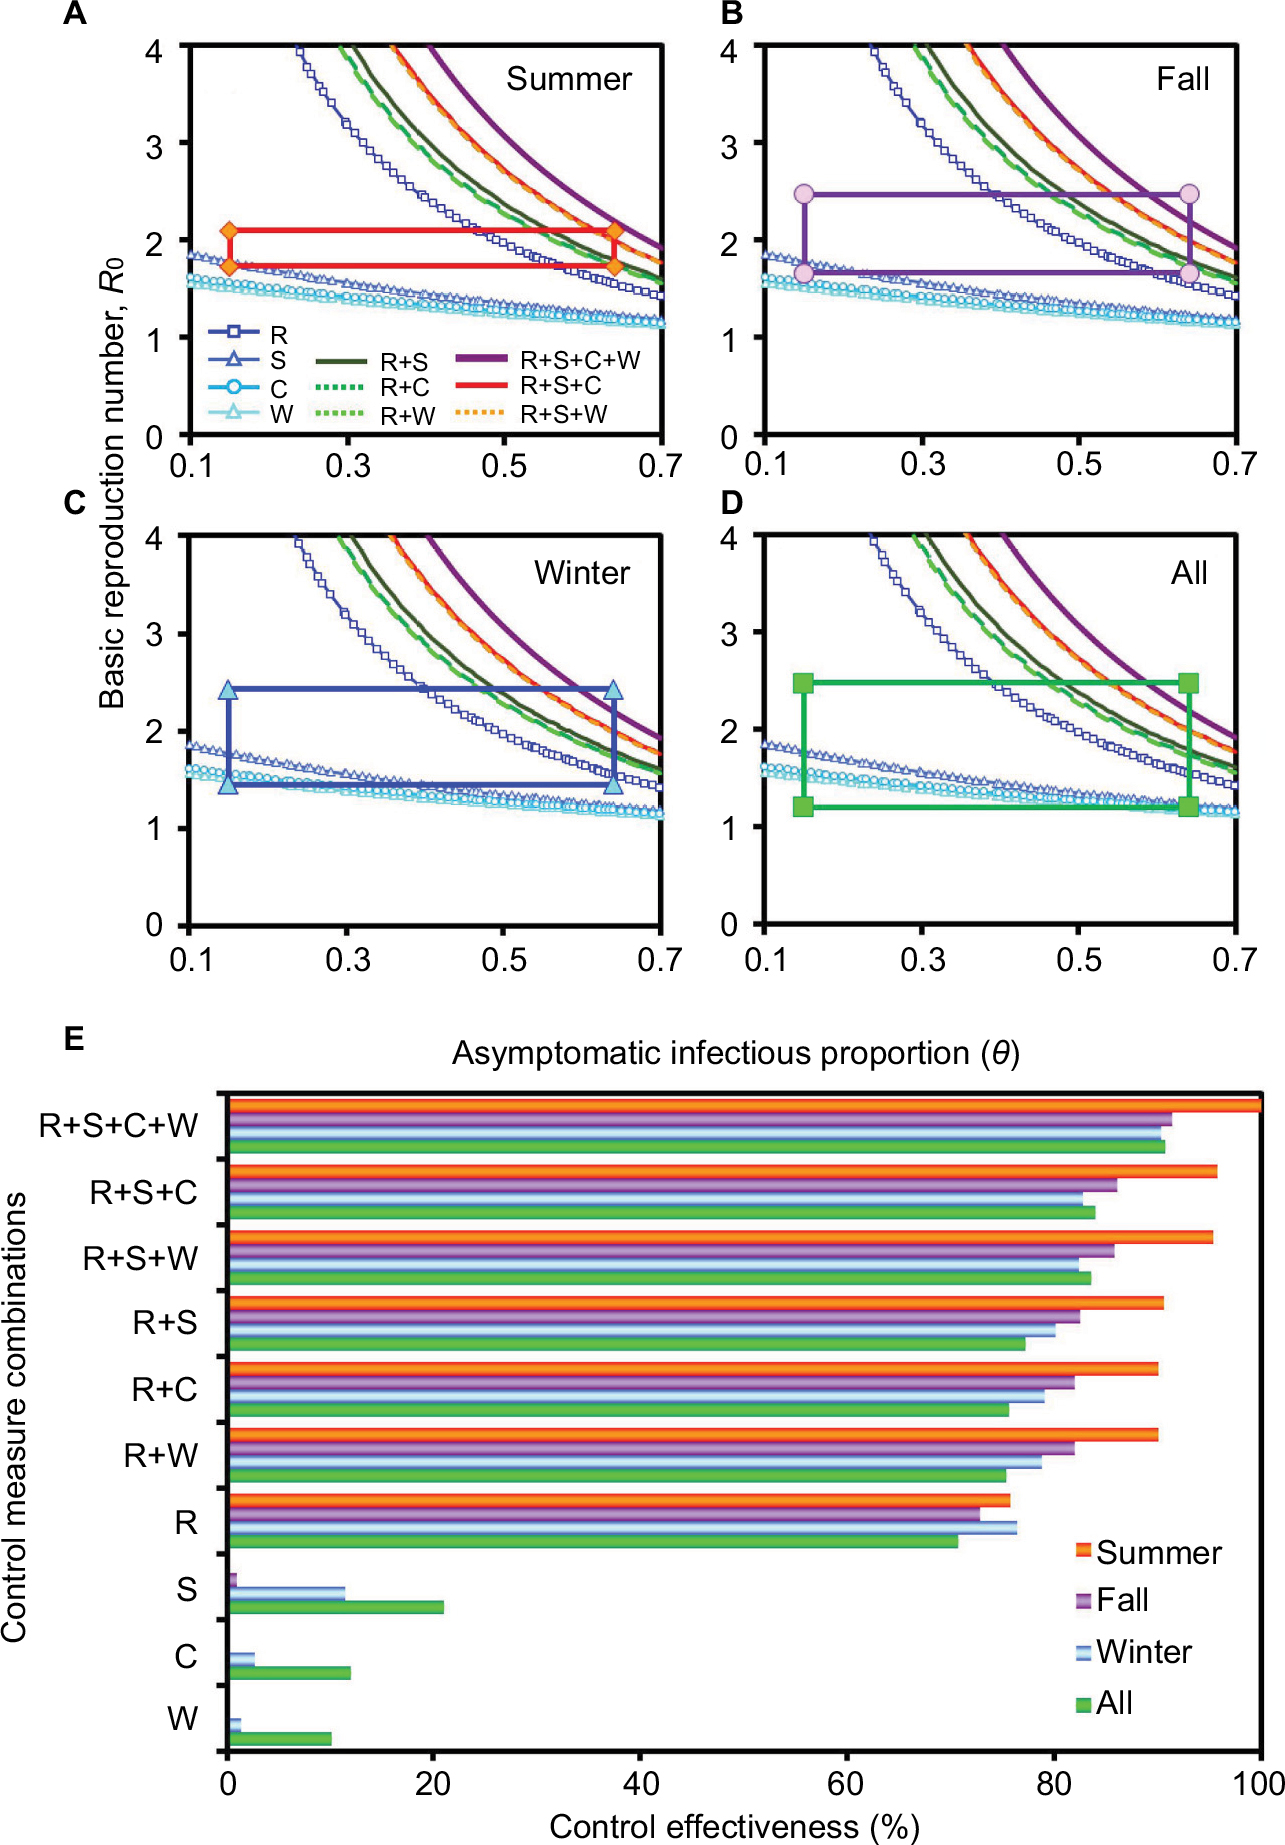 | Figure 7 Multi-efficacy control curve constructed with R0, the asymptomatic infectious proportion, as well as various control efficacies for dengue outbreak containment in different seasons (A) summer, (B) fall, (C) winter, and (D) all seasons. Rectangular boxes showing 95% CIs of R0 and θ, respectively. (E) Control measure effectiveness was estimated based on combinations of different control efficacies for varied seasons. Abbreviations: R0, basic reproduction number; θ, asymptomatic infectious proportion; ε, control efficacies for dengue outbreak containment; R, repellent use; S, pesticide spray; C, water container clean-up; W, life-shortening Wolbachia infection. |
Among all interventions, repellent spray alone by hosts can achieve the highest control effectiveness of 70.76%, 75.75%, 72.79%, and 76.39% in all seasons, summer, fall, and winter, respectively (Figure 7E). Although the combination of the two (εR+εS) and three (εR+εS+εC) highest efficacy control measures being considered simultaneously, >77% and >83% control effectiveness for the fall season can be reached, respectively. In addition, in order to achieve optimum containment of dengue outbreak, we further considered a four efficacy control strategy. As shown in control effectiveness, repellent use, pesticide spray, container clean-up, together with Wolbachia infection (εR+εS+εC+εW) could suppress dengue outbreak by 90%–100% (Figure 7E).
Discussion
Climatic factors such as rainfall and relative humidity affect the disease dynamics.34 The temperature had the highest contribution to the dengue variability in the regions of Taiwan.35 The present study integrated a dengue-mosquito-human transmission model, three temperature-dependent entomological parameters (𝒱m, μm, and SL), with the concept of DALYs to estimate the temperature-varied R0 and dengue disease burden. The extrinsic incubation rate (𝒱m) can be an index of mosquito vector competence and is deeply dependent on temperature change.36,37 Capturing all aspects of the disease is a daunting task, but newer temperature-dependent parameters that incorporate a more holistic view of the viral ecology can be implemented as new information on transmission models.
Besides the three temperature-dependent parameters in the estimation of R0 considered in this study, the other two mosquito-related parameters (transmission probability and biting rate) depend on the temperature and seasonality as well. Due to the lack of experimental data from previous studies, we applied the probabilistic approach to simulate the parameter distribution of these parameters.
The simple nonlinear and logistic model could well describe the relationship of temperature and the entomological properties; even so, we can still obtain the uncertainty in our regression modeling. In addition to temperature, some climatic and environmental factors might play crucial roles to change the ecological characteristic of the mosquito population that increases the challenge in model application. Therefore, we considered the uncertainty in our predicted result in the current study.
Alto and Bettinardi38 assessed the temperature impact on vector competence during immature and adult stages for female mosquito Aedes albopictus with blood feeding with dengue-1 virus infection to determine infection and disseminated infection with dengue-1 virus RNA of mosquito. They demonstrated that adult mosquito cultured at higher temperature environment (30°C) had nearly 80% dissemination. However, both immature and adult stages of mosquitoes with higher rearing temperature had nearly 95% disseminated infection.
It revealed that different rearing stages with higher temperature were associated with increased virus spread to dengue in A. abopictus. The rate of dengue-1 virus disseminated infection on A. aegypti was similar to A. abopictus,39 but A. Aegypti can tolerate the wide-range rearing temperature. The temperature change on virus-disseminated infection of mosquito may be species specific.40,41 Hence, if sufficient published data are available, temperature-dependent virus dissemination should be incorporated into extrinsic incubation rate to quantify the infectious dengue virus-carrying mosquitoes, which could be further used to predict the dengue virus transmission dynamics precisely. However, the influence of other critical factors (eg, seasonality, climatic factors including precipitation and relative humidity, pesticide, herd immunity, and human behavior)31,42 on dengue transmission cannot be neglected and should be explored in future studies.
Our result showed that dengue has the highest transmissibility and causes health burden in the fall (Figure 5), reflecting that overheated (summer) and cool (winter) temperature can relatively reduce the disease activity. In general, the dengue transmission pattern in Taiwan is unique compared to other Southeast Asia countries that has been repeated annually: beginning with imported case from Southeast Asia countries in the early summer, spreading out through southern Taiwan in fall, and dying out in winter because of the cold weather with temperatures dropping to below 15°C. The summer weather in southern Taiwan is hot and wet, which provides perfect conditions for vector A. aegypti to thrive and facilitate the dengue transmission. Since annual dengue cases emerge in early summer, the authorities concentrate mainy on physical and chemical interventions (eg, breeding site clean-up and pesticide spray) during summer, dengue transmission is under controlled.43 If the control measures are not successful, the outbreak then spreads out gradually and peaks around October. Compared with the conditions in summer, the frequency and strength of dengue control measures are reduced during late fall and temperatures drop to below 15°C during late winter, which may lead to a little higher dengue burden in early winter compared to that in late summer.
Based on the epidemiological study in Taiwan, Hsu et al44 indicated that people aged 60–69 years had a relatively higher prevalence rate of dengue fever than those in the other age groups in the period 2010–2014. Also, the more elderly population (aged over 70 years) had the highest rate in 2015 (309 per 100,000 population). Nationally, people aged 0–9, 10–19, 20–29, 30–39, 40–49, 50–69, and 60–69 years generally had a prevalence rate of dengue fever of 85, 160, 177, 157, 153, 208 and 278 per 100,000 populations, respectively, in the 2015 epidemic.44
Besides the temperature dependency in epidemics and disease burden, this study also investigated the optimal control strategies by using the different combinations of the control measures that contain dengue outbreak targeting different aspects of either host and/or vector populations. In this study, four commonly used control measures were combined for modeling the control effectiveness in different seasons. Repellent spray (R) alone by hosts can achieve the higher control effectiveness of 71% whereas the other interventions – pesticide spray (S), water container clean-up (C), and Wolbachia infection (W) can only achieve control effectiveness of 21%, 12%, and 10%, respectively, in all seasons. Therefore, the implication for repellent spray could be expedited in an epidemic setting in the future as the primary preventive response beginning in early summer to contain further dengue outbreaks in the following seasons. Although other interventions, due to lower efficacies compared with that of repellent spray, could serve as complemented and combinative interventions to prevent and contain dengue outbreaks.
Repellent spray alone by hosts is the highest control effectiveness. In considering the repellent product as a control measure against mosquito vectors, it is important to understand specific-repellent efficacy on the length of use45,46 and mosquito species.47 Two essential oils (Melaleuca leucadendron and Callistemon citrinus) have been demonstrated to have higher adulticidal activity with 8 hours of exposure than with 5 hours in A. aegypti and Culex quinquefasciatus.45 Soonwera et al47 found that Cymbopogon citratus oil exhibited repellent activity with 98.7% protection from bites from female A. aegypti and 99.8% from female C. quinquefasciatus. Therefore, future research should investigate the length of use and specific mosquito species to develop repellent spray formulations in the control of dengue vectors.
Conclusion
This study provides an integrated dengue–mosquito–human transmission model and explores the temperature–R0–DALYs relationship for disease burden of dengue fever in southern Taiwan. In the absence of detailed and robust surveillance data, our presented modeling framework provides a useful tool to measure dengue health burden risk and to quantify the effect of dengue control on A. aegypti infection prevalence and disease incidence in the southern region of Taiwan. Most importantly, we quantified the various control interventions to simulate the optimal containment in different seasons. These results are useful to provide the reference to understand the temperature-associated dengue prevalence and to identify priority interventions for high dengue burden regions.
Acknowledgment
This study was supported by the Ministry of Science and Technology of the Republic of China under Grant MOST 104-2222-E-002-030-MY3.
Author contributions
All authors contributed toward data analysis, drafting and critically revising the paper, and agree to be accountable for all aspects of the work.
Disclosure
The authors report no conflicts of interest in this work.
References
Liao CM, Chen SC, Chang CF. Modelling respiratory infection control measure effects. Epidemiol Infect. 2008;136(3):299–308. | ||
Cheng YH, Liao CM. Modeling control measure effects to reduce indoor transmission of pandemic H1N1 2009 virus. Build Environ. 2013;63:11–19. | ||
Anderson RM, May RM. Infectious Diseases of Humans: Dynamics and Control. Oxford, UK: Oxford University Press; 1991. | ||
Keeling MJ, Rohani P. Modeling Infectious Diseases in Humans and Animals. Princeton: Princeton University Press; 2008. | ||
Focks DA, Daniels E, Haile DG, Keesling JE. A simulation model of the epidemiology of urban dengue fever: literature analysis, model development, preliminary validation, and samples of simulation results. Am J Trop Med Hyg. 1995;53(5):489–506. | ||
Coutinho FA, Burattini MN, Lopez LF, Massad E. Threshold conditions for a non-autonomous epidemic system describing the population dynamics of dengue. Bull Math Biol. 2006;68(8):2263–2282. | ||
Burattini MN, Chen M, Chow A, et al. Modelling the control strategies against dengue in Singapore. Epidemiol Infect. 2008;136(3):309–319. | ||
Adams B, Boots M. How important is vertical transmission in mosquitoes for the persistence of dengue? Insights from a mathematical model. Epidemics. 2010;2(1):1–10. | ||
Luz PM, Vanni T, Medlock J, Paltiel AD, Galvani AP. Dengue vector control strategies in an urban setting: an economic modelling assessment. Lancet. 2011;377(9778):1673–1680. | ||
Kramer LD, Ebel GD. Dynamics of flavivirus infection in mosquitoes. Adv Virus Res. 2003;60:187–232. | ||
Chowell G, Diaz-Dueñas P, Miller JC, et al. Estimation of the reproduction number of dengue fever from spatial epidemic data. Math Biosci. 2007;208(2):571–589. | ||
Paaijmans KP, Read AF, Thomas MB. Understanding the link between malaria risk and climate. Proc Natl Acad Sci U S A. 2009;106(33):13844–13849. | ||
Lambrechts L, Paaijmans KP, Fansiri T, et al. Impact of daily temperature fluctuations on dengue virus transmission by Aedes aegypti. Proc Natl Acad Sci U S A. 2011;108(18):7460–7465. | ||
Barbazan P, Guiserix M, Boonyuan W, et al. Modelling the effect of temperature on transmission of dengue. Med Vet Entomol. 2010;24(1):66–73. | ||
Chen SC, Hsieh MH. Modeling the transmission dynamics of dengue fever: implications of temperature effects. Sci Total Environ. 2012;431:385–391. | ||
Liao CM, Huang TL, Cheng YH, et al. Assessing dengue infection risk in the southern region of Taiwan: implications for control. Epidemiol Infect. 2015;143(5):1059–1072. | ||
Liao CM, Huang TL, Lin YJ, et al. Regional response of dengue fever epidemics to interannual variation and related climate variability. Stoch Environ Res Risk Assess. 2015;29(3):947–958. | ||
Fraser C, Riley S, Anderson RM, Ferguson NM. Factors that make an infectious disease outbreak controllable. Proc Natl Acad Sci U S A. 2004;101(16):6146–6151. | ||
Murray CJ. Quantifying the burden of disease: the technical basis for disability-adjusted life years. Bull World Health Organ. 1994;72(3):429–445. | ||
Undurraga EA, Betancourt-Cravioto M, Ramos-Castañeda J, et al. Economic and disease burden of dengue in Mexico. PLoS Negl Trop Dis. 2015;9(3):e0003547. | ||
Shepard DS, Coudeville L, Halasa YA, Zambrano B, Dayan GH. Economic impact of dengue illness in the Americas. Am J Trop Med Hyg. 2011;84(2):200–207. | ||
Shepard DS, Undurraga EA, Halasa YA. Economic and disease burden of dengue in Southeast Asia. PLoS Negl Trop Dis. 2013;7(2): e2055. | ||
Stanaway JD, Shepard DS, Undurraga EA, et al. The global burden of dengue: an analysis from the Global Burden of Disease Study 2013. Lancet Infect Dis. 2016;16(6):712–723. | ||
Luh DL, Liu CC, Luo YR, Chen SC. Economic cost and burden of dengue during epidemics and non-epidemic years in Taiwan. J Infect Public Health. 2018;11(2):215–223. | ||
https://www.epa.gov.tw/mp.asp?mp=epa [homepage on the Internet]. Air Quality Monitoring Network, Environmental Protective Administration, Executive Yuan, Taiwan (R.O.C.) Available from. https://www.epa.gov.tw/mp.asp?mp=epahttp://taqm.epa.gov.tw/taqm/tw/YearlyDataDownload.aspx. | ||
https://nidss.cdc.gov.tw/ch/Default.aspx [homepage on the Internet]. Centers for Disease Control, Taiwan (R.O.C.) Available from. https://nidss.cdc.gov.tw/ch/Default.aspxhttp://nidss.cdc.gov.tw/ch/Default.aspx?op=4. | ||
Dumont Y, Chiroleu F, Domerg C. On a temporal model for the Chikungunya disease: modeling, theory and numerics. Math Biosci. 2008;213(1):80–91. | ||
Yang HM, Macoris ML, Galvani KC, Andrighetti MT, Wanderley DM. Assessing the effects of temperature on the population of Aedes aegypti, the vector of dengue. Epidemiol Infect. 2009;137(8):1188–1202. | ||
Ruiz-Moreno D, Vargas IS, Olson KE, Harrington LC. Modeling dynamic introduction of Chikungunya virus in the United States. PLoS Negl Trop Dis. 2012;6(11):e1918. | ||
McMeniman CJ, Lane RV, Cass BN, et al. Stable introduction of a life-shortening Wolbachia infection into the mosquito Aedes aegypti. Science. 2009;323(5910):141–144. | ||
Knerer G, Currie CS, Brailsford SC. Impact of combined vector-control and vaccination strategies on transmission dynamics of dengue fever: a model-based analysis. Health Care Manag Sci. 2015;18(2):205–217. | ||
Tawatsin A, Wratten SD, Scott RR, Thavara U, Techadamrongsin Y. Repellency of volatile oils from plants against three mosquito vectors. J Vector Ecol. 2001;26(1):76–82. | ||
Mittal PK, Sreehari U, Razdan RK, Dash AP, Ansari MA. Efficacy of Advanced Odomos repellent cream (N, N-diethyl-benzamide) against mosquito vectors. Indian J Med Res. 2011;133(4):426–430. | ||
Barcellos C, Lowe R. Expansion of the dengue transmission area in Brazil: the role of climate and cities. Trop Med Int Health. 2014;19(2):159–168. | ||
Chen SC, Liao CM, Chio CP, Chou HH, You SH, Cheng YH. Lagged temperature effect with mosquito transmission potential explains dengue variability in southern Taiwan: insights from a statistical analysis. Sci Total Environ. 2010;408(19):4069–4075. | ||
Tjaden NB, Thomas SM, Fischer D, Beierkuhnlein C. Extrinsic incubation period of dengue: knowledge, backlog, and applications of temperature dependence. PLoS Negl Trop Dis. 2013;7(6):e2207. | ||
Christofferson RC, Mores CN. Potential for extrinsic incubation temperature to alter interplay between transmission potential and mortality of dengue-infected Aedes aegypti. Environ Health Insights. 2016;10:EHI.S38345-123. | ||
Alto BW, Bettinardi D. Temperature and dengue virus infection in mosquitoes: independent effects on the immature and adult stages. Am J Trop Med Hyg. 2013;88(3):497–505. | ||
Buckner EA, Alto BW, Lounibos LP. Vertical transmission of Key West dengue-1 virus by Aedes aegypti and Aedes albopictus (Diptera: Culicidae) mosquitoes from Florida. J Med Entomol. 2013;50(6):1291–1297. | ||
Buckner EA, Alto BW, Lounibos LP. Larval temperature-food effects on adult mosquito infection and vertical transmission of dengue-1 virus. J Med Entomol. 2016;53(1):91–98. | ||
Gloria-Soria A, Armstrong PM, Powell JR, Turner PE. Infection rate of Aedes aegypti mosquitoes with dengue virus depends on the interaction between temperature and mosquito genotype. Proc Biol Sci. 2017;284(1864):20171506. | ||
Clapham HE, Tricou V, van Vinh Chau N, Simmons CP, Ferguson NM. Within-host viral dynamics of dengue serotype 1 infection. J R Soc Interface. 20142014;11(96):201400940094.. | ||
Lin CC, Huang YH, Shu PY, et al. Characteristic of dengue disease in Taiwan: 2002–2007. Am J Trop Med Hyg. 2010;82(4):731–739. | ||
Hsu JC, Hsieh CL, Lu CY. Trend and geographic analysis of the prevalence of dengue in Taiwan, 2010–2015. Int J Infect Dis. 2017;54:43–49. | ||
Pushpalatha E, Viswan KA. Adulticidal and repellent activities of Melaleuca leucadendron (L.) and Callistemon citrinus (Curtis) against filarial and dengue vectors. ENTOMON. 2013;38(3):149–154. | ||
Hidayatulfathi O, Shamsuddin AF, Rajab NF, et al. Three repellent gels that contain essential oils from local Malaysian plants against dengue vector. Trop Biomed. 2017;34(3):540–549. | ||
Soonwera M, Phasomkusolsil S. Mosquito repellent from Thai essential oils against dengue fever mosquito (Aedes aegypti (L.)) and filarial mosquito vector (Culex quinquefasciatus (Say)). Afr J Microbiol Res. 2014;8:1819–1824. | ||
World Health Organization. The Global Burden of Disease: 2004 Update. Geneva: WHO Press; 2008. | ||
Anderson KB, Chunsuttiwat S, Nisalak A, et al. Burden of symptomatic dengue infection in children at primary school in Thailand: a prospective study. Lancet. 2007;369(9571):1452–1459. | ||
Newton EA, Reiter P. A model of the transmission of dengue fever with an evaluation of the impact of ultra-low volume (ULV) insecticide applications on dengue epidemics. Am J Trop Med Hyg. 1992;47(6):709–720. | ||
Focks DA, Haile DG, Daniels E, Mount GA. Dynamic life table model for Aedes aegypti (Diptera: Culicidae): analysis of the literature and model development. J Med Entomol. 1993;30(6):1003–1017. | ||
Harn MR. Clinical study on dengue fever during 1987–1988 epidemic at Kaohsiung City, southern Taiwan. Gaoxiong Yi Xue Ke Xue Za Zhi. 1989;5(1):58–65. | ||
Hsieh YH, Ma S. Intervention measures, turning point, and reproduction number for dengue, Singapore, 2005. Am J Trop Med Hyg. 2009;80(1):66–71. | ||
Padmanabha H, Durham D, Correa F, Diuk-Wasser M, Galvani A. The interactive roles of Aedes aegypti super-production and human density in dengue transmission. PLoS Negl Trop Dis. 2012;6(8):e1799. |
 © 2018 The Author(s). This work is published and licensed by Dove Medical Press Limited. The
full terms of this license are available at https://www.dovepress.com/terms
and incorporate the Creative Commons Attribution
- Non Commercial (unported, 3.0) License.
By accessing the work you hereby accept the Terms. Non-commercial uses of the work are permitted
without any further permission from Dove Medical Press Limited, provided the work is properly
attributed. For permission for commercial use of this work, please see paragraphs 4.2 and 5 of our Terms.
© 2018 The Author(s). This work is published and licensed by Dove Medical Press Limited. The
full terms of this license are available at https://www.dovepress.com/terms
and incorporate the Creative Commons Attribution
- Non Commercial (unported, 3.0) License.
By accessing the work you hereby accept the Terms. Non-commercial uses of the work are permitted
without any further permission from Dove Medical Press Limited, provided the work is properly
attributed. For permission for commercial use of this work, please see paragraphs 4.2 and 5 of our Terms.