Back to Journals » Clinical Ophthalmology » Volume 20
Artificial Intelligence Driven Adjusted OCT-Based Classification System for Diabetic Macular Edema (AIDME)
Authors Abreu-González R ![]() , Quezada-Peralta G
, Quezada-Peralta G ![]() , Udaondo P
, Udaondo P ![]() , Gil-Hernández MA, Donate-López J
, Gil-Hernández MA, Donate-López J ![]()
Received 23 February 2026
Accepted for publication 8 May 2026
Published 19 May 2026 Volume 2026:20 604743
DOI https://doi.org/10.2147/OPTH.S604743
Checked for plagiarism Yes
Review by Single anonymous peer review
Peer reviewer comments 2
Editor who approved publication: Dr Yousef Fouad
Rodrigo Abreu-González,1,2 Gonzalo Quezada-Peralta,3 Patricia Udaondo,4,5 María Antonia Gil-Hernández,1 Juan Donate-López2,3
1Ophthalmology Department, University Hospital of La Candelaria, Tenerife, Spain; 2Fundación Ver Salud, Madrid, Spain; 3Ophthalmology Department, La Luz Hospital, Madrid, Spain; 4University and Polytechnic Hospital La Fe, Valencia, Spain; 5Aiken Ophthalmological Clinic, Valencia, Spain
Correspondence: Rodrigo Abreu-González, Ophthalmology Department, University Hospital of La Candelaria, Carretera del Rosario, 105, Santa Cruz de Tenerife, Tenerife, 38010, Spain, Tel +34 922 602272, Email [email protected]
Objective: To develop and validate an adjusted scoring-based classification system for Diabetic Macular Edema (DME) using quantitative and qualitative parameters. The system aims to improve clinical decision making and correlate disease severity with visual outcomes.
Methods: A cohort of patients with DME was analyzed using optical coherence tomography (OCT) data. Key quantitative variables included retinal thickness (RT), intraretinal fluid (IRF), and subretinal fluid (SRF), which were scored according to severity thresholds (0– 2 points per parameter). Qualitative biomarkers, including disorganization of the retinal inner layers (DRIL) and epiretinal membrane (ERM), were incorporated as severity modifiers (+2 for DRIL and +1 for ERM). The patients were classified based on the total score as follows: Mild (0– 3 points), Moderate (4– 6 points), and severe (> 7 points). Visual acuity (logMAR) was analyzed to validate the system and to assess its correlation with disease severity. Statistical analyses included descriptive summaries and ANOVA for intergroup comparisons.
Results: A total of 71 patients were classified into three groups: mild (48 patients, mean logMAR 0.45), moderate (18 patients, mean logMAR 0.56), and severe (5 patients, mean logMAR 0.92). The system showed significant differences in logMAR values (p = 0.014). ROC curve analysis showed an area under the curve (AUC) of 0.89. This adjusted scoring method aligned well with the clinical expectations, emphasizing the impact of fluid accumulation and structural biomarkers on vision impairment.
Conclusion: The adjusted scoring-based classification system for DME demonstrated a robust correlation between the disease severity and visual acuity. Integrating quantitative measures and qualitative markers offers a practical and clinically relevant approach for stratifying DME severity. This method has the potential to enhance decision making in routine practice and research applications.
Plain Language Summary: Diabetic macular edema (DME) is a complication of diabetes that causes swelling in the central part of the retina, called the macula. This can lead to blurred or reduced vision. Accurate evaluation of how severe the disease is can help doctors decide the best treatment and predict how the patient’s vision might change.
In this study, we developed and tested a new system to classify the severity of DME. The system is based on measurements from eye scans called optical coherence tomography (OCT). These scans give detailed images of the retina and allow doctors to measure the amount of swelling and detect certain changes in the retinal structure.
Our method uses both numbers (like how thick the retina is or how much fluid is present) and signs of structural damage (such as specific patterns or layers being affected). We assigned scores to these features to sort patients into three groups: mild, moderate, and severe.
We tested this system and found that those with more severe disease, based on our scoring system, had worse vision. This suggests that the system works well to reflect how the disease affects eyesight.
This new classification system can help eye doctors better understand the condition of patients with DME and make more informed decisions about treatment. It may also be useful in future research or clinical trials looking at new ways to treat this condition.
Keywords: artificial intelligence, diagnostic/tests investigation, diabetic macular edema, imaging, optical coherence tomography, vision
Introduction
Diabetic macular edema (DME) is a critical complication of diabetic retinopathy (DR) and a significant cause of vision loss in individuals with diabetes. Its classification has evolved over the years, driven by advancements in diagnostic imaging techniques and a deeper understanding of the pathophysiology of the condition.
DME is a common microvascular complication of DR, characterized by the accumulation of fluid in the macula due to dysfunction of the inner blood-retinal barrier. This results in retinal thickening and decreased central visual acuity (VA). According to the most recent estimates, the global prevalence of DME in the diabetic population in 2024 ranges from 2% to 10%, depending on factors such as type of diabetes, disease duration, and metabolic control. In addition, it is estimated that approximately 4.0% of people with diabetes worldwide have DME, representing a significant burden on the public health system.1
These findings highlight the importance of implementing early detection strategies and proper management of DME to reduce its impact on the quality of life of patients with diabetes.
Accurate classification of DME is essential for guiding therapeutic decisions and predicting visual prognosis. The Early Treatment Diabetic Retinopathy Study (ETDRS) introduced the concept of “clinically significant macular edema” (CSME), defined by the presence of retinal thickening or hard exudates within 500 µm of the foveal center or retinal thickening of at least one disc area, part of which is within one disc diameter of the foveal center.2
Advances in imaging technologies have enabled more detailed classification of DME. Fluorescein angiography (FA) classifies DME as focal, diffuse, or ischemic. On the other hand, optical coherence tomography (OCT) allows identification of morphological patterns such as diffuse retinal thickening, cystoid edema, and neurosensory detachment.3–5
The European School for Advanced Studies in Ophthalmology (ESASO) has proposed a classification system based on seven biomarkers detectable by OCT:6
- Hyperreflective foci (HF)
- Ellipsoid zone disruption (EZ)
- External limiting membrane integrity (ELM)
- Intraretinal hyperreflective material (IRM)
- Subretinal hyperreflective material (SRHM)
- Inner nuclear layer thickening (INL thickening)
- Epiretinal membranes (ERM)
Based on these biomarkers, DME is classified into four subtypes:
- Early: Predominantly cystoid DME with hyperreflective foci. All retinal layers were visible and intact.
- Advanced: Multiple cystoid spaces and macrocysts. The EZ and/or ELM may be intact or disrupted, and disorganization of the retinal inner layers (DRIL) may be present.
- Severe: Macular thickening greater than 30% above normal levels with advanced structural damage. EZ and/or ELM are absent, and DRIL may or may not be present.
- Atrophic maculopathy: A complex form of DME with multiple coexisting biomarkers, including extensive disruption of the outer and inner retinal layers. In this case, macular thickening decreased to <10% of normal values.
The integration of artificial intelligence (AI) tools in ophthalmology has revolutionized image analysis, enabling objective and automated quantification of DME-associated biomarkers.7 Several artificial intelligence–based platforms are currently available for the quantification of retinal fluid and other imaging biomarkers on OCT scans in patients with DME and age-related macular degeneration (AMD).
These AI tools have revolutionized OCT image analysis by providing objective and reproducible quantification of key biomarkers in DME and AMD. Among the most prominent solutions are RetInSight®, DeepMind®, MR-Doc Ophthal®, and ReF-Net®. Each platform has its own specific features; for example, ReF-Net enables volumetric segmentation of retinal fluid in both OCT and OCT angiography images.
Platforms such as Discovery® (Retinai, Berna, Switzerland) have developed deep learning algorithms that automatically analyze OCT images to quantify key parameters, such as central retinal thickness (CRT), intraretinal fluid (IRF) and subretinal fluid (SRF) volume, and the presence of hyperreflective foci (HF). These measurements are consistent, reproducible, and allow the precise tracking of patient evolution.8
For example, in a clinical setting, Discovery can generate longitudinal plots displaying the patient’s response to anti-VEGF treatment after each injection, allowing the ophthalmologist to adjust the treatment intervals based on objective quantitative data. Moreover, these tools can detect subtle relapses before they become clinically apparent, thereby optimizing decision-making and personalizing disease management.
Despite the availability of these advanced tools, there remains a clinical gap: existing DME classification systems often rely on qualitative assessments or single metrics, failing to provide a holistic, evidence-based scoring system that leverages automated AI quantifications. Therefore, the main objective of this study was to develop and validate the AIDME, an integrated scoring system that combines quantitative and qualitative OCT biomarkers to accurately correlate disease severity with visual outcomes.
Ethical approval: The study protocol was approved by the Institutional Review Board (IRB) of the Canary Islands University Hospital Complex (Tenerife, Spain). The study adhered to the tenets of the Declaration of Helsinki. Informed consent was waived by the Clinical Research Ethics Committee (CEIm), as this was a retrospective, cross-sectional observational study based exclusively on review of medical records at the time of disease onset. All data were anonymized prior to analysis; therefore, re-contacting participants was not feasible. No identifiable information was accessed or generated, and the procedures performed posed no additional risks beyond routine clinical practice, involving only the customary use and transfer of clinical data.
Materials and Methods
Study Design and Population: This retrospective cohort study was conducted at a tertiary ophthalmology center (University Hospital of La Candelaria, Tenerife, Spain). We included treatment-naïve eyes with center-involving DME diagnosed over a consecutive one-year period. We included center-involved DME defined as retinal thickening involving the central 1-mm ETDRS subfield on OCT. The historical CSME definition (ETDRS) is cited for context; however, OCT involvement determined eligibility. The exclusion criteria included eyes with significant media opacities, previous retinal surgeries, or concomitant retinal diseases affecting the macular structure.
OCT Analysis and Classification System: Macular volume scans were acquired on Spectralis (Heidelberg Engineering, Germany) using a standardized protocol (20°×20°, ~6×6 mm, ART ≥9). Scans with motion artifact or low signal were repeated. All automated layer segmentations and fluid maps underwent visual quality control by two fellowship-trained retina specialists. OCT macular scans were analyzed to extract key quantitative and qualitative parameters using the Discovery platform. The parameters analyzed by the platform are:
- Retinal thickness (RT): central subfield thickness (CST, 1-mm) in µm.
- Intraretinal fluid (IRF) and subretinal fluid (SRF) were quantified in the nanoliters within the 6 mm ETDRS circle.
- Biomarkers (HF, drusen, reticular pseudodrusen, epiretinal membrane (ERM), geographic atrophy, outer retinal atrophy, DRIL, and pigment epithelial detachment) were classified as present or absent within the 6 mm ETDRS circle.
Data Processing and Cluster Analysis: A k-means clustering analysis was performed to identify subgroups within the dataset based on RT, IRF, SRF, and biomarkers (HF, drusen, reticular pseudodrusen, ERM, geographic atrophy, outer retinal atrophy, DRIL, and pigment epithelial detachment). The optimal number of clusters is determined using the elbow method.
Feature Selection for Clustering
A set of structural OCT parameters was selected based on clinical relevance in diabetic macular edema and their capacity to capture morphological variability. These included central retinal thickness (CRT), intraretinal fluid (IRF), subretinal fluid (SRF), disorganization of the retinal inner layers (DRIL), and others.
Prior to clustering, we assessed inter-variable correlations and performed principal component analysis to avoid redundancy and ensure that each variable contributed independently to the clustering structure. Variables with low variance or high collinearity were excluded.
All selected parameters were standardized (z-scores) before applying the clustering algorithm.
Statistical Analysis: Descriptive statistics were used to summarize the demographic and clinical variables. ANOVA was used to assess differences in visual acuity (logMAR) among the classification groups. The Kruskal–Wallis test was also applied to validate non-parametric comparisons, where applicable. The correlation between the classification scores and visual acuity was analyzed using Pearson’s correlation coefficient. Statistical significance was set at p < 0.05. Sensitivity and specificity analyses were conducted to assess the predictive performance of the AIDME classification system compared with conventional grading methods.
Development of the AIDME Scoring System
Following the clustering analysis, a composite scoring system (AIDME: Artificial Intelligence Driven Adjusted Scoring-Based Classification System for Diabetic Macular Edema) was developed to quantify the structural severity of each eye based on OCT biomarkers. Each structural parameter included in the clustering model was assigned a score (0 or 1) based on its presence or absence. In cases of continuous variables (eg., central subfield thickness, IRF, SRF), thresholds were determined based on cluster centroids and clinical cut-offs to binarize the data. The final AIDME score was calculated by summing the points of all present features, with each contributing equally (unweighted sum).
This scoring system served two purposes: (1) to explore the correlation between structural severity and baseline visual acuity using Pearson’s correlation coefficient, and (2) to evaluate the diagnostic performance of the AIDME score in differentiating between mild and severe phenotypes of DME compared to conventional classification systems. Sensitivity, specificity, and area under the ROC curve (AUC) were calculated to assess performance.
Results
We analyzed 71 eyes from 71 patients with center-involved DME. Clustering on RT, IRF, and SRF produced three different groups (cluster 1, 2 and 3). Groups differed progressively in fluid burden and thickness, with cluster 1 showing low CST/IRF/SRF and rare DRIL/ERM, and cluster 3 showing high CST and fluid volumes with frequent DRIL/ERM. Among the qualitative biomarkers initially considered (DRIL, ERM, HF, drusen/RPD, GA/ORA, PED), only DRIL and ERM improved discrimination across data-driven groups. HF, drusen/RPD, GA/ORA, and PED showed limited added value for DME cluster grading and were not retained in the final model.
The characteristics of the three clusters created are (Table 1):
- Cluster 1: Low IRF and SRF, minimal DRIL/ERM, RT ~319 µm (corresponding to mild cases).
- Cluster 2: Moderate IRF/SRF, occasional DRIL, RT ~376 µm (corresponding to moderate cases).
- Cluster 3: High IRF/SRF, frequent DRIL and ERM, RT ~416 µm (corresponding to severe cases).
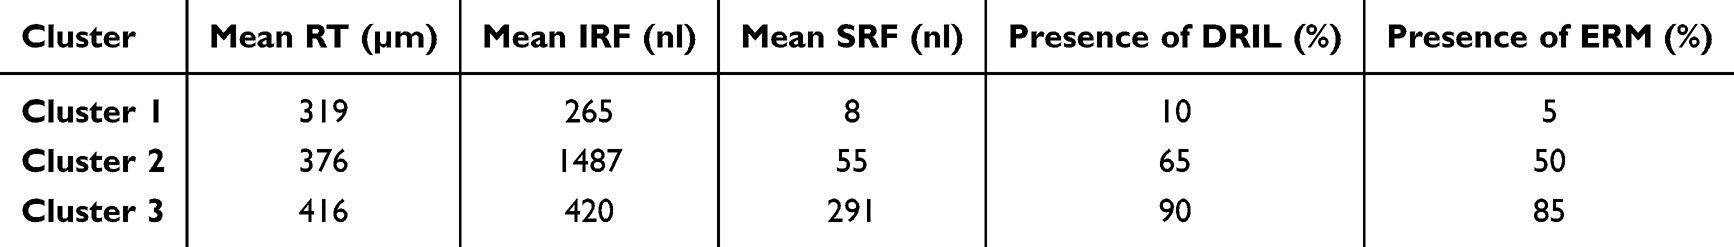 |
Table 1 Average of the Different Variables in the Three Clustering Groups |
Quantitative cutoffs were established for RT, IRF, and SRF variables according to the three clustered groups and points were assigned for each subgroup. The DRIL showed a greater correlation with the severity of DME than the ERM; therefore, the presence of DRIL was given a score of two points and the ERM, one point (Table 2). The AIDME score sums quantitative points for RT/IRF/SRF ranges plus ordinal modifiers for DRIL (+2) and ERM (+1). Total scores map to mild, moderate, or severe categories.
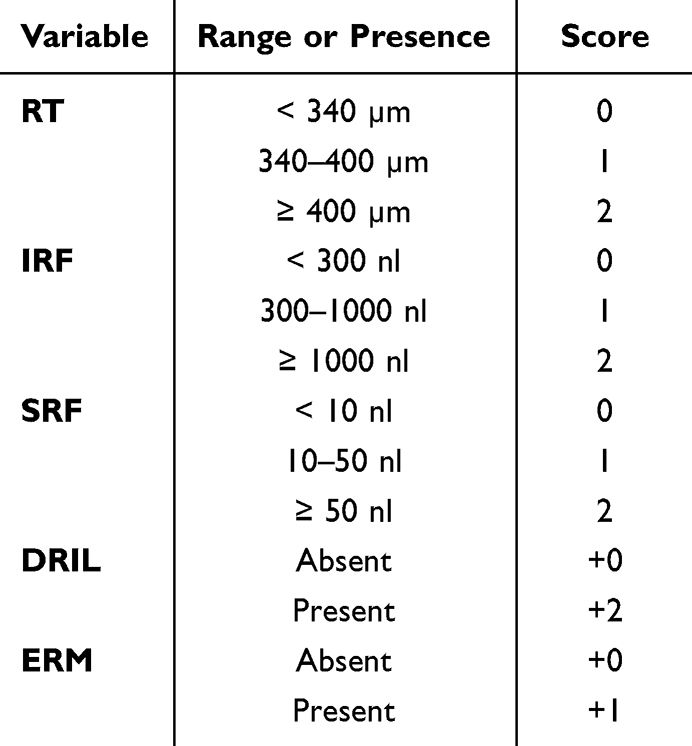 |
Table 2 Cut-off Values and Their Corresponding Scores for the Different Variables Included in the Proposed Classification |
The patients were classified as follows (Figure 1):
- Mild: 0–3 points
- Moderate: 4–6 points
- Severe: >7 points
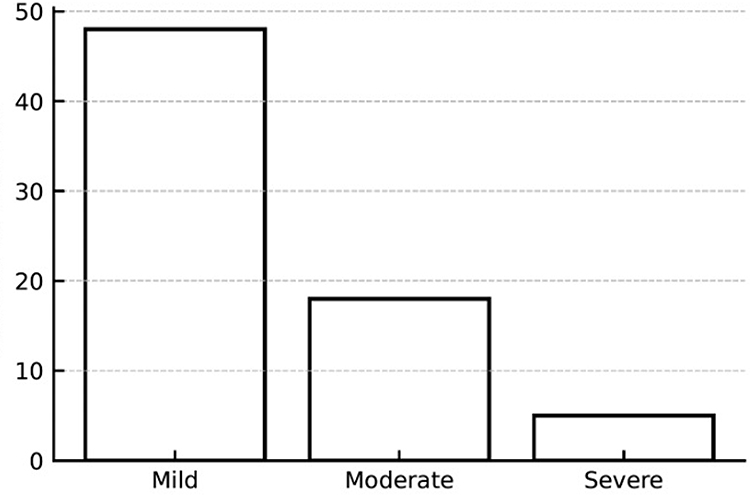 |
Figure 1 Bar chart showing the distribution of patients in mild, moderate and severe groups. |
Patient classification and VA correlation: Of the 71 patients, 48 were classified as mild (logMAR 0.45), 18 as moderate (logMAR 0.55), and 5 as severe (logMAR 0.92). A significant difference in visual acuity among the groups was observed (p = 0.014), supporting the predictive validity of the AIDME system (Figure 2 and Table 3).
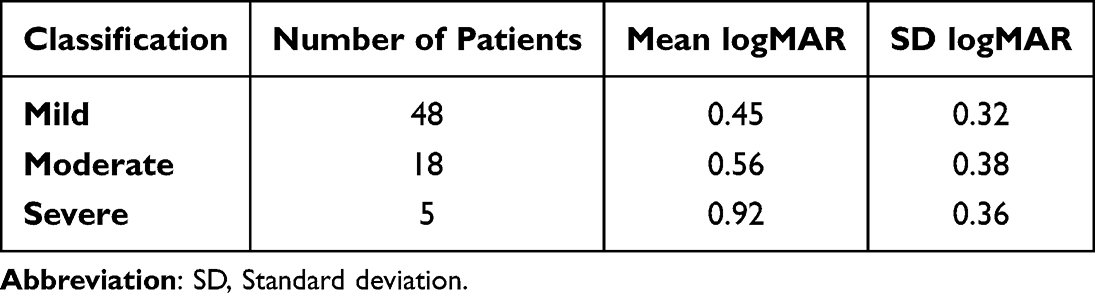 |
Table 3 Distribution of Patients Among the Three Groups and Their Average VA |
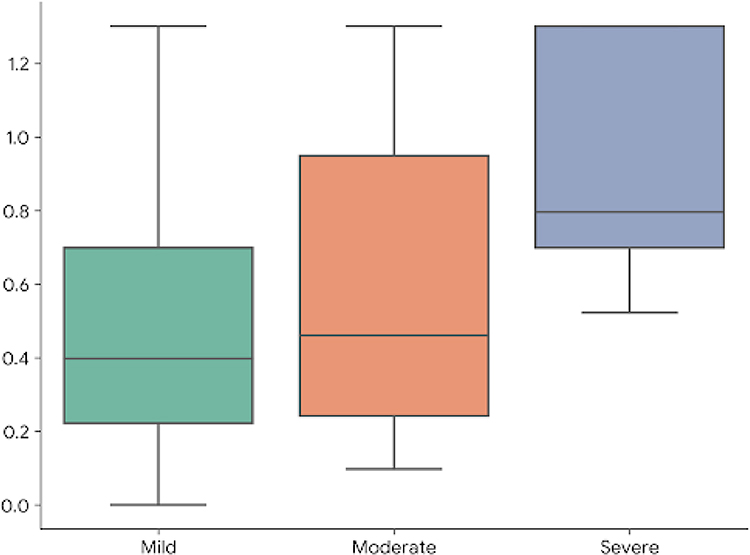 |
Figure 2 Scatter plot: Represents the relationship between classification and average logMAR, highlighting how visual impairment increases with classification severity. |
Expanded statistical analysis further statistical evaluations included:
- Post-hoc comparisons Tukey’s test confirmed significant differences between the mild and severe groups (p = 0.012).
- Regression analysis demonstrated a significant negative correlation between AIDME scores and VA (r = 0.34, p = 0.004).
- ROC curve analysis showed an area under the curve (AUC) of 0.89, indicating a strong predictive capacity of the AIDME classification system (Figure 3).
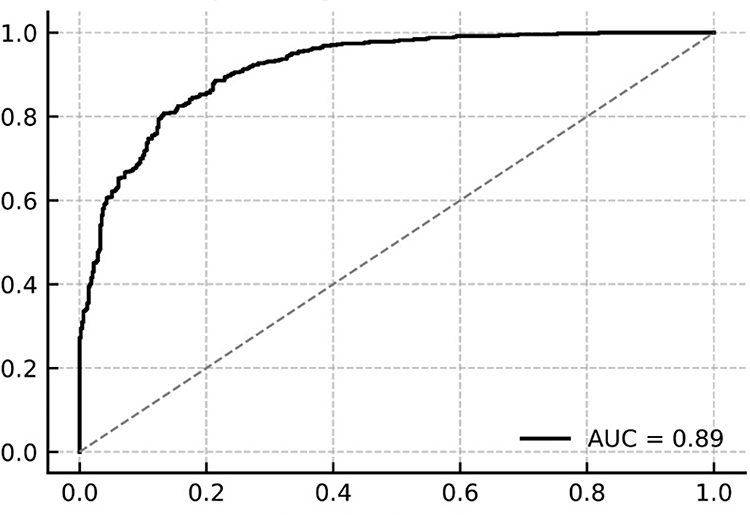 |
Figure 3 Receiver operating characteristic curve (ROC) with an area under the curve (AUC) of 0.89 indicating a high accuracy in classifying the severity of DME. |
Discussion
AI has revolutionized the identification of retinal biomarkers using OCT. By leveraging advanced deep learning algorithms, it is now possible to analyze large datasets and automatically detect features, such as RT, IRF, SRF, HF, and drusen. This not only improves the precision of identifying these biomarkers but also accelerates the diagnostic process, enabling more detailed and effective monitoring of diseases such as DME.9–11
The classification proposed in our study represents a significant advancement over previous and current systems because it incorporates new information extracted via AI. We used classical parameters previously employed in other classifications and new variables enabled by AI-based analysis.
In this study, we applied cluster analysis, an unsupervised learning technique, to identify homogeneous groups of patients with DME based on qualitative and quantitative OCT biomarkers. We selected the K-means algorithm, which enabled the segmentation of data into well-defined clusters by analyzing similarities among key variables, such as RT, SRF, IRF, and the presence of DRIL and ERM.12,13 This approach stands out for its ability to reveal patterns that are not easily identified by conventional methods, thus allowing for more accurate stratification. A comparison of the resulting clusters revealed subgroups with differences in disease severity and potential therapeutic responses.
We treated RT and fluid volumes (IRF/SRF) as quantitative variables because they are continuous, device-generated metrics with high repeatability and a direct biological interpretation as edema burden. Using them as continuous inputs maximizes dynamic range, minimizes observer bias, and allows data-driven thresholds for severity. In contrast, DRIL and ERM were encoded qualitatively (ordinal modifiers). At present, robust cross-platform automated volumetry/segmentation for these microstructural features is not widely available, and their presence/extent is best captured by standardized qualitative criteria that are strongly linked to visual function.
RT has long been associated with DME because it reflects retinal tissue thickening due to extravasated fluid beyond the blood-retinal barrier. Since the classical ETDRS classification of 1985, it has been included, albeit only qualitatively, in the measurement. RT is not only a diagnostic sign but has also been linked to VA loss.14 Studies such as those by Islam et al demonstrated a moderate correlation between foveal thickness measured by OCT and VA reduction.15 In their DME cohort, the mean foveal thickness was 395 µm, in contrast with the average of 250 µm found in healthy populations in our setting.16 They also reported a standard deviation of 142 µm with a range of 183–825 µm. This highlights the variability of RT measurements and the need to assess them along with IRF and SRF values for better disease characterization.
Both IRF and SRF are typical DME features. IRF is present in nearly all patients at diagnosis, whereas SRF is found in less than half of cases.17 To date, no DME classification has employed quantitative measures of these values; they are usually estimated indirectly via RT or qualitatively assessed, as in the ESASO group classification.6 Including these variables helps to determine which retinal compartment is most affected, contributing to a more detailed RT assessment. While IRF and SRF showed appropriate distributions for effective three-cluster separation, pigment epithelial detachment (PED) was not, and was therefore excluded from the final classification.
Among the biomarkers analyzed, only DRIL and ERM showed sufficient discriminatory power during clustering for inclusion in the final classification. DRIL has been recognized as an important biomarker of DME.18 Several studies have shown that the presence and extent of DRIL, as seen on OCT, correlate with poorer VA outcomes and reduced response to standard treatments, such as anti-VEGF therapy.19,20 This suggests that DRIL not only reflects microvascular damage from diabetes, but also retinal neuronal dysfunction, contributing more deeply to visual impairment than fluid accumulation alone.21 Consequently, the identification and monitoring of DRIL could serve as a key prognostic marker.
ERM is a fibrocellular proliferation that develops on the retinal surface, potentially causing traction in the macular area and contributing to DME development and persistence. This traction distorts the retinal architecture and may impair visual function. Inflammatory cytokine levels are elevated in the vitreous humor of patients with DR, which has been linked to increased ERM prevalence.22 Evaluating the vitreoretinal interface in DME patients is thus critical, as the presence of ERM may exacerbate VA loss. Karaküçük et al evaluated VA and OCT changes after a monthly loading dose of ranibizumab and found no significant differences between patients with and without ERM.23 Although other studies show a lower response to anti-VEGF treatment in patients with ERM, as well as a better response after surgical treatment by vitrectomy.24,25
Numerous DME classifications have been proposed in recent decades. The earliest is the 1985 ETDRS clinical classification, which uses fundoscopic signs—retinal thickening and hard exudates at varying distances from the macula—to define CSME.2 Similarly, in 2003, the International Clinical DME Severity Scale classified DME as mild, moderate, or severe when “apparently present”.26 Both were based on clinical examinations before OCT. At that time, angiographic classifications also emerged (focal, multifocal, diffuse, and mixed), offering insights into EMD patterns and foveal avascular zone status, although this invasive technique limits routine use.27,28
With the introduction of OCT, more detailed anatomical analyses have become possible. One of the earliest OCT-based classifications, developed by Panozzo et al in 2004, focuses on edema morphology and vitreomacular traction.4 Subsequent classifications, such as the 2014 LET system, revisited earlier concepts by mapping phenotypes across nine ETDRS macular regions.29 The most recent update came from ESASO, which was again led by Dr. Panozzo. Their classification considers retinal thickening (T), cyst characteristics (C), ellipsoid zone integrity (EZ), DRIL presence, hyperreflective foci (H), subretinal fluid (F), and vitreoretinal interface status (V).6 Each component was scored and combined into a staging table to yield the final classification. The ESASO system outperformed individual biomarkers in predicting visual outcomes.30
Our proposed AIDME classification system shares several similarities with the ESASO system, particularly in terms of RT and SRF. However, AIDME measures these quantitatively and quantifies IRF in µm, rather than using qualitative cyst descriptions. DRIL was included in both the models as a key predictive factor. While other parameters demonstrated functional relevance, they lacked sufficient discrimination for inclusion in the clustering analysis. A major difference lies in clinical applicability: the ESASO system requires considerable time for variable identification and score calculation despite high interobserver agreement.31,32 In contrast, although also requires exact quantitative data, it can rapidly extract them through AI platforms already integrated in some OCT systems, such as Discovery in Heidelberg devices.33
Compared to existing qualitative classifications such as ETDRS or ESASO, the AIDME system offers a quantitative, biomarker-based approach that may provide several tangible advantages in clinical practice. First, the use of standardized scores based on objective structural OCT features improves reproducibility and reduces interobserver variability, facilitating consistent decision-making across clinicians and institutions. Second, the AIDME score functions as a continuous metric that can be monitored over time, allowing for more sensitive detection of anatomical changes during follow-up or in response to treatment. Third, by quantifying structural severity, the AIDME system enables more precise risk stratification, potentially identifying patients who are more likely to experience poor visual outcomes or require early therapeutic escalation. This scoring approach thus supports a more personalized, data-driven management of diabetic macular edema.
AI has provided substantial benefits in real-world ophthalmic practices. The first AI-based DR screening system (IDx-DR), which uses deep learning to analyze fundus photographs, was developed in 2016 and outperformed trained ophthalmologists in terms of sensitivity and specificity.34 Other models, such as EyeArt and LuxIA, have shown similar performance.35,36 Systems such as retinaLyze have been expanded to detect glaucoma and AMD.37 Similar to Discovery, platforms such as the Vienna Fluid Monitor and GA Monitor offer automatic segmentation and quantification of IRF, SRF, and PED, as well as photoreceptor status via RPE and ellipsoid zone analysis.38 RetInSight, Discovery, iPredict, and RetinaLyze are all MDR-certified (European Medical Device Regulation).39 These AI tools have demonstrated comparable performances to expert interpretations.40–42 OCT-based systems such as Discovery often use various DL techniques, including generative adversarial networks (GANs), which automatically segment retinal layers and quantify retinal fluids.40 Accurate segmentation is essential for detecting DRIL, photoreceptor integrity, and geographic atrophy.42 Although the implementation of such systems offers many advantages, it also has limitations: data input requirements may underrepresent rare diseases or demographics. There are also concerns about data privacy and decision-making accountability, which are currently regulated in various countries.
The present AIDME classification system is consistent with the growing evidence supporting OCT-based artificial intelligence approaches for the characterization and stratification of diabetic macular edema. In a large multicenter cohort, Midena et al used AI-assisted clustering analysis of more than 2000 DME eyes and identified distinct OCT morphological phenotypes based on automatically quantified biomarkers, including intraretinal fluid, subretinal fluid, hyperreflective retinal foci, and outer retinal layer integrity.43 Their findings confirmed that DME is not a homogeneous entity, but rather comprises different structural patterns with potential clinical and prognostic relevance. In this context, our adjusted OCT-based scoring system provides a complementary and clinically oriented approach: instead of defining unsupervised morphological clusters, AIDME translates key OCT features into a simplified severity score that incorporates both quantitative parameters, such as retinal thickness, IRF, and SRF, and qualitative modifiers, including DRIL and ERM. The significant association between increasing AIDME severity and worse visual acuity, together with the high discriminatory performance observed in ROC analysis, supports the coherence of our findings with those of Midena et al while adding an innovative, practical framework for routine clinical stratification. Thus, AIDME may help bridge advanced AI-driven OCT phenotyping and real-world decision making by offering an interpretable classification system that reflects both anatomical disease burden and functional impairment.
The limitations of our study include its single-center design, which may limit the generalizability to other settings. Moreover, the inclusion of only treatment-naive DME patients prevents the assessment of features and outcomes in previously treated individuals, which is a key subgroup in routine care. Future studies should employ multicenter designs to improve representativeness and include both naïve and actively treated patients for a more comprehensive understanding of DME characteristics and therapeutic responses across clinical contexts. We acknowledge that the limited sample size and the uneven distribution of disease severity, particularly the low representation of severe DME cases, constrain the generalizability of our findings. Besides, the study was conducted in a relatively small, single-center cohort, which may limit the generalizability of the results to broader and more diverse patient populations. In addition, the assessment of DRIL and ERM required manual evaluation, which may introduce observer-dependent variability and limit scalability in routine clinical practice.
Nevertheless, the AIDME model should be considered a hypothesis-generating framework that demonstrates the feasibility of AI-driven structural classification. Future multicenter studies with larger and more balanced cohorts are warranted to validate and refine this approach for broader clinical application.
Although the AIDME classification system is based on routinely available OCT biomarkers, its current applicability in clinical practice remains limited by the need for manual evaluation of certain features, such as the presence of epiretinal membrane (ERM) and disorganization of the retinal inner layers (DRIL), both of which require subjective interpretation by experienced graders. While some parameters (eg., central retinal thickness, IRF, SRF) can be automatically quantified by OCT devices, a fully automated and integrated version of the AIDME system is not yet available. AI was used for assisted quantification, not as a fully autonomous decision-making tool. Therefore, this study should be viewed as a proof of concept that demonstrates the potential utility of an AI-adjusted scoring framework, which could be further developed and validated for future integration into clinical decision-support tools.
The AIDME system demonstrated a strong correlation between OCT-based parameters and visual function, providing a practical classification tool for clinical use. Compared with existing systems, AIDME integrates both fluid accumulation and structural biomarkers, thereby enhancing its applicability. Further validation with larger multicenter cohorts is recommended.
Conclusion
AIDME presents an innovative approach to DME classification that incorporates both quantitative and qualitative OCT-derived parameters. Its implementation can facilitate more precise patient stratification, optimization of therapeutic decision making, and prognosis prediction. Integrating OCT assessments, systemic health factors, and advanced technology in imaging and artificial intelligence are steering us toward precision and personalized medicine in the management of diabetic macular edema.
Data Sharing Statement
The datasets generated or analyzed during the current study are not publicly available but are available from the corresponding author upon reasonable request.
Statement of Ethics
This study was performed in accordance with the Declaration of Helsinki. This human study was approved by Ethics Committee for Drug Research at the Canary Islands University Hospital Complex - approval: CHUNSC_2024_14.
Acknowledgment
This abstract of the paper has been uploaded to IOVS Journal:
Artificial Intelligence Driven Adjusted Scoring-Based Classification System for Diabetic Macular Edema (AIDME) | IOVS | ARVO Journals.
Funding
This study was funded by Roche Spain with a publication grant (SP250204008).
Disclosure
All authors declare that they have no conflicts of interest related to this research.
References
1. Teo ZL, Tham YC, Yu M, et al. Global prevalence of diabetic retinopathy and projection of burden through 2045: systematic review and meta-analysis. Ophthalmology. 2021;128(11):1580–12. doi:10.1016/j.ophtha.2021.04.027
2. Early Treatment Diabetic Retinopathy Study Research Group. Photocoagulation for diabetic macular edema. ETDRS report number 1. Arch Ophthalmol. 1985;103(12):1796–1806.
3. Thomas BJ, Shienbaum G, Boyer DS, Flynn HW. Evolving strategies in the management of diabetic macular edema: clinical trials and current management. Can J Ophthalmol. 2013;48(1):22–30. doi:10.1016/j.jcjo.2012.11.012
4. Panozzo G, Gusson E, Parolini B, Mercanti A. Diabetic macular edema: an OCT-based classification. Semin Ophthalmol. 2004;19(1–2):13–20. doi:10.1080/08820530490519934
5. Schmidt-Erfurth U, Garcia-Arumi J, Bandello F, et al. Guidelines for the management of diabetic macular edema by the European Society of Retina Specialists (EURETINA). Ophthalmologica. 2017;237(4):185–222. doi:10.1159/000458539
6. Panozzo G, Cicinelli MV, Augustin A, et al. An optical coherence tomography-based grading of diabetic maculopathy proposed by an international expert panel: the European School for Advanced Studies in Ophthalmology classification. Eur J Ophthalmol. 2020;30(1):8–18. doi:10.1177/1120672119880394
7. Bogunovic H, Venhuizen FG, Klimscha S, et al. Retinal biomarker discovery using artificial intelligence in the context of diabetic macular edema. Ophthalmology. 2020;127(4):482–490.
8. Kurmann T, Yu S, Márquez-Neila P, et al. Expert-level automated Biomarker identification in optical coherence tomography scans. Sci Rep. 2019;9:13605. doi:10.1038/s41598-019-49740-7
9. Lim JI, Rachitskaya AV, Hallak JA, et al. Artificial intelligence for retinal diseases. Asia Pac J Ophthalmol. 2024;13(4):100096. doi:10.1016/j.apjo.2024.100096
10. Santos-Oliveira J, Miranda M, Mendonça AM, et al. Human versus artificial intelligence: validation of a deep learning model for retinal layer and fluid segmentation in OCT images from patients with age-related macular degeneration. Acta Ophthalmol. 2024. doi:10.1111/aos.17385
11. Sorrentino FS, Zeppieri M, Culiersi C, et al. Application of artificial intelligence models to predict the onset or recurrence of neovascular age-related macular degeneration. Pharmaceuticals. 2024;17:1440. doi:10.3390/ph17111440
12. Ikotun AM, Ezugwu AE, Abualigah L, et al. K-means clustering algorithms: a comprehensive review, variants analysis, and advances in the era of big data. Inf Sci. 2023;622:178–210. doi:10.1016/j.ins.2022.11.139
13. Naeem S, Ali A, Anam S, Ahmed MM. An unsupervised machine learning algorithms: comprehensive review. Int J Comput Digit Syst. 2023;13(1). doi:10.12785/ijcds/130172
14. Nussenblatt RB, Kaufman SC, Palestine AG, Davis MD, Ferris FL. Macular thickening and visual acuity: measurements in patients with cystoid macular edema. Ophthalmology. 1987;94(9):1134–1139. doi:10.1016/S0161-6420(87)33314-7
15. Islam F, Ashraf M, Zafar S, et al. Retinal thickness and visual acuity in diabetic macular edema: an optical coherence tomography-based study. J Coll Physicians Surg Pak. 2016;26(7):00.
16. Solé González L, Abreu González R, Alonso Plasencia M, Abreu Reyes P. Espesor y volumen macular normal, mediante tomografía de coherencia óptica de dominio espectral, en nuestra población de referencia. Arch Soc Esp Oftalmol. 2013;88(9):352–358. doi:10.1016/j.oftal.2013.01.005
17. Korobelnik JF, Lu C, Katz TA, et al. Effect of baseline subretinal fluid on treatment outcomes in VIVID-DME and Vista-DME studies. Ophthalmol Retina. 2019;3(7):663–669. doi:10.1016/j.oret.2019.03.015
18. Shrivastava N, Som V, Kumar K. Study of imaging biomarkers as a prognostic factor and guide in the management of diabetic macular oedema. Cureus. 2024;16(11):e73765. doi:10.7759/cureus.73765
19. Sun JK, Lin MM, Lammer J, et al. Disorganization of the retinal inner layers as a predictor of visual acuity in eyes with center-involved diabetic macular edema. JAMA Ophthalmol. 2014;132(11):1309–1316. doi:10.1001/jamaophthalmol.2014.2350
20. Gabriel S, Aljundi W, Munteanu C, et al. Impact of pachychoroid and DRIL on the treatment of diabetic macular oedema with intravitreal bevacizumab. Klin Monbl Augenheilkd. 2024;242(10):1008–1015. doi:10.1055/a-2231-6479
21. Ricardi F, Reccalenda I, Boscia G, et al. Retinal OCT biomarkers associated with reading performance in patients with persistent vs. resolved diabetic macular edema. Eur J Ophthalmol. 2025;35(1):283–289. doi:10.1177/11206721241248682
22. Wu F, Phone A, Lamy R, et al. Correlation of aqueous, vitreous, and plasma cytokine levels in patients with proliferative diabetic retinopathy. Invest Ophthalmol Vis Sci. 2020;61(2):1–3. doi:10.1167/iovs.61.2.26
23. Karaküçük Y, Okudan S. The effects of epiretinal membrane on the treatment of diabetic macular edema with intravitreal ranibizumab. Haydarpasa Numune Med J. 2020;60(3):215–220.
24. Namba R, Kaneko H, Suzumura A, et al. In vitro epiretinal membrane model and antibody permeability: relationship with Anti-VEGF resistance in diabetic macular edema. Invest Ophthalmol Vis Sci. 2019;60(8):2942–2949. doi:10.1167/iovs.19-26788
25. Kimura S, Morizane Y, Toshima S, et al. Efficacy of vitrectomy and inner limiting membrane peeling in age-related macular degeneration resistant to anti-vascular endothelial growth factor therapy, with vitreomacular traction or epiretinal membrane. Graefes Arch Clin Exp Ophthalmol. 2016;254(9):1731–1736. doi:10.1007/s00417-016-3314-1
26. Wilkinson CP, Ferris FL, Klein RE, et al. Proposed international clinical diabetic retinopathy and diabetic macular edema disease severity scales. Ophthalmology. 2003;110(9):1677–1682. doi:10.1016/S0161-6420(03)00475-5
27. Early Treatment Diabetic Retinopathy Study Research Group. Focal photocoagulation treatment of diabetic macular edema. Relationship of treatment effect to fluorescein angiographic and other retinal characteristics at baseline. ETDRS report no. 19Arch Ophthalmol 1995 1139 1144–1155 Archiv ophthalmol
28. Sander B, Larsen M, Engler C, et al. Diabetic macular oedema: a comparison of vitreous fluorometry, angiography, and retinopathy. Br J Ophthalmol. 2002;86(3):316–320. doi:10.1136/bjo.86.3.316
29. Dolz-Marco R, Abreu-González R, Alonso-Plasencia M, Gallego-Pinazo R. Treatment decisions in diabetic macular edema based on optical coherence tomography retinal thickness map: LET classification. Graefes Arch Clin Exp Ophthalmol. 2014;252(10):1687–1688. doi:10.1007/s00417-014-2699-y
30. Panozzo G, Cicinelli MV, Dalla Mura G, et al. Enhancing diabetic macular edema treatment outcomes: exploring the ESASO classification and structural OCT biomarkers. Ophthalmol Ther. 2024;13(5):1383–1398. doi:10.1007/s40123-024-00925-y
31. Panozzo G, Franzolin E, Giannarelli D, et al. Validation of ESASO classification of diabetic maculopathy. Eur J Ophthalmol. 2024;34(2):497–501. doi:10.1177/11206721231186649
32. Moreno-Martínez A, Blanco-Marchite C, Andres-Pretel F, et al. ESASO classification relevance in the diagnosis and evolution in diabetic macular edema patients after dexamethasone implant treatment. Graefes Arch Clin Exp Ophthalmol. 2024;262(9):2813–2821. doi:10.1007/s00417-024-06473-2
33. RetinAI. RetinAI Discovery. 2022. Available from: https://www.retinai.com/products/discovery.
34. Abràmoff MD, Lavin PT, Birch M, et al. Pivotal trial of an autonomous AI based diagnostic system for detection of diabetic retinopathy in primary care offices. NPJ Digit Med. 2018;1:39. doi:10.1038/s41746-018-0040-6
35. Bhaskaranand M, Ramachandra C, Bhat S, et al. The value of automated diabetic retinopathy screening with the EyeArt system: a study of more than 100,000 consecutive encounters from people with diabetes. Diabetes Technol Ther. 2019;21:635–643. doi:10.1089/dia.2019.0164
36. Blair JPM, Rodriguez JN, Lasagni Vitar RM, et al. Development of LuxIA, a cloud-based AI diabetic retinopathy screening tool using a single color fundus image. Transl Vis Sci Technol. 2023;12(11):38. doi:10.1167/tvst.12.11.38
37. Grzybowski A, Brona P. Analysis and comparison of two artificial intelligence diabetic retinopathy screening algorithms in a pilot study: iDx-DR and Retinalyze. J Clin Med. 2021;10:2352. doi:10.3390/jcm10112352
38. RetInSight GmbH. RetInSight. Available from: https://retinsight.com/.
39. Mai J, Schmidt-Erfurth U. Role of artificial intelligence in retinal diseases. Klin Monbl Augenheilkd. 2024;241(9):1023–1031. doi:10.1055/a-2378-6138
40. Schlegl T, Waldstein SM, Bogunovic H, et al. Fully automated detection and quantification of macular fluid in OCT using deep learning. Ophthalmology. 2018;125(4):549–558. doi:10.1016/j.ophtha.2017.10.031
41. Michl M, Neschi M, Kaider A, et al. A systematic evaluation of human expert agreement on optical coherence tomography biomarkers using multiple devices. Eye. 2023;37(12):2573–2579. doi:10.1038/s41433-022-02376-w
42. Stino H, Birner K, Hinterhuber L, et al. Influence of OCT biomarkers on microperimetry intra- and interdevice repeatability in diabetic macular edema. Sci Rep. 2024;14(1):23342. doi:10.1038/s41598-024-74230-w
43. Midena E, Lupidi M, Toto L, et al. AI-Assisted OCT clinical phenotypes of diabetic macular edema: a large cohort clustering study. J Clin Med. 2025;14(22):7893. doi:10.3390/jcm14227893
 © 2026 The Author(s). This work is published and licensed by Dove Medical Press Limited. The
full terms of this license are available at https://www.dovepress.com/terms
and incorporate the Creative Commons Attribution
- Non Commercial (unported, 4.0) License.
By accessing the work you hereby accept the Terms. Non-commercial uses of the work are permitted
without any further permission from Dove Medical Press Limited, provided the work is properly
attributed. For permission for commercial use of this work, please see paragraphs 4.2 and 5 of our Terms.
© 2026 The Author(s). This work is published and licensed by Dove Medical Press Limited. The
full terms of this license are available at https://www.dovepress.com/terms
and incorporate the Creative Commons Attribution
- Non Commercial (unported, 4.0) License.
By accessing the work you hereby accept the Terms. Non-commercial uses of the work are permitted
without any further permission from Dove Medical Press Limited, provided the work is properly
attributed. For permission for commercial use of this work, please see paragraphs 4.2 and 5 of our Terms.
Recommended articles
Effectiveness of Suprachoroidal Injection of Triamcinolone Acetonide in Resistant Diabetic Macular Edema Using a Modified Microneedle

Nawar AE
Clinical Ophthalmology 2022, 16:3821-3831
Published Date: 21 November 2022
Serum Apolipoprotein B and B/A1 Ratio as Early Negative Biomarkers for OCT- and OCTA-Detected Retinal Changes in Diabetic Macular Edema
Soedarman S, Julia M, Gondhowiardjo TD, Kurnia KH, Prasetya ADB, Triyoga IF, Sasongko MB
Clinical Ophthalmology 2025, 19:2165-2178
Published Date: 9 July 2025
The Role of Artificial Intelligence and Radiomics in the Management of Lymphomas by PET/CT: The Clairvoyance in Clinic
Duan CL, An L, Yang YF, Yuan L, Zhu Y, Han Q, Ma H, Zhao F, Yu QQ
Cancer Management and Research 2025, 17:1457-1475
Published Date: 19 July 2025
Analysis of OCT-Based Biomarkers and Recurrence in Eyes with Diabetic Macular Edema Following Anti-VEGF Therapy
Zhu T, Wang Y, Hua Y, Zha X, Xu T
International Journal of General Medicine 2025, 18:6941-6948
Published Date: 13 November 2025
PAIR: Evaluating the Limits of Agreement Among Non-Retinal Specialist Using PathFinder Artificial Intelligence Tool for Retinal Disease Referrals: A Prospective Observational Study
Fong KC, Wong WJ, Samsudin A, Ganasan DK, Goh WN, Tai JY, Fong SN, Cheong CY, Rajamanickam G, Shunmugam M
Clinical Ophthalmology 2026, 20:584717
Published Date: 7 March 2026