Back to Journals » Clinical Ophthalmology » Volume 17
Vitreoretinal Specialist Use of Ancillary Testing: An IRIS® Registry Analysis
Authors Vishwakarma S, Borkar DS, LaPrise A, Mbagwu M, Leng T ![]()
Received 1 August 2023
Accepted for publication 11 October 2023
Published 18 October 2023 Volume 2023:17 Pages 3077—3085
DOI https://doi.org/10.2147/OPTH.S433338
Checked for plagiarism Yes
Review by Single anonymous peer review
Peer reviewer comments 2
Editor who approved publication: Dr Scott Fraser
Saloni Vishwakarma,1 Durga S Borkar,2 Andrew LaPrise,1 Michael Mbagwu,1 Theodore Leng3
1Quantitative Sciences Department, Verana Health, San Francisco, CA, USA; 2Ophthalmology Department, Duke University Eye Center, Duke University School of Medicine, Durham, NC, USA; 3Ophthalmology Department, Byers Eye Institute at Stanford, Stanford University School of Medicine, Palo Alto, CA, USA
Correspondence: Theodore Leng, Byers Eye Institute, Stanford University School of Medicine, 2452 Watson Court, Palo Alto, CA, 94303, USA, Tel +1 (650) 498 4262, Fax +1 (888) 565-2640, Email [email protected]
Purpose: To investigate patterns of ancillary imaging testing among vitreoretinal specialists for patients with vitreoretinal disease in the United States (US).
Methods: Optical coherence tomography (OCT), color fundus photography (CFP), and fluorescein angiography (FA), ordered by vitreoretinal specialists and documented within the American Academy of Ophthalmology IRIS® Registry (Intelligent Research in Sight) between 01 January 2018 and 31 December 2020, were retrospectively assessed. Trends in imaging modality choice were analyzed by payer type, geographic region, and practice type. Sub-analyses were conducted according to categorization of vitreoretinal specialists into those treating a high versus low volume of patients with neovascular age-related macular degeneration (nAMD).
Results: OCT was the most common imaging modality used, followed by CFP and FA. Following normalization, the highest volume of OCT procedures performed were identified among Medicare Advantage and Medicare Fee-for-Service beneficiaries, within the South of the US, and at medium and large practices. Minimal differences were observed for CFP and FA volume across payer types and regions. Across practice types, the largest volume of CFP and FA procedures were identified in small and private equity owned practices, respectively. Vitreoretinal specialists with a high nAMD volume more frequently performed OCT than those with a low nAMD volume.
Conclusion: Vitreoretinal specialists demonstrated a strong preference for OCT, with real-world associations according to payer type, geographic location, and practice type. Volume of nAMD patients seen impacted the likelihood of specialists ordering OCTs.
Plain Language Summary: Optical coherence tomography (OCT), color fundus photography (CFP), and fluorescein angiography (FA) are key imaging modalities used by vitreoretinal specialists in routine eye care. This study aimed to uncover patterns of OCT, CFP, and FA usage in the United States from 2018 to 2020, and investigated the impact of volume of patients with neovascular age-related macular degeneration on these trends. Higher rates of OCT use, compared with CFP and FA, were identified in the US.
Keywords: color fundus photography, fluorescein angiography, optical coherence tomography, retinal disease, vitreoretinal disease
Introduction
Since optical coherence tomography (OCT) was introduced into clinical practice, the usage patterns of ancillary imaging tests, in vitreoretinal specialists’ offices have shifted dramatically.1 As an evolving, rapid, and non-invasive technique of high-resolution retinal imaging with devices from multiple commercial manufacturers available, the use of OCT has increased steadily over the last three decades, coinciding with a decline in traditional techniques such as color fundus photography (CFP) and fluorescein angiography (FA).2–4 The recent American Academy of Ophthalmology (Academy) Preferred Practice Pattern® guidelines highlight the advancing and important clinical role of OCT for effectively visualizing and quantitatively assessing vascular and capillary-level structural abnormalities and conditions such as diabetic retinopathy (DR), retinal/ophthalmic occlusions, and retinal/ophthalmic neovascularization.5–8 Indeed, studies have indicated that OCT has surpassed the more invasive CFP and FA modalities in certain regions in the United States (US) as a key management tool for sight-threatening conditions such as neovascular age-related macular degeneration (nAMD).2 Furthermore, OCT is generally well accepted tolerated among patients during follow-up treatment for nAMD due to its non-invasive nature.6
Current clinical usage of OCT, CFP, and FA, however, is unclear due to a paucity of recent or inclusive clinical studies investigating eye care trends. Available data primarily addresses eye care within specific population subgroups, such as Medicare Fee-for-Service and Medicaid Services beneficiaries or those located within a single institution, which may not reflect the general population.2,3,9 Systematic analyses of recent imaging trends using larger and more-inclusive real-world data sets are thus imperative to elucidate current healthcare delivery practices and to optimize application of imaging data.
The Academy IRIS® Registry (Intelligent Research in Sight) is the largest electronic health record (EHR)-based registry of eye disease and conditions within the US that represents over 70% of all ophthalmology clinic visits in the country.10 Moreover, the IRIS Registry contains demographic and geographic distributions consistent with that of the entire population. This study aimed to investigate patterns of ancillary imaging modalities ordered by vitreoretinal specialists within the IRIS Registry and to assess recent trends according to patient payer type, geographic region, and practice type.
Methods
Study Design and Study Outcomes
This was a retrospective, observational analysis of ancillary imaging testing procedures (OCT, FA, and CFP) ordered by vitreoretinal specialists for patients with vitreoretinal disease during the three-year study period (January 01, 2018, and December 31, 2020). Vitreoretinal diseases included AMD, DR, diabetic macular edema (DME), and retinal vein occlusion (RVO). De-identified data were extracted from the IRIS Registry and used to describe the volume of ancillary testing. The primary outcome of this study was to investigate trends in ancillary image testing procedures ordered by vitreoretinal specialists according to patient payer type, geographic region, and practice type. This study also investigated trends in OCT selection by vitreoretinal specialists who treated a high volume of patients with nAMD versus those who treated a low volume of patients with nAMD.
Data Collection
Patient payer type, geographical region, and practice type were collected on the index date, defined as the date on which the ancillary test was ordered. Current Procedural Terminology (CPT) coding was used to identify ancillary testing procedures documented in the IRIS Registry during the study period (Supplemental Table S1). Self-identified vitreoretinal specialists were identified by National Provider Identifier (NPI) number. Procedures ordered by vitreoretinal specialists were determined by International Classification of Diseases (ICD) coding. Procedures were not considered exclusively; among any individual patient for whom multiple procedures had been concurrently ordered, each procedure was independently included in the study analysis. Patients with nAMD were identified via ICD coding (Supplemental Table S2).
Statistical Analysis
Categorical variables were presented as frequency and percentage. Each procedure type was analyzed according to payer type (commercial, government, Medicaid, Medicare Fee-for-Service, Medicare Advantage, and military), geographic region, and practice type (small, medium, or large community practices, private equity practices, and academic medical centers [AMC]). Private equity practices were considered those owned by an investment firm. Community practices were stratified by size (small, medium, large practice size) according to natural cut-off points in the distribution of observed practice visit volumes. Vitreoretinal specialists were further categorized according to those who treated a high versus a low volume of patients with nAMD during the study period. A high volume of nAMD patients was considered ≥ 256 patients seen over the three-year study period by an individual vitreoretinal specialist.
Normalization analyses were calculated for subgroups of patients as follows: number of procedures divided by number of patients treated by vitreoretinal specialists in the IRIS Registry. Normalization of OCT procedures among high or low volume nAMD vitreoretinal specialists was calculated as follows: total OCTs performed by nAMD vitreoretinal specialists divided by the total number of nAMD vitreoretinal specialists. Chi-square testing was used to assess statistical significance. Supplemental Materials are provided in an online-assessable document.
Results
Procedures
Over the three-year study period, OCT was the most common procedure (n = 19,357,406; 76.4%), followed by CFP (n = 4,071,507; 16.1%) and FA (n = 1,894,336; 7.5%), as ordered by distinct vitreoretinal specialists (n = 1805, n = 1847, and n = 1798, respectively) (Table 1). The volume of each procedure ordered was mostly consistent across time, with a notable decrease observed in March 2020 (Figure 1).
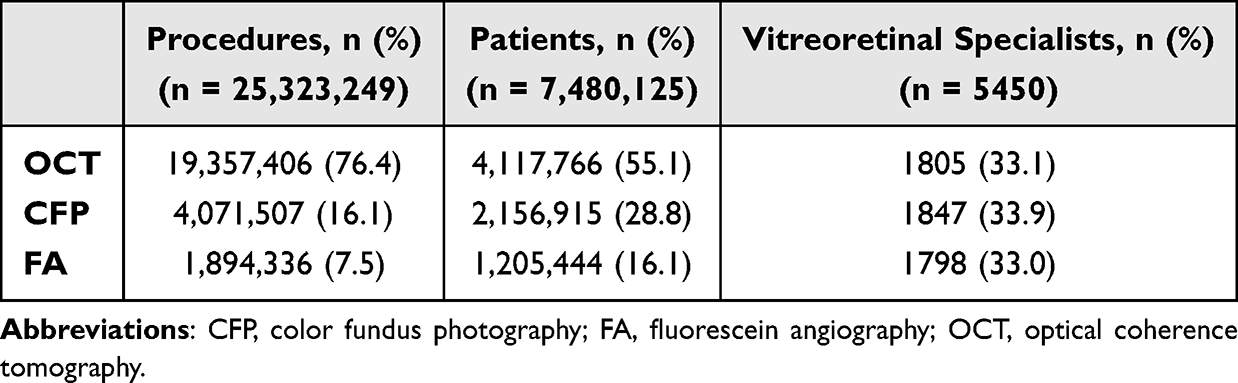 |
Table 1 Total Number of Distinct Procedures, Patients, and Vitreoretinal Specialists Over the Three-Year Study Period |
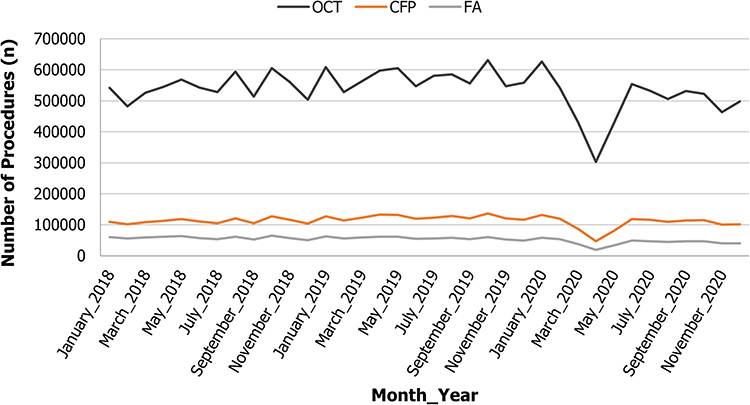 |
Figure 1 Number of imaging procedures ordered per month over the three-year study period from 2018 to 2020. Abbreviations: CFP, color fundus photography; FA, fluorescein angiography; OCT, optical coherence tomography. |
Procedures by Payer, Region, and Practice
Among patients with documented payer categorization, all three procedures were most common in the Medicare Fee-for-Service (OCT: 38.75%, CFP: 35.31%; FA: 36.50%) or Medicare Advantage (OCT: 26.23%; CFP: 21.25%; FA: 21.66%) groups. Each procedure was most prominent in the South (OCT: 38.37%; CFP: 43.69%; FA: 41.58%) and lowest in the Midwest (OCT: 20.11%; CFP: 13.52%; FA: 13.49%). Across practice types, the greatest number of each procedure was ordered at medium practices (OCT: 40.83%; CFP: 43.49%; FA: 38.28%) and the lowest volume at AMCs (Table 2).
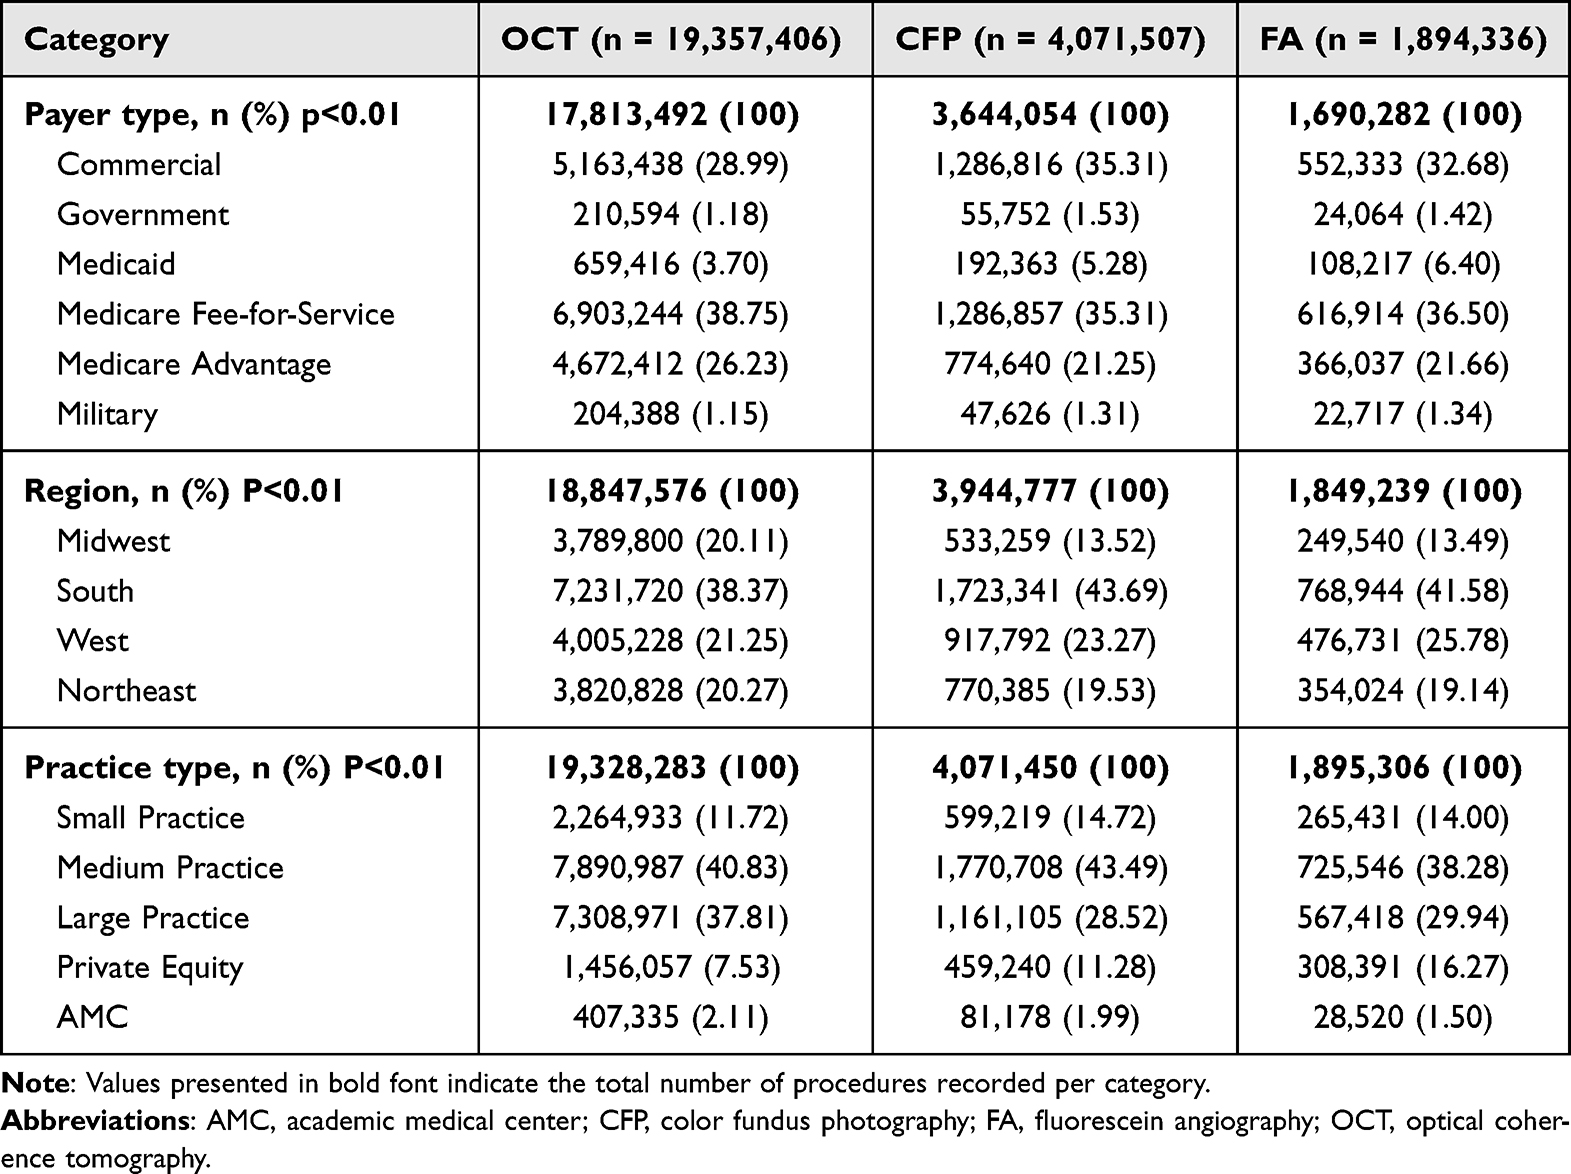 |
Table 2 Distinct Procedures Over the Three-Year Study Period |
Following normalization, the volume of OCTs ordered by vitreoretinal specialists was highest for Medicare Advantage and Medicare Fee-for-Service patient payer groups, while the volume of CFP and FA were similar across all payer groups (Figure 2A). The largest proportion of OCTs was identified in the Midwest. Further regional differences were minimal for OCT, CFP, FA (Figure 2B). OCT was most often ordered at large or medium practices, CFP at small, medium, or private equity practices, and FA at private equity practices (Figure 3C). Denominators used for data normalization are provided in Supplemental Table S3.
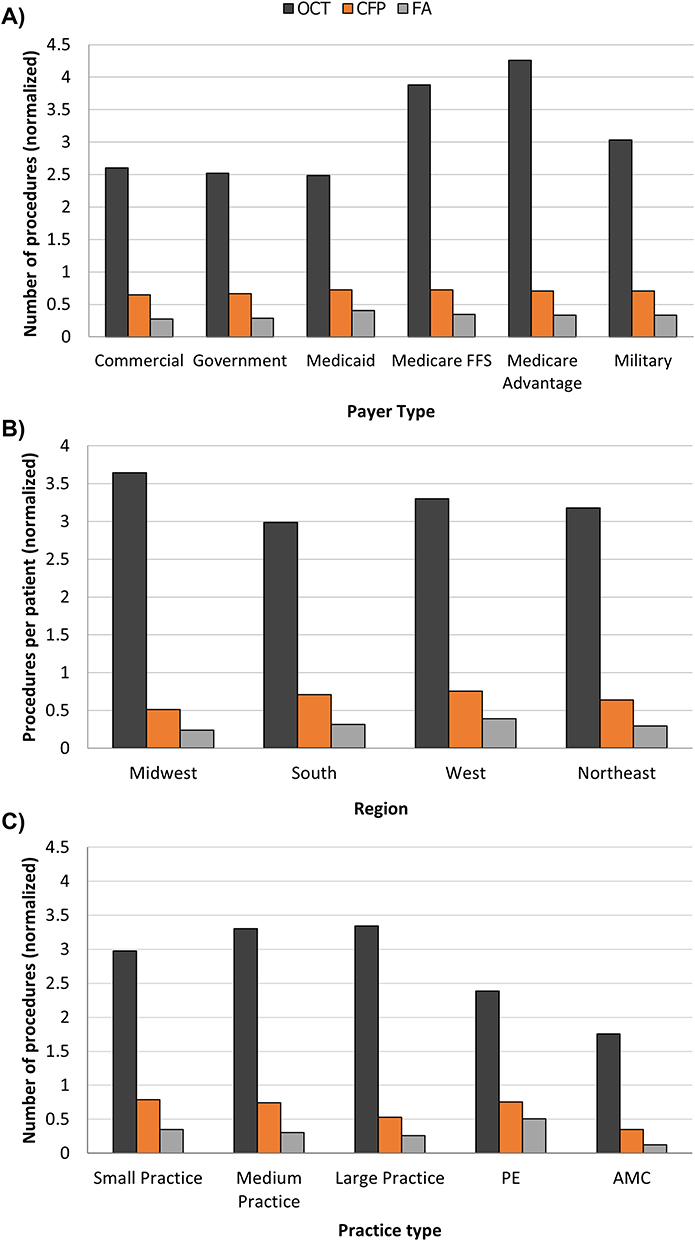 |
Figure 2 Normalized number of ancillary imaging tests per patient according to (A) payer type, (B) region, and (C) practice types during the study period from 2018 to 2020. Abbreviations: AMC, academic medical center; CFP, color fundus photography; FA, fluorescein angiography; FFS, fee-for-service; OCT, optical coherence tomography; PE, private equity. |
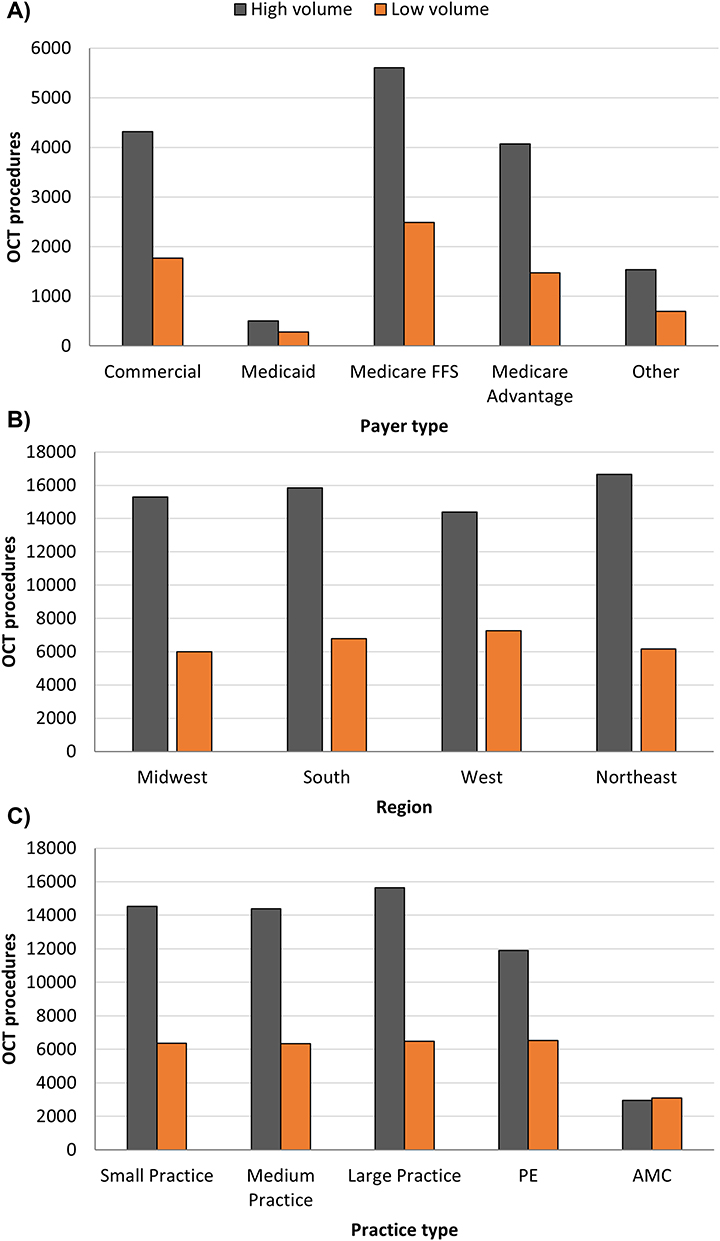 |
Figure 3 Normalized number of OCT procedures ordered by vitreoretinal specialists who saw a high volume versus a low volume of nAMD patients by (A) payer type, (B) region, and (C) practice type. Abbreviations: AMC, academic medical center; nAMD, neovascular age-related macular degeneration; CFP, color fundus photography; FA, fluorescein angiography; OCT, optical coherence tomography; PE, private equity. |
Vitreoretinal Specialists Treating a High versus Low Volume of Patients with nAMD
A total of 1072 and 848 vitreoretinal specialists saw a low and high volume of nAMD patients during the study period, respectively. Overall, both low and high volume nAMD vitreoretinal specialists most often ordered an OCT for Medicaid (29.52% and 27.56%, respectively) and commercial (20.89% and 21.21%, respectively) payer groups. Low volume nAMD vitreoretinal specialists most often ordered OCTs at medium sized practices (40.03%), whereas high volume nAMD vitreoretinal specialists ordered a similar volume of OCTs at both medium (41.37%) and large (41.48%) practices. OCTs were most often ordered by both groups in the South (34.97% and 40.17%, respectively; Table 3).
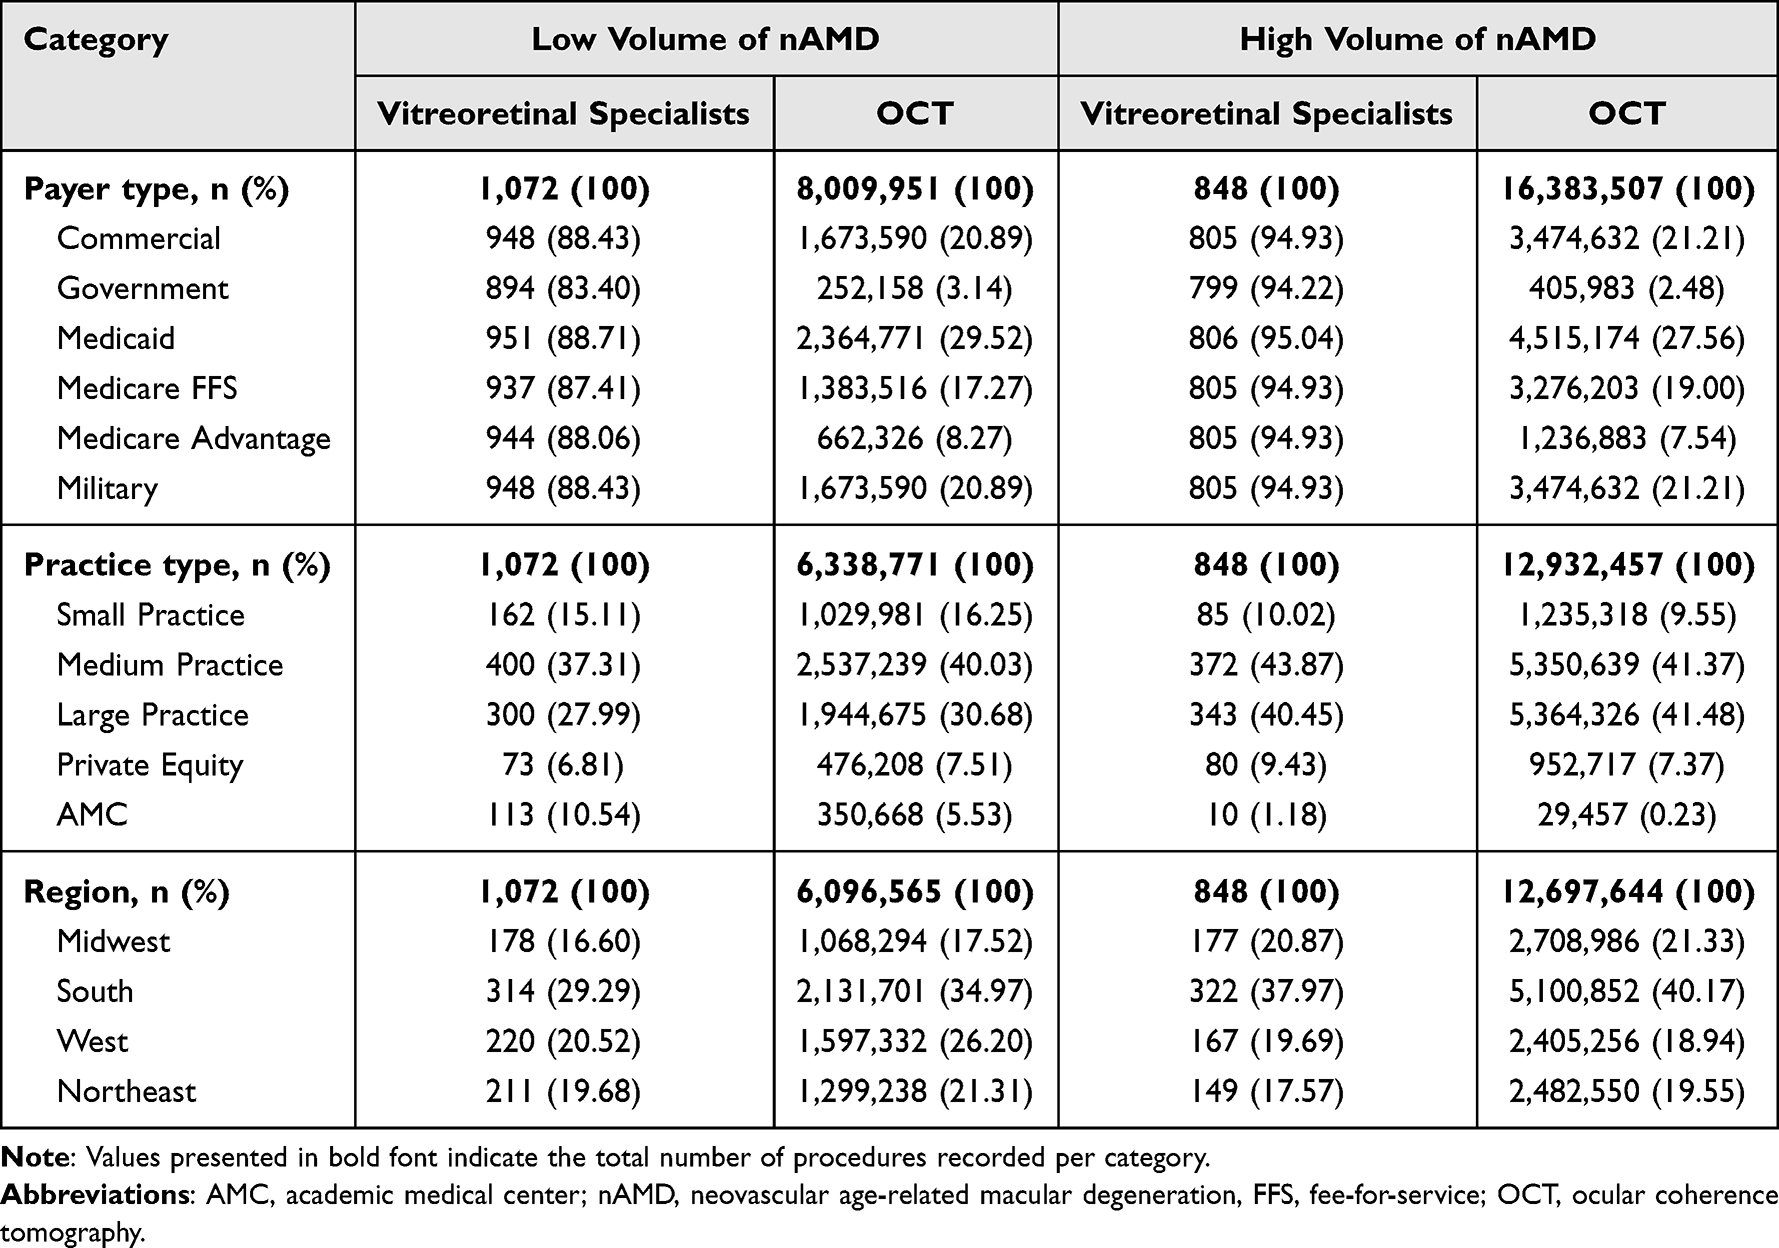 |
Table 3 Volume of Neovascular Age-Related Macular Degeneration |
Following normalization, both high and low volume nAMD vitreoretinal specialists most often order OCTs for Medicare Fee-for-Service and commercial payers (Figure 3A). High volume vitreoretinal specialists most often ordered OCTs in the Northeast, while low volume nAMD vitreoretinal specialists most often ordered OCTs in the West (Figure 3B). The number of OCTs ordered by high volume nAMD vitreoretinal specialists was similar across small, medium, and large practices, with a lower volume at private equity practices and AMCs. A similar volume of OCTs were ordered by low volume nAMD vitreoretinal specialists across small, medium, large, and private equity practices, with a lower volume ordered at AMCs (Figure 3C).
Discussion
Given the reliance of vitreoretinal specialists upon ancillary imaging testing for routine eye care and the increasing use of multimodal imaging in the management of retinal patients, identifying real-world trends of ophthalmic imaging utilization in clinical practice is an important initial step toward understanding and optimizing eye care management. With the rapid evolution of ophthalmic imaging technology over recent decades, OCT has become a primary modality of choice for the diagnosis and clinical management of retinal pathologies. Indeed, several advantages of OCT have promoted its adoption of this imaging modality above that of CFP or FA, including its non-invasive nature and the generation of diagnostic, high-resolution cross-sectional structural images. Consistent with contemporary clinical expectations,6,8 this three-year study of the IRIS Registry demonstrated a consistently higher rate of OCT usage by vitreoretinal specialists compared with the historical CFP and FA modalities, with certain regional variations noted. All imaging modalities demonstrated a decreased usage rate in March 2020, coinciding with the onset of the COVID-19 pandemic, with a return to pre-pandemic volumes observed by June 2020.
Previous analyses conducted within a Medicare Fee-for-Service population revealed OCT as the primary imaging modality of choice among vitreoretinal specialists between 2012 and 2016, with a concurrent decrease in traditional methods such as FA and CFP.3 Importantly, unlike this previous study, the current analyses confirms these trends in a population comprising of multiple insurance coverages, likely allowing findings to be more generalizable. As this study looked beyond Medicare Fee-for-Service populations, this data may also be more suitable for examining conditions prevalent in younger age groups. Similar trends were observed within the Clinformatics nationwide claims database for patients with conditions such as DME and nAMD, with a 23-fold increased use of OCT from 2001 to 2009.2 Unlike the current study however, these publications reported a steady increase in OCT over time, likely reflecting the introduction and subsequent growth of intravitreal anti-vascular endothelial growth factor (VEGF) for the treatment of nAMD in the early 2000s.11–13 Characterized by choroidal neovascularization, nAMD is a leading cause of vision loss for which anti-VEGF therapy has become the gold standard.14,15 Due to associated costs, risks, and the high clinical burden, however, OCT has become a fundamental part of monitoring anti-VEGF treatment response to allow for more cost-effective and individualized treatment practices.16,17 Thus, as the current study evaluated a more recent time period than prior studies, the growth in OCT use had likely stabilized.
Several payer, regional, and practice variations were observed within this study. Normalized rates of OCTs per patient were highest in the Midwest and lowest in the South, with inverse trends for CFP and FA, as shown previously.3 Medicare Advantage and Medicare Fee-for-Service patients received more OCTs per year than others, while those cared for in AMCs received fewer OCTs than in other practice settings. Overall, these variations may be partially attributed to differences in population demographics and clinical characteristics. According to the 2020 US Census, the largest proportion of people aged ≥ 65 years was located in the Midwest,18 potentially contributing to the high volume of patients with nAMD within this region and, thus, the use of OCT. Indeed, this study showed that vitreoretinal specialists with a high nAMD volume more often ordered OCTs per patient than those with a low nAMD volume, and those located within the Midwest were more often classified as high volume nAMD vitreoretinal specialists. Similarly, higher volumes of nAMD were observed in the Medicare Fee-for-Service population, while low volumes were identified within AMC settings, aligning with the overall rates of OCT in this study. Interestingly, the Medicaid population was least likely to receive OCTs, and will be a topic of future research. Collectively, these findings suggest that geographic location and payer type are interconnected factors contributing to real-world ancillary imaging choices; however, further research will be required to determine the underlying causes for these trends.
This study has certain limitations and strengths. While macrolevel trends are important to better understand population-based eye care, our study did not analyze patient level indications for imaging. Improvements in imaging technology and analytics, as well as the advent of newer therapeutic options will have an impact on imaging trends and evolving clinical guidelines. The IRIS Registry does not capture data for all AMCs or for non-EHR practices, and thus may not represent clinical settings external to the participating sites. Ancillary imaging tests received by the study population may also be performed with other conditions, which were not evaluated in the study. Also, OCT angiography could not accurately been considered during these analyses, due to the lack of unique CPT code. Strengths of the study include the large, national cohort of practitioners assessed within the IRIS Registry, the standardized reporting of procedures through billing documentation, and the longitudinal nature of the data.
Conclusion
This study evaluating variations in ancillary testing use documented within the Academy’s IRIS Registry demonstrated a strong preference among vitreoretinal specialists for OCT, with important associations according to payer type, geographic location, and practice type. Understanding real-world trends in ophthalmic imaging utilization is key to elucidating overall healthcare delivery patterns by vitreoretinal specialists and optimizing the clinical application of imaging data. As OCT is used for the treatment of multiple retinal diseases, future work will focus upon OCT usage patterns among additional patient subpopulations such as those with DR.
Abbreviations
AMC, academic medical center; CFP, color fundus photography; CPT, Current Procedural Terminology; EHR, electronic health records; FA, fluorescein angiography; ICD, international classification of disease; nAMD, neovascular age-related macular degeneration; OCT, optical coherence tomography; VEGF, vascular endothelial growth factor; US, United States.
Data Sharing Statement
Data from the IRIS Registry is accessible via the Academy. More information is available at https://www.aao.org/iris-registry.
Ethics Approval and Informed Consent
This study was approved by the Western Institutional Review Board-Copernicus Group (WCG® IRB). Patient consent was not required for this study due to the de-identified nature of the data extracted from the IRIS Registry.
Acknowledgments
Writing and editorial support were provided by Rebecca Watkin, PhD (CHB Wordsmith, Inc).
Funding
This research was funded in part by a National Institute of Health (NIH) grant (P30-EY026877) and was supported by the Research to Prevent Blindness non-profit organization.
Disclosure
SV, AL, and MM are employees of Verana Health. DB is a consultant for AbbVie/Allergan, Glaukos, Genentech, Iveric Bio, and Verana Health. TL reports receiving grants and contracts from Astellas, consulting fees from Alcon, Apellis, Graybug, Regeneron, Boehringer Ingelheim, Kanaph, Nanoscope Therapeutics, Protagonist Therapeutics, Roche/Genentech, and Verana Health. The authors report no other conflicts of interest in this work.
References
1. Swanson EA, Izatt JA, Hee MR, et al. In vivo retinal imaging by optical coherence tomography. Opt Lett. 1993;18(21):1864–1866. doi:10.1364/OL.18.001864
2. Schneider EW, Mruthyunjaya P, Talwar N, Harris Nwanyanwu K, Nan B, Stein JD. Reduced fluorescein angiography and fundus photography use in the management of neovascular macular degeneration and macular edema during the past decade. Invest Ophthalmol Vis Sci. 2014;55(1):542–549. doi:10.1167/iovs.13-13034
3. Wibbelsman TD, Pandit RR, Xu D, et al. Trends in Retina Specialist Imaging Utilization from 2012 to 2016 in the United States Medicare Fee-for-Service Population. Am J Ophthalmol. 2019;208:12–18. doi:10.1016/j.ajo.2019.06.026
4. Pontikos N, Wagner SK, Balaskas K, et al. Comment on: trends in Retina Specialist Imaging Utilization From 2012 to 2016 in the United States Medicare Fee-for-Service Population. Am J Ophthalmol. 2020;211:229. doi:10.1016/j.ajo.2019.09.021
5. American Academy of Ophthalmology (Academy). Retinal Vein Occlusions Preferred Practice Pattern. Elsevier Inc; 2019.
6. American Academy of Ophthalmology (Academy). Age-Related Macular Degeneration Preferred Practice Pattern. Elsevier Inc; 2019.
7. American Academy of Ophthalmology (Academy). Retinal and Ophthalmic Artery Occlusions Preferred Practice Pattern. Elsevier Inc; 2019.
8. American Academy of Ophthalmology (Academy). Diabetic Retinopathy Preferred Practice Pattern. Elsevier Inc; 2019.
9. Ho AC, Wibbelsman TD, Pandit RR, Xu D. Trends in Ophthalmic Imaging: implications and Outlook. Am J Ophthalmol. 2020;210:1–2. doi:10.1016/j.ajo.2019.10.008
10. American Academy of Ophthalmology (Academy). IRIS Registry. Available from: https://www.aao.org/iris-registry.
11. Parikh R, Ross JS, Sangaralingham LR, Adelman RA, Shah ND, Barkmeier AJ. Trends of Anti-Vascular Endothelial Growth Factor Use in Ophthalmology Among Privately Insured and Medicare Advantage Patients. Ophthal. 2017;124(3):352–358. doi:10.1016/j.ophtha.2016.10.036
12. Gragoudas ES, Adamis AP, Cunningham ET, Feinsod M, Guyer DR; Group VISiONCT. Pegaptanib for neovascular age-related macular degeneration. New Engl J Med. 2004;351(27):2805–2816. doi:10.1056/NEJMoa042760
13. Rosenfeld PJ, Brown DM, Heier JS, et al. Ranibizumab for neovascular age-related macular degeneration. N Engl J Med. 2006;355(14):1419–1431. doi:10.1056/NEJMoa054481
14. Khanna S, Komati R, Eichenbaum DA, Hariprasad I, Ciulla TA, Hariprasad SM. Current and upcoming anti-VEGF therapies and dosing strategies for the treatment of neovascular AMD: a comparative review. BMJ Open Ophthalmol. 2019;4(1):e000398. doi:10.1136/bmjophth-2019-000398
15. Rein DB, Wittenborn JS, Burke-Conte Z, et al. Prevalence of Age-Related Macular Degeneration in the US in 2019. JAMA Ophthalmol. 2022;140(12):1202–1208. doi:10.1001/jamaophthalmol.2022.4401
16. Pron G. Optical Coherence Tomography Monitoring Strategies for A-VEGF-Treated Age-Related Macular Degeneration: an Evidence-Based Analysis. Ont Health Technol Assess Ser. 2014;14(10):1–64.
17. Windsor MA, Sun SJJ, Frick KD, Swanson EA, Rosenfeld PJ, Huang D. Estimating Public and Patient Savings From Basic Research-A Study of Optical Coherence Tomography in Managing Antiangiogenic Therapy. Am J Ophthalmol. 2018;185:115–122. doi:10.1016/j.ajo.2017.09.027
18. Bureau USC. 2020 United States Census; 2019
 © 2023 The Author(s). This work is published and licensed by Dove Medical Press Limited. The
full terms of this license are available at https://www.dovepress.com/terms
and incorporate the Creative Commons Attribution
- Non Commercial (unported, 3.0) License.
By accessing the work you hereby accept the Terms. Non-commercial uses of the work are permitted
without any further permission from Dove Medical Press Limited, provided the work is properly
attributed. For permission for commercial use of this work, please see paragraphs 4.2 and 5 of our Terms.
© 2023 The Author(s). This work is published and licensed by Dove Medical Press Limited. The
full terms of this license are available at https://www.dovepress.com/terms
and incorporate the Creative Commons Attribution
- Non Commercial (unported, 3.0) License.
By accessing the work you hereby accept the Terms. Non-commercial uses of the work are permitted
without any further permission from Dove Medical Press Limited, provided the work is properly
attributed. For permission for commercial use of this work, please see paragraphs 4.2 and 5 of our Terms.