")
Back to Journals » International Journal of General Medicine » Volume 16
Prevalence of Obesity in Newly Onset Diabetes Mellitus and Its Relationship with Uric Acid: An Indian Cross-Sectional Study
Authors Singh SK , Singh R, Singh SK, Iquebal MA, Jaiswal S, Rai PK
Received 22 January 2023
Accepted for publication 13 March 2023
Published 6 April 2023 Volume 2023:16 Pages 1217—1226
DOI https://doi.org/10.2147/IJGM.S402683
Checked for plagiarism Yes
Review by Single anonymous peer review
Peer reviewer comments 3
Editor who approved publication: Dr Scott Fraser
Shailendra Kumar Singh,1 Rina Singh,1 Santosh Kumar Singh,2 Mir Asif Iquebal,3 Sarika Jaiswal,3 Pradeep Kumar Rai4
1Department of Endocrine, Endocrine Clinic, Varanasi, Uttar Pradesh, India; 2Department of Endocrinology, Endocrine Center, Patna, Bihar, India; 3Division of Agriculture Bioinformatics, ICAR-IASRI, New Delhi, India; 4Department of Nephrology, Opal Hospital, Varanasi, Uttar Pradesh, India
Correspondence: Shailendra Kumar Singh, Department of Endocrine, Endocrine Clinic, Varanasi, Uttar Pradesh, India, Email [email protected]
Introduction: Prevalence of obesity is high in diabetes mellitus (DM) and is associated with hyperuricemia (HU), hypertension, metabolic syndrome, cardiovascular disease and dyslipidemia. In obesity, elevated serum uric acid (SUA) has been shown to be associated in many studies from different countries, but data from India are lacking. The aim of the present study is to know the prevalence of obesity and to know the relationship between obesity and SUA in newly onset DM.
Methods: In this cross-sectional study from India, 402 consecutive newly onset diabetic patients (male: 284; female: 118) were enrolled. All patients were grouped into four based on BMI (body mass index): underweight (< 18.5 kg/m2), normal weight (18.5– 23 kg/m2), overweight (> 23-27.5 kg/m2), and obese (> 27.5 kg/m2). All participants were grouped into four quartiles based on SUA (Q1: < 4.23; Q2: ≥ 4.24– 5.19; Q3: ≥ 5.20– 6.16; Q4: > 6.16).
Results: The mean age, BMI and SUA of the participants were 46.20± 0.52 years, 26.35± 0.21 kg/m2 and 5.24± 0.007 mg/dl, respectively. Overall prevalence of generalized obesity, central obesity and hyperuricemia (HU) were 35.07%, 85.82% and 13.43%, respectively. The prevalence of generalized obesity increased across the SUA quartile. A multinomial logistic regression analysis showed that serum uric acid level was independently associated with generalized obesity (p< 0.001).
Conclusion: This first report from India shows a significant positive association between SUA and generalized obesity among newly onset DM. Therefore, routine estimation of SUA is recommended in newly onset DM to prevent and treat HU and its related complications.
Keywords: newly onset, diabetes mellitus, hyperuricemia, obesity, association
Introduction
Obesity is defined as excess and unhealthy body fat mass in a person and is a modifiable risk factor for various diseases. Prevalence of obesity is increasing in India and worldwide.1 According to an ICMR-INDIAB-3 (Indian Council of Medical Research – INdia DIABetes) study, prevalence of generalized obesity (GO), abdominal obesity (AO) and combined obesity (CO) from different parts of India varies from 11.8–31.3%, 16.9–36.1% and 9.8–26.6%, respectively.2 If this is extrapolated to the whole Indian population, 135, 153 and 107 million Indians will have GO, AO and CO, respectively in 2015. In America during 2011–2014 more than one third (36.5%) of the population were obese.3 If the rising trend in obesity continues like this, by 2030, 86.5% of adults will be either overweight or obese and by 2048, all Americans would be either overweight or obese.4 Prevalence of obesity is 2–4 times more in diabetes mellitus as compared with the non-diabetic population. In a study by Daousi et al, 86% of type 2 DM were either overweight or obese and 52% were obese.5 Reasons for high prevalence of obesity are many, such as increase in calorie intake, altered composition of diet, low level of physical activity and altered gut micro biome.6–9 Nowadays obesity and its complications such as diabetes mellitus (DM), hyperuricemia (HU), hypertension and cardiovascular disease (CVD) have emerged as a serious concern for public health and put a substantial economic burden on society.10–12 According to one estimate an obese person has to pay 42% more in health-care costs as compared with a person of normal weight.13
Uric acid is an end product of purine metabolism. When serum uric acid (SUA) is more than 7 mg/dl in male and 6 mg/dl in female, it is defined as hyperuricemia (HU).14 Prevalence of HU is increasing and this is due to rising prevalence of obesity, consumption of food rich in purines and alcohol.15,16 Several epidemiological and cross-sectional studies indicated that high SUA is associated with hypertension, DM, obesity, metabolic syndrome, dyslipidemia, liver dysfunction, CVD and chronic kidney disease.17–25 In the past few decades, the relationship between SUA and obesity has received widespread attention. But it is debatable, whether high SUA is a risk factor for development of obesity or is a marker of obesity.22,26–29 Many argue that both originate from common soil, such as a high fructose diet, which causes development of both obesity and hyperuricemia simultaneously.30 Masuo et al in their study have shown that high SUA at baseline is predictive of weight gain and blood pressure in non-obese, normotensive, Japanese men.29 This suggests that high SUA might be a risk factor for development of obesity. Thus if we can reduce SUA by lifestyle modification or drugs (SGLT-2 inhibitors31 or uric acid lowering drugs), we can prevent development of obesity and thus CVD. No study till now has been performed from the eastern part of Uttar Pradesh (India) to show the association between obesity and SUA in newly onset DM patients. Furthermore, level of SUA and prevalence of obesity varies among different populations due to differences in lifestyle and genetics. Thus we aimed to investigate the relationship between obesity and SUA in newly onset DM patients from this part of India. Further our aim is to know the prevalence of obesity in these diabetic patients.
Materials and Methods
This is a cross-sectional single center study covering patients from the Indo-Gangetic Plains of the eastern part of Uttar Pradesh (India), which was conducted between May 2021 and June 2022. A total of 402 (male: 284; female: 118) consecutive patients with newly onset (less than 1 year duration) DM were enrolled. Patients with symptom and history of cardiac, hepatic diseases, pregnant women, drug addicts and those on antihyperuricemic drugs were excluded from the study. Hypertensive patients who were either on amlodipine or telmisartan or both were only included in this study as they do not alter the SUA. Criteria for diagnosis of DM (FPG ≥126 mg/dl; PPG ≥200 mg/dl) was based on American Diabetes Association (ADA) 2018.32 A trained health technician collected anthropometric data in a defined format. Data regarding sex, age, weight, height, BP (blood pressure), BMI (body mass index), waist circumference (WC), uric acid, A1c (glycated hemoglobin A1c), lipid profile, eGFR (glomerular filtration rate) and vitamin D were collected. Weight was measured by standard weighing machine. BMI was calculated by dividing weight (kg) by square of height (in meter). Height was measured with head kept in Frankfort position. For measurement of BP, digital BP machine was used.
Nine mL blood was drawn from patients in morning after overnight fast for fasting plasma glucose (FPG), creatinine, A1c, vitamin D (Vit D), SUA and lipid profile. Glucose oxidase method was used for estimation of FPG. Vitamin D was analyzed on Siemens ADVIA centaur, standardized against ID-LC/ME/MS, as per vitamin D standardization (Thyrocare). SUA, creatinine and lipid profile were estimated by standard enzymatic procedure. Thyrocare Technologies Limited, Mumbai, India, analyzed biochemistry. Ultrasonography was done in suspected cases to rule out liver diseases.
Hyperuricemia was defined as SUA level >6 mg/dl in women and >7 mg/dl in men.14 All participants were grouped into four quartiles based on SUA (Q1: <4.23; Q2: ≥4.24–5.19; Q3: ≥5.20–6.16; Q4: >6.16). We categorized study population in 4 groups based on BMI: underweight (<18.5 kg/m2), normal weight (18.5–23 kg/m2), overweight (>23–27.5 kg/m2) and obese (>27.5 kg/m2). Central obesity was defined as WC ≥80 cm in women and ≥90 cm in men.33 GO34 was diagnosed when BMI >27.5 kg/m2.
Ethical Statement
The Ethics Committee for research, Opal Hospital, Varanasi, India, approved the study. This study was also conducted using good clinical practice following the Declaration of Helsinki. All patients gave informed consent before inclusion in the study.
Statistical Analysis
Statistical analysis of data was carried out using SPSS software ver. 26.0. Categorical variables of data were compared by chi-square test. Pearson’s correlation coefficient test was used to assess the interrelationships between obesity variables and SUA levels. To determine the differences for variables among the groups, one-way ANOVA test was used. Box plot was used for showing the level of SUA in different BMI categories. The relationship between SUA and obesity was evaluated by logistic regression modeling. In Model-1, age and sex were adjusted and in Model-2 age, sex, BMI, TG and WC were adjusted. In Model-3 age, sex, BMI, TG, WC, GFR, A1c, Vit D and cholesterol were adjusted. Statistical significance was defined as p value <0.05.
Results
Baseline and Demographic Characteristics of the Study Population
Baseline characteristics of newly onset diabetes patients are summarized in Table 1. Mean± SD age of the study population was 46.20±10.53 years with no significant age difference between male and female groups (p <0.536). The mean ±SD value of BMI was (26.35±4.27 kg/m2), A1c (9.73±2.55%), Vit D (18.35±9.78 ng/mL), WC (97.20±9.34 cm), SBP (129.46±18.11 mm/Hg), DBP (84.58±10.77 mm/Hg), eGFR (108.96±16.25 mL/min/1.73m2) and TC (total cholesterol) (183.53±16.24 mg/dl), with no significant difference between male and female subjects. Mean ±SD value of TG was (193.25±109.85 mg/dl), HDL (41.34±9.33 mg/dl), SUA (5.24±1.43 mg/dl) and LDL (111.18±36.75 mg/dl). Levels of TG (p <0.044) and SUA (p <0.000) were significantly higher in men as compared with women while level of HDL (p <0.000) and LDL (p <0.023) were significantly higher in women as compared with men. Prevalence of HU was 13.43%, 13.73% and 12.71% in all, male and female patients.
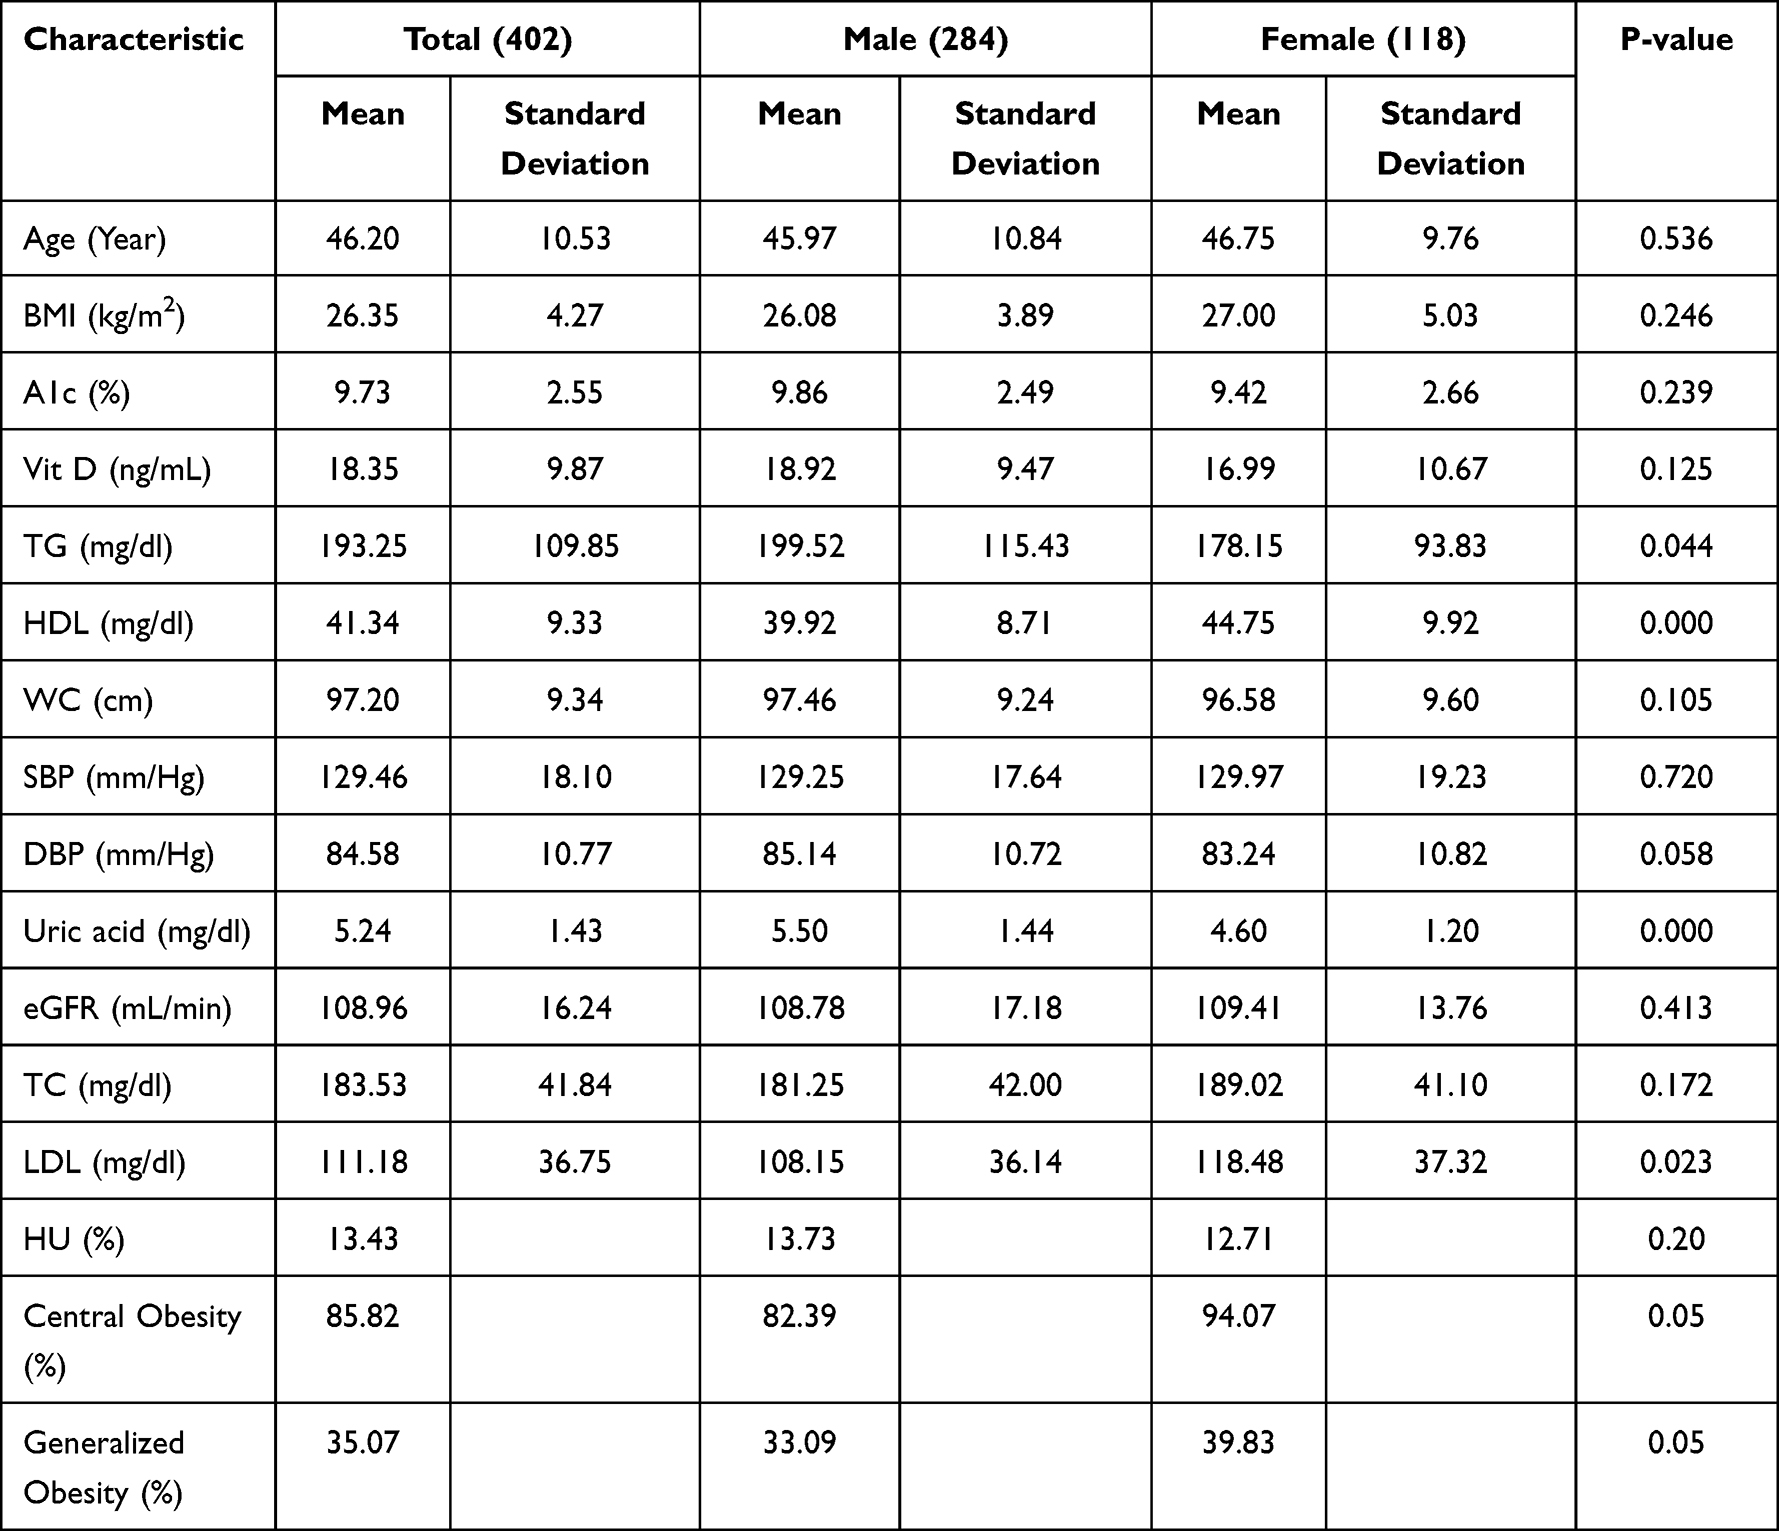 |
Table 1 Baseline Characteristics of the Study Participants by Sex |
Comparison of Baseline Characteristics Among Under-Weight, Normal Weight, Overweight and Obese Subjects
Baseline characteristics of study populations across different BMI groups are shown in Table 2. Prevalence of obesity were 35.07%, 33.01% and 39.83% in all, male and female patients, respectively while prevalence of overweight were 46.02%, 48.24% and 40.68% in all, male and female patients, respectively in this study. Mean values of age, TG, HDL, GFR, TC and LDL were similar in all four groups. Mean value of A1c, Vit D, WC, SBP, DBP and SUA were significantly different in four categories. As BMI increases AIc (p <0.015) and Vit D (p <0.009) significantly decrease but WC (p <0.000), SBP (p <0.000), DBP (p <0.000) and SUA (p <0.034) significantly increase.
 |
Table 2 Characteristics of Study Subjects by Different Weight Categories |
Correlation of SUA with BMI and WC
Figure 1 presents the correlation between SUA and BMI and also between SUA and WC. A positive Pearson’s correlation coefficient was found between SUA and BMI (male: r=0.212, p <0.00; female: r=0.428, p <0.00) and also between SUA and WC (male: r=0.208, p <0.00; female: r=0.376, p <0.00). SUA correlation with BMI and WC is more in females as compared with males. Mean± SD level of SUA increased gradually across the different BMI groups (Figure 2; Box plot).
 |
Figure 1 Correlation between SUA with BMI and WC [(A) BMI-Male; (B) BMI-Female; (C) WC-Male; (D) WC-Female]. |
 |
Figure 2 Level of SUA in various BMI groups (Asterisk (*) indicates extreme outliers and circle (O) indicates mild outliers). |
Characteristics of Patients According to SUA Quartile and Comparison of Obesity Between the Quartiles
The baseline and demographic profile of patients according to SUA quartiles are shown in Table 3. As the SUA increases across the quartile, BMI and A1c significantly changed. Prevalence of obesity significantly increased with increasing SUA quartiles (Figure 3). Prevalence of obesity was significantly increased with increasing SUA quartile and was 21%, 30.69%, 38.61% and 50% respectively in first, second, third and fourth quartiles.
 |
Table 3 Characteristics of the Population According to SUA (Mg/Dl) Quartiles |
 |
Figure 3 SUA quartile and prevalence of obesity. |
Association of SUA Level with Obesity
Table 4 shows the association between SUA level and obesity in study participants. After adjusting the age and sex, SUA level was independently associated with obesity (Model-1). After adjusting the additional confounders such as BMI, TG and WC (Model-1 + BMI+TG+WC) SUA level is still independently associated with obesity. In Model-3 we further adjusted with GFR, A1c, TC and Vit D and found an independent association between SUA and obesity.
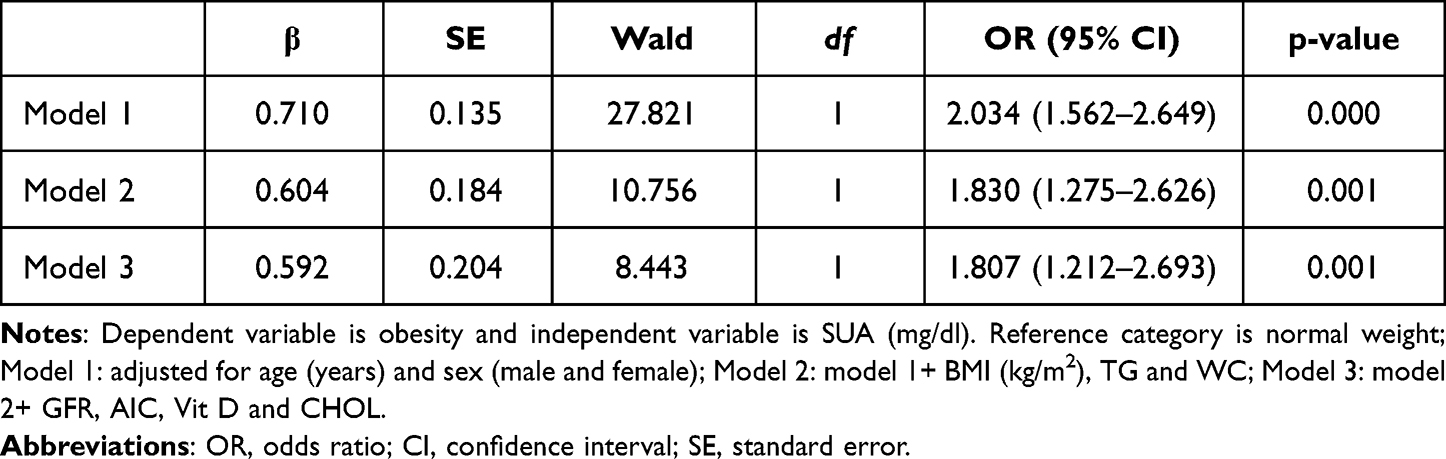 |
Table 4 Multinomial Logistic Regression Analysis to Relate the Association Between UA Levels and Obesity |
Discussion
The present study reports that in newly onset diabetic patients there is a strong positive relationship between obesity and SUA. If routine estimation of SUA in obese diabetic patients is done it will be of immense value in preventing and managing HU and its associated complications. Prevalence of obesity, hyperuricemia and DM is increasing worldwide.1,20 Obesity and hyperuricemia have been recognized as a risk factor for a variety of disease conditions such as DM, CVD, metabolic syndrome, CKD, hypertension and endothelial dysfunction.17,19,21,25 Nowadays obesity and HU are serious concerns to public health because of associated complications and economic burden. Association between obesity and HU has been found in various cross-sectional and epidemiological studies worldwide but data are lacking from India. To the best of our knowledge the present study is the first from India, which explored the association between SUA and obesity in newly onset DM.
In this study, prevalence of generalized obesity was 35.07%, 33.10% and 39.83% in all, male and female, respectively while prevalence of central obesity was 85.82%, 82.39% and 94.07% in all, male and female, respectively. This shows that Indians are more prone to central obesity as compared with generalized obesity. The reason for this is that Indians have a greater predisposition to accumulation of visceral fat as compared with subcutaneous fat. Similar trends of obesity in DM were shown in other studies too.5,35 Prevalence of HU was 13.43%, 13.73% and 12.71% in all, male and female, respectively. Others have also found similar prevalence of HU in their studies.17,35–37 As compared with males, females have low SUA in the present study. A similar finding was seen by Singh et al.38 This is primarily because of high level of estrogen in females and estrogen is known to have uricosuric properties.39 Other reasons for low SUA level in females are the differences in exercise, eating habits and commuting methods.40
Our present study confirms a strong and positive association between obesity and SUA. This association was more in female diabetic patients as compared with male. We also found that as the SUA increases, prevalence of obesity increases across the SUA quartiles. SUA is independently associated with obesity even after adjusting the various risk factors such as age, sex, TG, GFR, Vit D, A1c and TC. In this study SUA is also strongly associated with central obesity (WC). Consistent with this finding several cross-sectional and epidemiological studies have also shown a strong association between SUA and obesity. In a 10-year follow-up CARDIA study, Rathmann et al have found that with increasing SUA, BMI and TG also increased significantly in all race and sex groups.41 Tanaka et al in their study also found significant association between BMI and SUA, after adjusting genetic and familial environmental factors in Japanese population.42 Ogura et al in their follow-up study from Japan found a positive correlation between SUA and obesity related indicators (BMI and skinfold thickness).16 They also found that incidence of HU increased in parallel with BMI. In a Mendelian randomization analysis by Palmer et al, it was reported that SUA levels were positively associated with BMI.43 Though there is a positive association between obesity and SUA, the mechanism by which obesity causes rise in SUA is still debatable. Both overproduction and under-excretion of uric acid in obesity have been reported. According to Tsushima et al, fat cells of obese individuals produce and secrete more uric acid leading to HU.44 This is because of high XO (Xanthine oxidase) activity in fat cells.44 Also, in obese persons there is active fatty acid synthesis in fat cells leading to more de novo purine synthesis and thus HU.45 The reason for decreased uric acid excretion in obesity is hyperinsulinemia as it causes active uric acid reabsorption from kidney tubules.46 Besides high fructose consumption in obesity also causes HU.30 Fruehwald-Schultes B et al in their study found that leptin could be an etiopathogenetic factor responsible for raised SUA in obesity.47
In this study we noticed a stronger association between obesity and SUA in female patients as compared with male patients. Others have also found a stronger association of SUA with obesity, hypertension, major cardiovascular event and metabolic syndrome in females.17,48,49 Reasons for such gender difference is not clear but it could be due to sex hormones. We also found a strong association between SUA and A1c. As SUA increases A1c decreases significantly. The possible reason for observed results of the inverse association between rising SUA and A1c may be due to inhibition of uric acid reabsorption in the proximal convoluted tubules of kidney by high glucose levels.50 In this study Vit D is negatively associated with obesity but not with SUA. In our study A1c level is higher in underweight patients than obese patients. This is because DM is characterized by heterogeneity in its clinical presentation and pathogenesis. Although higher BMI is associated with high A1c in many studies, recent studies have shown that SIDD (severe insulin deficient diabetes) is the group of patients with lowest BMI and highest A1c as compared with others.51
The main limitation of the present study is the cross-sectional nature of the data, as they do not conclude the cause-effect association between obesity and SUA. This study is from a single center so our findings cannot be extrapolated to the whole Indian population. The main strength of this study is its large sample size and that it is the first study of this type from India in newly onset diabetic patients.
Conclusion
In summary, in newly onset diabetic patients, we found a strong positive relationship between obesity and SUA. Therefore, estimation of SUA is routinely recommended in obese diabetic patients. Considering the high prevalence of obesity in newly onset DM and the positive link between HU and complications, more emphasis should be put on preventing and/or treating HU in newly onset obese diabetic patients.
Acknowledgments
The authors gratefully acknowledge Prof. Dinesh Kumar, Department of Biotechnology, Central University of Haryana and Vanshika Singh for their critical comments and constant motivation.
Funding
There is no funding to report.
Disclosure
The authors report no conflicts of interest in this work.
References
1. NCD Risk Factor Collaboration (NCD-RisC). Worldwide trends in body-mass index, underweight, overweight, and obesity from 1975 to 2016: a pooled analysis of 2416 population-based measurement studies in 128·9 million children, adolescents, and adults. Lancet. 2017;390:2627–2642. doi:10.1016/S0140-6736(17)32129-3
2. Pradeepa R, Anjana RM, Joshi SR, et al. Prevalence of generalized & abdominal obesity in urban & rural India--The ICMR-INDIAB Study (Phase-I) [ICMR- NDIAB-3]. Indian J Med Res. 2015;142:139–150. doi:10.4103/0971-5916.164234
3. Ogden CL, Carroll MD, Fryar CD, et al. Prevalence of obesity among adults and youth: United States, 2011–2014. NCHS Data Brief. 2015;2015:1–8.
4. Wang Y, Beydoun MA, Liang L, Caballero B, Kumanyika SK. Will all Americans become overweight or obese? Estimating the progression and cost of the US obesity epidemic. Obesity. 2008;16(10):2323–2330. doi:10.1038/oby.2008.351
5. Daousi C, Casson IF, Gill GV, MacFarlane IA, Wilding JP, Pinkney JH. Prevalence of obesity in type 2 diabetes in secondary care: association with cardiovascular risk factors. Postgrad Med J. 2006;82(966):280–284. doi:10.1136/pmj.2005.039032
6. Bleich S, Cutler D, Murray C, Adams A. Why is the developed world obese? Annu Rev Public Health. 2008;29:273–295. doi:10.1146/annurev.publhealth.29.020907.090954
7. Astrup A, Brand-Miller J. Diet composition and obesity. Lancet. 2012;379:1100, author reply 1100–01. doi:10.1016/S0140-6736(12)60456-5
8. Church TS, Thomas DM, Tudor-Locke C, et al. Trends over 5 decades in U.S. occupation-related physical activity and their associations with obesity. PLoS One. 2011;6:e19657. doi:10.1371/journal.pone.0019657
9. Turnbaugh PJ, Hamady M, Yatsunenko T, et al. A core gut microbiome in obese and lean twins. Nature. 2009;457:480–484.
10. Frank B, Hu FB, Manson JE, et al. Diet, lifestyle, and the risks of type 2 diabetes in women. N Engl J Med. 2001;345:790–797. doi:10.1056/NEJMoa010492
11. Wilson PW, D’Agostino RB, Sullivan L, Parise H, Kannel WB. Overweight and obesity as determinants of cardiovascular risk; the Framingham experience. Arch Intern Med. 2002;162:1867–1872. doi:10.1001/archinte.162.16.1867
12. Kenchaiah S, Evans JC, Levy D, et al. Obesity and the risk of heart failure. N Engl J Med. 2002;347:305–313. doi:10.1056/NEJMoa020245
13. Finkelstein EA, Trogdon JG, Cohen JW, Dietz W. Annual medical spending attributable to obesity: payer- and service-specific estimates. Health Aff. 2009;28(5):w822–w831. doi:10.1377/hlthaff.28.5.w822
14. Sui X, Church TS, Meriwether RA, Lobelo F, Blair SN. Uric acid and the development of metabolic syn- drome in women and men. Metabolism. 2008;57(6):845–852. doi:10.1016/j.metabol.2008.01.030
15. Chen LY, Zhu WH, Chen ZW, et al. Relationship between hyperuricemia and metabolic syndrome. J Zhejiang Univ Sci B. 2007;8(8):593–598. doi:10.1631/jzus.2007.B0593
16. Ogura T, Matsuura K, Matsumoto Y, et al. Recent trends of hyperuricemia and obesity in Japanese male adolescents, 1991 through 2002. Metabolism. 2004;53(4):448–453. doi:10.1016/j.metabol.2003.11.017
17. Singh SK, Singh R, Singh SK, Iquebal MA, Jaiswal S, Singh A. Prevalence of hyperuricemia and the relationship between serum uric acid and hypertension in new onset diabetic patients: a cross-sectional Indian Study. Diabetes Metab Syndr Obes. 2022;15:1809–1817. doi:10.2147/DMSO.S363311
18. Perlstein TS, Gumieniak O, Williams GH, et al. Uric acid and the development of hypertension: the normative aging study. Hypertension. 2006;48(6):1031–1036. doi:10.1161/01.HYP.0000248752.08807.4c
19. Dehghan A, van Hoek M, Sijbrands EJ, Hofman A, Witteman JC. High serum uric acid as a novel risk factor for type 2 diabetes. Diabetes Care. 2008;31(2):361–362. doi:10.2337/dc07-1276
20. Kanwar G, Kabra R. Serum uric acid level and obesity: an association. Int J Healthcare Sci. 2016;4(1):5.
21. Duan Y, Liang W, Zhu L, et al. Association between serum uric acid levels and obesity among university students (China). Nutr Hosp. 2015;31(6):2407–2411. doi:10.3305/nh.2015.31.6.8734
22. Essa SA, Mishari AK, Kadhom QI. Association between serum uric acid and obesity. JUBPAS. 2015;23(2):2015.
23. Ali N, Rahman S, Islam S, et al. The relationship between serum uric acid and lipid profile in Bangladeshi adults. BMC Cardiovasc Disord. 2019;19(42). doi:10.1186/s12872-019-1026-2
24. Molla NH, Kathak RR, Sumon AH, et al. Assessment of the relationship between serum uric acid levels and liver enzymes activity in Bangladeshi adults. Sci Rep. 2021;11(1):20114. PMID: 34635716; PMCID: PMC8505549. doi:10.1038/s41598-021-99623-z
25. Desai RJ, Franklin JM, Spoendlin-Allen J, Solomon DH, Danaei G, Kim SC. An evaluation of longitudinal changes in serum uric acid levels and associated risk of cardio-metabolic events and renal function decline in gout. PLoS One. 2018;13(2):e0193622. doi:10.1371/journal.pone.0193622
26. Oyama C, Akahashi T, Oyamada M, et al. Serum uric acid as an obesity-related indicator in early adolescence. Tohoku J Exp Med. 2006;209(3):257–262. doi:10.1620/tjem.209.257
27. Lyngdoh T, Vuistiner P, Marques-Vidal P, et al. Serum uric acid and adiposity: deciphering causality using a bidirectional Mendelian randomization approach. PLoS One. 2012;7(6):e39321. doi:10.1371/journal.pone.0039321
28. Nakanishi N, Yoshida H, Nakamura K, Suzuki K, Tatara K. Predictors for development of hyperuricemia: an 8-year longitudinal study in middle-aged Japanese men. Metabolism. 2001;50(6):621–626. doi:10.1053/meta.2001.24196
29. Masuo K, Kawaguchi H, Mikami H, Ogihara T, Tuck ML. Serum uric acid and plasma norepinephrine concentrations predict subsequent weight gain and blood pressure elevation. Hypertension. 2003;42(4):474–480. doi:10.1161/01.HYP.0000091371.53502.D3
30. Mai BH, Yan LJ. The negative and detrimental effects of high fructose on the liver, with special reference to metabolic disorders. Diabetes Metab Syndr Obes. 2019;27(12):821–826. doi:10.2147/DMSO.S198968
31. Singh SK, Singh R, Singh SK. A perfect beta-blocker for kidney: SGLT-2 inhibitor. J Assoc Physicians India. 2021;69(7):11–12.
32. American Diabetes Association. Standards of medical care in diabetes-2018 abridged for primary care providers, Clin Diabetes. 2018;36(1):14–37. PMID: 29382975; PMCID: PMC5775000. doi:10.2337/cd17-0119
33. Alberti KG, Zimmet P, Shaw J. Metabolic syndrome—A new world-wide definition. A Consensus Statement from the International Diabetes Federation. Diabet Med. 2006;23:469–480. doi:10.1111/j.1464-5491.2006.01858.x
34. World Health Organization. Appropriate body-mass index for Asian populations and its implications for policy and intervention strategies. Lancet. 2004;363(9403):157–163. doi:10.1016/S0140-6736(03)15268-3
35. Vasanthakumar J, Kambar S. Prevalence of obesity among type 2 diabetes mellitus patients in urban areas of Belagavi. Indian J Heal Sci Biomed Res. 2020;13:21–738. doi:10.4103/kleuhsj.kleuhsj_221_18
36. Uaratanawong S, Suraamornkul S, Angkeaw S, Uaratanawong R. Prevalence of hyperuricemia in Bangkok population. Clin Rheumatol. 2011;30(7):887–893. doi:10.1007/s10067-011-1699-0
37. Sari I, Akar S, Pakoz B, et al. Hyperuricemia and its related factors in an urban population, Izmir, Turkey. Rheumatol Int. 2009;29(8):869–874. doi:10.1007/s00296-008-0806-2
38. Singh SK, Singh R, Singh SK. Gender differences in cardio metabolic risk factor in newly onset diabetes mellitus: a cross sectional study. J Assoc Physician India. 2022;70(1):11–12.
39. Antón FM, García Puig J, Ramos T, et al. Sex differences in uric acid metabolism in adults: evidence for a lack of influence of estradiol- 17 beta (E2) on the renal handling of urate. Metabolism. 1986;35(4):343–348. doi:10.1016/0026-0495(86)90152-6
40. Liu L, Lou S, Xu K, et al. Relationship between lifestyle choices and hyperuricemia in Chinese men and women. Clin Rheumatol. 2013;32(2):233–239. doi:10.1007/s10067-012-2108-z
41. Rathmann W, Haastert B, Icks A, Giani G, Roseman JM. Ten-year change in serum uric acid and its relation to changes in other metabolic risk factors in young black and white adults: the CARDIA study. Eur J Epidemiol. 2007;22(7):439–445. doi:10.1007/s10654-007-9132-3
42. Tanaka K, Ogata S, Tanaka H, Omura K, Honda C; Osaka Twin Research Group, Hayakawa K. The relationship between body mass index and uric acid: a study on Japanese adult twins. Environ Health Prev Med. 2015;20(5):347–353. doi:10.1007/s12199-015-0473-3
43. Palmer TM, Nordestgaard BG, Benn M, et al. Association of plasma uric acid with ischaemic heart disease and blood pressure: Mendelian randomisation analysis of two large cohorts. BMJ. 2013;18:347.
44. Tsushima Y, Nishizawa H, Tochino Y, et al. Uric acid secretion from adipose tissue and its increase in obesity. J Biol Chem. 2013;288(38):27138–27149. doi:10.1074/jbc.M113.485094
45. Gong M, Wen S, Nguyen T, Wang C, Jin J, Zhou L. Converging relationships of obesity and hyperuricemia with special reference to metabolic disorders and plausible therapeutic implications. Diabetes Metab Syndr Obes. 2020;13:943–962. doi:10.2147/DMSO.S232377
46. Facchini F, Chen YD, Hollenbeck CB, Reaven GM. Relationship between resistance to insulin-mediated glucose uptake, urinary uric acid clearance, and plasma uric acid concentration. JAMA. 1991;266(21):3008–3011. doi:10.1001/jama.1991.03470210076036
47. Fruehwald-Schultes B, Peters A, Kern W, Beyer J, Pfützner A. Serum leptin is associated with serum uric acid concentrations in humans. Metabolism. 1999;48(6):677–680. doi:10.1016/S0026-0495(99)90163-4
48. Ali N, Perveen R, Rahman S, et al. Prevalence of hyperuricemia and the relationship between serum uric acid and obesity: a study on Bangladeshi adults. PLoS One. 2018;13(11):e0206850. doi:10.1371/journal.pone.0206850
49. Zheng X, Wei Q, Long J, et al. Gender specific association of serum uric acid level and cardio-ankle vascular index in Chinese adults. Lipids Health Dis. 2018;17:80. doi:10.1186/s12944-018-0712-x
50. Tuomilehto J, Zimmet P, Wolf E, Taylor R, Ram P, King H. Plasma uric acid level and its association with diabetes mellitus and some biologic parameters in a biracial population of Fiji. Am J Epidemiol. 1988;127(2):321–336. doi:10.1093/oxfordjournals.aje.a114807
51. Anjana RM, Baskar V, Nair ATN, et al. Novel subgroups of type 2 diabetes and their association with microvascular outcomes in an Asian Indian population: a data-driven cluster analysis: the INSPIRED study. BMJ Open Diab Res Care. 2020;8:e001506. doi:10.1136/bmjdrc-2020-001506
 © 2023 The Author(s). This work is published and licensed by Dove Medical Press Limited. The full terms of this license are available at https://www.dovepress.com/terms.php and incorporate the Creative Commons Attribution - Non Commercial (unported, v3.0) License.
By accessing the work you hereby accept the Terms. Non-commercial uses of the work are permitted without any further permission from Dove Medical Press Limited, provided the work is properly attributed. For permission for commercial use of this work, please see paragraphs 4.2 and 5 of our Terms.
© 2023 The Author(s). This work is published and licensed by Dove Medical Press Limited. The full terms of this license are available at https://www.dovepress.com/terms.php and incorporate the Creative Commons Attribution - Non Commercial (unported, v3.0) License.
By accessing the work you hereby accept the Terms. Non-commercial uses of the work are permitted without any further permission from Dove Medical Press Limited, provided the work is properly attributed. For permission for commercial use of this work, please see paragraphs 4.2 and 5 of our Terms.