Back to Journals » Neuropsychiatric Disease and Treatment » Volume 17
Factors That Affect Patient Attrition in Buprenorphine Treatment for Opioid Use Disorder: A Retrospective Real-World Study Using Electronic Health Records
Authors Ker S ![]() , Hsu J, Balani A, Mukherjee SS
, Hsu J, Balani A, Mukherjee SS ![]() , Rush AJ
, Rush AJ ![]() , Khan M, Elchehabi S, Huffhines S, DeMoss D, Rentería ME
, Khan M, Elchehabi S, Huffhines S, DeMoss D, Rentería ME ![]() , Sarkar J
, Sarkar J
Received 7 August 2021
Accepted for publication 8 October 2021
Published 28 October 2021 Volume 2021:17 Pages 3229—3244
DOI https://doi.org/10.2147/NDT.S331442
Checked for plagiarism Yes
Review by Single anonymous peer review
Peer reviewer comments 3
Editor who approved publication: Dr Yu-Ping Ning
Sheryl Ker,1,* Jennifer Hsu,2,* Anisha Balani,1,* Sankha Subhra Mukherjee,1 A John Rush,3– 5 Mehreen Khan,2 Sara Elchehabi,2 Seth Huffhines,2 Dustin DeMoss,2,6 Miguel E Rentería,1 Joydeep Sarkar1
1Holmusk Technologies, Inc., New York, NY, USA; 2John Peter Smith Health Network, Fort Worth, TX, USA; 3Department of Psychiatry, Duke-National University of Singapore (NUS), Singapore; 4Duke University School of Medicine, Durham, NC, USA; 5Texas Tech Health Sciences Center, Odessa, TX, USA; 6University of North Texas Health Science Center/Texas Christian University, Fort Worth, TX, USA
*These authors contributed equally to this work
Correspondence: Miguel E Rentería; Joydeep Sarkar
Holmusk Technologies, Inc., 4th Floor, 54 Thompson St, New York, NY, 10012, USA
Email [email protected]; [email protected]
Purpose: To describe attrition patterns of opioid use disorder (OUD) patients treated with buprenorphine (BUP) and to assess how clinical, sociodemographic, or BUP medication dosing features are associated with attrition.
Patients and Methods: Electronic health records of adults (16+ year-olds) with OUD treated with BUP from 23 different substance use or mental health care programs across 11 US states were examined for one year following BUP initiation in inpatient (IP), intensive outpatient (IOP), or outpatient (OP) settings. Treatment attrition was declared at > 37 days following the last recorded visit. Survival analyses and predictive modelling were used.
Results: Retention was consistently 2– 3 times higher following BUP initiation in OP (n = 2409) than in IP/IOP (n = 2749) settings after 2 (50% vs 25%), 6 (27% vs 9%) and 12 months (14% vs 4%). Retention was higher for females, whites (vs blacks), and those with less severe OUD, better global function, or not using non-psychotropic medications. Comorbid substance use, other psychiatric disorders, and the number of psychotropic medications were variously related to retention depending on the setting in which BUP was initiated. Predictive modelling revealed that a higher global assessment of functioning and a smaller OUD severity based on the Clinical Global Impression – Severity led to longer retentions, a higher initial BUP dose led to higher retention in a few cases, an OP setting of BUP initiation led to longer retentions, and a lower total number of psychotropic and non-psychotropic medications led to longer retentions. These were the most important parameters in the model, which identified 75.2% of patients who left BUP treatment within three months post-initiation, with a precision of 90.5%.
Conclusion: Of all the OUD patients who began BUP, 50– 75% left treatment within three months, and most could be accurately identified. This could facilitate patient-centered management to better retain OUD patients in BUP treatment.
Keywords: opioids, buprenorphine, buprenorphine dosing, treatment engagement, treatment retention, treatment dropout, predictors
Introduction
Opioid use disorder (OUD) entails substantial disability and mortality. Community harms include medical and healthcare costs (overdose sequelae and deaths), crime and law enforcement costs, transmission of blood-borne diseases, and worsened social outcomes (family disruption, loss of employment).1–3 In 2019 in the United States, approximately 9.7 million individuals used prescription pain relievers for a non-medical reason, 438,000 reported regular heroin use, and more than 1.6 million met diagnostic criteria for an OUD. Over the past three years, significantly more individuals have received pharmacotherapy for OUD. Yet, opioid overdose deaths increased by approximately 4.6%, emphasizing the need for continued treatment engagement and recovery services.4
Buprenorphine (BUP) is a partial µ-opioid receptor agonist approved by the US Food and Drug Administration for the maintenance treatment of opioid dependence.4 Use of BUP is associated with favorable clinical outcomes, including harm reduction, treatment retention, and improved illicit-drug-free urine screen rates.5 In daily practice, however, premature treatment discontinuation remains a major obstacle.6 Individuals who remain in addiction treatment have higher abstinence and employment rates and lower relapse and crime rates than those who drop out.7 Factors associated with premature treatment discontinuation include limited geographic availability of treatment centers, concerns about diversion and overdose hazards, and ambivalence about using medications that cause dependence to treat opioid dependence.8
Prescriber/clinician-dependent factors may also be associated with treatment discontinuation. Inadequate dosing of medication treatment for OUD is a common cause of treatment failure.9 However, dosing, monitoring, and duration of BUP treatment are influenced by a range of clinical and contextual factors, which challenge expert consensus.10 Clinicians question dosing choices in many subgroups, including people with severe addiction symptoms, high tolerance to opioids, comorbid mental illnesses, prisoners, pregnant patients, and polysubstance users.11 Physicians may also select BUP dosages based on their own expertise, and the management of opioid withdrawal and OUD symptom severity may differ between inpatient and outpatient settings. No conclusive data supports an average duration of treatment, and much remains to be learned regarding how to maximize BUP effectiveness in managing opioid withdrawal in various settings and contexts.12
This study used data acquired through the electronic health records (EHRs) of a representative group of patients with OUD who began BUP as inpatients (IPs), intensive outpatients (IOPs), or outpatients (OPs) and were followed for up to a year after BUP initiation. This study addresses the following questions: (1) When does attrition from BUP treatment occur?; (2) What sociodemographic or clinical features are associated with attrition from BUP?; (3) What BUP dosing patterns were observed in these treatment settings, and did they influence attrition rates?; (4) Can a meaningful proportion of OUD patients who leave BUP prematurely be identified with reasonable certainty through pre-treatment and treatment factors?
Materials and Methods
Overview of Study Design
This study is a retrospective secondary analysis of data from the Mind-Linc EHR system, developed by the Duke University Medical Center, Department of Psychiatry, and initiated in 1998.13 EHR data, collected from 23 inpatient and outpatient settings, systematically captured data elements to create a fully anonymized, longitudinal data repository. Data were collected from behavioral health units/clinics from four hospitals in three states (North Carolina, Colorado, New York) and seven ambulatory community mental health centers in five states (North Carolina, Colorado, New York, Indiana, New Hampshire). To comply with HIPAA requirements, all 18 identifiers specified by HIPAA guidelines14 were removed from the data repository. The data used for this document has been obtained from an analytical dataset generated from EHR records that have been versioned and frozen and are called R20R1, which comprises data from 559,297 individuals with more than 22 million recorded encounters. Institutional review board approval was not required because MindLinc-EHR data are anonymized.
Participants
Study participants included patients at least 16 years old with an OUD diagnosis (Supplementary Table 1) who began a BUP-containing medication including BUP/naloxone at the point of or following the initial EHR recording of the OUD diagnosis. This age criterion was selected because buprenorphine is FDA-approved for individuals aged 16 years and older. BUP treatment could have been initiated in IP, OP, or IOP settings. To ensure that all patients could have been in treatment for an entire year following the initial OUD diagnosis, the initial diagnosis had to be entered into EHR between January 1, 2009, and December 31, 2018. All participants were required to make at least one visit following the baseline visit.
Only patients with complete dosing information during the observation period were included in analyses that addressed dosing questions.
Prescription Pre-Processing
When prescriptions overlapped in time, or when the end date of a prescription and the start date of the following prescription differed by 37 days or less, the prescriptions were merged and considered a single prescription. These steps were performed iteratively until mergers were no longer possible. At the end of this procedure, the first prescription duration resulting from all the merges was taken as “treatment duration” for the analysis cohort. Patients with a gap of >37 days between any two consecutive prescriptions were excluded from the dosage cohort.
Only patients who had dosing information on each prescription were considered for dosing analysis. For each prescription, the dose (eg, 2 mg tablet) and regimen (eg, B.I.D.) were combined into a single daily dose (in this case 4 mg/day). If prescriptions overlapped over time, the dose from the later prescription supplanted that from an earlier prescription. Gaps of ≤37 days between prescriptions were filled with the dose from the previous prescriptions.
Attrition from BUP Medication Treatment
Patient attrition from BUP medication treatment was declared when the EHR revealed that more than 37 days had elapsed following the last visit. Patients were followed for up to 1 year after BUP initiation, including up to 37 days after the last BUP prescription. This 37-day threshold was chosen because the Substance Abuse and Mental Health Services Administration treatment implementation protocol (TIP #40)15 recommends treatment visits every 30 days or sooner. We allowed an additional seven days in consideration of real-world factors that could interfere with this scheduling from time to time. Some patients who left BUP medication treatment based on this threshold could have subsequently returned to treatment. All visits after this initial point of attrition were excluded from analyses.
Measurements
Since real-world data obtained from EHR systems do not always follow ideal triage protocols, several approximations and definitions were incorporated for qualifying and quantifying the inclusion/exclusion criteria, the definitions of dose and comorbidities, duration of treatment, and treatment settings. Since the EHRs did not specify IP, IOP or OP settings, we used treatment visits/week within the first month of BUP initiation to identify likely treatment settings: (1) inpatient/intensive outpatient (IP/IOP) settings when at least 3 visits/week and (2) outpatient (OP) settings when 0–2 visits/week occurred. More in-depth details of the IP/IOP and OP definitions are presented in the Supplemental Text.
The Global Assessment of Functioning (GAF) is a 0–100 scale used by mental health clinicians to rate a patient’s overall psychological, social, and occupational functioning. Scores range from 100 (extremely high functioning) to 1 (severely impaired). The GAF was introduced in DSM-III-R and DSM-IV.16–18
The 7-point Clinical Global Impression – Severity (CGI-S) scale requires the clinician to rate the severity of the patient’s illness at the time of assessment, relative to the clinician’s experience with patients with the same diagnosis. Higher scores correspond with more severe illness severity (eg, 1 = not ill; 7 = among the most severely ill).19,20
Overall, in the MindLinc-EHR database, the CGI-S scores were recorded by psychiatrists, clinical psychologists, or other allied health professionals. In total, approximately 84% of patients have CGI-S values recorded. In contrast, GAF was recorded less frequently, with only 56% of patients having GAF values available.
Descriptive and Statistical Analysis
The study cohort was stratified by sociodemographics, the CGI-S, and the GAF on the day of BUP initiation, as well as other substance use disorder (SUD) comorbidities (Supplementary Table 2), other psychiatric non-SUD comorbidities (Supplementary Table 3), and the number of psychotropic and non-psychotropic medications (Supplementary Table 4) from one year before BUP initiation to one year after BUP initiation.
Survival curves were used to compare attrition rates across treatment settings and to evaluate the effect of various sociodemographic and clinical factors (eg, CGI-S, GAF, number of psychotropic medications used, SUD comorbidities, and other psychiatric comorbidities). A Log rank test was conducted for each set of survival curves to test for systematic population-based differences between the different survival curves.
To describe changes in dosing patterns, 2-dimensional kernel density estimation plots with Gaussian kernels were used to visualize systematic differences between the IP/IOP and OP cohorts in the first dose and how the dose changed with time. A modified trellis diagram was plotted to visualize the counts of patients with major dosing prescriptions, the number who switched from one dose to another, and the number who completed or dropped out of treatment after i-th each change in dose, with each node scaled according to the number of patients at that node. Major changes in the patient populations from one dose to another are represented by edges from one node to another.
Predictive Modelling
A discriminative model was used to predict the time to dropout. Due to the problem’s complexity, a nonlinear Random Forest Regression model21 was used, as implemented in the Scikit-Learn library.22
The following baseline parameters were used as inputs to the model: (1) other SUD comorbidities at baseline, grouped as alcohol, stimulant, sedative-hypnotic-anxiolytic, hallucinogen, or cannabis-related disorders; (2) number of comorbid non-SUD psychiatric disorders based on ICD-9-CM and ICD-10-CM coding in the database (Supplementary Table 3), grouped into the categories “0 comorbidities,” “1–2 comorbidities,” and “>2 comorbidities”; (3) the presence/absence of a comorbid SUD disorder (with baseline including up to one year prior to and one year following BUP initiation since SUD comorbidities are inconsistently recorded at each visit); (4) baseline GAF scores prior to BUP initiation (and up to one month following initiation), to which 387 patients did not have such GAF measurements (ie, 5.9% of IP/IOP and 27.3% of OP patients). For these patients, a value of 50 for the OP cohort and 70 for the IP and IOP cohorts were obtained by employing a grid search by using the missing GAF values as hyperparameters and imputed; (5) baseline CGI-S - where multiple CGI-S values were available within a six-month window prior to BUP initiation, all values were averaged to compute baseline CGI-S value; (6) treatment setting at BUP initiation (IP/IOP/OP); (7) Race (White, Black, Asian, Other); (8) Ethnicity (Hispanic, non-Hispanic); (9) Gender (Male, Female, Unknown); (10) number of non-SUD psychiatric comorbidities at baseline (defined as from up to one year before to one year after BUP initiation); (11) Initial prescribed BUP dose; (12) The total number of psychotropic and non-psychotropic medications prescribed to the patient at and up to six months prior to starting BUP.
Since many factors (beyond those measured) affect time to drop out, we grouped patients by the time periods ([0–3], [3–6], [6–9], [9–12] months [the latter including those without dropout]) during which dropouts occurred.
To predict early dropouts, we also grouped those with early (0–3 months) dropout vs all others based on the grouping from the model mentioned above. To compute the efficacy of the model, data were randomly split into training and testing sets (70% and 30%, respectively). For hyperparameter optimization, we used a five-fold cross-validation within the training data.
Results
Study Sample Formation
Figure 1 (Consort Diagram) shows how the full (n = 5158) and dosing analytic samples (n = 3188) were formed from the 34,756 patients who received an ICD-9-CM and ICD-10-CM diagnostic code for an OUD (Supplementary Table 1).
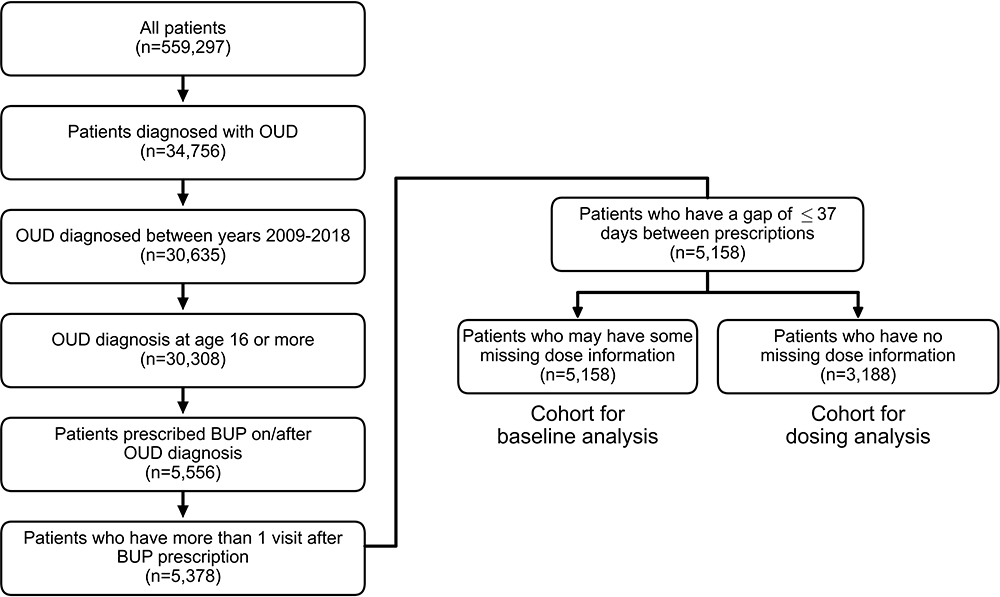 |
Figure 1 Attrition chart for full analytic (n=5158) and dosing analytic cohorts (n=3188). Abbreviations: OUD, Opioid Use Disorder; BUP, buprenorphine. |
Study Sample Description
Table 1 summarizes the sociodemographic features of the full sample (n = 5158). Most of the patients were white and under 35 years of age.
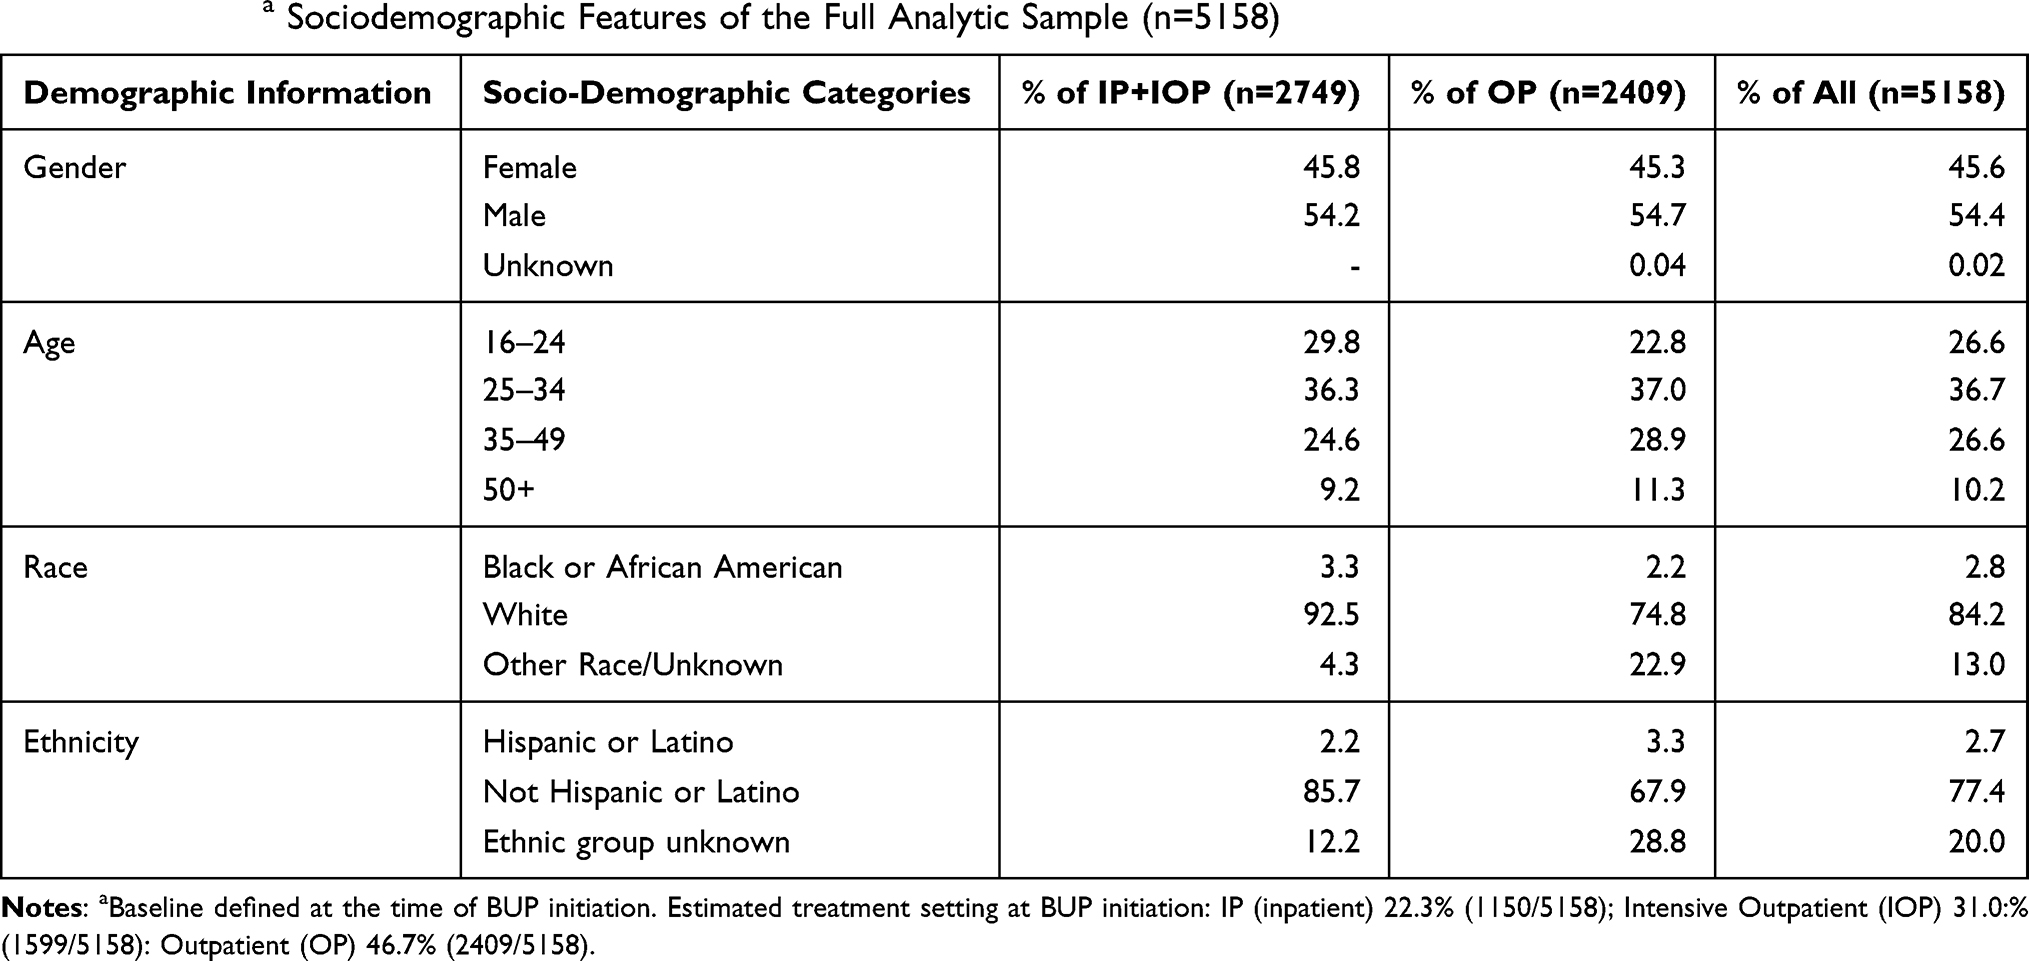 |
Table 1 Baselinea Sociodemographic Features of the Full Analytic Sample (n=5158) |
Table 2 summarizes baseline clinical information. Overall, 60–70% of OUD patients had at least one other non-SUD psychiatric diagnosis. About 1/3 of OUD patients were also prescribed at least two psychotropic medications (in addition to BUP).
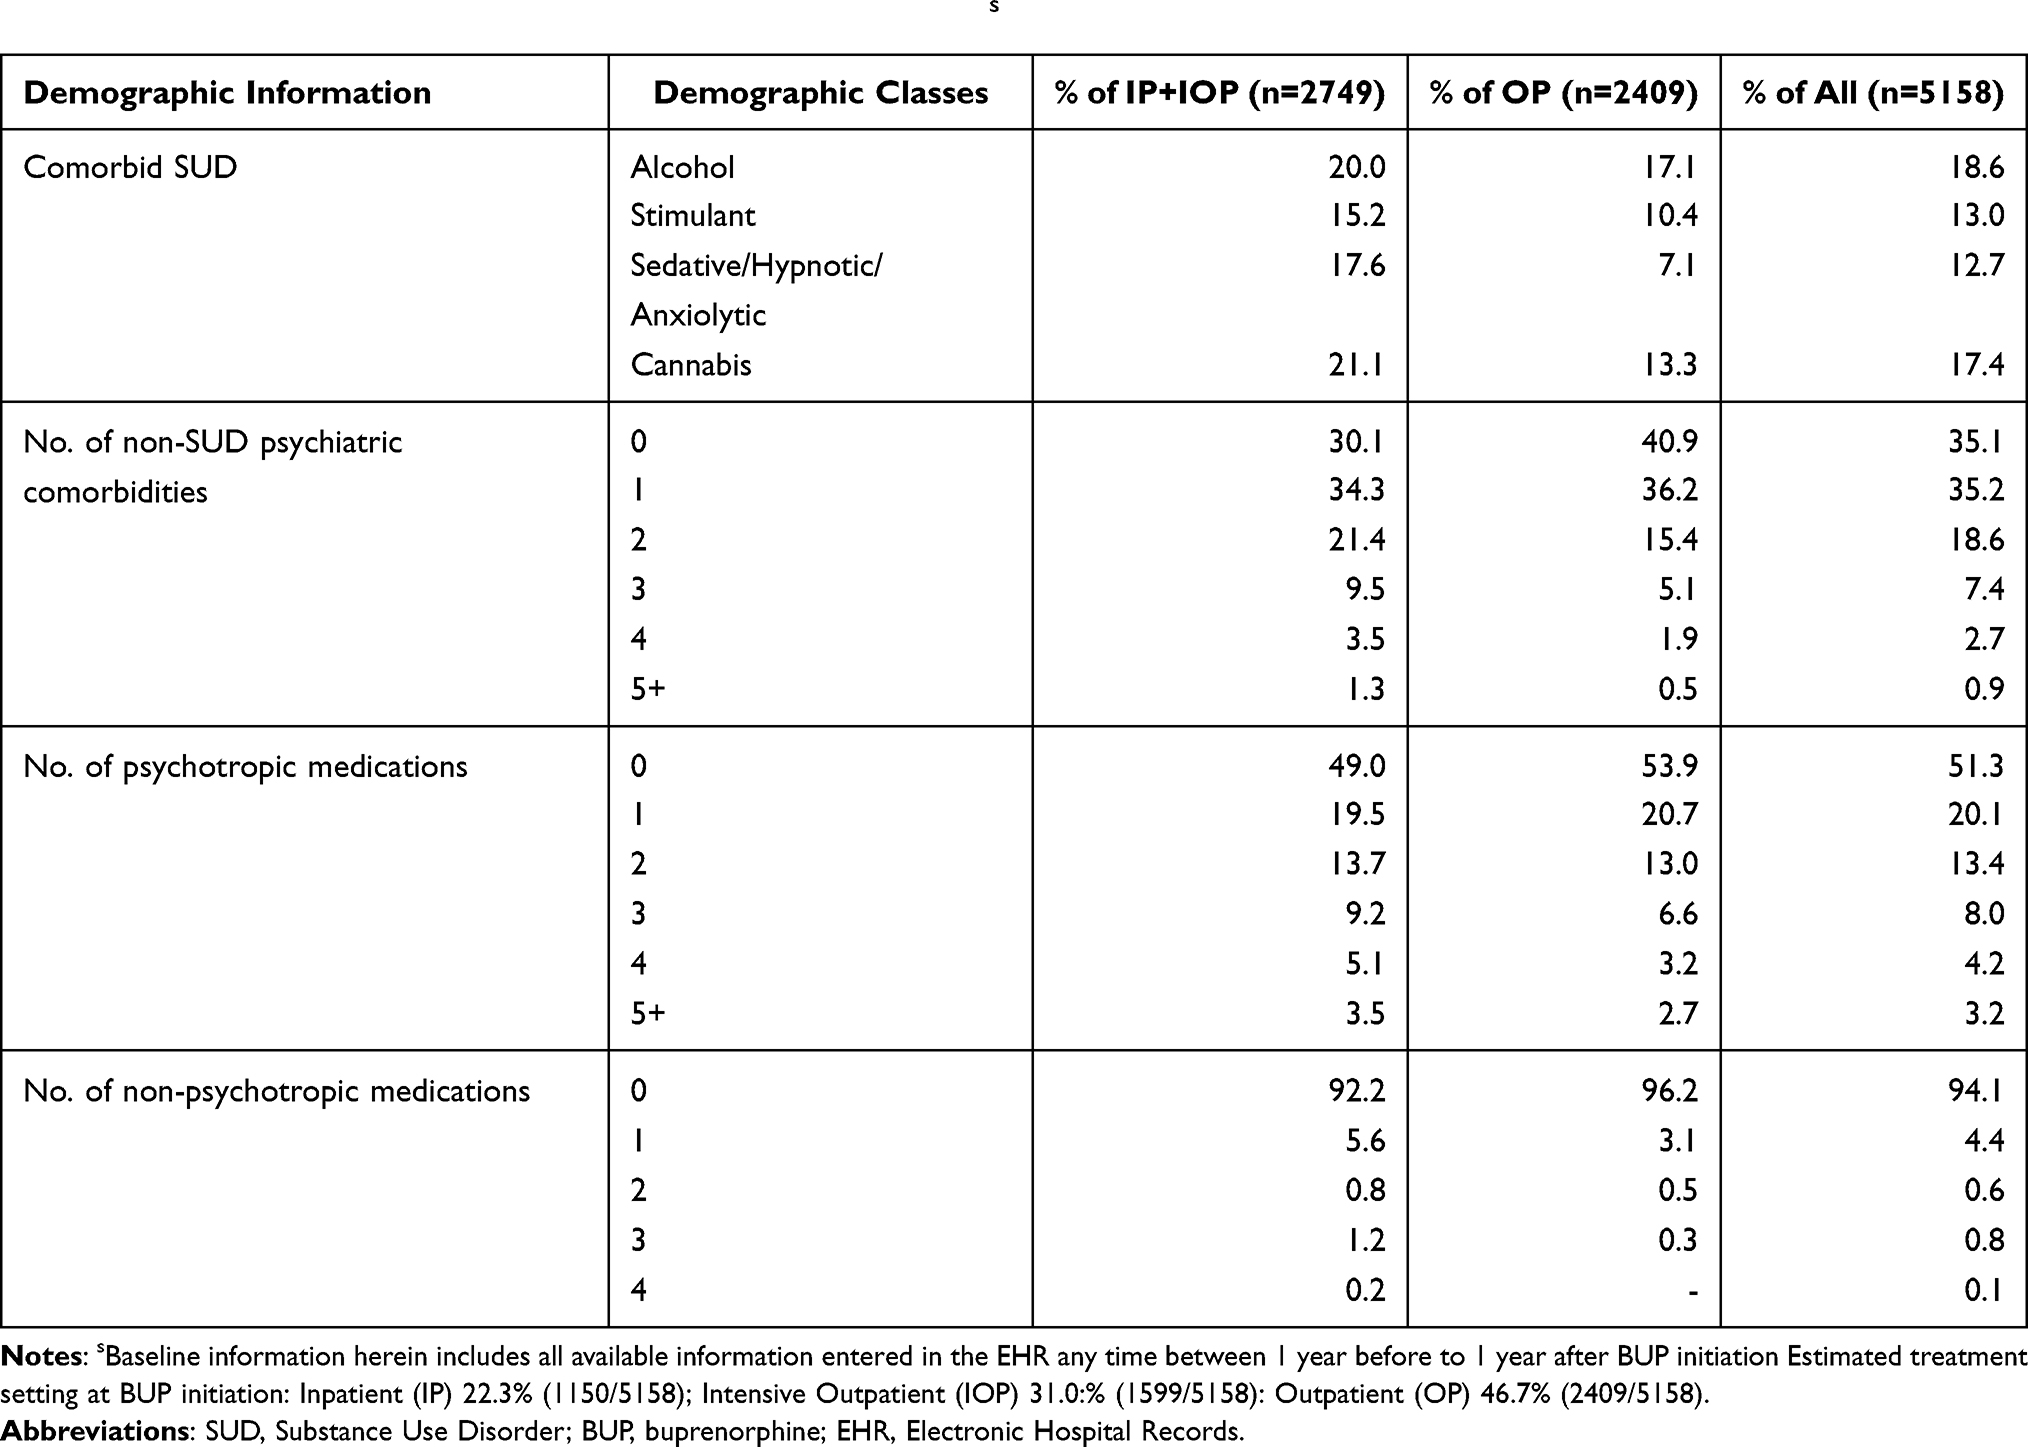 |
Table 2 Clinical Features of the Full Analytic Sample at Baselines |
Table 3 summarizes the GAF and the CGI-S scale scores overall and for each subsample. As might be expected, those whose BUP treatment were initiated as IPs/IOPs suffered greater illness severity (higher CGI-S scores) and poorer function (lower GAF scores).
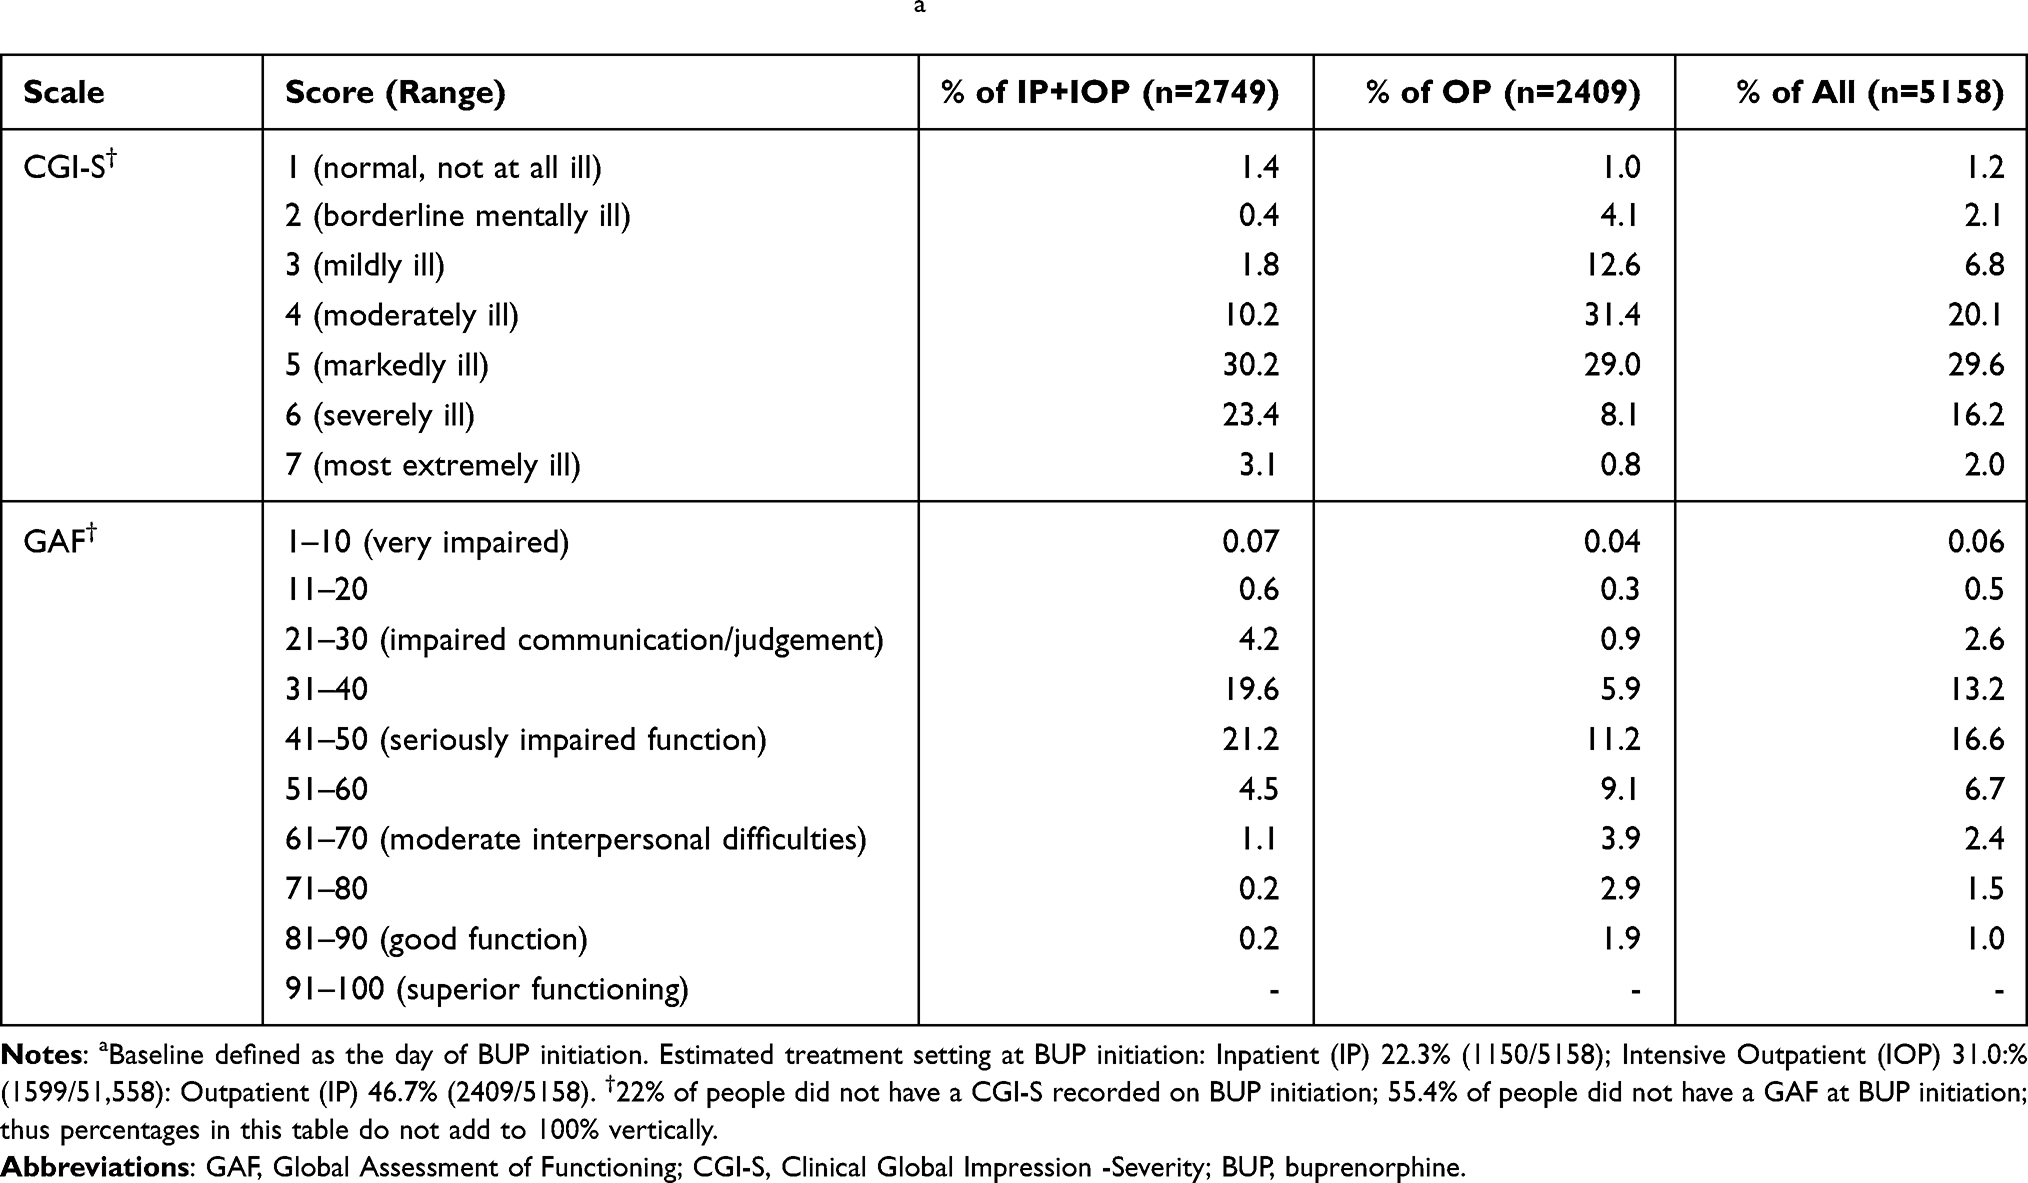 |
Table 3 GAF and CGI-S of the Analytic Sample at Baselinea |
Factors Associated with Attrition
A series of survival curve analyses were conducted using all data collected over the year following BUP initiation. Figure 2 shows that attrition is nearly twice as likely for those initiating BUP in IP/IOP settings than in OP settings. The survival probability at two months was 25% in the IP/IOP cohort and 50% in the OP cohort. At the end of the year, survival probability was 4% for the IP/IOP cohort and 14% for the OP cohort.
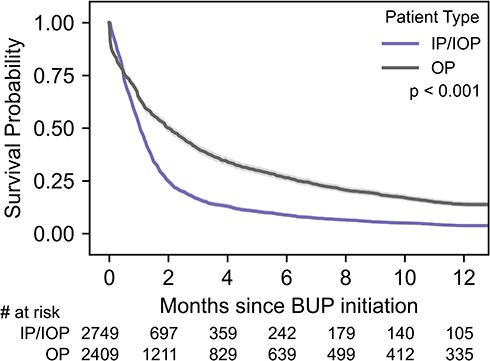 |
Figure 2 Survival curves based on site of BUP initiation, showing that the IP/IOP cohort has a greater attrition. Abbreviations: BUP, buprenorphine; IP, Inpatient; IOP, Intensive Outpatient; OP, Outpatient. |
GAF and CGI-S Survival Scores
For IP/IOP patients, those with better GAF (higher) scores were more likely to remain in treatment, while for OPs, those with very poor GAF scores were more likely to leave prematurely and rapidly (Supplemental Figure 1A and B). In the IP/IOP cohort, for the GAF groups of 1–30, 31–40, 41–50, and 51–100, the survival probability at one month was 44%, 51%, 54%, and 63%, respectively. In the OP, the corresponding probabilities were 17%, 52%, 63%, and 52%, respectively. Regardless of the setting of BUP initiation, those with greater illness severity (CGI-S) (higher) scores had greater risk of attrition (Supplemental Figure 1C and D).
Sociodemographic Factors
Regardless of the site of BUP initiation, males were more likely than females to drop out of treatment. For the IP/IOP cohort, the survival probabilities for females and males at one month were 57% and 48%, respectively; for OPs, the corresponding probabilities were 67% and 62%, respectively. At year’s end, IP/IOP survival probabilities were 5% and 3%, respectively, while for OPs they were 17% and 12%, respectively (Supplemental Figure 2A and B).
Overall, younger patients were more likely to drop out than older patients in the IP/IOP cohort, while age was unrelated to dropout in the OP cohort. For the IP/IOP cohort, for the age groups 16–24, 25–34, 35–49, and 50+, the survival probabilities at one month were 48%, 54%, 57%, and 48%. At year’s end, the corresponding probabilities were 1%, 5%, 5%, and 3%, respectively (Supplemental Figure 3).
Due to imbalanced groups of race and ethnicity, comparisons of survival curves between these groups were not meaningful.
Comorbid Substance Use Disorder Diagnoses
To identify whether various SUD comorbidities (in addition to the OUD) affected treatment attrition, survival analysis compared patients with the specified comorbid SUD to those without any comorbid SUD. (Supplementary Table 2 details how comorbid SUDs were grouped based on the diagnostic codes).
Comorbid alcohol use disorder was associated with better retention if BUP was initiated in IOP/IP settings but was unrelated to retention for OP initiators. In the IP/IOP cohort, for the groups without and with an alcohol disorder diagnosis, the survival probabilities at one month were 49% and 54%, respectively, and at year’s end, corresponding probabilities for the IP/IOP cohorts were 3% and 9%, respectively (Supplemental Figure 4A and B).
Comorbid stimulant use disorder was associated with better retention when BUP was initiated in IP/IOP settings. For OPs, those with comorbid stimulant disorders were more likely to drop out than those without SUD comorbidity. In the IP/IOP cohort, for the groups without and with a diagnosis of SUD, the survival probabilities at one month were 49% and 58%, respectively. In OP initiators, the corresponding probabilities were 66% and 55%, respectively. At year’s end for the IP/IOP cohort, the corresponding probabilities were 3% and 5%, respectively, while those for the OP initiators were 15% and 9%, respectively (Supplemental Figure 4C and D).
Comorbid cannabis use disorder did not affect dropout for IP/IOP initiators but raised the risk of dropout for OP initiators. In the OP cohort, for the groups without and with a diagnosis of a cannabis use disorder, the survival probabilities at one month were 66% and 54%, respectively; and at year’s end were 15% and 8%, respectively.
Comorbid sedative/hypnotic use disorder was unrelated to attrition regardless of initiation setting.
Comorbid Psychiatric Diagnoses and Treatments
The number of comorbid psychiatric conditions (other than SUD) had no effect on attrition from BUP medication treatment for the OP cohort. For the IP/IOP cohort, patients diagnosed with a higher number of psychiatric conditions were less likely to drop out. The survival probabilities at one month for those with 0, 1–2, and 3+ other psychiatric comorbidities were 47%, 52%, and 63%, respectively (Supplemental Figure 5).
When BUP was initiated in IOP/IP settings, the number of prescribed psychotropic medications was unrelated to attrition. In OP settings, patients prescribed more psychotropic medications were more likely to drop out than those prescribed fewer. In the OP cohort, the survival probabilities at one month for those prescribed 0, 1–2, and 3+ psychotropics were 66%, 65%, and 59%, respectively. For OPs at year’s end, corresponding probabilities were 17%, 10%, and 9%, respectively (Supplemental Figure 6A and B).
In both settings, patients prescribed any non-psychotropic medication were more likely to leave BUP treatment than those prescribed none. For the IP/IOP cohort, survival probabilities at one month were 40% and 53%, respectively. For OPs, corresponding probabilities were 49% and 65%, respectively. The corresponding probabilities were 2% and 4% at year’s end, respectively, for the IP/IOP cohort, and 7% and 14%, respectively, for the OP cohort (Supplemental Figure 6C and D).
Overall Pattern of BUP Dosing
Supplemental Figure 7 summarizes the number of patients undergoing various numbers of BUP dose changes in each setting (IP/IOP and OP). Most patients who initiated as OPs did not have a dose change. Few patients had more than three dose changes.
To visualize the dosing trajectories in relation to periods of retention in treatment, patients were grouped as early (≤30 days), medium-term (31–180 days), and late-term dropouts (181–360 days), or 1-year completers. For each patient, both the initial dose prescribed and the slope for dose adjustments thereafter were computed based upon all administered doses. Greater degrees and faster rates of dose increases elevate the slope (a + slope indicates increasing dose) (Figure 3A). A linear function was used to describe dosing trajectories since most patients were prescribed fewer than four different doses.
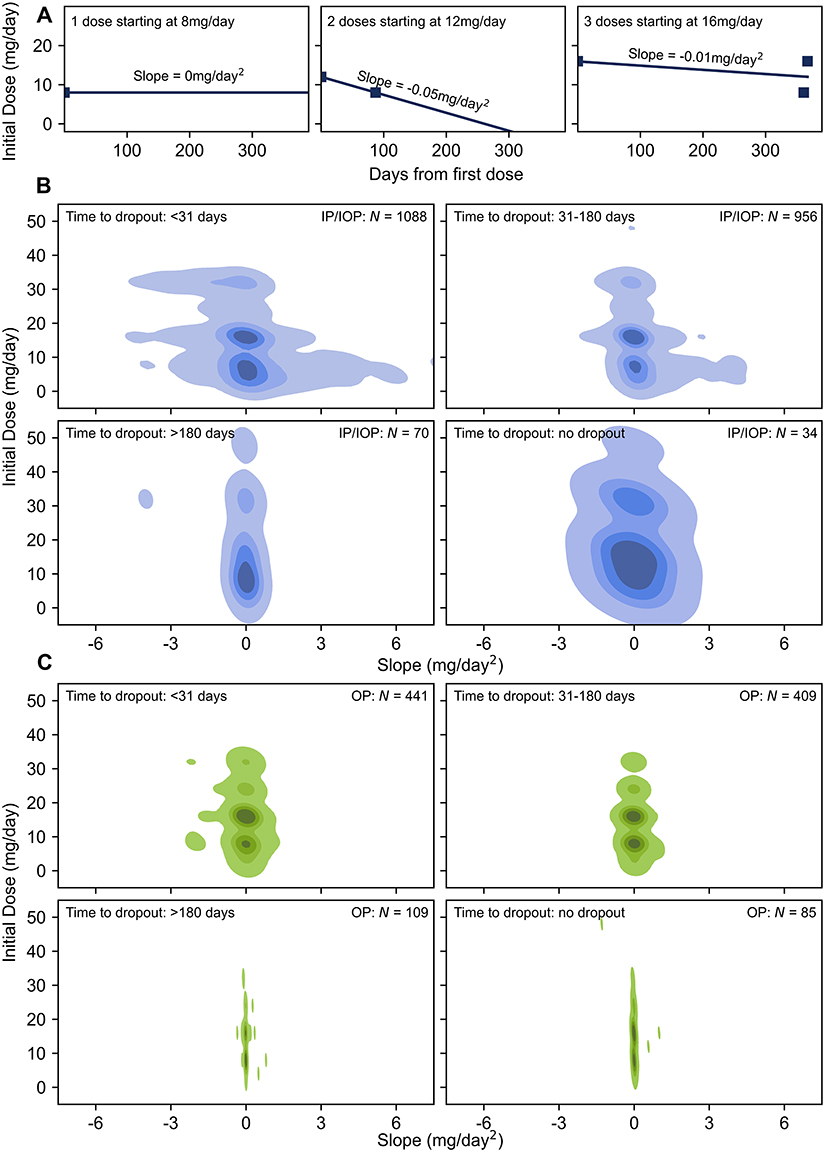 |
Figure 3 Overall dosing patterns, heatmaps, showing that the IP/IOP cohort exhibited a greater rate of dose change. Abbreviations: BUP, buprenorphine; IP, Inpatient; IOP, Intensive Outpatient; OP, Outpatient; 2D-KDE, 2-Dimensional Kernel Density Estimation. Notes: Panel (A) illustrates slope calculation in 3 scenarios: the first scenario is initially prescribed only a single 8 mg dose of BUP. The slope is 0 mg/day 2. The second scenario had two different doses – 12 mg/day initially followed by a second 8mg/day dose on day 88; slope was calculated −0.05 mg/day 2. The third scenario had an initial dose at 16 mg/day, a second dose lowered to 8 mg/day on day 361, and a third dose increased back to 16 mg/day on day 367. The slope is calculated −0.01 mg/day 2. Panels (B) and (C) illustrate the initial BUP doses and slopes calculated from each patient in the IP/IOP and OP cohorts, respectively, using a 2D-KDE plot, with slope on the x-axis and the initial dose on the y-axis. Regions with darker color represent areas with higher patient densities. The plots estimate the overall dosing trajectory patterns for the different cohorts, within their different attrition times. |
Most IP/IOP and OP patients were initially prescribed 8 to 16 mg/day. There were no meaningful differences in initial doses between early-, midterm-, and later-attritting patients in either the OP or IP/IOP groups.
The initial dosing pattern and the pattern of dose changes over time appear to diverge between the IP/IOP group and the OP group. Both the magnitude of dose changes (greater for IP/IOP initiators) and the times between dose changes (briefer for IP/IOP) distinguished those initiating in IP/IOP and OP settings. These differences are consistent with clinical practice as patients can be more closely monitored in IP/IOP settings for safety and efficacy. Further, OPs underwent a lower rate of dosing changes overall, as seen in the smaller spread on the x-axis representing the slope (Figure 3B and C).
Dosing Trajectory
Overall, 2146 IP/IOP-initiating participants (Figure 4) and 1042 OP-initiating participants (Figure 5) received an initial BUP dose (dose 0). In both Figures 4 and 5, panels (A), (B), (C), and (E) have plots aligned based on a change in the BUP dose as annotated in panel (C) by Dose 0 or baseline dose, the first dose change thereafter (Dose 1), and subsequent dose changes (Doses 2, 3, and 4).
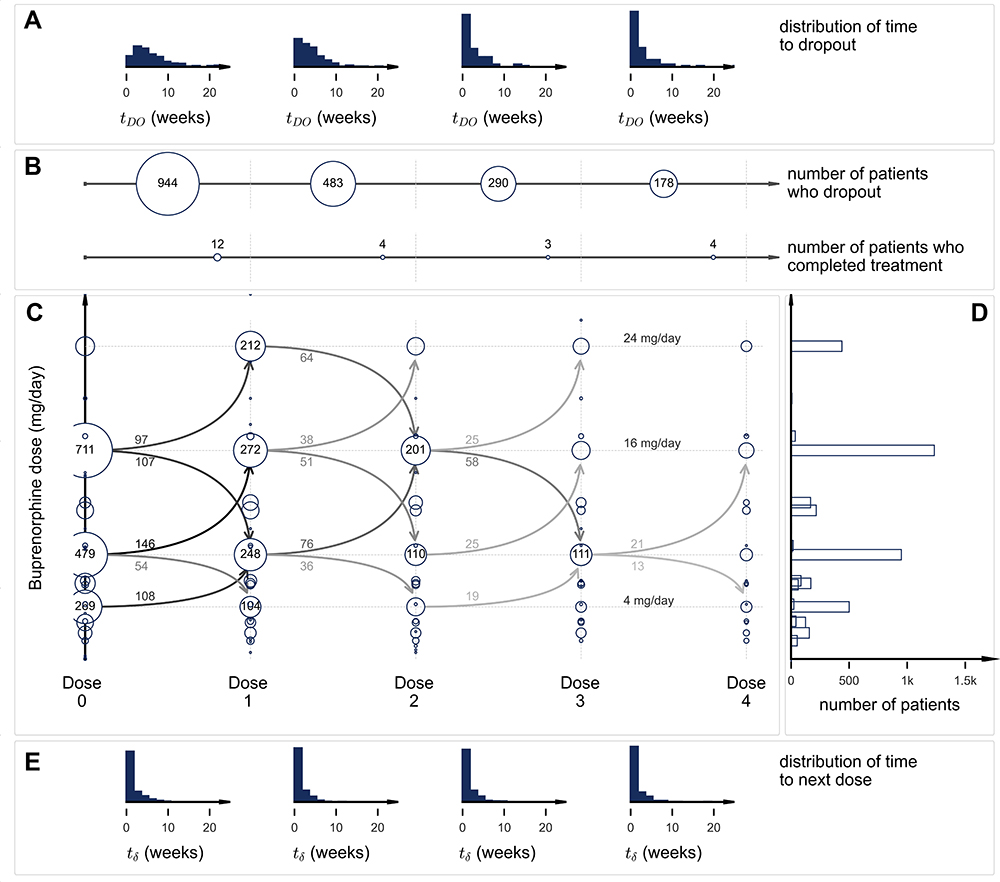 |
Figure 4 IP/IOP Dosing Cohort (n=2146) showing that most of the IP/IOP cohort started at 16 mg/day and had varied dose trajectories. Abbreviations: IP, Inpatient; IOP, Intensive Outpatient; BUP, buprenorphine. Notes: Each histogram in panel (A) describes the distribution of weeks to dropout following each new dose. The first histogram describes the distribution of weeks to dropout following the initial BUP baseline dose (Dose 0). Subsequent histograms describe the distribution of weeks to dropout following the first BUP dose change (Dose 1), the second (Dose 2) and the third (Dose 3). Panel (B) consists of two sets of plots. The first set summarizes the number of patients who dropped out after each dose (Doses 0–3). For example, 944/2146 (43.99%) of IP/IOP initiating patients dropped out after only the first dose (between Doses 0 and 1); 482/1190 (40.50%) of participants dropped out between the first and second dose changes (Dose 1 to Dose 2); and so on. The second set summarizes the number of patients who completed treatment after each dose (Doses 0–3). For example, 12/2146 (0.006%) of patients completed the full year of treatment after receiving their first dose without needing to change to a new dose; 4/1190 (0.003%) patients completed treatment after taking the second dose that was different from the first, and so on. Panel (C) (modified trellis plot) depicts the number of patients who were prescribed a specific BUP dose on each of the dosing occasions. The y-axis represents the prescribed dose in mg/day. The presence of a circle represents that a particular number of patients have been prescribed a particular dose of medication at the baseline dose (“Dose 0”) and at subsequent dose changes (“Dose 1” – “Dose 4”). Circle sizes are proportional to the number of patients prescribed a particular dose. For common doses, the circles are large, and the numbers of patients so prescribed are noted within the circle. When a significant number of patients change from one dose to another, this transition is represented by an arrow that points from a previous dose to the next dose. The number of patients who transition from one dose to another is provided close to the stem of the arrow. The opacity of the arrow is proportional to the number of patients who make a particular transition from one dose to another. Panel (D) shows the total number of patients who were prescribed a particular dose (at any point within the one-year observation period). Panel (E) provides histograms that summarize the weeks taken to move to the next dose, following an earlier dose. For example, the first histogram represents the time between Dose 0 and the first dose change (Dose 1). |
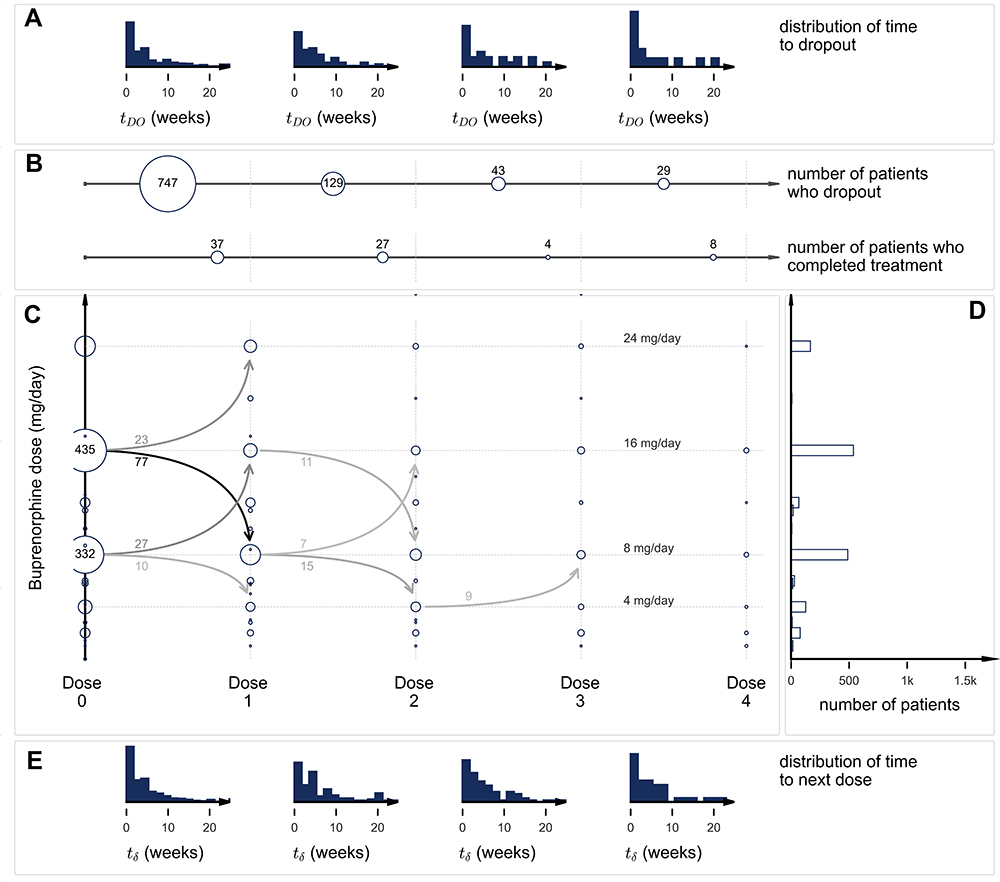 |
Figure 5 OP Dosing Cohort (n=1042), showing that most of the OP cohort started at 16 mg/day and most had decreased to 8 mg/day at the first dose change. Abbreviations: OP, outpatient; BUP, buprenorphine. Notes: Each histogram in panel (A) describes the distribution of weeks to dropout following each new dose. The first histogram describes the distribution of weeks to dropout following the initial BUP baseline dose (Dose 0). Subsequent histograms describe the distribution of weeks to dropout following the first BUP dose change (Dose 1), the second (Dose 2) and the third (Dose 3). Panel (B) consists of two sets of plots. The first set summarizes the number of patients who dropped out after each dose (Doses 0–3). For example, 747/1042 (71.69%) of participants dropped out after only the first dose (between Doses 0 and 1); 128/258 (49.61%) of participants dropped out between the first and second dose changes (Dose 1 to Dose 2); and so on. The second set summarizes the number of patients who completed treatment after each dose (Doses 0–3). For example, 37/1042 (0.036%) of patients completed the full year of treatment after receiving their first dose without needing to change to a new dose; 27/258 (0.105%) patients completed treatment after taking the second dose that was different from the first, and so on. Panel (C) (modified trellis plot) depicts the numbers of patients who were prescribed a specific BUP dose on each of the dosing occasions. The y-axis represents the prescribed dose in mg/day. The presence of a circle represents that a particular number of patients have been prescribed a particular dose of medication at the baseline dose (“Dose 0”) and at subsequent dose changes (“Dose 1” – “Dose 4”). Circle sizes are proportional to the number of patients prescribed a particular dose. For common doses, the circles are large, and the numbers of patients so prescribed are noted within the circle. When a significant number of patients change from one dose to another, this transition is represented by an arrow that points from a previous dose to the next dose. The number of patients who transition from one dose to another is provided close to the stem of the arrow. The opacity of the arrow is proportional to the number of patients who make a particular transition from one dose to another. Panel (D) shows the total number of patients who were prescribed a particular dose (at any point within the one-year observation period). Panel (E) provides histograms that summarize the weeks taken to move to the next dose, following an earlier dose. For example, the first histogram represents the time between Dose 0 and the first dose change (Dose 1). |
For IP/IOPs, most patients dropped out within the first few weeks after initiating BUP. Overall, 33.4% began with 16 mg/day. Of these patients, 97 had a dose change to 24 mg/day, 107 had a dose change to 8 mg/day, and 126 had dose changes to other doses. The number of patients who changed to other doses was significantly smaller than the rest and is not shown for the sake of clarity. Hence, 381 dropped out before any dose change. Most dose changes occurred within a few weeks of the prior dose change (Figures 4 and 5 – panel E). After two dose changes, 66.4% had dropped out. Few people had meaningful dose changes after the first two.
For OPs, most dropped out of treatment within the first 4–5 weeks regardless of the initial dose. The largest number, 41.7%, began with 16 mg/day and remained at that dose. About a quarter of patients (n = 100) were prescribed a second, different dose. Of these, 23% (n = 23) received an increase in dose to 24 mg/day and 77% (n = 77) received a decrease in dose.
Predictive Model on Dosing Cohort
A discriminative nonlinear Random Forest Regression model was used to predict the time to dropout (Figure 6A). The training and test set results were in substantial agreement for predicting attrition within three months following BUP initiation (as might be expected since most left within this period, and other psychosocial factors likely contributed more to subsequent treatment departures).
 |
Figure 6 Predictive Model performance, showing precision and recall (analogous to sensitivity) to be 90.5% and 75.2%, Panel (A) shows the box plot for predicted values of days to dropout for both training and test sets. Box plot is a five-number summary of a set of data which includes minimum, first quartile, median, third quartile and maximum. Panel (B) provides the confusion matrix to show the number of correctly and wrongly predicted values by the model. The days to dropout window have been divided into less than and equal to 3 months and greater than 3 months in this figure. |
To quantify the model performance in identifying early dropouts, predictions for the training dataset, along with the predicted values, were binned into two classes – those who dropped out within the first 3 months and those who dropped out after that. Figure 6B (the confusion matrix) revealed precision and recall (analogous to sensitivity) to be 90.5% and 75.2%, respectively. Thus, about ¾ of those who dropped out within 3 months were identified with 90% certainty by the model.
Baseline GAF, CGI-S, number of (psychotropic and non-psychotropic) medications, initial BUP dose (mg/day), BUP initiation setting (OP or IP/IOP), gender, 1–2 non-SUD comorbidities, and comorbid alcohol use disorder were the most important parameters that contributed to the regression estimates based on the “feature importance” property of the trained Random Forest.23
A SHapley Additive exPlanations (SHAP) value24 was calculated for each patient to determine qualitatively how a particular parameter affected the model’s predictive capabilities. Higher SHAP values indicate longer times to dropout.
Figure 7 shows that higher (better functioning) GAF scores (range 0–100) (mostly yellow) are associated with longer times to dropout; lower GAF scores are associated with shorter times to dropout, which is consistent with the survival curves analyses (Supplemental Figure 1). Those with lower CGI-S scores (less severe) tended to stay longer in treatment, as expected clinically and from the survival curves in Supplemental Figure 1C and D. Patients prescribed more psychotropic, and non-psychotropic medications did worse in terms of retention. In terms of retention based on predictive modelling results, BUP dose had minimal effect the majority of the time. The setting of BUP initiation significantly contributed to the prediction of dropouts above and beyond the CGI-S and GAF scores that also differentiated the two settings.
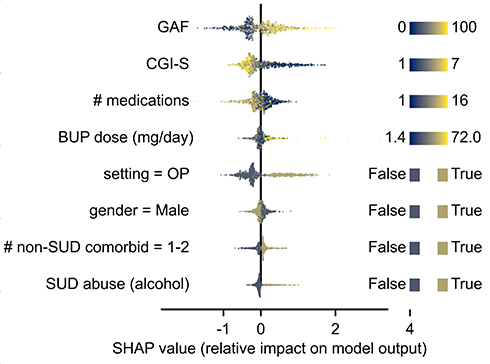 |
Figure 7 Feature importance scorea, showing the importance of each feature in decreasing order. aThe x-axis represents the importance of each parameter in contributing to prediction of time to dropout. Abbreviations: GAF, Global Assessment of Functioning; CGI-S, Clinical Global Impression-Severity; BUP, buprenorphine; OP, Outpatient; SUD, Substance Use Disorder; SHAP, SHapley Additive exPlanations. Notes: Higher SHAP values indicate longer times to dropout. Medications include both psychotropic and non-psychotropic medications. #Comorbid includes non-SUD psychiatric comorbidities. |
Discussion
The EHRs of a large representative sample of adults with OUD revealed that most OUD patients are not benefiting from BUP treatment due to high and rapid attrition. Survival analyses revealed that attrition was twice as high when BUP was initiated in IP/IOP than in OP settings. After two months, only 25% of IOP/IP initiators were still in treatment compared to 50% of OP initiators. After six months, the corresponding percentages were 8% and 26%, respectively, and 3% and 13%, respectively, after one year. Regardless of where BUP was initiated, females, whites, and those with less severe OUD, better function, or taking no non-psychotropic medications were more likely to stay in treatment.
On the other hand, various clinical and sociodemographic parameters were differentially associated with treatment attrition based on the setting in which BUP was initiated. For example, comorbid SUD was associated with greater retention when BUP was initiated in OP settings but poorer retention if initiated in IP/IOP settings. Comorbid alcohol use disorder was associated with greater retention but only for those initiating BUP in IP/IOP settings. Conversely, the number of prescribed psychotropic medications was unrelated to retention for IP/IOP initiators, but for OPs, those being prescribed more psychotropic medications were at greater risk for attrition.
Our overall attrition rates were higher than some rates reported in some large Medicare claims database analyses. For example, Manhapra et al25 reported that 15% were lost in the first 30 days and another 40% did not complete the year, leaving 45% who completed a year of BUP. On the other hand, Presnall et al26 used Missouri Medicaid data to compare attrition among different types of OUD treatment programs that used BUP in over 11,000 patients. The median retention in treatment was 59 days, which closely approximates the 50% retention that we found for those who initiated BUP as OPs. Analogous to our finding that treatment setting mattered in terms of retention, Presnall et al26 also found that retention differed across treatment program types. The median retention time was 126 days for patients in an office-based medical setting practice compared to only 22 days when BUP was added to well established, primarily psychosocial treatment programs.
We found that men, blacks, and younger patients (especially IP/IOPs initiators) were at greater risk of attrition, which is consistent with other reports.26–33 However, this study and the aforementioned reports do not provide an all-encompassing look at structural and implicit biases, thus potentially confounding some of our demographic results. Our findings are also consistent with studies34–36 which found higher attrition rates during BUP treatment for OUD in the context of more concurrent SUDs (eg, stimulant or alcohol use disorders).
Practice guidelines recommend that clinically effective BUP doses should be achieved as rapidly as possible to alleviate withdrawal symptoms and cravings.37 Previous largely outpatient studies have shown that higher BUP doses are usually associated with better retention.38 Gradual induction over several days has led to higher dropout rates during the induction period.39 Higher BUP induction doses significantly decrease relapse rates and increase the percentage of patients achieving maintenance treatment. For example, in an observational study, Leonardi et al39 found that more than half (51.2%) of all patients who were induced with 2 mg/day of BUP relapsed, compared to 39.2% of those who initiated on 4 mg/day, 31.5% of those on 8 mg/day, and 20.6% of those on 10 mg/day. Overall, nearly all (89.7%) patients induced at 16 mg/d completed the 3-day induction.
Further, it is recognized that the initial dose and its subsequent changes are affected by setting, patient, and clinical factors such as recent opioid use, concurrent sedative use,40 current mental illness, psychotropic medication use, and other clinical factors,11 in addition to the above-noted sociodemographic factors.
This study found that initial dose choices and the nature of subsequent dose changes differed depending on where BUP was initiated (more IP/IOP initiators received higher initial doses and more rapid dose changes). We found that 55% of IP/IOP initiates and 73% of OP initiates started at either 8 or 16 mg/day. For IP/IOP initiates starting at 16 mg/day, the second dose was as likely to increase as a decrease, while for OPs initiating at 16mg/day, a dose reduction was three times more likely than an increase. For IP/IOP patients starting at 8 mg/day, a dose increase was three times more likely than a decrease, as was the case for OP initiators.
Our survival analysis also showed that a variety of baseline clinical and sociodemographic parameters were differentially associated with attrition. These factors likely differentially interact and affect attrition across different individuals in different settings. Therefore, we used nonlinear modelling to identify specific parameters that characterized early attritors (within three months of BUP initiation). The model entailed eight parameters, the most important of which were baseline OUD severity (CGI-S), function (GAF), initial BUP dose, setting at BUP initiation, number of psychotropic and non-psychotropic medications, and gender. The model performance was clinically useful given its 90% precision for 75% of those who left within 3 months, which would enable targeting of interventions to enhance retention in treatment.
These results confirm that both patient risk factors and the treatment environment are valuable in predicting treatment drop-out. As suggested by a systematic review of 112 studies by Brorson et al,6 the most consistent patient factors associated with higher risk of dropout from addiction treatment include younger age, cognitive deficits, lower education level, polysubstance use, a diagnosis of antisocial or histrionic personality disorder, lower therapeutic alliance, and lower treatment satisfaction. This systematic review also briefly discussed treatment process factors and the impact of the treatment environment. Our results provide further details on how treatment initiation between IP/IOP and OP settings may influence treatment dropout.
Limitations
Study limitations include: (1) Data were collected over a decade, so findings may not generalize to today’s OUD treatment programs; (2) Several factors that could influence treatment attrition were not captured (eg, treatment adherence, dose frequency, transportation challenges, friendship patterns, current stressors, social adjustment, perceived self-efficacy, service satisfaction, employment status, housing status, criminal record, insurance status, etc.);41,42 (3) Study was conducted based on observational data and patient-level factors may contribute to how treatment variables affect attrition; (3) Treatment setting was inferred from the visit/week frequency; (4) Some patients who dropped out could have returned for treatment.; (5) GAF and CGI-S measures were obtained by clinicians without reliability training; (6) GAF measures were collected more intermittently than the CGI-S, such that GAF scores may not have been missing at random, which could have affected the model and the imputation of the GAF scores.
Conclusion
Only 25–50% of OUD patients who began BUP were still in BUP treatment two months later. Most (75%) of patients who left the treatment within the first three months were identifiable (90% precision) using a few parameters (eg, baseline function, OUD severity, initial BUP dose, and the number of concomitant psychotropic medications). Major innovations are needed to reduce treatment attrition by OUD patients treated with BUP.
Abbreviations
BUP, buprenorphine; CGI-S, Clinical Global Impression – Severity; EHR, Electronic Health Records; GAF, Global Assessment of Functioning; IOP, Intensive Outpatient; IP, Inpatient; OP, Outpatient; OUD, Opioid Use Disorder; SAMHSA, Substance Abuse and Mental Health Services Administration; SUD, Substance Use Disorder; 2D-KDE, 2-Dimensional Kernel Density Estimation.
Acknowledgments
The authors appreciate the work of Jamie Avant, D.O., and Chelsea Angelocci, D.O. on the appendices and medication classification. We also acknowledge the editing services of Jon Kilner, MS, MA (Pittsburgh).
Author Contributions
All authors made a significant contribution to the work reported, whether that is in the conception, study design, execution, acquisition of data, analysis and interpretation, or in all these areas; took part in drafting, revising or critically reviewing the article; gave final approval of the version to be published; have agreed on the journal to which the article has been submitted; and agree to be accountable for all aspects of the work.
Funding
This study was conducted with no external financial support.
Disclosure
A. John Rush has received consulting fees from Compass Inc., Curbstone Consultant LLC, Emmes Corp., Evecxia Therapeutics, Inc., Holmusk, Johnson and Johnson (Janssen), Liva-Nova, Neurocrine Biosciences Inc., Otsuka-US; speaking fees from Liva-Nova, Johnson and Johnson (Janssen); personal fees from Sunovion, outside the submitted work; and royalties from Guilford Press and the University of Texas Southwestern Medical Center, Dallas, TX (for the Inventory of Depressive Symptoms and its derivatives). He is also named co-inventor on two patents: US Patent No. US7795033 issued to The United States of America as represented by the Department of Health and Human Services, Washington, DC (US); Board of Regents, The University of Texas System, Austin, TX (US): Methods to Predict the Outcome of Treatment with Antidepressant Medication, Inventors: McMahon FJ, Laje G, Manji H, Rush AJ, Paddock S, Wilson AS; and US Patent No. US7906283 issued to The United States of America as represented by the Department of Health and Human Services, Washington, DC (US); Board of Regents, the University of Texas: Methods to Identify Patients at Risk of Developing Adverse Events During Treatment with Antidepressant Medication, Inventors: McMahon FJ, Laje G, Manji H, Rush AJ, Paddock S. Sheryl Ker, Anisha Balani, Sankha Subhra Mukherjee, Miguel E. Rentería, and Joydeep Sarkar are employees of Holmusk. Jennifer Hsu, Dustin DeMoss, Mehreen Khan, Sara Elchehabi, and Seth Huffhines have no disclosures to report. The authors report no other potential conflicts of interest in this work.
References
1. Mark TL, Woody GE, Juday T, Kleber HD. The economic costs of heroin addiction in the United States. Drug Alcohol Depend. 2001;61(2):195–206. doi:10.1016/S0376-8716(00)00162-9
2. Chandler RK, Fletcher BW, Volkow ND. Treating drug abuse and addiction in the criminal justice system improving public health and safety. JAMA. 2009;301(2):183–191. doi:10.1001/jama.2008.976
3. Bell J. Medications in Recovery: Re-Orientating Drug Dependence Treatment Appendix C – Opioid Substitution Treatment and Its Effectiveness: Review of the Evidence. National Treatment Agency for Substance Misuse; 2012.
4. Substance Abuse and Mental Health Services Administration. Results from the 2019 National Survey on Drug Use and Health: detailed tables. Available from: https://www.samhsa.gov/data/report/2019-nsduh-detailed-tables.
5. Simoens S, Matheson C, Bond C, et al. The effectiveness of community maintenance with methadone or buprenorphine for treating opiate dependence. Br J Gen Pract. 2005;55(511):139.
6. Brorson HH, Ajo Arnevik E, Rand-Hendriksen K, Duckert F. Drop-out from addiction treatment: a systematic review of risk factors. Clin Psychol Rev. 2013;33(8):1010–1024. PMID: 24029221. doi:10.1016/j.cpr.2013.07.007
7. Kleber HD, Weiss RD, Anton RF, et al. Treatment of patients with substance use disorders, second edition. American Psychiatric Association. Am J Psychiatr. 2007;164(4Suppl):5–123. PMID: 17569411.
8. Bonhomme J, Shim RS, Gooden R, Tyus D, Rust G. Opioid addiction and abuse in primary care practice: a comparison of methadone and buprenorphine as treatment options. J Natl Med Assoc. 2012;104(7–8):342–350. doi:10.1016/s0027-9684(15)30175-9
9. D’AmoreD’Amore A, Romano F, Biancolillo V, et al. Evaluation of buprenorphine dosage adequacy in opioid receptor agonist substitution therapy for heroin dependence: first use of the BUprenorphine-naloxone Dosage Adequacy eVAluation (BUDAVA) questionnaire. Clin Drug Investig. 2012;32(7):427–432. doi:10.2165/11633230-000000000-00000
10. Farmer CM, Lindsay D, Williams J, et al. Practice guidance for buprenorphine for the treatment of opioid use disorders: results of an expert panel process. Subst Abus. 2015;36(2):209–216. PMID: 25844527; PMCID: PMC4470850. doi:10.1080/08897077.2015.1012613
11. Maremmani I, Rolland B, Somaini L, et al. Buprenorphine dosing choices in specific populations: review of expert opinion. Expert Opin Pharmacother. 2016;17(13):1727–1731. PMID: 27376622. doi:10.1080/14656566.2016.1209486
12. Gowing L, Ali R, White JM, Mbewe D. Buprenorphine for managing opioid withdrawal. Cochrane Database Syst Rev. 2017;2(2):CD002025. PMID: 28220474; PMCID: PMC6464315. doi:10.1002/14651858.CD002025.pub5
13. Gersing K, Krishnan R. Clinical computing: clinical management research information system (CRIS). Psychiatr Serv. 2003;54(9):1199–1200. doi:10.1176/appi.ps.54.9.1199
14. Berkeley University of California; 2021. HIPAA PHI: definition of PHI and list of 18 identifiers. UC Berkeley Committee for Protection of Human Subjects. Available from: https://cphs.berkeley.edu/hipaa/hipaa18.html.
15. Center for Substance Abuse Treatment. Clinical guidelines for the use of buprenorphine in the treatment of opioid addiction. In: Treatment Improvement Protocol (TIP) Series 40. DHHS Publication No. (SMA) 04-3939. Rockville, MD: Substance Abuse and Mental Health Services Administration; 2004.
16. American Psychiatric Association. DSM-III: Diagnostic and Statistical Manual of Mental Disorders, 3rd Edition. Cambridge: Cambridge University Press; 1985.
17. American Psychiatric Association. Diagnostic and Statistical Manual of Mental Disorders, DSM-III-R Revised Edition. Cambridge: Cambridge University Press; 1987.
18. Aas IM. Guidelines for rating global assessment of functioning (GAF). Ann Gen Psychiatr. 2011;10:2. doi:10.1186/1744-859X-10-2
19. Guy W. Clinical global impressions. In: ECDEU Assessment Manual for Psychopharmacology—Revised. Rockville, MD: U.S. Department of Health, Education, and Welfare; Public Health Service, Alcohol; Drug Abuse, and Mental Health Administration; National Institute of Mental Health; Psychopharmacology Research Branch; Division of Extramural Research Programs. OCLC 2344751. DHEW Publ No ADM 76–338 – via Internet Archive; 1976:218–222.
20. Busner J, Targum SD. The clinical global impressions scale: applying a research tool in clinical practice. Psychiatry (Edgmont). 2007;4(7):28–37.
21. Breiman L. Random forests. Mach Learn. 2001;45:5–32. doi:10.1023/A:1010933404324
22. Pedregosa F, Varoquaux G, Gramfort A, et al.Scikit-learn: machine learning in python. JMLR. 2011;12:2825–2830.
23. Feature importances with a forest of trees [Internet]. Scikit learn; 2020. Available from: https://scikit-learn.org/stable/auto_examples/ensemble/plot_forest_importances.html.
24. Lundberg SM, Lee S-I. A unified approach to interpreting model predictions. Adv Neural Inf Process Syst. 2017;30:4765–4774.
25. Manhapra A, Agbese E, Leslie DL, Rosenheck RA. Three-year retention in buprenorphine treatment for opioid use disorder among privately insured adults. Psychiatr Serv. 2018;69(7):768–776. doi:10.1176/appi.ps.201700363
26. Presnall NJ, Wolf DAPS, Brown DS, Beeler-Stinn S, Grucza RA. A comparison of buprenorphine and psychosocial treatment outcomes in psychosocial and medical settings. J Subst Abuse Treat. 2019;104:135–143. PMID: 31370977; PMCID: PMC7075557. doi:10.1016/j.jsat.2019.06.010
27. Manhapra A, Petrakis I, Rosenheck R. Three-year retention in buprenorphine treatment for opioid use disorder nationally in the Veterans Health Administration. Am J Addict. 2017;26(6):572–580. pmid: 28472543. doi:10.1111/ajad.12553
28. Pizzicato LN, Hom JK, Sun M, Johnson CC, Viner KM. Adherence to buprenorphine: an analysis of prescription drug monitoring program data. Drug Alcohol Depend. 2020;216:108317. PMID: 33035714. doi:10.1016/j.drugalcdep.2020.108317
29. Huhn AS, Berry MS, Dunn KE. Review: sex-based differences in treatment outcomes for persons with opioid use disorder. Am J Addict. 2019;28(4):246–261. doi:10.1111/ajad.12921
30. Schepis TS, Hakes JK. Age of initiation, psychopathology, and other substance use are associated with time to use disorder diagnosis in persons using opioids nonmedically. Subst Abus. 2017;38(4):407–413. doi:10.1080/08897077.2017.1356791
31. Ledgerwood DM, Lister JJ, LaLiberte B, Lundahl LH, Greenwald MK. Injection opioid use as a predictor of treatment outcomes among methadone-maintained opioid-dependent patients. Addict Behav. 2019;90:191–195. pmid: 30412910. doi:10.1016/j.addbeh.2018.10.046
32. Weinstein ZM, Kim HW, Cheng DM, et al. Long-term retention in Office Based Opioid Treatment with buprenorphine. J Subst Abuse Treat. 2017;74:65–70. pmid: 28132702. doi:10.1016/j.jsat.2016.12.010
33. Witkiewitz K, Vowles KE. Alcohol and opioid use, co-use, and chronic pain in the context of the opioid epidemic: a critical review. Alcohol Clin Exp Res. 2018;42(3):478–488. PMID: 29314075; PMCID: PMC5832605. doi:10.1111/acer.13594
34. Ellis MS, Kasper ZA, Cicero TJ. Twin epidemics: the surging rise of methamphetamine use in chronic opioid users. Drug Alcohol Depend. 2018;193:14–20. doi:10.1016/j.drugalcdep.2018.08.029
35. Lin LA, Bohnert AS, Blow FC, et al. Polysubstance use and association with opioid use disorder treatment in the US Veterans Health Administration. Addiction. 2021;116(1):96–104. doi:10.1111/add.15116
36. Annual surveillance report of drug-related risks and outcomes — United States surveillance special report [Internet]. Atlanta: Centers for Disease Control and Prevention; 2019. Available from: https://www.cdc.gov/drugoverdose/pdf/pubs/2019-cdc-drug-surveillance-report.pdf.
37. Kampman K, Jarvis M. American Society of Addiction Medicine (ASAM) national practice guideline for the use of medications in the treatment of addiction involving opioid use. J Addict Med. 2015;9(5):358–367. doi:10.1097/ADM.0000000000000166
38. Fareed A, Vayalapalli S, Casarella J, Drexler K. Effect of buprenorphine dose on treatment outcome. J Addict Dis. 2012;31(1):8–18. PMID: 22356665. doi:10.1080/10550887.2011.642758
39. Leonardi C, Hanna N, Laurenzi P, et al. Multi-centre observational study of buprenorphine use in 32 Italian drug addiction centres. Drug Alcohol Depend. 2008;94(1–3):125–132. doi:10.1016/j.drugalcdep.2007.10.017
40. Lintzeris N, Clark N, Winstock A, et al. National clinical guidelines and procedures for the use of buprenorphine in the maintenance treatment of opioid dependence; 2006. Available from: https://insight.qld.edu.au/file/184/download.
41. DeMauro SB, Bellamy SL, Fernando M, et al. Patient, family, and center-based factors associated with attrition in neonatal clinical research: a prospective study. Neonatology. 2019;115(4):328–334. PMID: 30836358; PMCID: PMC6657796. doi:10.1159/000494105
42. Puttkammer NH, Zeliadt SB, Baseman JG, et al. Patient attrition from the HIV antiretroviral therapy program at two hospitals in Haiti. Rev Panam Salud Publica. 2014;36(4):238–247. PMID: 25563149; PMCID: PMC4745087.
 © 2021 The Author(s). This work is published and licensed by Dove Medical Press Limited. The
full terms of this license are available at https://www.dovepress.com/terms
and incorporate the Creative Commons Attribution
- Non Commercial (unported, 3.0) License.
By accessing the work you hereby accept the Terms. Non-commercial uses of the work are permitted
without any further permission from Dove Medical Press Limited, provided the work is properly
attributed. For permission for commercial use of this work, please see paragraphs 4.2 and 5 of our Terms.
© 2021 The Author(s). This work is published and licensed by Dove Medical Press Limited. The
full terms of this license are available at https://www.dovepress.com/terms
and incorporate the Creative Commons Attribution
- Non Commercial (unported, 3.0) License.
By accessing the work you hereby accept the Terms. Non-commercial uses of the work are permitted
without any further permission from Dove Medical Press Limited, provided the work is properly
attributed. For permission for commercial use of this work, please see paragraphs 4.2 and 5 of our Terms.