Back to Journals » International Journal of Chronic Obstructive Pulmonary Disease » Volume 13
Phenotyping COPD exacerbations using imaging and blood-based biomarkers
Authors Alotaibi NM, Chen V ![]() , Hollander Z
, Hollander Z ![]() , Hague CJ, Murphy DT
, Hague CJ, Murphy DT ![]() , Leipsic JA, DeMarco ML, FitzGerald JM, McManus BM, Ng RT, Sin DD
, Leipsic JA, DeMarco ML, FitzGerald JM, McManus BM, Ng RT, Sin DD ![]()
Received 25 September 2017
Accepted for publication 30 November 2017
Published 8 January 2018 Volume 2018:13 Pages 217—229
DOI https://doi.org/10.2147/COPD.S152484
Checked for plagiarism Yes
Review by Single anonymous peer review
Peer reviewer comments 2
Editor who approved publication: Prof. Dr. Richard Russell
Nawaf M Alotaibi,1,2 Virginia Chen,1,3,4 Zsuzsanna Hollander,1,3,4 Cameron J Hague,5 Darra T Murphy,5 Jonathon A Leipsic,5 Mari L DeMarco,1,6 J Mark FitzGerald,7,8 Bruce M McManus,1,3,4,6 Raymond T Ng,4,9 Don D Sin1,3,7
1Centre for Heart Lung Innovation, James Hogg Research Centre, St Paul’s Hospital, Vancouver, BC, Canada; 2Division of Pulmonary Medicine, Department of Medicine, College of Medicine, King Saud University, Riyadh, Saudi Arabia; 3Institute for Heart Lung Health, 4PROOF Centre of Excellence, 5Department of Radiology, St Paul’s Hospital, 6Department of Pathology and Laboratory Medicine, 7Division of Respiratory Medicine, Department of Medicine, University of British Columbia, 8The Lung Centre, Vancouver General Hospital, 9Department of Computer Sciences, University of British Columbia, Vancouver, BC, Canada
Rationale: Acute exacerbations of chronic obstructive pulmonary disease (AECOPD) are caused by a variety of different etiologic agents. Our aim was to phenotype COPD exacerbations using imaging (chest X-ray [CXR] and computed tomography [CT]) and to determine the possible role of the blood tests (C-reactive protein [CRP], the N-terminal prohormone brain natriuretic peptide [NT-proBNP]) as diagnostic biomarkers.
Materials and methods: Subjects who were hospitalized with a primary diagnosis of AECOPD and who had had CXRs, CT scans, and blood collection for CRP and NT-proBNP were assessed in this study. Radiologist blinded to the clinical and laboratory characteristics of the subjects interpreted their CXRs and CT images. ANOVA and Spearman’s correlation were performed to test for associations between these imaging parameters and the blood-based biomarkers NT-proBNP and CRP; logistic regression models were used to assess the performance of these biomarkers in predicting the radiological parameters.
Results: A total of 309 subjects were examined for this study. Subjects had a mean age of 65.6±11.1 years, 66.7% of them were males, and 62.4% were current smokers, with a mean FEV1 54.4%±21.5% of predicted. Blood NT-proBNP concentrations were associated with cardiac enlargement (area under the curve [AUC] =0.72, P<0.001), pulmonary edema (AUC =0.63, P=0.009), and pleural effusion on CXR (AUC =0.64, P=0.01); whereas on CT images, NT-proBNP concentrations were associated with pleural effusion (AUC =0.71, P=0.002). Serum CRP concentrations, on the other hand, were associated with consolidation on CT images (AUC =0.75, P<0.001), ground glass opacities (AUC =0.64, P=0.028), and pleural effusion (AUC =0.72, P<0.001) on CT images. A serum CRP sensitivity-oriented cutoff point of 11.5 mg/L was selected for the presence of consolidation on CT images in subjects admitted as cases of AECOPD, which has a sensitivity of 91% and a specificity of 53% (P<0.001).
Conclusion: Elevated CRP may indicate the presence of pneumonia, while elevated NT-proBNP may indicate cardiac dysfunction. These readily available blood-based biomarkers may provide more accurate phenotyping of AECOPD and enable the discovery of more precise therapies.
Keywords: chronic obstructive pulmonary disease, exacerbation, biomarker, CT scan, chest X-ray
Introduction
Chronic obstructive pulmonary disease (COPD) remains a major public health problem. It is estimated to affect 384 million people worldwide, with a global prevalence of 11.7%,1 and is forecasted to be the fourth leading cause of death by 2030.2 Acute exacerbations of COPD (AECOPD) are among the leading causes of hospitalization in the USA and are the major cost driver for the illness, accounting for 50%–70% of total direct costs.3 Currently, the most serious AECOPD events are treated with antibiotics and/or systemic corticosteroids regardless of etiology of the AECOPD.4
Brain natriuretic peptides (BNPs and N-terminal prohormone brain natriuretic peptide [NT-proBNP]) are considered to be relevant biomarkers in acute coronary syndrome,5 heart failure (HF)6,7 and show potential utility in COPD. For example, in COPD, an elevated NT-proBNP is a strong predictor of early mortality among patients admitted to hospital with AECOPD, independently of other known prognostic indicators.8 BNPs have been found to correlate with several radiologically relevant endpoints including right ventricular enlargement detected on chest computed tomography (CT) in patients with acute pulmonary embolism9,10 and coronary atherosclerosis on angiography.11 C-reactive protein (CRP) is also an important biomarker in AECOPD. In a systematic review for AECOPD biomarkers,12 CRP was one of the most commonly studied biomarkers in AECOPD, and elevated concentrations have been found in AECOPD state compared to convalescence state. We have previously demonstrated that both NT-proBNP and CRP concentrations measured in blood are elevated in AECOPD compared to convalescence, and together they can reasonably discriminate between AECOPD requiring hospitalization compared to clinical stability with a cross-validated area under the curve (AUC) of 0.80, but their concentrations were only weakly related to each other,13 which may indicate that they might represent different phenotypes of AECOPD.
The aim of this study was to determine whether blood CRP and NT-proBNP represent different disease processes as determined on thoracic imaging for AECOPD, which could be potentially used for phenotyping AECOPD and lead to more tailored therapeutic decisions.
Materials and methods
Study population
The Rapid Transition Program (RTP) study details have been described previously.13 For this sub-study, we assessed subjects who were enrolled between July 2012 and October 2015. All subjects included in this study had a confirmed primary diagnosis of AECOPD as deemed by board-certified general internists or pulmonologists who cared for these subjects. All diagnoses were validated by chart review by at least one additional pulmonologist based on the criteria recommended by the Global initiative for Chronic Obstructive Lung Disease Committee.4 All the subjects included in this study received standard anti-exacerbation treatment during their hospitalization, including short-acting bronchodilators, prednisone, and antibiotics.
We retrospectively examined the associations between radiological parameters and the blood-based biomarkers NT-proBNP and CRP, in subjects who had had either chest X-rays (CXRs) or CT scans during their hospitalization, and biomarkers were measured no more than 10 days before or after their CXRs and CT scans (Figure 1). More details are provided in the Figure S1.
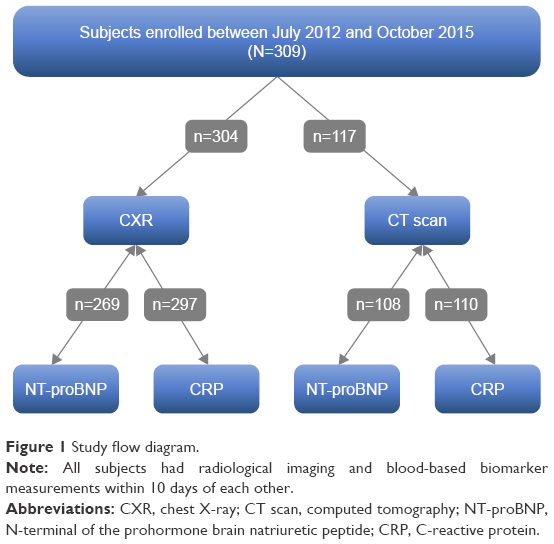 | Figure 1 Study flow diagram. |
The study is registered on ClinicalTrials.gov website with identifier: NCT02050022 (registered January 28, 2014). The study was approved by the University of British Columbia Clinical Research Ethics Board (certificate number H11-00786). Written informed consent was provided by each subject in accordance with the Ethics Board.
Specimens and measurement technique
After obtaining informed consent from the subjects, blood samples were collected in PAXgene® (Becton Dickinson, Franklin Lakes, NJ, USA), EDTA, and serum tubes on day 1 and day 3 of hospitalization, at discharge, and on day 30 and day 90 post-admission date. Blood components were processed as per standardized protocol and stored at −80°C until analysis. Serum CRP was measured via a high-sensitivity assay on the Advia® 1800 Chemistry System (Siemens Healthcare GmbH, Erlangen, Germany), in the Clinical Laboratory of St Paul’s Hospital (Department of Pathology and Laboratory Medicine, Vancouver, BC, Canada) following standard operating procedures. NT-proBNP was measured from EDTA whole blood specimens on the RAMP® 200 (Response Biomedical Corp, Vancouver, BC, Canada), which has a measurement range of 18–35,000 ng/L.
Baseline lung function measurements were performed at the time of convalescence (ie, at day 30 or day 90) for AECOPD patients. Spirometry was used to obtain lung function parameters after bronchodilator administration according to recommendations from American Thoracic Society/European Respiratory Society.14
Review of imaging and statistical analysis
To ensure uniformity of the reviews, CXRs and CT images were read by a single-blinded reviewer and assessed according to the Fleischner Society glossary of terms.15 The standard for CXRs was the posteroanterior projection. In subjects who were unable to cooperate or stand upright, only the anteroposterior projection was obtained. Cardiac size, pulmonary edema, and pleural effusion were the three parameters that were evaluated on CXRs.
CT scans were ordered based on the attending physician’s discretion, and the methods of CT acquisition were pulmonary angiographic studies utilizing intravenous contrast with a slice thickness of 2.5 mm, noncontrast examinations with a slice thickness of 2.5 mm, or noncontrast examinations with a slice thickness of 1.25 mm. The parameters that were assessed on CT scans are listed in Table 1. These included emphysema, respiratory bronchiolitis, airway thickening, mucous plugging, bronchiectasis, reticulation, mosaic attenuation, consolidation, ground glass opacities, presence of nodules, pulmonary edema, pleural effusion, pericardial effusion, pulmonary artery diameter, aortic diameter, and pulmonary artery to aorta (PA/A) ratio. To quantify emphysema burden, each lung was divided into three zones (Figure S2), and the severity of emphysema was scored on a 6-point scale (0–5), which was related to the percentage of total lung volume that contained emphysematous holes for each zone (0: 0%, 1: <5%, 2: 6%–24%, 3: 25%–49%, 4: 50%–74%, 5: 75%–100%). The total emphysema score per subject was the sum of the scores in each zone divided by the total number of zones. Bronchiolitis was scored using a quartile system based on the Fleischner guidelines and the following scale: none (0), trivial (1), mild/moderate (2), or moderate/severe (3). Bronchiolitis was defined as centrilobular micronodules and patchy ground glass opacity according to Fleischner Society glossary of terms.15 Details regarding the measurement of PA/A ratio are provided in Figure S3.
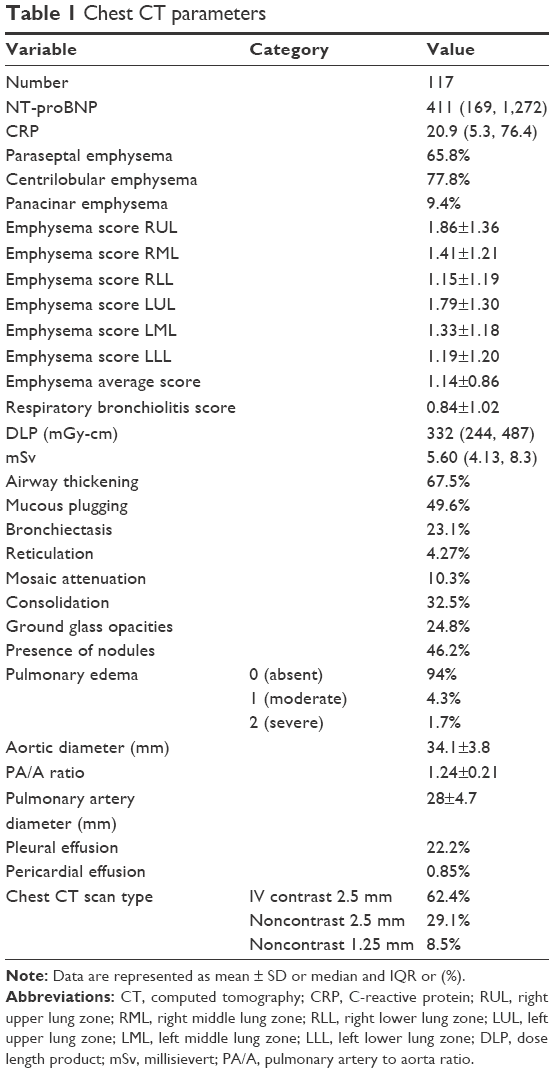 | Table 1 Chest CT parameters |
Statistical analysis
ANOVA and Spearman’s correlation were performed to test for associations between the imaging parameters and blood-based biomarkers. Receiver operating characteristic (ROC) curves were constructed based on logistic regression models for predicting the radiological parameters according to log-transformed NT-proBNP or CRP concentrations, with and without the adjustment for age and sex.
Results
Subject characteristics
A total of 309 subjects with either a CXR or a CT scan were examined for this study. Subjects had a mean age of 65.6±11.1 years, 66.7% of them were males, 85.8% were Caucasian, and 62.4% were current smokers. All subjects had airflow limitation, with a mean forced expiratory volume in 1 second 54.4%±21.5% of predicted (Table 2). Comorbid conditions included congestive HF (16.2%), coronary artery disease (21.0%), hypertension (46.0%), diabetes (16.5%), arrhythmia (13.9%), and asthma (24.6%). About 36.9% of our subjects underwent thoracic CT scan during admission, of which 62.4% were CT pulmonary angiography.
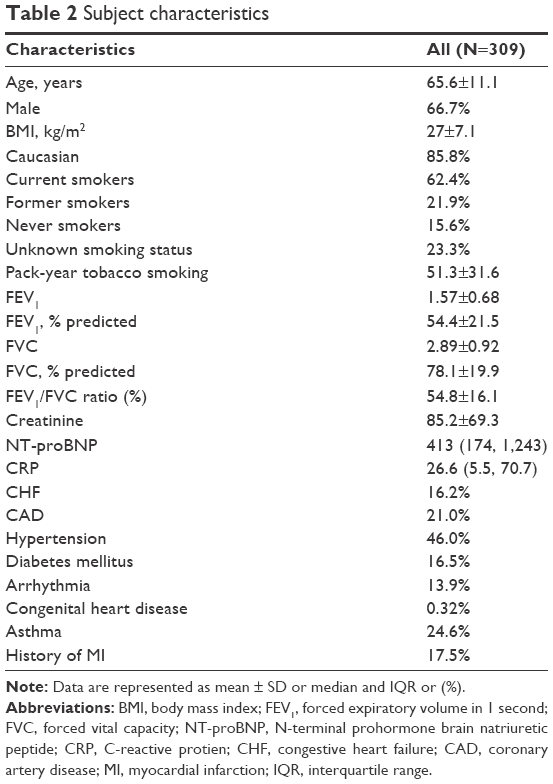 | Table 2 Subject characteristics |
Radiological parameters
The parameters that were measured on CXR are listed in Table 3. In our study, 15.5% had radiographic evidence of pulmonary edema, 11.6% had pleural effusion, and 16.2% had an abnormal cardiac size. On CT scans, 32.5% had evidence of consolidation. The mean PA/A ratio was 1.24±0.21 (Table 1).
 | Table 3 Chest X-ray parameters |
Associations between radiological parameters and blood-based biomarkers
NT-proBNP concentrations were significantly associated with pulmonary edema (P=0.008), pleural effusion (P=0.006), and cardiac size (P<0.001) on CXR, and they were significantly associated with pleural effusion (P<0.001), pulmonary artery diameter (r=0.22; P=0.020), and aortic diameter (r=0.21; P=0.027) on CT imaging. CRP concentrations were associated with consolidation (P<0.001), ground glass opacities (P=0.027), pleural effusion (P<0.001), and pulmonary artery diameter (r=0.23; P=0.018) on CT imaging. Additional details are provided in Table S1 and Figures S4 and S5.
ROC curves
ROC curves were constructed to determine the relationships of CT findings of clinical interest with biomarker concentrations, with and without adjustments for age and sex (Figure 2). The AUC of NT-proBNP to predict pleural effusion on CT was 0.71 (P=0.002, 95% CI 0.58–0.83). On CXR, the AUCs of NT-proBNP to predict cardiac size, pulmonary edema, and pleural effusion were 0.72 (P<0.001, 95% CI 0.62–0.81), 0.63 (P=0.009, 95% CI 0.53–0.73), and 0.64 (P=0.01, 95% CI 0.53–0.75), respectively. For using CRP to predict consolidation, the AUC was 0.75 (P<0.001, 95% CI 0.64–0.86); for pleural effusion, the AUC was 0.72 (P<0.001, 95% CI 0.6–0.85); and for ground glass opacities, the AUC was 0.64 (P=0.028, 95% CI 0.51–0.77). We sought to determine a sensitivity-oriented cutoff point for CRP to predict consolidation on CT based on the ROC curve constructed, in which we set the minimum sensitivity to 90% and applied The Youden Index.16 The cutoff point for consolidation was a CRP level of 11.5 mg/L, with a sensitivity of 91% and a specificity of 53%. Additional details regarding the ROC curves are provided in Figure S6.
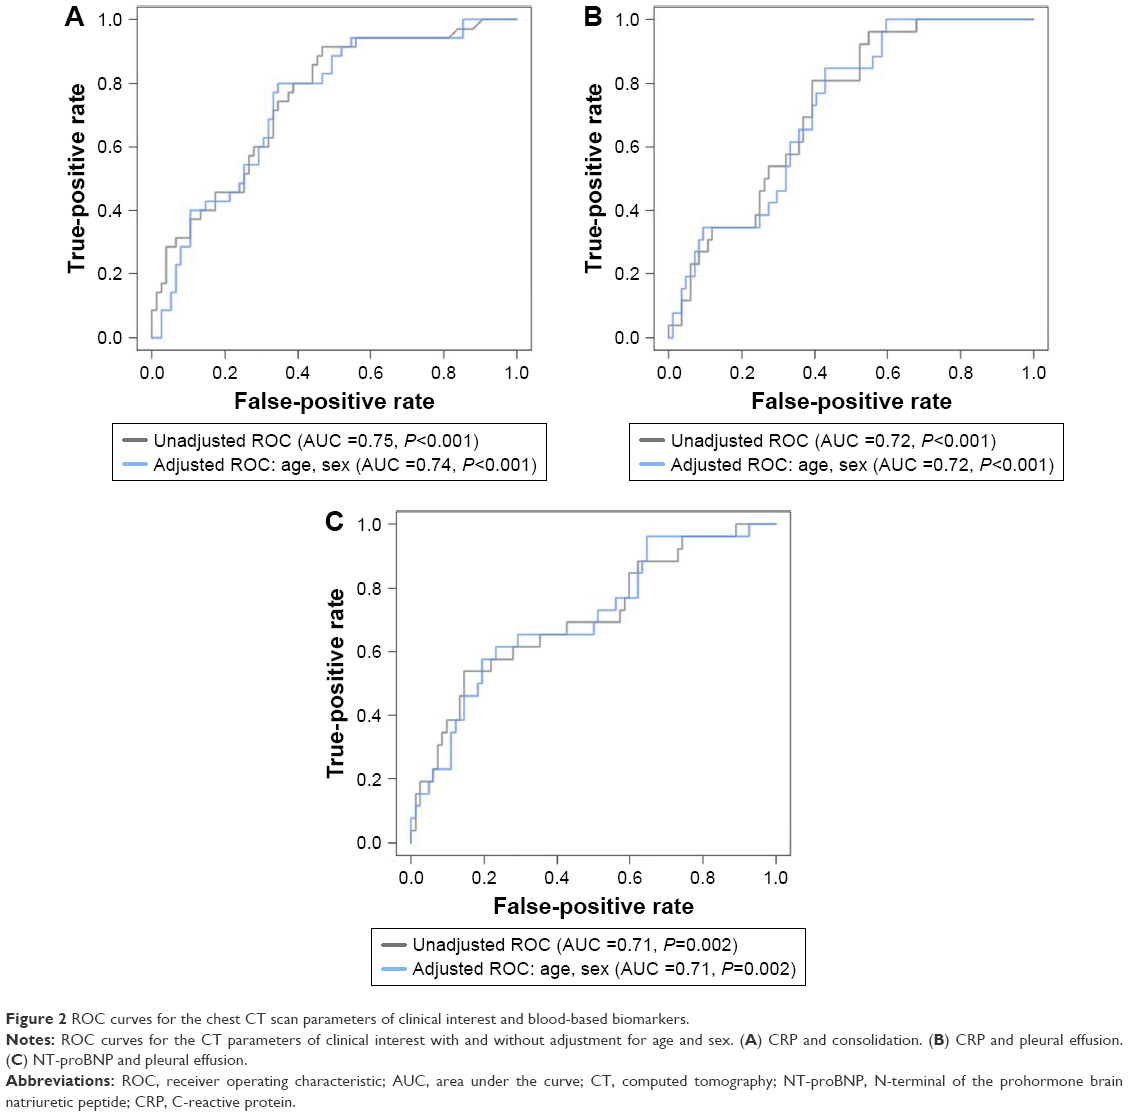 | Figure 2 ROC curves for the chest CT scan parameters of clinical interest and blood-based biomarkers. |
Discussion
To the best of our knowledge, this is the first study that has evaluated the relationships of CRP and NT-proBNP with radiological parameters in AECOPD simultaneously. We found significant associations between elevated NT-proBNP concentrations and the presence of pulmonary edema, pleural effusion, and cardiac size on CXRs in patients who were diagnosed with AECOPD. We also found a significant relationship between elevated CRP concentrations and the presence of consolidation, ground glass opacities, and pleural effusion on CT scans but not CXR, consistent with improved resolution of CT scans in detecting these abnormalities in COPD patients. To our knowledge, our study is the first to examine the capability of CRP in predicting consolidation present on CT scans in subjects who were admitted as cases of AECOPD and not community-acquired pneumonia (CAP). In this RTP cohort, a CRP concentration of <11.5 mg/L was a sensitive marker of ruling out consolidation present on CT scans, suggesting high utility in AECOPD.
NT-proBNP is a polypeptide secreted predominantly from the cardiac ventricles in response to multiple stimuli (volume overload/endotoxemia/ischemia/hypoxia).17
It exerts its actions through multiple pathways, which contributes to its diuretic and hypotensive properties.18 Measurement of NT-proBNP may be indicated for individuals who present to the emergency department with acute dyspnea in order to differentiate acute heart failure from non-cardiac causes19 and is currently being investigated for its potential use in AECOPD, with two systematic reviews demonstrating that NT-proBNP has a strong association with the presence of left ventricular dysfunction (LVD) in AECOPD.20,21 Of note, the association between NT-proBNP levels and LVD in AECOPD seems to be sustained even in the presence of renal dysfunction, albeit with higher NT-proBNP concentrations.22
Our findings are consistent with those of Høiseth et al, who applied a standardized assessment of pulmonary congestion present on CXR in 99 patients admitted for AECOPD, and found that this standardized assessment of pulmonary congestion but not routine assessment, correlated with NT-proBNP.23 We extend this finding by evaluating 269 subjects who had CXRs at the time of hospitalization and demonstrating that NT-proBNP was a good indicator of radiological parameters related to cardiac dysfunction and/or volume overload including cardiac size, pulmonary edema, and pleural effusion with AUCs of 0.72, 0.63, and 0.64, respectively. Of note, the AUC for using NT-proBNP to predict pleural effusion as detected on CXR was 0.64, while the AUC for detecting pleural effusion based on CT was 0.71.
CXRs are not particularly sensitive or specific in detecting consolidations, consistent with CAP in patients with COPD,24 and thoracic CT scans have much better performance in detecting CAP in COPD. In a study that systematically performed thoracic CT scans in a population of suspected CAP patients visiting the emergency department,25 CT scans revealed pulmonary infiltrates consistent with CAP in 33% of patients in whom opacity had been absent on CXR. Thus, the inclusion of CT results led to increased physician confidence in the CAP diagnosis. The same group also sought to improve CAP diagnosis by measuring CRP in these patients;26 the AUC of CRP for CAP was 0.78, and thus a cutoff point of 50 mg/L (which was associated with a sensitivity of 84.7% and a specificity of 63.4%) was proposed for detecting CAP. Of note, the study was limited in the evaluation of COPD patients as only 28.5% of the studied population had chronic respiratory diseases, and the study excluded patients who were in the highest Pneumonia severity score CURB-65 categories, making it hard to evaluate those aged ≥65 years. Another study that examined the diagnostic capability of CRP in CAP in an outpatient setting27 proposed a CRP cutoff point of 20 mg/L (which was associated with a sensitivity of 73% and a specificity of 65%) to predict a pulmonary infiltrate on CXR. Huerta et al28 proposed a CRP cutoff point of 129 mg/L, which had an AUC of 0.71, with a sensitivity of 62% and a specificity of 63% in discriminating between AECOPD and CAP + COPD (in which CAP + COPD was diagnosed based on the presence of consolidation on CXR). We extend these findings by demonstrating that CRP is also useful in predicting consolidation present on CT scan that could not be detected on CXR in AECOPD and propose a cutoff value of 11.5 mg/L which had a sensitivity of 91% and a specificity of 53% in ruling out the presence of consolidation on CT scan. We believe that the use of CRP in predicting pulmonary infiltrates on CT scans has clinical utility as the use of CT scans is generally restricted in AECOPD to those in whom pulmonary embolism and noninfectious etiologies of AECOPD are considered and plain frontal chest radiographs are not very sensitive or specific in detecting pulmonary infiltrates in patients with COPD. By using a CRP cutoff of 11.5 mg/L, most patients with AECOPD who have pulmonary opacities will be identified.
Limitations
Our study has several limitations. First, it was a retrospective analysis and thus is affected by the common shortcomings of these types of studies. Second, we have taken the closest blood-based biomarker measurement to the radiological test, and it is not exactly known if the resolution of the radiological findings occurs in the same chronology as the decrease in the blood-based biomarkers. Third, although infection is considered the most common cause of consolidation in the acute setting,29 and >90% of subjects who develop consolidation have either bacterial or viral pneumonia,30 it has been demonstrated that in certain cases and with certain organisms, ground glass opacities and nodules may be present.31,32 Thus, our proposed CRP cutoff point may be most useful in discriminating pulmonary infections associated with consolidations on CT scans and may not apply for infections that induce nodularity or ground glass opacities as the predominant pattern. Fourth, arterial blood gases were not routinely collected in this study, and thus the contribution of hypoxemia to the elevation of NT-proBNP concentrations could not explored. Fifth, patients did not undergo body plethysmography, and as such, total lung volume and its subdivisions were not ascertained. Thus, we could not determine the contribution of lung hyperinflation and gas trapping to possible cardiac dysfunction.33 In addition, only 36.9% of our subjects required CT scans during admission, resulting in a selection bias. Thus, our findings should be prospectively validated.
Our study adds to the existing literature on the utility of NT-proBNP in predicting cardiac causes and/or complications in AECOPD, and we propose here that NT-proBNP and CRP should be utilized in patients admitted as AECOPD, in order to improve the identification and management of cardiac involvement in AECOPD. Moreover, in cases where CRP concentrations are <11.5 mg/L, it is highly unlikely that those individuals have pulmonary infiltrates that are not present on CXR and could only be detected on CT, and thus ordering a chest CT scan for that purpose could be averted; in addition, other etiological factors of AECOPD should be considered, and the empiric administration of antibiotics needs careful consideration and should be taken in the context of other features suggestive of infection.
Conclusion
Elevated CRP may indicate the presence of pneumonia, while elevated NT-proBNP may indicate cardiac dysfunction and pulmonary edema. These readily available blood-based biomarkers, along with imaging modalities, may provide more accurate phenotyping of AECOPD and may enable the discovery of more precise therapies to treat AECOPD. We propose a CRP cutoff point that will aid in averting the need for CT scans if there is a suspicion of an infectious lung process in subjects admitted with AECOPD.
Acknowledgments
We would like to thank all patients for their participation and Ms Roxanne Rousseau and Ms Breanne Crouch for their role in patient recruitment for the study. We would also like to thank Sara Assadian for collecting and entering clinical data; Sheena Tam, Grace Lee, Yeni Oh, and David Ngan for processing samples; as well as Meghan McLennan and Jackson Wu for performing clinical laboratory analyses. The study was funded by Genome Canada, Genome British Columbia, Genome Quebec, Canadian Institutes of Health Research, Providence Health Care, St Paul’s Hospital Foundation, and PROOF Centre.
An abstract of this paper was presented at the 2017 American Thoracic Society International Conference as a poster discussion with interim findings. The poster’s abstract was published in the 2017 abstract issue of the American Journal of Respiratory and Critical Care Medicine: http://www.atsjournals.org/doi/abs/10.1164/ajrccm-conference.2017.195.1_MeetingAbstracts.A5000.
Disclosure
The authors report no conflicts of interest in this work.
References
Adeloye D, Chua S, Lee C, et al. Global and regional estimates of COPD prevalence: systematic review and meta-analysis. J Glob Health. 2015;5(2):020415. | ||
Mathers CD, Loncar D. Projections of global mortality and burden of disease from 2002 to 2030. PLoS Med. 2006;3(11):e442. | ||
Perera PN, Armstrong EP, Sherrill DL, Skrepnek GH. Acute exacerbations of COPD in the United States: inpatient burden and predictors of costs and mortality. COPD. 2012;9(2):131–141. | ||
Vogelmeier CF, Criner GJ, Martinez FJ, et al. Global Strategy for the Diagnosis, Management, and Prevention of Chronic Obstructive Lung Disease 2017 Report. GOLD Executive Summary. Am J Respir Crit Care Med. 2017;195(5):557–582. | ||
Zdravkovic V, Mladenovic V, Colic M, et al. NT-proBNP for prognostic and diagnostic evaluation in patients with acute coronary syndromes. Kardiol Pol. 2013;71(5):472–479. | ||
Choi E-Y, Bahrami H, Wu CO, et al. N-Terminal Pro-B-type natriuretic peptide, left ventricular mass, and incident heart failure: multi-ethnic study of atherosclerosis. Circ Heart Fail. 2012;5(6):727–734. | ||
Januzzi JL, van Kimmenade R, Lainchbury J, et al. NT-proBNP testing for diagnosis and short-term prognosis in acute destabilized heart failure: an international pooled analysis of 1256 patients: the International Collaborative of NT-proBNP Study. Eur Heart J. 2006;27(3):330–337. | ||
Chang CL, Robinson SC, Mills GD, et al. Biochemical markers of cardiac dysfunction predict mortality in acute exacerbations of COPD. Thorax. 2011;66(9):764–768. | ||
In E, Aydin AM, Ozdemir C, Sokucu SN, Dagli MN. The efficacy of CT for detection of right ventricular dysfunction in acute pulmonary embolism, and comparison with cardiac biomarkers. Jpn J Radiol. 2015;33(8):471–478. | ||
Vuilleumier N, Righini M, Perrier A, et al. Correlation between cardiac biomarkers and right ventricular enlargement on chest CT in non massive pulmonary embolism. Thromb Res. 2008;121(5):617–624. | ||
Ribeiro DG, Silva RP, Barboza DR, Lima-Junior RC, Ribeiro RA. Clinical correlation between N-terminal pro-B-type natriuretic peptide and angiographic coronary atherosclerosis. Clinics (Sao Paulo). 2014;69(6):405–412. | ||
Chen Y-WR, Leung JM, Sin DD. A systematic review of diagnostic biomarkers of COPD exacerbation. PLoS One. 2016;11(7):e0158843. | ||
Chen YR, Chen V, Hollander Z, et al. C-reactive protein and N-terminal prohormone brain natriuretic peptide as biomarkers in acute exacerbations of COPD leading to hospitalizations. PLoS One. 2017;12(3):e0174063. | ||
Miller MR, Hankinson J, Brusasco V, et al. Standardisation of spirometry. Eur Respir J. 2005;26(2):319–338. | ||
Hansell DM, Bankier AA, MacMahon H, McLoud TC, Muller NL, Remy J. Fleischner Society: glossary of terms for thoracic imaging. Radiology. 2008;246(3):697–722. | ||
Youden WJ. Index for rating diagnostic tests. Cancer. 1950;3(1):32–35. | ||
D’Souza SP, Davis M, Baxter GF. Autocrine and paracrine actions of natriuretic peptides in the heart. Pharmacol Ther. 2004;101(2): 113–129. | ||
Ahluwalia A, MacAllister RJ, Hobbs AJ. Vascular actions of natriureticpeptides. Basic Res Cardiol. 2004;99(2):83–89. | ||
Ponikowski P, Voors AA, Anker SD, et al. 2016 ESC Guidelines for the diagnosis and treatment of acute and chronic heart failure: The task force for the diagnosis and treatment of acute and chronic heart failure of the European Society of Cardiology (ESC). Developed with the special contribution of the Heart Failure Association (HFA) of the ESC. Eur J Heart Fail. 2016;18(8):891–975. | ||
Buchan A, Bennett R, Coad A, Barnes S, Russell R, Manuel AR. The role of cardiac biomarkers for predicting left ventricular dysfunction and cardiovascular mortality in acute exacerbations of COPD. Open Heart. 2015;2(1):e000052. | ||
Hawkins NM, Khosla A, Virani SA, McMurray JJ, FitzGerald JM. B-type natriuretic peptides in chronic obstructive pulmonary disease: a systematic review. BMC Pulm Med. 2017;17(1):11. | ||
Ouanes I, Jalloul F, Ayed S, et al. N-terminal proB-type natriuretic peptide levels aid the diagnosis of left ventricular dysfunction in patients with severe acute exacerbations of chronic obstructive pulmonary disease and renal dysfunction. Respirology. 2012;17(4):660–666. | ||
Høiseth AD, Omland T, Karlsson BD, Brekke PH, Søyseth V. Standardized evaluation of lung congestion during COPD exacerbation better identifies patients at risk of dying. Int J Chron Obstruct Pulmon Dis. 2013;8:621–629. | ||
Hopstaken RM, Witbraad T, van Engelshoven JM, Dinant GJ. Inter-observer variation in the interpretation of chest radiographs for pneumonia in community-acquired lower respiratory tract infections. Clin Radiol. 2004;59(8):743–752. | ||
Claessens YE, Debray MP, Tubach F, et al. Early chest computed tomography scan to assist diagnosis and guide treatment decision for suspected community-acquired pneumonia. Am J Respir Crit Care Med. 2015;192(8):974–982. | ||
Le Bel J, Hausfater P, Chenevier-Gobeaux C, et al. Diagnostic accuracy of C-reactive protein and procalcitonin in suspected community-acquired pneumonia adults visiting emergency department and having a systematic thoracic CT scan. Crit Care. 2015;19:366. | ||
Holm A, Pedersen SS, Nexoe J, et al. Procalcitonin versus C-reactive protein for predicting pneumonia in adults with lower respiratory tract infection in primary care. Br J Gen Pract. 2007;57(540):555–560. | ||
Huerta A, Crisafulli E, Menendez R, et al. Pneumonic and nonpneumonic exacerbations of COPD: inflammatory response and clinical characteristics. Chest. 2013;144(4):1134–1142. | ||
Lee KS, Kim EA. High-resolution CT of alveolar filling disorders. Radiol Clin North Am. 2001;39(6):1211–1230. | ||
Franquet T. Imaging of pneumonia: trends and algorithms. Eur Respir J. 2001;18(1):196–208. | ||
Ono A, Okada F, Takata S, et al. A comparative study of thin-section CT findings between seasonal influenza virus pneumonia and Streptococcus pneumoniae pneumonia. Br J Radiol. 2014;87(1039):20140051. | ||
Okada F, Ono A, Ando Y, et al. Thin-section CT findings in Pseudomonas aeruginosa pulmonary infection. Br J Radiol. 2012;85(1020):1533–1538. | ||
Watz H, Waschki B, Meyer T, et al. Decreasing cardiac chamber sizes and associated heart dysfunction in COPD: role of hyperinflation. Chest. 2010;138(1):32–38. |
Supplementary materials
 | Figure S1 Days between radiological tests and blood-based biomarkers NT-proBNP and CRP. |
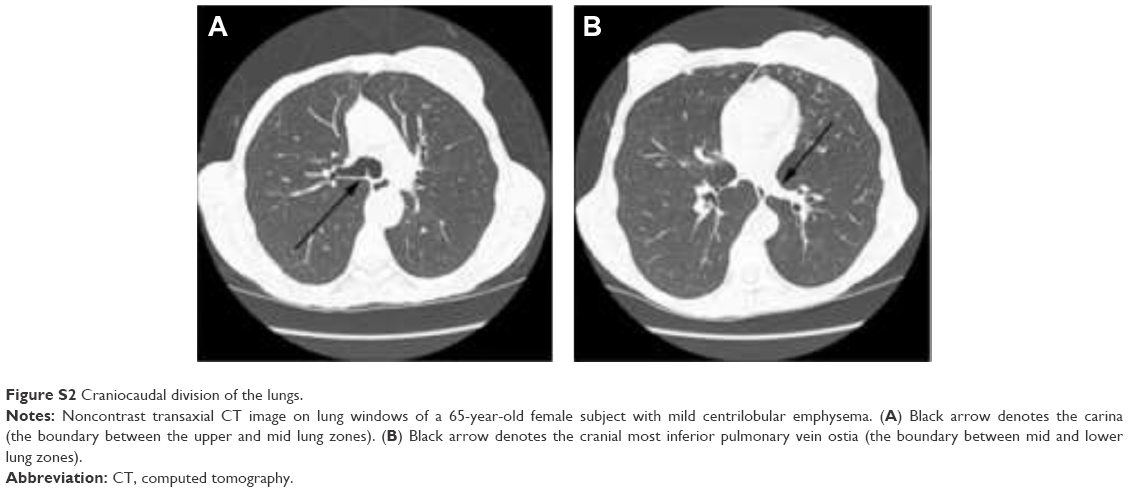 | Figure S2 Craniocaudal division of the lungs. |
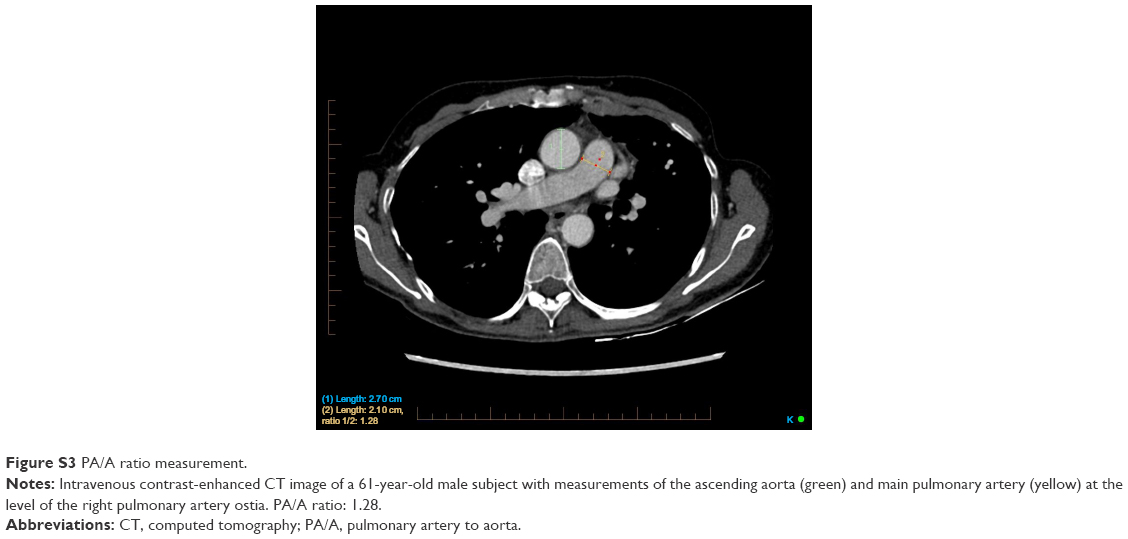 | Figure S3 PA/A ratio measurement. |
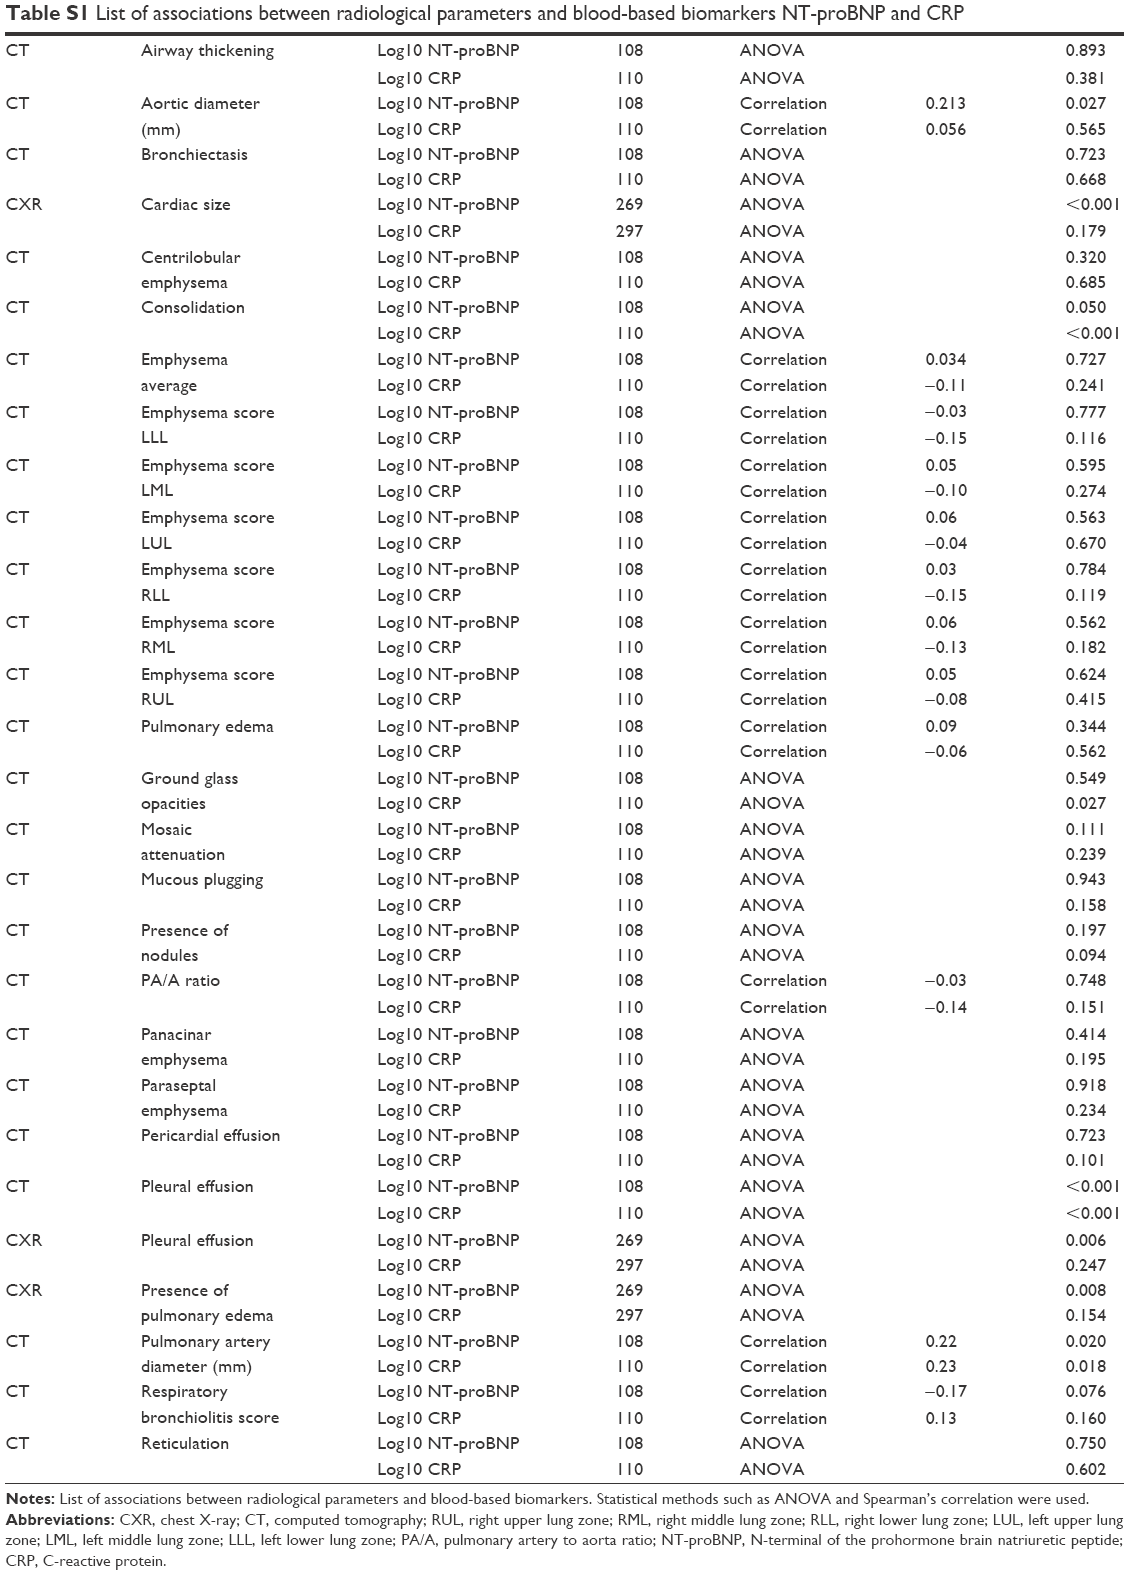 | Table S1 List of associations between radiological parameters and blood-based biomarkers NT-proBNP and CRP |
 | Figure S4 Significant associations between radiological parameters and NT-proBNP. |
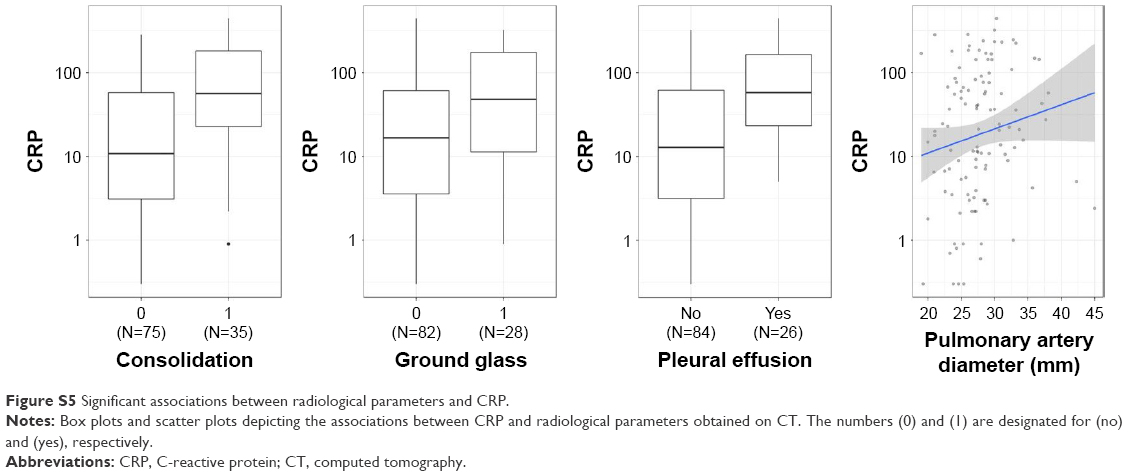 | Figure S5 Significant associations between radiological parameters and CRP. |
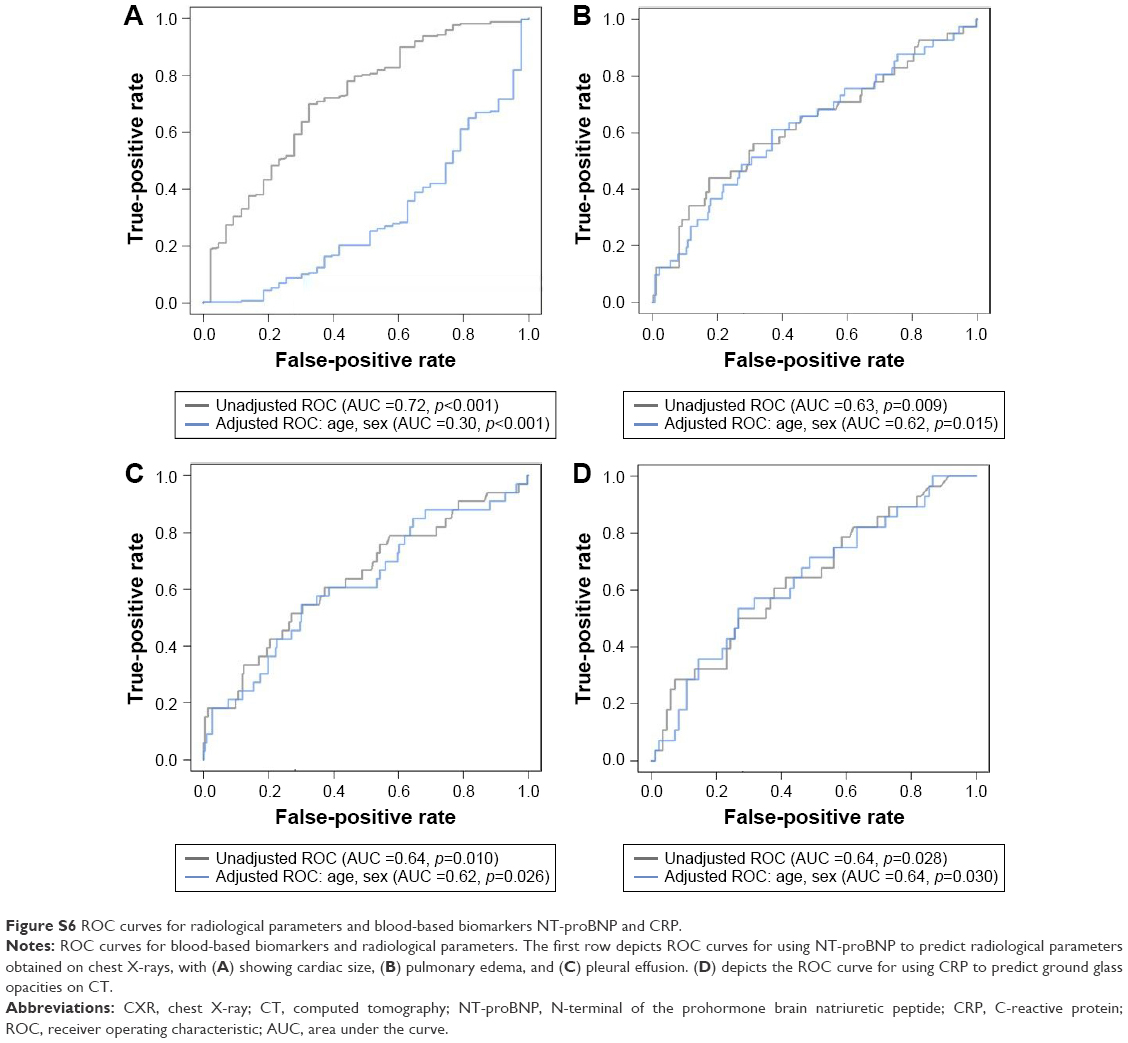 | Figure S6 ROC curves for radiological parameters and blood-based biomarkers NT-proBNP and CRP. |
 © 2018 The Author(s). This work is published and licensed by Dove Medical Press Limited. The
full terms of this license are available at https://www.dovepress.com/terms
and incorporate the Creative Commons Attribution
- Non Commercial (unported, 3.0) License.
By accessing the work you hereby accept the Terms. Non-commercial uses of the work are permitted
without any further permission from Dove Medical Press Limited, provided the work is properly
attributed. For permission for commercial use of this work, please see paragraphs 4.2 and 5 of our Terms.
© 2018 The Author(s). This work is published and licensed by Dove Medical Press Limited. The
full terms of this license are available at https://www.dovepress.com/terms
and incorporate the Creative Commons Attribution
- Non Commercial (unported, 3.0) License.
By accessing the work you hereby accept the Terms. Non-commercial uses of the work are permitted
without any further permission from Dove Medical Press Limited, provided the work is properly
attributed. For permission for commercial use of this work, please see paragraphs 4.2 and 5 of our Terms.