Back to Journals » Journal of Hepatocellular Carcinoma » Volume 8
ARHGAP20 Expression Inhibited HCC Progression by Regulating the PI3K-AKT Signaling Pathway
Authors Liu G ![]() , Li J, Zhang CY, Huang DY, Xu JW
, Li J, Zhang CY, Huang DY, Xu JW ![]()
Received 24 December 2020
Accepted for publication 25 March 2021
Published 21 April 2021 Volume 2021:8 Pages 271—284
DOI https://doi.org/10.2147/JHC.S298554
Checked for plagiarism Yes
Review by Single anonymous peer review
Peer reviewer comments 3
Editor who approved publication: Dr Ahmed Kaseb
Gao Liu,1,2 Jia Li,1,2 Cai-Yun Zhang,1,2 Dong-Yang Huang,3 Ji-Wei Xu1,2
1Department of Hepatobiliary Surgery, Meizhou People’s Hospital, Meizhou, 514000, People’s Republic of China; 2Guangdong Provincial Key Laboratory of Precision Medicine and Clinical Translational Research of Hakka Population, Meizhou, People’s Republic of China; 3Center for Molecular Biology, Shantou University Medical College, Shantou, Guangdong, 515041, People’s Republic of China
Correspondence: Dong-Yang Huang
Center for Molecular Biology, Shantou University Medical College, Shantou, Guangdong, 515041, People’s Republic of China
Email [email protected]
Ji-Wei Xu
Department of Hepatobiliary Surgery, Meizhou People’s Hospital, No. 38 Huangtang Road, Meizhou, 514000, People’s Republic of China
Tel +86-13823832715
Email [email protected]
Introduction: One of the most common cancers is hepatocellular carcinoma (HCC), which is an aggressive cancer that is associated with high mortality. The expression and role of ARHGAP20 in HCC remain unclear.
Materials and Methods: The expression and clinical role of ARHGAP20 were investigated using online databases and HCC samples from Meizhou People’s Hospital. Wound healing assays, transwell migration/invasion assays, and lung metastasis models were performed using nude mice. Gene set enrichment analyses were used to further explore the potential mechanisms.
Results: Inspired by expression analyses of three different public databases (ie, TIMER, Oncomine, and HCCDB database), we confirmed that ARHGAP20 was downregulated in clinical HCC tumors compared with normal controls. ARHGAP20 expression inhibited HCC migration and invasion in vitro and in vivo. Based on GSEA results, we tested markers of the PI3K-AKT signaling pathway. Interestingly, while ARHGAP20 upregulation suppressed HCC migration/invasion and phosphorylation of AKT/PI3K molecules, exposure to the PI3K-AKT pathway agonist rhIGF-1 partially rescued these phenomena. ARHGAP20 also showed a close correlation with certain components in the HCC immune microenvironment. Furthermore, we revealed that downregulated ARHGAP20 was significantly correlated with larger tumor size and vascular invasion, and could be used as an adverse independent prognostic factor for HCC OS but not RFS.
Conclusion: ARHGAP20 was identified for the first time as a tumor suppressor gene that could inhibit HCC progression by regulating the PI3K-AKT signaling pathway and the immune microenvironment in HCC.
Keywords: HCC, ARHGAP20, progression, PI3K-AKT, immune microenvironment
Introduction
Hepatocellular carcinoma (HCC) is one of the most common cancers and characterized by aggressiveness and high mortality.1 Despite recent progress in prevention and treatment techniques, the long-term survival of HCC remains poor due to late diagnosis and cancer recurrence/metastasis.2 Considering the great heterogeneity of HCC,3 satisfactory prognosis cannot be achieved without a better understanding of its pathophysiology.
RhoA belongs to the Rho GTPases of the Ras superfamily. RhoA ubiquitously regulates cytoskeletal dynamics, cell migration, and stem cell differentiation, etc.4 The switch between the inactivated GDP-bound state and the activated GTP-bound state is critical for RhoA function. Inactivation is promoted by GTPase-activating proteins (GAPs), which help hydrolyze RhoA-bound GTP to GDP, and activation is mediated by guanine nucleotide-exchange factors (GEFs), which help RhoA binding with GTP.5 Overactivated RhoA or loss of GAPs contributed to tumorigenesis and cancer metastasis in most circumstances. Notably, the function of GAPs might be highly GAP-specific or cell-type-specific.6 For example, while ARHGAP9,7 ARHGAP24,8 and Deleted in liver cancer 1 (DLC1)9 suppressed the migration and invasion of HCC, ARHGAP11A10 and ARHGAP1811 facilitated the malignant progression of HCC.
ARHGAP20 is a GAP that has two conserved domains, a RhoGAP domain, and an RA domain. The RhoGAP domain could potentially participate in the downregulation of Rho GTPases, while the RA domain indicated the possibility that ARHGAP20 might also be an effector for Ras- or Ral-like GTPases.12 ARHGAP20 is ubiquitously expressed, especially in the testis and brain.13 Upregulated ARHGAP20 inactivated Rho to promote neurite outgrowth in a Rap1-dependent manner.14 In chronic lymphocytic leukemia, ARHGAP20 was counterintuitively significantly more highly expressed in cases with 11q22-23 or 13q14 deletions than in those without detectable genetic lesions or trisomy.15,16 However, the role of ARHGAP20 in HCC remains unknown.
Therefore, we conducted this study to investigate the expression and potential mechanism of ARHGAP20 in HCC progression.
Materials and Methods
Data Collection
The transcriptional count data from 374 HCC samples/tissues and 50 adjacent samples were downloaded by the “TCGAbiolinks” R package.17 The relevant clinical data of HCC were downloaded from The Cancer Genome Atlas-liver hepatocellular carcinoma dataset (TCGA-LIHC) and cBioportal for Cancer Genomics.18,19
Expression of ARHGAP20 mRNA in HCC
To investigate the expression of ARHGAP20 in multiple cancers including HCC, the TIMER database (https://cistrome.shinyapps.io/timer/)(including 371 HCC and 50 normal controls),20 and the Oncomine database (https://www.oncomine.org/resource/main.html) were explored (including 35 HCC and 10 normal controls). To further investigate the expression of ARHGAP20 in HCC, the HCCDB database (http://lifeome.net/database/hccdb/search.html?Entrez_ID=10840) was explored (including 1743 HCC and 1167 normal controls).21
Clinical Specimens and Immunohistochemistry
HCC patients were considered potential candidates if they received curative resection at Meizhou People’s Hospital between January 2012 and December 2018. However, only 70 patients with complete clinicopathological information and follow-up data were included in this study. The median follow-up for the 70 included patients was 38.0 months (range, 4–60 months). In addition, the fresh HCC and paired adjacent normal tissues from three patients were also obtained immediately after surgery. The Ethics and Indications Committee of Meizhou People’s Hospital approved our study and written informed consent was obtained from all patients. The study was conducted in accordance with the Declaration of Helsinki.
The 70 HCC and corresponding adjacent normal tissue samples were incubated with anti-ARHGAP20 antibody (Cell Signaling Technology (CST), # 39,848, 1:500) overnight at 4°C. Three representative fields were imaged in a uniform setting for all slides. Image-Pro Plus v6.2 software (Media Cybernetics Inc., Bethesda, MD) was used to estimate the staining intensity. The median value of the staining intensity was used as the cutoff value to categorize patients into high- and low-ARHGAP20 groups.
Cell Culture
Six human cell lines (LO2, HepG2, HCCLM3, Huh7, PLC/PRF/5, and SKHEP1) were cultured. All cell lines were obtained from the Chinese Academy of Sciences. All cells were cultured in DMEM containing 10% fetal bovine serum (Gibco, USA) at 37°C with 5% CO2 and 95% humidity according to the manufacturer’s instructions.
Quantitative Real-Time PCR (qRT-PCR)
TRIzol (Gibco, USA) was used to extract total RNA. Then, total RNA was used to produce cDNA using the RevertAid TM First Strand cDNA Synthesis kit (Thermo, U.S.A.). qRT-PCR was performed using the BestarSybrGreen qPCR master mix kit (DBI, Germany) and BIO-RAD IQ5qRT-PCR System (BIO-RAD, U.S.A.). Gene mRNAs were normalized against glyceraldehyde-3-phosphate dehydrogenase (GAPDH). The primers used included: human GAPDH, forward 5ʹ-AATCCCATCACCATCTTC-3ʹ and reverse 5ʹ-AGGCTGTTGTCATACTTC-3ʹ; and human ARHGAP20, forward, 5ʹ-GCCCAACATAGAAGACCAGAAC-3ʹ and reverse 5ʹ-CTTGCCCACCTCAATCCC-3ʹ. The 2−ΔCT method was used for mRNA quantification.
Western Blotting Analyses
Cultured cell lysates were prepared using a Column Tissue & Cell Protein Extraction Kit (Epizyme, Shanghai, China; # PC201PLUS). Then total proteins were then separated on 10% SDS polyacrylamide gels. Primary antibodies against ARHGAP20 (Invitrogen, #PA5-23,204), E-cadherin (CST, #14,472), MMP2 (Abcam, #ab97779), MMP9 (Abcam, #ab228402), Snail (CST, #3879), Twist (Abcam, #ab175430), VEGF (Proteintech, 66,828-1-Ig), PI3K (Abcam, #ab182651), p-PI3K (Abcam, ab133595), AKT (CST, #9272), p-AKT (CST, #4060), and GADPH (CST, #5174) were used. Protein levels were normalized against GADPH.
Cells Transfection
The ARHGAP20 overexpressing plasmid was purchased from GENEWIZ Company (www.Genewiz.com. Genewiz, China) and validated by DNA sequencing (Shanghai Majorbio Bio-Pharm Technology Co., Ltd, China). The validated ARHGAP20 were then inserted into pLVX-Puro cloning vector (Clontech Co., USA). Lentivirus stocks were produced from 293T cells transfection following the manufacturer’s instructions (Biosettia). The lentivirus stocks were added to HepG2 and HCCLM3 cell line for 16h. After 48–72h, puromycin was added for 3 days to obtained stable clones that over-expressed ARHGAP20 gene. All stably transfected clones were confirmed by qRT-PCR and Western blot.
Wound Healing Assay
A total of 8×10⁵ cells in DMEM with 10% bovine serum albumin (BSA) were seeded into each well of 35 mm2 plates and grown to a fully confluent monolayer overnight. Then, a single-line scratch was produced by a sterile tip, and cells were washed with phosphate-buffered saline (PBS) three times. Cells were further cultured with serum-free medium. The wound gaps were observed at 1 h, 12 h, and 24 h.
Transwell Migration Assay
A total of 3×10⁵ cells in serum-free DMEM were seeded into the upper chamber of an 8-μm Transwell chamber (Beckton Dickinson, Franklin Lakes, NJ, U.S.A.), and DMEM with 10% BSA was added to the lower chamber. After 24 h incubation at 37°C, the cells in the upper chamber were fixed in methanol and then stained with Giemsa solution (Beyotime, Nantong, China). Then, the migrated cells were photographed and quantified.
Transwell Invasion Assay
A total of 3×10⁵ cells in serum-free DMEM were seeded into the upper chamber of an 8-μm Transwell chamber precoated with Matrigel (Beckton Dickinson, Franklin Lakes, NJ, U.S.A.), and DMEM with 10% BSA was added to the lower chamber. After 48 h incubation at 37°C, the cells in the upper chamber were fixed in methanol and then stained with Giemsa solution (Beyotime, Nantong, China). Then, the migrated cells were photographed and quantified.
Lung Metastasis Model in Nude Mice
Four- to six-week-old weeks male BALB/c nude mice were used, with six mice in each group. A total of 1×10⁷ HCCLM3 tumor cells in 100 µL of solution were injected into the tail vein. All mice were sacrificed six weeks later and the number of lung metastases was analyzed. In addition, the fresh lung metastatic nodules were also analyzed by Western blot. All mice were purchased from the Shanghai Institute of Material Medicine and raised in a pathogen-free environment. Animal care and experimental protocols were approved by the Ethics and Indications Committee of Meizhou People’s Hospital following the regulations for the Administration of Affairs Concerning Experimental Animals and National Institutes of Health Guidelines.
Gene Set Enrichment Analyses (GSEA)
For the GSEA, HCC patients were classified into high- and low-ARHGAP20 groups by the median mRNA of ARHGAP20 in the TCGA-LIHC dataset. GSEA v3.0 (http://www.broadinstitute.org/gsea/, RRID: SCR_003199)22,23 was implemented to identify the significantly enriched cancer-related terms. Data from non-HCC samples were excluded. P<0.05 and a false discovery rate (FDR) q value <0.25 were considered statistically significant.
Correlation of KHK mRNA with HCC Immune Microenvironment
The TISIDB database (http://cis.hku.hk/TISIDB/browse.php)24 was first used to explore the correlation of ARHGAP20 expression with 28 tumor-infiltrating lymphocytes (TILs). Then the single sample gene set enrichment analysis (ssGSEA) method was applied in GSVA version 1.28.0. The R package was applied to the TCGA-LIHC dataset to further compare the difference in TILs between the high- and low-ARHGAP20 groups (also classified by the median value).24–26 Thirteen immune-related functions were also evaluated by ssGSEA. The cell markers used here were provided in Additional file 1: Table S1. The Estimate R package was used to estimate the tumor purity and stromal and immune cell percentages in the TCGA-LIHC dataset.27
Identification of Potential Inhibitors Targeting Dysregulated ARHGAP20
The CMap database (https://portals.broadinstitute.org/cmap/), an online database that record the transcriptional responses of human cells to chemical and genetic perturbation, was used to explore potential inhibitors targeting the dysregulated ARHGAP20 in HCC. HCC patients were classified into high- and low-ARHGAP20 groups by the median mRNA of ARHGAP20 in the TCGA-LIHC dataset. The differentially expressed genes (DEGs) between the high- and low-ARHGAP20 groups were screened by the limma R package using a value of a p<0.001.28 The DEGs were queried in the CMap database to identify potential inhibitors that might cause similar transcriptional responses. The top 10 inhibitors with the lowest P values were further analyzed for their mechanisms of action (moA) and drug targets (https://clue.io/).
Statistical Analysis
Statistical analyses were conducted using SPSS V19.0 (SPSS Inc., USA) and R software V3.5.1 (R Foundation for Statistical Computing, Vienna, Austria), and the results were presented using GraphPad Prism v7.00 (GraphPad Software Inc., U.S.A.). Pearson χ2 tests, Fisher’s exact tests, t-tests, or Wilcoxon tests were used as appropriate. Multivariate Cox regression analyses were performed with a forward stepwise procedure. P<0.05 was considered statistically significant.
Results
ARHGAP20 Was Downregulated in HCC
We first explored the expression of ARHGAP20 in public databases including TIMER, Oncomine, and HCCDB. In the TIMER database, a total of 15 cancers, including HCC, showed significantly lower ARHGAP20 expression in tumors compared with the normal controls (Figure 1A). In the Oncomine database, significantly lower ARHGAP20 expression was also identified in eight types of cancer (also including HCC) compared with the normal controls (Figure 1B). Then, we focused on the expression of ARHGAP20 in HCC. The HCCDB database is a public database that includes ten different HCC datasets for ARHGAP20 analysis. Eight out of ten datasets showed significantly lower ARHGAP20 in HCC than their normal controls in the HCCDB database (Figure 1C). The protein expression of ARHGAP20 in paired HCC and normal tissues was examined. Consistent with the results from the online database, HCC showed lower ARHGAP20 protein expression than normal tissues (Figure 1D and E). Taken together, these data revealed that ARHGAP20 was significantly downregulated in HCC.
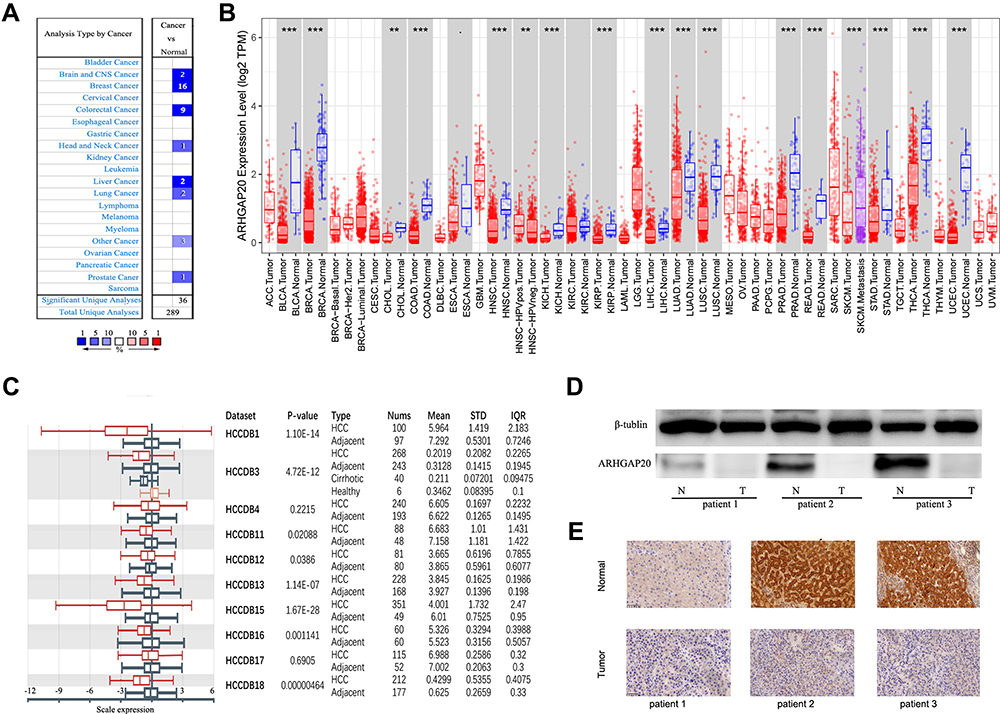 |
Figure 1 Expression of ARHGAP20 across various cancers and in HCC. (A) mRNA expression of ARHGAP20 in the Oncomine database; (B) mRNA expression of ARHGAP20 mRNA in the TIMER database; (C) mRNA expression of ARHGAP20 in the HCCDB database; (D) protein expression of ARHGAP20 in three HCC patients by Western blot; and (E) protein expression of ARHGAP20 in three HCC patients by immunohistochemistry. Notes: ***P <0.001, **P <0.01. |
ARHGAP20 Expression Inhibited HCC Migration and Invasion
To select appropriate cell lines for further investigation, we estimated the expression of ARHGAP20 in six cell lines (LO2, HepG2, HCCLM3, Huh7, PLC/PRF/5, and SKHEP1). HepG2 and HCCLM3 cells showed the lowest ARHGAP20, while the normal liver cell line LO2 exhibited the highest ARHGAP20 (Figure 2A). Therefore, the HepG2 and HCCLM3 cell lines were selected for subsequent experiments. We transfected HepG2 and HCCLM3 cells with an ARHGAP20 overexpression plasmid to enhance the expression of ARHGAP20 (OE cells) (Figure 2B and C). Upregulation of ARHGAP20 inhibited the expression of progression-related markers (including MMP2, MMP9, Snail, Twist, VEGF) but promoted the expression of the epithelial marker E-cadherin (Figure 2D). The upregulation of ARHGAP20 significantly inhibited wound healing, cell migration, and cell invasion (Figure 2E and J). Taken together, these data show that the upregulation of ARHGAP20 expression inhibited HCC migration and invasion.
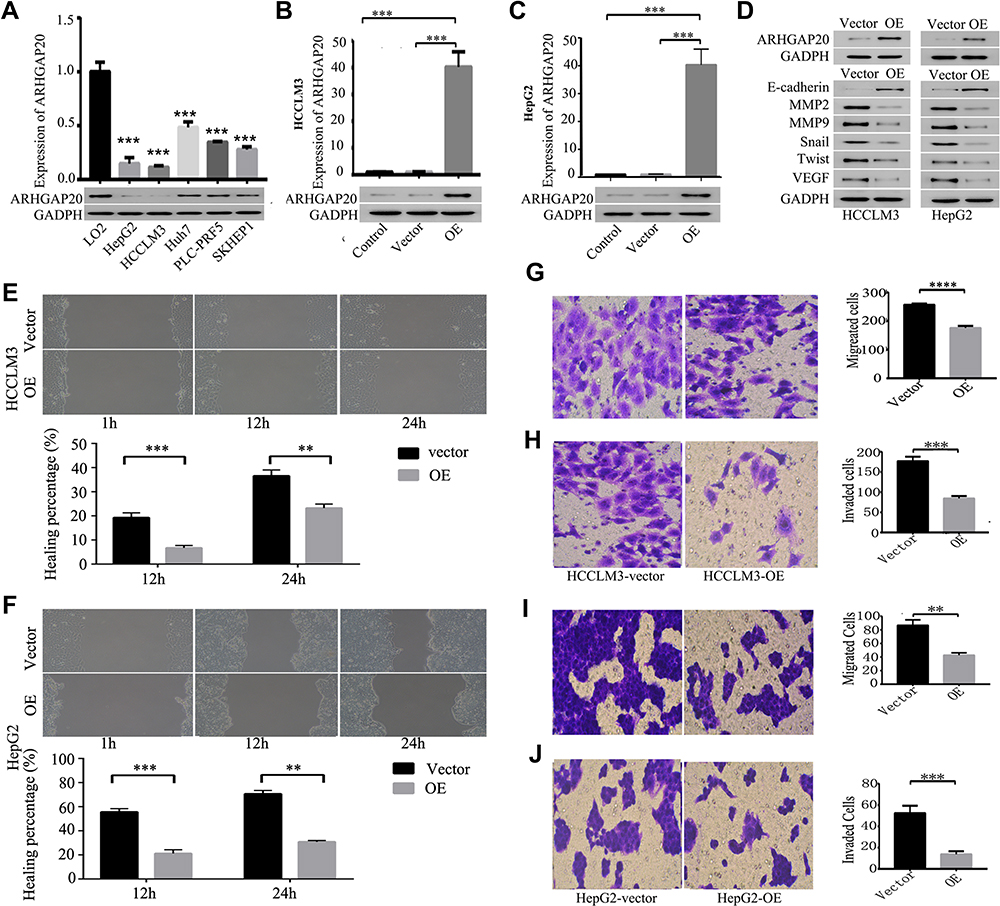 |
Figure 2 ARHGAP20 inhibited HCC migration and invasion. (A) Expression of ARHGAP20 in six cell lines; (B) expression of ARHGAP20 in HCCLM3 cell line after lentivirus transfection; (C) expression of ARHGAP20 in HepG2 cell line after lentivirus transfection; (D) ARHGAP20 inhibited the expression of progression-related markers; (E) ARHGAP20 inhibited wound healing in HCCLM3 cell line; (F) ARHGAP20 inhibited wound healing in HepG2 cell line; (G) ARHGAP20 inhibited cell migration in HCCLM3 cell line; (H) ARHGAP20 inhibited cell invasion in HCCLM3 cell line; (I) ARHGAP20 inhibited cell migration in HepG2 cell line; and (J) ARHGAP20 inhibited cell invasion in HepG2 cell line. P-value: ****<0.0001<***<0.001<**<0.01. Abbreviations: HCC, hepatocellular carcinoma; OE, overexpression group. |
ARHGAP20 Partially Inhibited the PI3K-AKT Signaling Pathway
To explore the potential signaling pathways involved in the dysregulated ARHGAP20 in HCC, we conducted the GSEA in TCGA-LIHC dataset. Using P<0.05 and FDR<0.25 as cutoffs, a total of four protein kinase B (AKT)-related signaling pathways, including the Biocarta AKT pathway, Creighton AKT signaling via mTOR DN/Up, and Bhat ESR1 targets via AKT DN, were significantly enriched (Figure 3A). Therefore, we further evaluated whether upregulated ARHGAP20 influenced the AKT signaling pathway. As shown in Figure 3B, upregulated ARHGAP20 inhibited the phosphorylation of AKT and phosphoinositide 3-kinase (PI3K) in the HCCLM3 cell line. Furthermore, while upregulated ARHGAP20 significantly inhibited the migration and invasion of HCCLM3 cells, adding rhIGF-1 (an agonist of the PI3K/AKT signaling pathway) could partially reversed the progression inhibition following ARHGAP20 overexpression (Figure 3C and D). Taken together, these results indicated that ARHGAP20 could partially inhibit the PI3K-AKT signaling pathway in HCC.
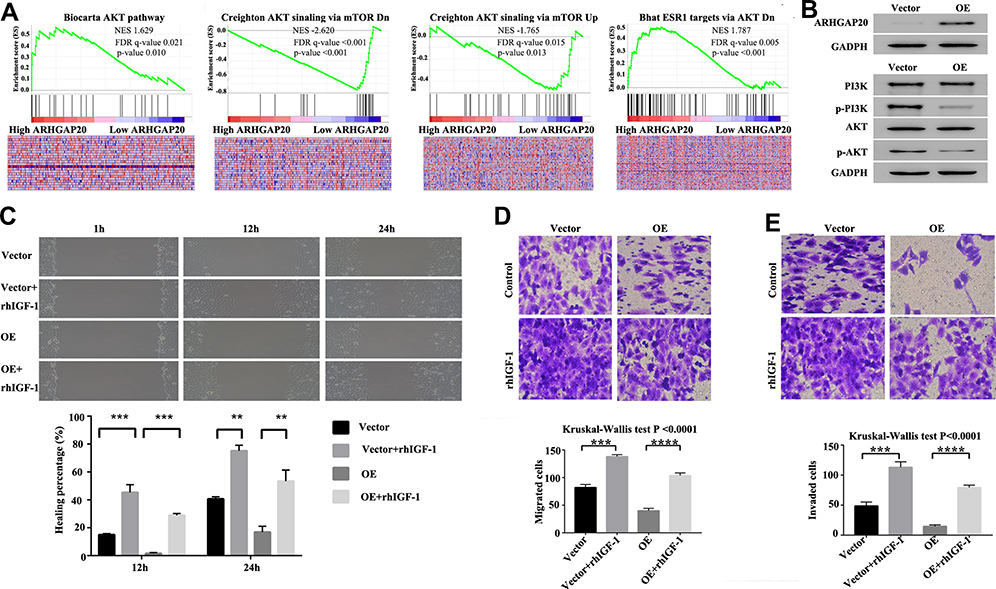 |
Figure 3 ARHGAP20 inhibited the PI3K-AKT signaling pathway in HCCLM3 cells. (A) Gene set enrichment analysis in the Cancer Genome Atlas-liver hepatocellular carcinoma dataset; (B) expression change of the PI3K-AKT signaling pathway markers following ARHGAP20 overexpression in HCCLM3 cells; (C) change of wound healing following ARHGAP20 overexpression and activation of PI3K-AKT signaling pathway; (D) change of cell migration following ARHGAP20 overexpression and activation of the PI3K-AKT signaling pathway; and (E) change of cell invasion following ARHGAP20 overexpression and activation of the PI3K-AKT signaling pathway. P-value: ****<0.0001<***<0.001<**<0.01. Abbreviation: OE, overexpression group. |
ARHGAP20 Promoted Lung Metastasis in Nude Mice
Next, lung metastasis models in mice were established (Figure 4A and B). Overexpression of ARHGAP20 significantly decreased the number of lung metastases in nude mice (Figure 4C). Furthermore, upregulated ARHGAP20 also inhibited the expression of progression-related markers (including MMP2, MMP9, Snail, Twist, and VEGF) but promoted the expression of the epithelial marker E-cadherin in vivo. Upregulated ARHGAP20 also inhibited the phosphorylation of AKT and PI3K (Figure 4D).
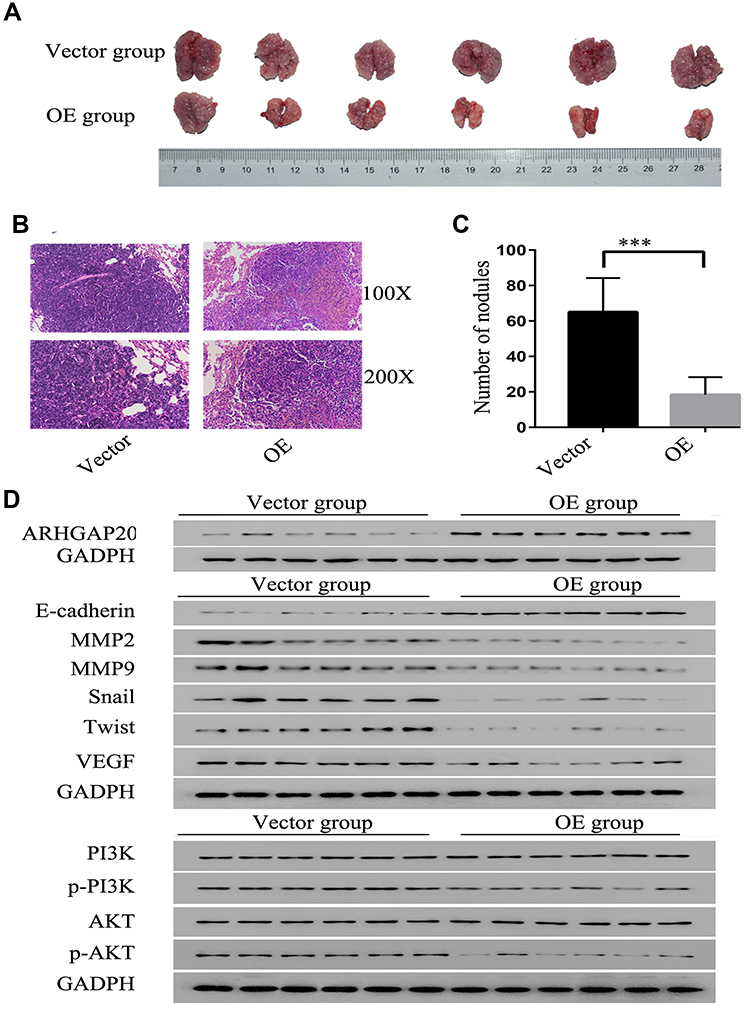 |
Figure 4 ARHGAP20 inhibited HCC progression by regulating the PI3K-AKT signaling pathway in nude mice. (A) Representative lung metastatic nodules following HCCLM3 cell injection. (B) Representative pathological staining for lung metastatic nodules. (C) ARHGAP20 decreased the number of lung metastatic nodules. (D) ARHGAP20 inhibited the expression of progression-related markers and PI3K-AKT signaling pathway markers. ***P-value <0.001. Abbreviation: OE, overexpression group. |
ARHGAP20 is Correlated with HCC Immune Microenvironment
The high ARHGAP20 group showed a significantly higher immune score and lower tumor purity than the low ARHGAP20 group (Additional file 2: Figure S1), indicating that ARHGAP20 might participate in the regulation of the HCC immune microenvironment. Therefore, to further compare the difference in TILs between high- and low-ARHGAP20 patients, the TISIDB database was then explored. Significant correlations were defined as Spearman correlation > 0.30 and P<0.05. ARHGAP20 was significantly correlated with different TILs in various cancers (Figure 5A), while ARHGAP20 was merely significantly correlated with natural killer (NK) cells, immature B cells, Type 1 helper (Th1) cells, and Type 2 helper (Th2) cells in HCC (Figure 5B). ssGSEA showed that the proportions of six antitumor TILs (Tem CD4, Tem CD8, Tcm CD4, Tcm CD8, Th1, and NK), six pro-tumor TILs (CD56dim, Treg, iDC, macrophage, MDSC, and neutrophil), and four other TILs (Act B, Mem B, Imm B, and monocyte) were significantly higher in the high-ARHGAP20 group than in the low-ARHGAP20 group (Figure 5C). Immune-related function analyses indicated that the CCR, HLA, parainflammation, and Type II IFN responses were also significantly higher in the high-ARHGAP20 group than in the low-ARHGAP20 group (Figure 5D). Based on the above results, we further investigated the distribution of markers of some TILs or immune function. The markers of CCR (including CCR2/4, XCR1, and CX3CR1) and HLA (HLADPA1) were most differently distributed when comparing the high- and low-ARHGAP20 groups (Additional file 3: Figure S2). Taken together, these results indicated a close correlation of ARHGAP20 with the HCC immune microenvironment, especially NK cells, Th1/2 cells, B cells, CCR, and HLA molecules.
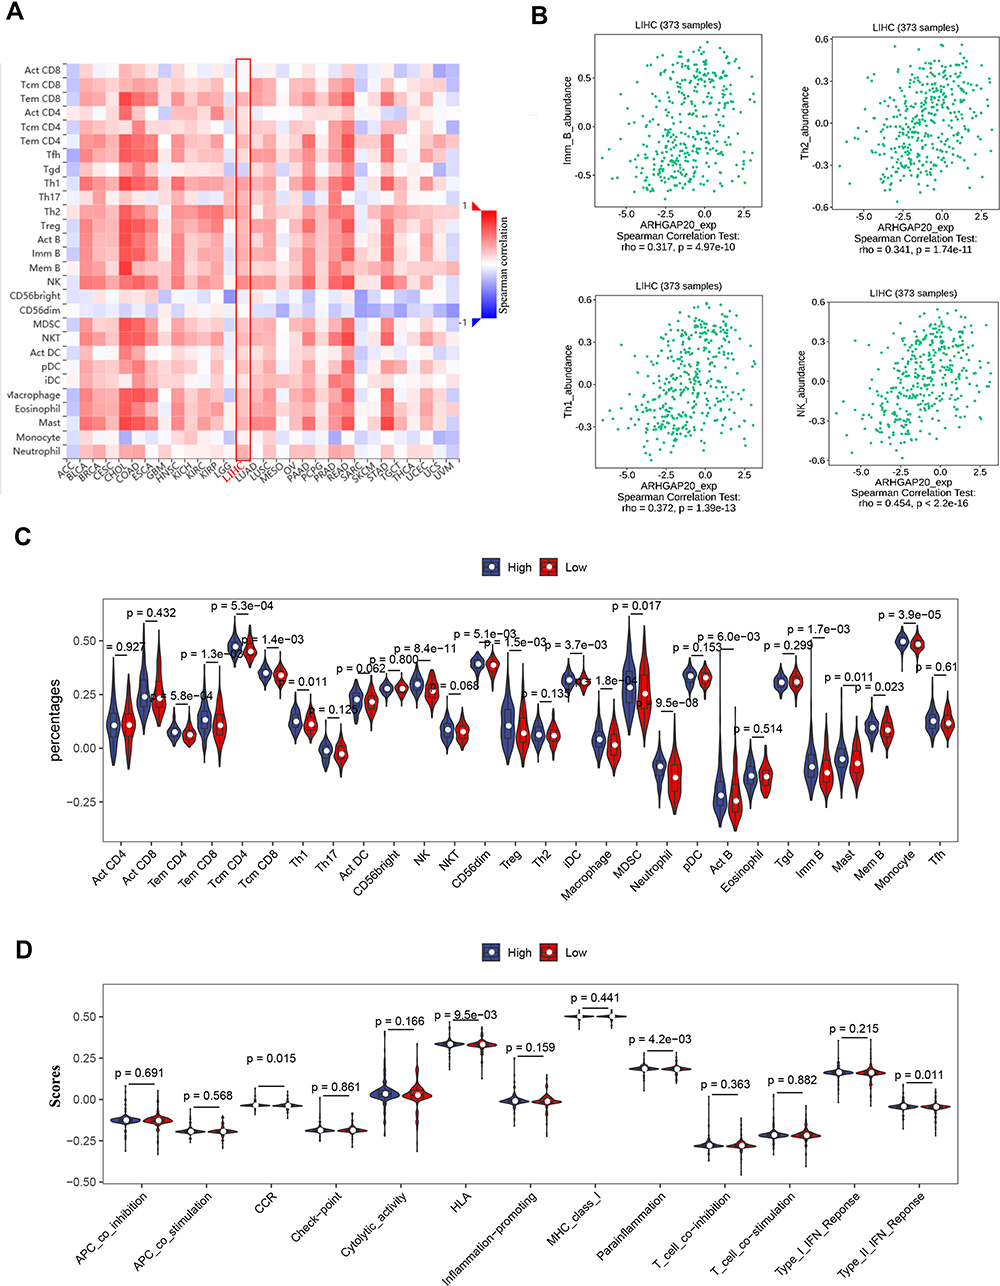 |
Figure 5 ARHGAP20 is correlated with the HCC immune microenvironment. (A) Correlation of ARHGAP20 expression with 28 tumor-infiltrating lymphocytes (TILs) in TISIDB database (http://cis.hku.hk/TISIDB/browse.php); (B) significantly correlated TILs in TISIDB database; (C) violin plot showing the difference of 28 TILs between the high- and low-ARHGAP20 groups; and (D) violin plot showing the difference of 13 immune-related functions between the high- and low-ARHGAP20 groups. Abbreviation: LIHC, liver hepatocellular carcinoma. |
Identification of Potential Inhibitors Targeting Dysregulated ARHGAP20
To identify potential inhibitors targeting dysregulated ARHGAP20, we first screened the DEGs between the high- and low-ARHGAP20 group. As a result, 378 upregulated and 385 downregulated DEGs were identified. These genes were queried in the CMap database, and the top ten potential inhibitors identified are shown in Table 1. Not surprisingly, three out of the top ten inhibitors targeted PI3K-AKT-related signaling pathways (wortmannin, sirolimus, and LY-294,002). The other seven potential inhibitors included three histone deacetylase (HDAC) inhibitors (trichostatin-a, valproic-acid, and MS-275), two heat shock protein (HSP) inhibitors (geldanamycin andtanespimycin), one dopamine receptor antagonist (trifluoperazine), and one topoisomerase inhibitor (irinotecan). A few inhibitors have been approved for the treatment of colorectal cancer (irinotecan), organ rejection (sirolimus), or neuropsychic disorders (trifluoperazine, valproic-acid). However, six of the identified inhibitors are still being tested in clinical trials.
 |
Table 1 The Top 10 Potential Drugs Potentially Targeting Dysregulated ARHGAP20 |
ARHGAP20 Expression is Correlated with the Survival of Cancer Patients
To explore the clinical role of dysregulated ARHGAP20 in HCC, an IHC assay was conducted in 70 patients with complete relevant clinical information. Representative IHC images are shown in Figure 6A. While ARHGAP20 was relatively strongly stained in the cytoplasmic regions of adjacent normal tissue, its expression in most HCC tissues was weak. Low-ARHGAP20 expression was significantly correlated with larger tumor size (P=0.031) and vascular invasion (P=0.017) (Table 2). Patients in the low-ARHGAP20 group exhibited significantly shorter OS (HR=0.11, 95% CI 0.04–0.29; P <0.001) but not RFS (Figure 6B). In addition to the traditional TNM stage, low-ARHGAP20 expression was another independent prognostic factor for HCC OS but not RFS (Figure 6C and D). Taken together, these results indicated that ARHGAP20 expression might be a promising independent prognostic factor for HCC OS.
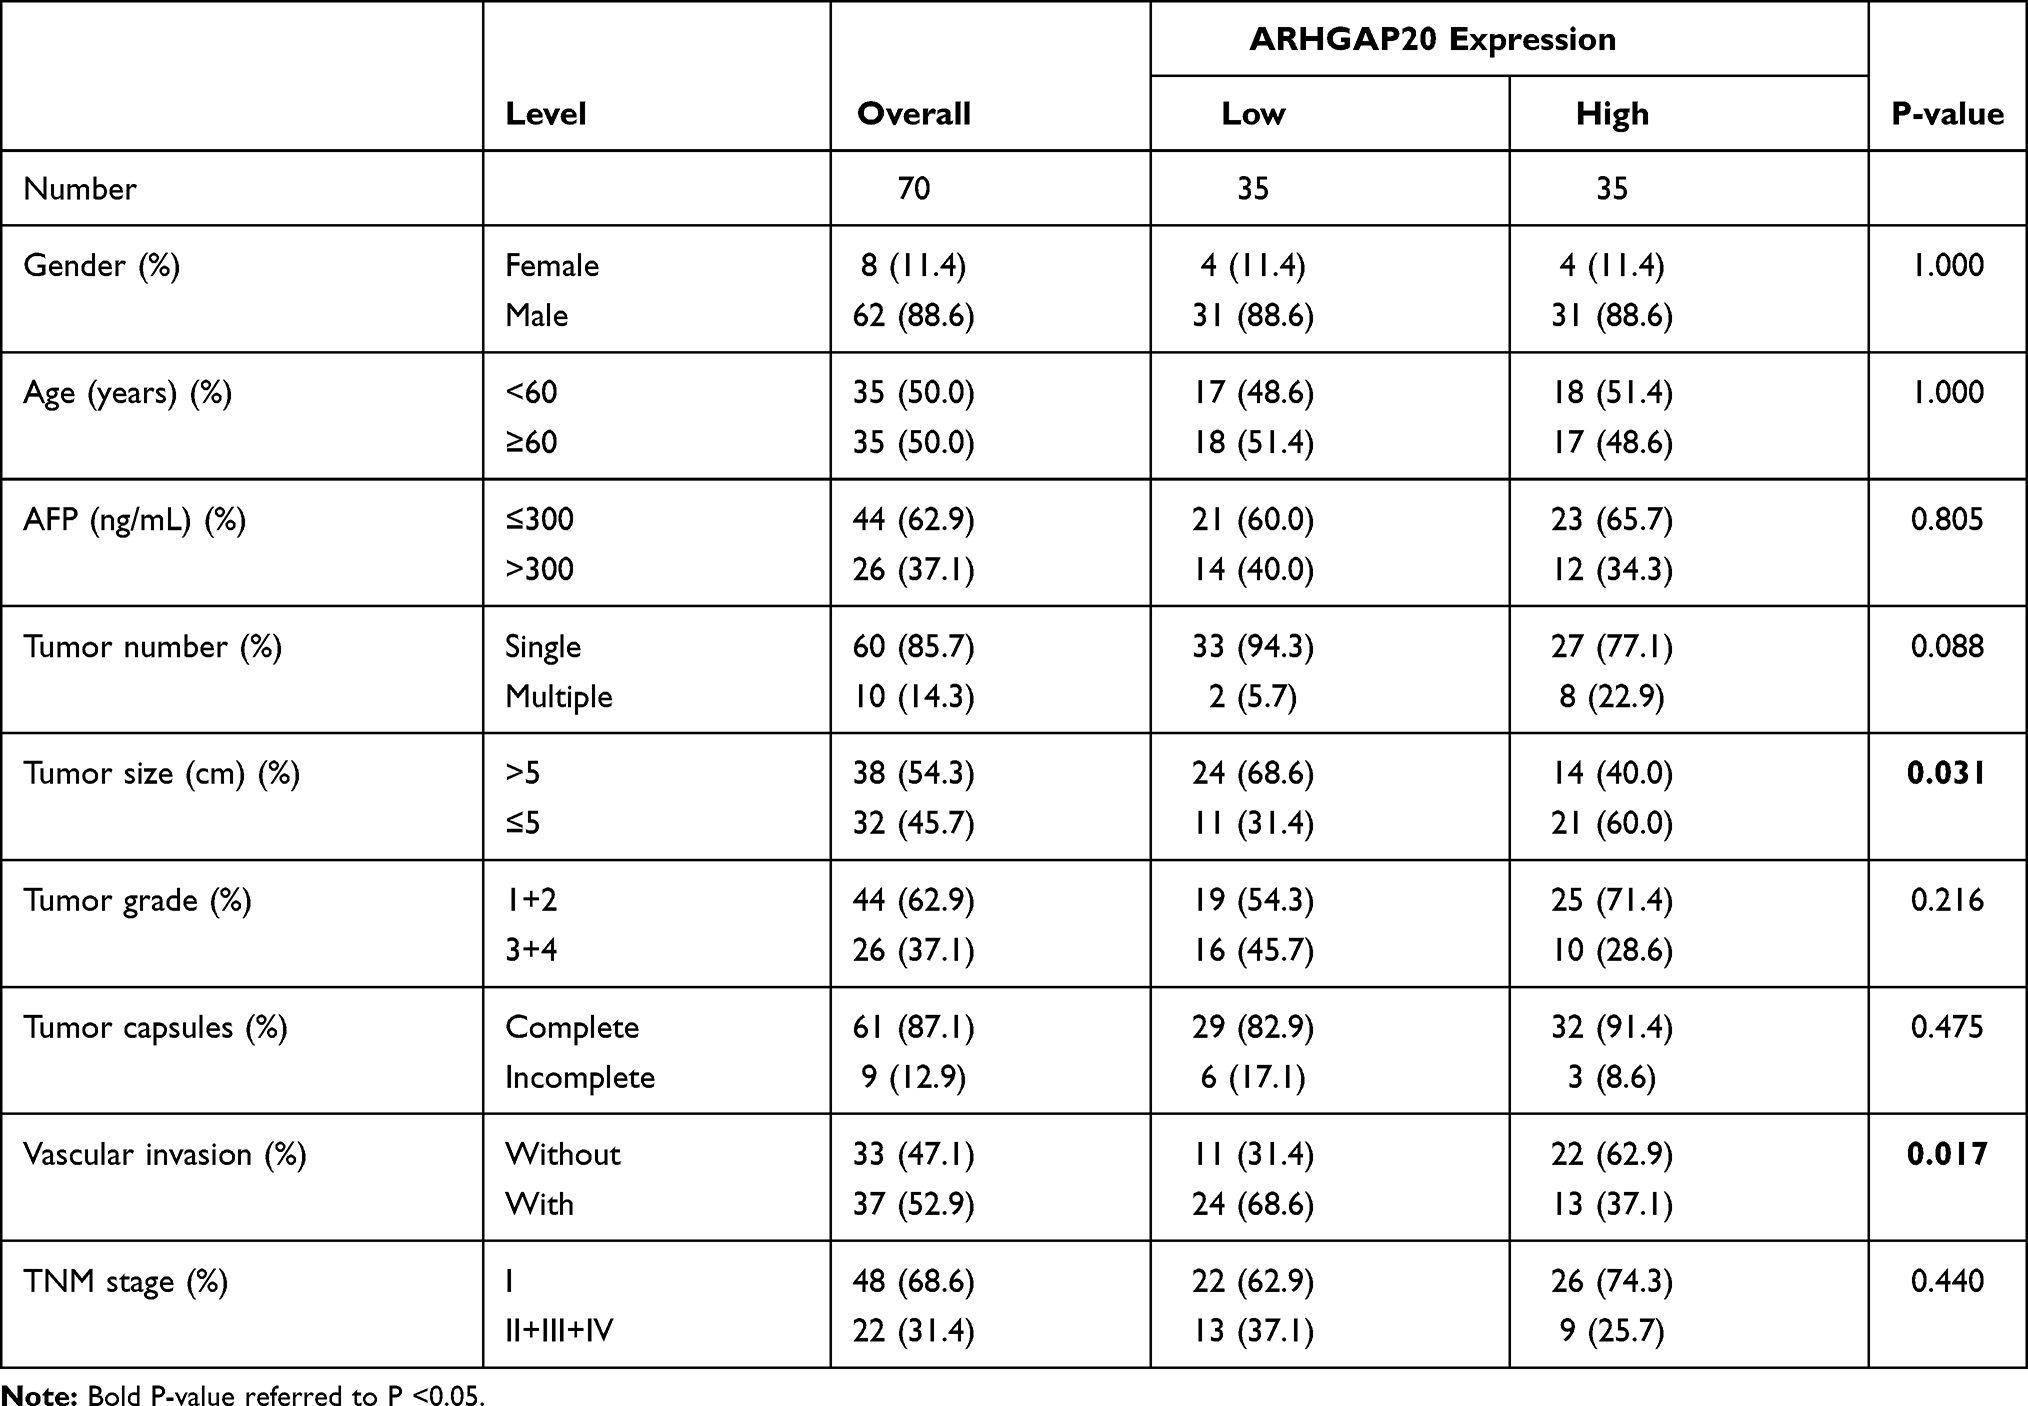 |
Table 2 The Correlation of ARHGAP20 Protein Expression with Clinicopathological Parameters in HCC |
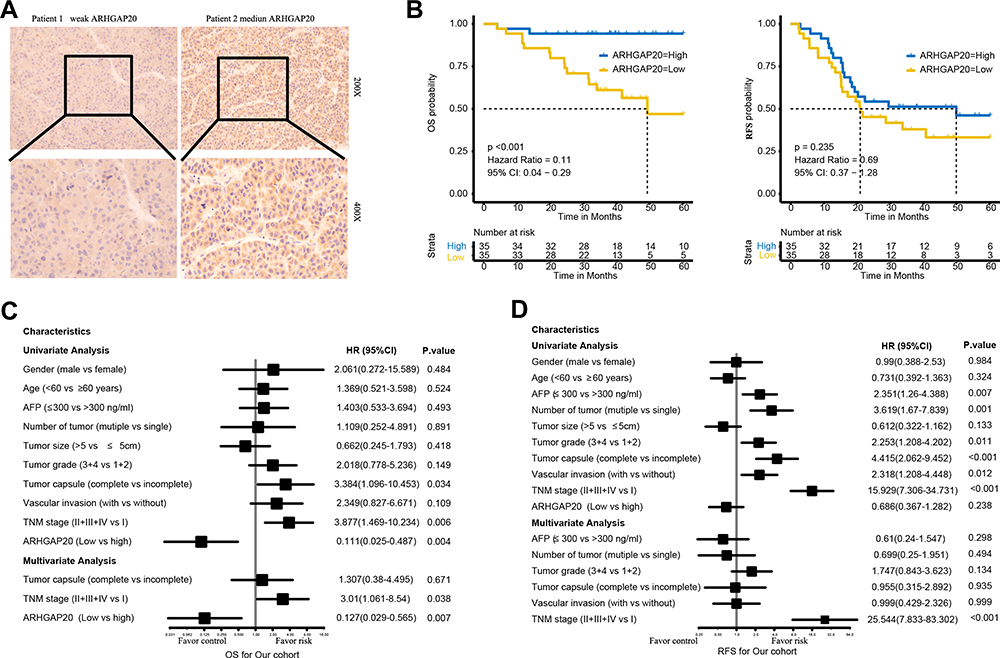 |
Figure 6 The clinical significance of ARHGAP20 dysregulation in HCC. (A) Representative image of ARHGAP20 expression in HCC tissues; (B) Kaplan–Meier survival curve showing the difference in overall survival (OS) and recurrence-free survival (RFS) in high- and low-ARHGAP20 HCC patients; (C) Cox regression analyses for OS in the Meizhou HCC cohort; and (D) Cox regression analyses for RFS in the Meizhou HCC cohort. |
Discussion
Although some GAPs have been implicated in various cancers, the expression and role of ARHGAP20 in cancer, especially in HCC, remain unknown. In this study, we found that ARHGAP20 served as a tumor suppressor gene (TSG) in HCC by negatively regulating migration and invasion. Furthermore, we revealed that downregulated ARHGAP20 was significantly correlated with larger tumor size and vasular invasion and could be used as an adverse independent prognostic factor for HCC OS but not RFS. Therefore, for the first time, we found that ARHGAP20, as a TSG, could inhibit HCC progression and serve as a novel independent prognostic biomarker for HCC.
PI3K/AKT phosphorylation and activation are necessary for HCC progression and metastasis.29 Based on the GSEA results, we found that ARHGAP20 upregulation suppressed the phosphorylation of AKT/PI3K molecules, while exposure to the PI3K-AKT pathway agonist rhIGF-1 partially rescued HCC inhibition caused by upregulated ARHGAP20. Furthermore, CMap analyses identified three PI3K-AKT-mTOR inhibitors potentially targeting ARHGAP20. All these results indicate that ARHGAP20 could exert its function by regulating the PI3K-AKT signaling pathway. However, the mechanism by which ARHAP20 regulates the PI3K/AKT phosphorylation and whether ARHAP20 exerts other functions via the PI3K-AKT signaling pathway remain to be further clarified. In addition, CMap analyses also identified several other potential inhibitors targeting dysregulated ARHGAP20, such as drugs targeting HDAC, HSP, dopamine receptor, and topoisomerase. Although, experimental data on the true effects of these drugs during ARHGAP20 dysregulation might provide promising directions for further mechanistic exploration, such data are lacking.
Weakened antitumor immunity and the enhanced protumor immunity lead to a dysregulated immune environment during HCC progression.30 The high-ARHGAP20 group exhibited a significantly higher proportion of NK cells and Th1 cells but not Th2 cells, which might help retain antitumor immunity. It seems contradictory that some protumor TILs (CD56dim, Treg, iDC, macrophage, MDSC, neutrophil) and proinflammatory chemokines (such as CCR2,31 and CCR432) were also significantly higher in the high-ARHGAP20 group. These results should be explained with great caution. On the one hand, high infiltration of these immune-suppressive TILs or immune molecules might also reflect an adaptive state for the overenhanced antitumor immunity in the high-ARHGAP20 group.33 On the other hand, the actual immune environment should represent the collective effect of antitumor and protumor components. Our results might indicate a close correlation of ARHAP20 expression with HCC immune components; however, they were merely descriptive and warrant further experimental validation.
To our knowledge, this is the first functional study to determine how dysregulated ARHGAP20 participates in HCC progression and identify promising inhibitors targeting ARHGAP20. However, some limitations do exist. First, the sample size of the included HCC patients was small, and the prognostic role of ARHGAP20 in HCC needs to be further investigated in more independent cohorts with a large sample size. Second, the direct-acting mechanisms underlying the participation of ARHGAP20 in HCC progression should be further explored. Third, our study focused on invasion and migration phenotypes, and the ability of ARHGAP20 to regulate other phenotypes such as proliferation, apoptosis and cell cycle, remains to be evaluated. Fourth, whether ARHGAP20 silencing has an opposite function of ARHGAP20 overexpression was not investigated.
Conclusions
In conclusion, our study revealed that ARHGAP20 was downregulated in HCC tissues and cells. ARHGAP20 could inhibit HCC progression by regulating the PI3K-AKT signaling pathway and the immune microenvironment in HCC.
Abbreviations
GSEA, gene set enrichment analyses; GAPs, GTPase-activating proteins; GEFs, guanine nucleotide-exchange factors; HCC, hepatocellular carcinoma; HDAC, histone deacetylase; OS, overall survival; AKT, protein kinase B; PI3K, phosphoinositide 3-kinase; RFS, recurrence-free survival; ssGSEA, single sample gene set enrichment analysis; TCGA-LIHC, The Cancer Genome Atlas-liver hepatocellular carcinoma dataset.
Data Sharing Statement
Data sharing is not applicable throughout this article.
Ethics Statement
Some data in this study were obtained from the TCGA database. The data acquisition and application method complied with the corresponding database guidelines and policies. All protocols were approved by the Ethics and Indications Committee of Meizhou People’s Hospital.
Acknowledgments
The authors thank the contributors of The Cancer Genome Atlas database for their contribution to the sequencing dataset and granting to open access.
Author Contributions
All authors made a significant contribution to the work reported, such as in the conception, study design, execution, acquisition of data, analysis and interpretation, or in all these areas; took part in drafting, revising or critically reviewing the article; gave final approval of the version to be published; have agreed on the journal to which the article has been submitted; and agree to be accountable for all aspects of the work.
Funding
This work was supported by the training program of the Scientific Research of Meizhou People’s Hospital (Award Number PY-C2019004, PY-C2019002, PY-C2020019), the Guangdong Basic and Applied Basic Research Foundation, China (Grant No. 2019A1515110651, 2021A1515010902); and the China Postdoctoral Science Foundation (Grant no. 2020M672554).
Disclosure
The authors declare that they have no competing interests.
References
1. Bray F, Ferlay J, Soerjomataram I, Siegel RL, Torre LA, Jemal A. Global cancer statistics 2018: GLOBOCAN estimates of incidence and mortality worldwide for 36 cancers in 185 countries. CA Cancer J Clin. 2018;68(6):394–424. doi:10.3322/caac.21492
2. Yang JD, Hainaut P, Gores GJ, Amadou A, Plymoth A, Roberts LR. A global view of hepatocellular carcinoma: trends, risk, prevention and management. Nat Rev Gastroenterol Hepatol. 2019;16(10):589–604. doi:10.1038/s41575-019-0186-y
3. Cabral LK, Tiribelli C, Sukowati CH. Sorafenib resistance in hepatocellular carcinoma: the relevance of genetic heterogeneity. Cancers. 2020;12(6):1576. doi:10.3390/cancers12061576
4. Ueyama T. Rho-Family Small GTPases: from highly polarized sensory neurons to cancer cells. Cells. 2019;8(2):92.
5. Aspenström P. Activated Rho GTPases in cancer-the beginning of a new paradigm. Int J Mol Sci. 2018;19(12):3949.
6. Svensmark JH, Brakebusch C. Rho GTPases in cancer: friend or foe? Oncogene. 2019;38(50):7447–7456. doi:10.1038/s41388-019-0963-7
7. Zhang H, Tang QF, Sun MY, et al. ARHGAP9 suppresses the migration and invasion of hepatocellular carcinoma cells through up-regulating FOXJ2/E-cadherin. Cell Death Dis. 2018;9(9):916. doi:10.1038/s41419-018-0976-0
8. Shih Y-T, Wang M-C, Zhou J, Peng -H-H, Lee D-Y, Chiu -J-J. Endothelial progenitors promote hepatocarcinoma intrahepatic metastasis through monocyte chemotactic protein-1 induction of microRNA-21. Gut. 2015;64(7):1132–1147. doi:10.1136/gutjnl-2013-306302
9. Yam JWP, Ko FCF, Chan C-Y, Jin D-Y, Ng IO-L. Interaction of deleted in liver cancer 1 with tensin2 in caveolae and implications in tumor suppression. Cancer Res. 2006;66(17):8367–8372. doi:10.1158/0008-5472.CAN-05-2850
10. Lu S, Zhou J, Sun Y. The noncoding RNA HOXD-AS1 is a critical regulator of the metastasis and apoptosis phenotype in human hepatocellular carcinoma. Mol Cancer. 2017;16(1):125. doi:10.1186/s12943-017-0676-x
11. Chen J, Huang X, Wang W. LncRNA CDKN2BAS predicts poor prognosis in patients with hepatocellular carcinoma and promotes metastasis via the miR-153-5p/ARHGAP18 signaling axis. Aging. 2018;10(11):3371–3381. doi:10.18632/aging.101645
12. Katoh M, Katoh M. Identification and characterization of human KIAA1391 and mouse Kiaa1391 genes encoding novel RhoGAP family proteins with RA domain and ANXL repeats. Int J Oncol. 2003;23(5):1471–1476.
13. Curry BJ, Su H, Law EG, McLaughlin EA, Nixon B, Aitken RJ. Identification of RARhoGAP, a novel putative RhoGAP gene expressed in male germ cells. Genomics. 2004;84(2):406–418. doi:10.1016/j.ygeno.2004.03.004
14. Yamada T, Sakisaka T, Hisata S, Baba T, Takai Y. RA-RhoGAP, Rap-activated Rho GTPase-activating protein implicated in neurite outgrowth through Rho. J Biol Chem. 2005;280(38):33026–33034. doi:10.1074/jbc.M504587200
15. Herold T, Jurinovic V, Mulaw M, et al. Expression analysis of genes located in the minimally deleted regions of 13q14 and 11q22-23 in chronic lymphocytic leukemia-unexpected expression pattern of the RHO GTPase activator ARHGAP20. Genes Chromosomes Cancer. 2011;50(7):546–558. doi:10.1002/gcc.20879
16. Kalla C, Nentwich H, Schlotter M, et al. Translocation t(X;11)(q13;q23) in B-cell chronic lymphocytic leukemia disrupts two novel genes. Genes Chromosomes Cancer. 2005;42(2):128–143. doi:10.1002/gcc.20131
17. Mounir M, Lucchetta M, Silva T, et al. New functionalities in the TCGAbiolinks package for the study and integration of cancer data from GDC and GTEx. PLoS Comput Biol. 2019;15(3):e1006701. doi:10.1371/journal.pcbi.1006701
18. Cerami E, Gao J, Dogrusoz U, et al. The cBio cancer genomics portal: an open platform for exploring multidimensional cancer genomics data: figure 1. Cancer Discov. 2012;2(5):401–404. doi:10.1158/2159-8290.CD-12-0095
19. Gao J, Aksoy BA, Dogrusoz U, et al. Integrative analysis of complex cancer genomics and clinical profiles using the cBioPortal. Sci Signal. 2013;6(269):pl1. doi:10.1126/scisignal.2004088
20. Li T, Fan J, Wang B. TIMER: a web server for comprehensive analysis of tumor-infiltrating immune cells. Cancer Res. 2017;77(21):e108–e110. doi:10.1158/0008-5472.CAN-17-0307
21. Lian Q, Wang S, Zhang G. HCCDB: a database of hepatocellular carcinoma expression atlas. Genomics Proteomics Bioinformatics. 2018;16(4):269–275. doi:10.1016/j.gpb.2018.07.003
22. Mootha VK, Lindgren CM, Eriksson K-F, et al. PGC-1α-responsive genes involved in oxidative phosphorylation are coordinately downregulated in human diabetes. Nat Genet. 2003;34(3):267. doi:10.1038/ng1180
23. Subramanian A, Tamayo P, Mootha VK, et al. Gene set enrichment analysis: a knowledge-based approach for interpreting genome-wide expression profiles. Proc Natl Acad Sci U S A. 2005;102(43):15545–15550. doi:10.1073/pnas.0506580102
24. Ru B, Wong CN, Tong Y, et al. TISIDB: an integrated repository portal for tumor–immune system interactions. Bioinformatics. 2019;35(20):4200–4202. doi:10.1093/bioinformatics/btz210
25. Barbie DA, Tamayo P, Boehm JS. Systematic RNA interference reveals that oncogenic KRAS-driven cancers require TBK1. Nature. 2009;462(7269):108–112. doi:10.1038/nature08460
26. Bindea G, Mlecnik B, Tosolini M. Spatiotemporal dynamics of intratumoral immune cells reveal the immune landscape in human cancer. Immunity. 2013;39(4):782–795. doi:10.1016/j.immuni.2013.10.003
27. Yoshihara K, Shahmoradgoli M, Martínez E, et al. Inferring tumour purity and stromal and immune cell admixture from expression data. Nat Commun. 2013;4(1):2612. doi:10.1038/ncomms3612
28. Ritchie M, Phipson B, Wu D, et al. limma powers differential expression analyses for RNA-sequencing and microarray studies. Nucleic Acids Res. 2015;43(7):e47. doi:10.1093/nar/gkv007
29. Ma X, Shen M, Hu B, et al. CD73 promotes hepatocellular carcinoma progression and metastasis via activating PI3K/AKT signaling by inducing Rap1-mediated membrane localization of P110β and predicts poor prognosis. J Hematol Oncol. 2019;12(1):37. doi:10.1186/s13045-019-0724-7
30. Chew V, Lai L, Pan L, et al. Delineation of an immunosuppressive gradient in hepatocellular carcinoma using high-dimensional proteomic and transcriptomic analyses. Proc Natl Acad Sci U S A. 2017;114(29):E5900–E5909. doi:10.1073/pnas.1706559114
31. Tan S, Zhao J, Sun Z, et al. Hepatocyte-specific TAK1 deficiency drives RIPK1 kinase-dependent inflammation to promote liver fibrosis and hepatocellular carcinoma. Proc Natl Acad Sci U S A. 2020;117(25):14231–14242. doi:10.1073/pnas.2005353117
32. Cheng X, Wu H, Jin Z, et al. Up-regulation of chemokine receptor CCR4 is associated with human hepatocellular carcinoma malignant behavior. Sci Rep. 2017;7(1):12362. doi:10.1038/s41598-017-10267-4
33. Lv M, Chen M, Zhang R, et al. Manganese is critical for antitumor immune responses via cGAS-STING and improves the efficacy of clinical immunotherapy. Cell Res. 2020;30(11):966–979. doi:10.1038/s41422-020-00395-4
 © 2021 The Author(s). This work is published and licensed by Dove Medical Press Limited. The
full terms of this license are available at https://www.dovepress.com/terms
and incorporate the Creative Commons Attribution
- Non Commercial (unported, 3.0) License.
By accessing the work you hereby accept the Terms. Non-commercial uses of the work are permitted
without any further permission from Dove Medical Press Limited, provided the work is properly
attributed. For permission for commercial use of this work, please see paragraphs 4.2 and 5 of our Terms.
© 2021 The Author(s). This work is published and licensed by Dove Medical Press Limited. The
full terms of this license are available at https://www.dovepress.com/terms
and incorporate the Creative Commons Attribution
- Non Commercial (unported, 3.0) License.
By accessing the work you hereby accept the Terms. Non-commercial uses of the work are permitted
without any further permission from Dove Medical Press Limited, provided the work is properly
attributed. For permission for commercial use of this work, please see paragraphs 4.2 and 5 of our Terms.