Back to Journals » International Journal of Nanomedicine » Volume 18
Aptamer-Based Functionalized SERS Biosensor for Rapid and Ultrasensitive Detection of Gastric Cancer-Related Biomarkers
Authors Shao P, Dong D, Huang Y, Wang Y, Pan L, Zhu Q, Wu Z, Jiang F, Wei W
Received 7 September 2023
Accepted for publication 2 December 2023
Published 11 December 2023 Volume 2023:18 Pages 7523—7532
DOI https://doi.org/10.2147/IJN.S434854
Checked for plagiarism Yes
Review by Single anonymous peer review
Peer reviewer comments 2
Editor who approved publication: Prof. Dr. RDK Misra
Ping Shao,1 Danyang Dong,1 Yong Huang,2 Yan Wang,1 Lian Pan,3 Qunshan Zhu,2 Zheng Wu,2 Fengjuan Jiang,4 Wei Wei2
1Department of Spleen and Stomach Diseases, Yixing Traditional Chinese Medicine Hospital, Wuxi, 214200, People’s Republic of China; 2Department of General Surgery, Jiangdu People’s Hospital Affiliated to Yangzhou University, Yangzhou, 225200, People’s Republic of China; 3Pathology Department, Yixing Traditional Chinese Medicine Hospital, Wuxi, 214200, People’s Republic of China; 4Department of Gastroenterology, Jiangdu People’s Hospital Affiliated to Yangzhou University, Yangzhou, 225200, People’s Republic of China
Correspondence: Wei Wei, Email [email protected]
Background: Gastric cancer (GC) as is the second deadliest malignancy still lacks rapid, simple and economical detection and early clinical screening techniques. Surface-enhanced Raman spectroscopy (SERS) is a spectroscopic technique based on the surface plasmon resonance of precious metal nanoparticles, which can effectively detect low-abundance tumor markers. Combining SERS technology with sensors has high potential in the diagnosis and screening of GC.
Methods: A novel Au/Si nano-umbrella array (Au/SiNUA) was prepared as a SERS substrate and the substrate was functionalized using the corresponding tumor marker aptamers for the detection of clinical biological samples using a one-step recognition release mechanism. Optimization of aptamer and complementary chain concentrations and detection time for optimal sensor preparation.
Results: Au/SiNUA were tested to have good SERS enhancement activity. The proposed aptamer biosensor has good specificity and stability, with a low detection time of 18 min and a limit of detection (LOD) at the fM level, which is superior to most of the methods reported so far; and the accuracy of the clinical assay is comparable to that of the ELISA method. The expression levels of PDGF-B and thrombin in the serum of GC patients and healthy individuals can be effectively detected and differentiated.
Conclusion: The ultrasensitive and specific aptamer biosensor is highly feasible for the diagnosis and screening of GC and has good application prospects.
Keywords: surface-enhanced Raman scattering, gastric cancer, aptamer, biosensor, Au/SiNUA
Introduction
Gastric cancer (GC) is one of the most common malignant tumors, with the second highest incidence and mortality rate of malignant tumors in the world.1,2 The 5-year survival rate of patients with early GC can reach 50%, while the 5-year survival rate of patients with advanced GC is only 3–5%.3,4 One of the important reasons is that most GC patients do not have obvious symptoms in the early stage, so they miss the golden time of early diagnosis and are in the progressive stage when diagnosed.5–7 Currently, the most reliable method to diagnose GC is endoscopy. However, endoscopy is an invasive test with certain risks and poor patient compliance and tolerance, so it is not suitable as a routine screening test.8,9
Liquid biopsy is a testing technique that provides insights into the molecular characteristics and dynamic changes associated with diseases by analyzing bodily fluid samples. This approach offers several advantages over traditional tissue biopsies, including non-invasiveness, convenience, flexibility in sampling, and high patient compliance.10,11 In recent years, there has been a growing interest in utilizing tumor markers as liquid biopsy markers, as they exhibit changes in response to the onset and progression of various cancers. The combined detection of these tumor markers enables the dynamic monitoring of tumor development, clinical efficacy assessment, and patient prognosis, ultimately enhancing detection rates and differential diagnosis accuracy. Currently, biomarkers for GC primarily encompass carcinoembryonic antigen (CEA), alpha-fetoprotein (AFP), and CA19-9. These markers hold diagnostic and prognostic value, particularly for specific pathological subtypes of gastric cancer.12–14 Researchers have dedicated significant efforts to identifying additional, specific biomarkers associated with GC.15–17 Platelet-derived growth factor-B (PDGF-B), recognized as a pro-angiogenic factor, plays a pivotal role in tumor growth and angiogenesis. Studies have established a close correlation between PDGF-B and the development of GC, as well as lymphatic metastasis.18–20 Zhao et al reported that elevated PDGF-B expression in gastric cancer tissues was associated with poor prognosis and reduced patient survival, making it a valuable indicator for assessing the biological behavior and prognosis of GC.21 Additionally, thrombin, a multifunctional serine protease, has been implicated in stimulating tumor growth, metastasis, and angiogenesis.22,23 It holds promise as a potential biomarker for the early diagnosis of GC.
Surface-enhanced Raman scattering (SERS) is a Raman scattering phenomenon associated with nanoscale effects.24–26 When the sample to be tested is adsorbed on the surface of a metal (commonly Au or Ag) structure with nanometer-scale roughness, the localized surface plasmon resonance of the metal nanoparticles will cause the electromagnetic field to be enhanced, which will multiply the Raman signals of the sample molecules exponentially.27 SERS detection has the advantages of a high signal-to-noise ratio, fast detection, and independence from water and solvents; it has gained wide application in recent years in the fields of bio-diagnostics, food safety, and environmental monitoring.28,29 Even so, the sensitivity and specificity of SERS are still insufficient when dealing with low-abundance tumor markers. Meanwhile, the current methods for protein-based serum tumor marker detection include fluorescence immunoassay, chemiluminescence, and enzyme-linked immunosorbent assay (ELISA), which are generally complicated, time-consuming, and expensive.30–32 Therefore, there is an urgent need for a simple, rapid and ultrasensitive method for the detection of protein markers.
Biosensors have gained much attention in recent years as an emerging disciplinary artifact between information and biotechnology. The two most important parts of a biosensor are the bio sensitive membrane and the transducer.33 When detecting, the substance to be measured enters into the already fixed bio sensitive membrane by physical means such as osmosis and flow, in which the substance to be measured reacts with the molecular recognizers to produce quantitative or qualitative signals that can be read, so that the concentration of the substance to be measured can be known. According to the detection device, biosensors can be categorized into optical biosensors and electrochemical biosensors, which generally have the advantages of wide application, easy operation, rapidity and accuracy, and have good application prospects in the fields of clinical diagnosis, food safety and environmental monitoring.34,35
Here, we developed an aptamer biosensor based on a one-step recognition-release mechanism using Au/Si nano-umbrella arrays (Au/SiNUA) as a SERS substrate for the simple, fast and ultrasensitive detection of GC-related biomarkers PDGF-B and thrombin (Scheme 1). The innovatively prepared Au/SiNUA was in a uniform array structure, which can significantly improve the SERS signal while ensuring the stability and reproducibility of the detection. First, the activated aptamers of PDGF-B and thrombin were reacted with complementary single-stranded DNA (modified by Raman signaling molecules (5-FAM and Cy5)) to form a double-stranded structure, followed by modification of the double-stranded structure (sulfhydryl group at the end of the aptamer) on Au/SiNUA to construct an aptamer biosensor. When a target was present, the aptamer would specifically capture the corresponding target, causing competitive shedding of the complementary ssDNA (5-FAM and Cy5 away from Au/SiNUA), resulting in a significant reduction of the SERS signal (one-step reaction). Based on this strategy, specific and ultrasensitive detection of PDGF-B and thrombin can be accomplished in a short period of time, making this aptamer biosensor a great potential for GC diagnosis and screening.
 |
Scheme 1 Principles of SERS-based aptamer sensor for the detection of PDGF-B and thrombin. |
Materials and Methods
Materials and Reagents
Polystyrene sphere (PS, 250 nm diameter) suspension (5% wt), ethanol, n-hexane, 5-Carboxyfluorescein (5-FAM), cyanine dye (Cy5), tris(2-carboxyethyl) phosphine (TCEP) and phosphate-buffered saline (PBS) were purchased from Sinopharm Chemical Reagent Suzhou Co. The aptamers used in the experiments as well as the complementary ssDNA were synthesized by Sangon Biotech (Shanghai, China) Co., Ltd. Detailed information is provided in Table S1 (Supporting Information). The Milli-Q purification system was used to prepare ultrapure water with a resistivity of 18.2 MΩ∙cm throughout the experiment.
Clinical Sample Collections
After signing an informed consent form, clinical serum samples were collected from Yixing Traditional Chinese Medicine Hospital, China (30 healthy individuals and 30 GC patients, respectively). The experiment was approved by the Research Ethics Committee of Yixing Traditional Chinese Medicine Hospital. This study is in line with the Declaration of Helsinki. The patients’ information is shown in Table S2.
Preparation of Au/SiNUA
PS spheres were prepared as monolayer films using the liquid-liquid interface self-assembly method. Briefly, 6 mL of PS ball suspension, 3 mL of n-hexane, and 3 mL of ethanol were sequentially added to a beaker and left to form the film. After that, the monolayer PS ball template was obtained by fishing out the silicon wafers using hydrophilic treatment. Immediately after that, the PS sphere template was heated in an oven. And then, the PS ball was etched using a plasma etcher, rinsed using ethanol after 200 s, and annealed for 2 h. The SiNCA was obtained after removing the residue. Finally, an Au film was sputtered on its surface using a magnetron sputterer to prepare Au/SiNUA.
Preparation of Aptamer Biosensors
In order to detect PDGF-B and thrombin simultaneously and obtain the same level of SERS signal, the aptamer and complementary strand (modified with Raman signaling molecules) on the sensor must be kept in equal amounts. Add 2 μL TCEP (75 mM) to 20 μL of aptamer mix (Apt-PDGF-B: Apt-Thrombin=1:1) for activation of the aptamer strand. 25 minutes later, add 20 μL of complementary ssDNA (two ssDNAs modified with Raman signaling molecules 5-FAM and Cy5, respectively) mix (ssDNA1: ssDNA2=1:1): ssDNA2=1:1) and left at room temperature for 25 min to allow the aptamer to bind to the corresponding complementary strand. Subsequently, the above mixed solution was added to Au/SiNUA and incubated with shaking for 12 hours. During the incubation process, the double-stranded structure after binding of the aptamer to the complementary strand was attached to Au/SiNUA through the sulfhydryl group at the end of the aptamer, and the aptamer biosensor was prepared.
Instruments
S-4800 II field emission scanning electron microscope (Hitachi, Japan), magnetron sputterer (VTC-600-2HD). SERS spectra were acquired using an inVia confocal Raman spectrometer (Renishaw) with an excitation wavelength of 785 nm. Spectral processing was performed using Renishaw software (WiRETM) for operation and data acquisition. A baseline correction was performed to suppress background noise.
Measurement Procedure
The different sample solutions were added dropwise to the aptamer biosensor and placed at 37 °C for incubation for 18 min before being used for SERS measurements.
Results and Discussions
Characterization of the Au/SiNUA
The morphological structure of Au/SiNUA was characterized using SEM images as shown in Figure 1A and B. Under reactive ion etching (RIE) and magnetron sputtering instrumentation, the Au/SiNUA showed an ordered and regular umbrella array structure with individual diameters of about 210 nm and Au nanoparticles attached to the surface. Modification of Au/SiNUA using 4-MBA was used to analyze its SERS enhancement effect (Figure 1C), and the EF was calculated as 6.71×10⁸ by EF = (IS/CS)/(IR/CS). Meanwhile, by acquiring the SERS mapping image at 1079 cm−1 (Figure 1D) and SERS intensities at 25 random points (Figure 1E and F). It can be seen that the SERS mapping image shows a uniform green color. In addition, the SERS spectral images and the characteristic peak intensities were at the same level, so this Au/SiNUA has good homogeneity. After that, five batches of Au/SiNUA were prepared and SERS spectra were obtained (Figure 1G), and the almost uniform spectral waveforms surface its reproducible preparation. In addition, the SERS spectra and intensities (Figure 1H and I) were examined at different times, and only 7.98% decrease was observed after 15 days with excellent stability. Therefore, Au/SiNUA has good SERS properties and can be used as a SERS substrate for the construction of biosensors.
 |
Figure 1 SEM images of Au/SiNUA: (A) low magnification and (B) high magnification. (C) Raman spectra of 4-MBA@Au/SiNUA and 4-MBA alone. (D) SERS mapping of Au/SiNUA measured at 1079 cm−1. (E) SERS spectra of randomly selected 25 points of Au/SiNUA and (F) the intensity of the characteristic peaks at 1079 cm-1. (G) SERS spectra of Au/SiNUA prepared from different batches. (H) Stability testing of Au/SiNUA and (I) the intensity of the characteristic peaks at 1079 cm−1. |
Optimization of Experimental Conditions
To obtain the best sensor detection performance, ssDNA concentration, reaction temperature, and time were optimized, respectively. As shown in Figure 2A, the SERS intensity at 1178 cm−1 and 1365 cm−1 increased with the increase in the concentration of two ssDNA (modified with Raman signal molecules), reaching a stable state at 1200 nmol/L. The reason was that as the ssDNA concentration increases, the Raman signal molecules (5-FAM and Cy5) modified on the Au/SiNUA surface gradually increase until reaching a saturation state. Therefore, 1200 nmol/L was selected as the concentration of both ssDNA in subsequent experiments. Figure 2B showed the effect of different temperatures on the SERS signals, and the SERS intensity first increased and then decreased with the increase in temperature and reached the maximum at 37 °C. Therefore, the reaction temperature was optimized to 37 °C. Meanwhile, Figure 2C showed the effect of reaction time, with the change of time, more and more ssDNA was competitively shed, leading to the decrease of SERS signal and was constant at 18 min. Therefore, the reaction time of 18 min was chosen for the final experiment.
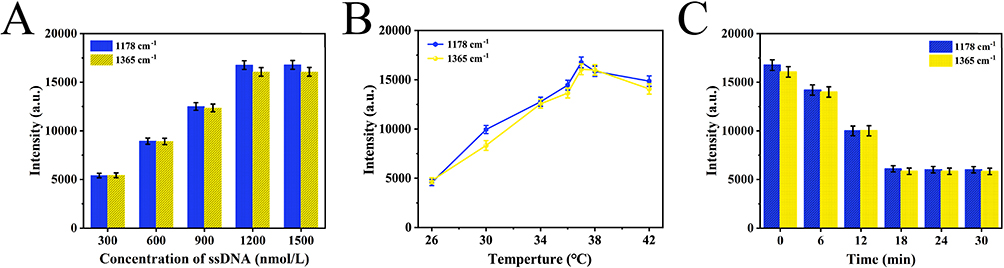 |
Figure 2 (A) Concentrations of ssDNA, (B) temperature, and (C) incubation times with PDGF-B&thrombin. |
Sensor Specificity and Stability Analysis
The sensor’s performance, encompassing factors such as specificity and stability, significantly impacts the efficacy of the detection process and, therefore, necessitates comprehensive evaluation. To assess the specificity of the aptamer biosensor assay, a range of different targets, including Blank, CEA, AFP, CA125, CA199, and PDGF-B&thrombin, were tested. As depicted in Figure 3A, the SERS spectral intensity remained consistent in the absence of the assay targets. However, in the presence of PDGF-B&thrombin, a notable reduction in SERS signal intensity was observed. The distinctions in intensity corresponding to characteristic peaks at 1178 cm−1 and 1365 cm−1 are presented in Figure 3B and C, providing a clear assessment of the variances. The stability of the sensors assumes particular importance in specific environmental conditions. Hence, these sensors were separately stored for varying durations (1d, 3d, 6d, 9d and 12d) to assess their performance consistency. The resulting SERS spectra, displayed in Fig. S1, reveal that after 12 days of storage, the intensity of the characteristic peaks at 1178 cm−1 and 1365 cm−1 exhibited a modest decrease of 6.73% and 6.29%, respectively. This outcome demonstrates the expected level of sensor stability.
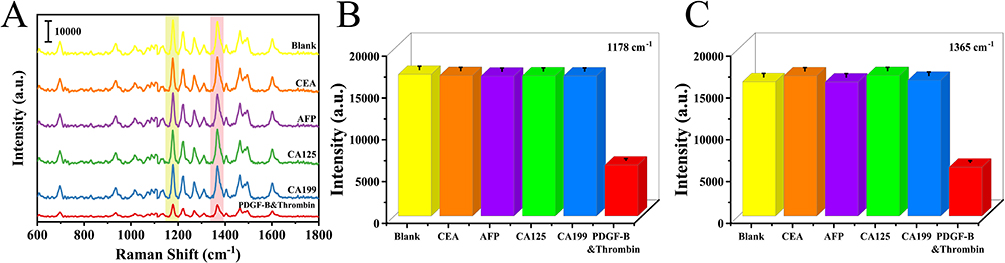 |
Figure 3 (A) Different targets (Blank, CEA, AFP, CA125, CA199, and PDGF-B&thrombin) were analyzed for specificity. (B) Histograms of the intensity of the corresponding characteristic peaks at 1178 cm−1 and (C) 1365 cm−1. |
Quantification of PDGF-B and Thrombin
To analyze the sensitivity of this aptamer biosensor, different concentrations of PDGF-B and thrombin were dispersed into serum and SERS spectra of different concentrations of PDGF-B & thrombin in serum were obtained (Figure 4A). It can be seen that as the concentration rises, the more obvious the SERS signal decreases. Upon analysis, a linear relationship was observed between the logarithm of the concentration of PDGF-B and the difference value of the characteristic peak at 1178 cm−1 with a linear equation of y=2441.15x+35746.13, R2=0.981 (Figure 4B). Similarly, a linear equation was observed between the logarithm of the concentration of thrombin and the difference value of the characteristic peak at 1365 cm−1 with a linear equation of y=2498.18x+37284.52, R2=0.989 (Figure 4C). Based on this, the limit of detection (LOD) for PDGF-B and thrombin could be calculated as 2.18 fM and 2.79 fM, and the assay time was as low as 18 min, which was superior to most reported methods (Table 1).
 |
Table 1 Comparison of This Strategy with Other Methods in Biomarkers Detection |
 |
Figure 4 (A) SERS spectra of serum with different concentrations (10−14-10−9 M) of PDGF-B and thrombin (PDGF-B:thrombin=1:1). (B) Relationship between the SERS intensity difference at 1178 cm−1 of the aptamer biosensor and the logarithm of PDGF-B concentration. (C) SERS intensity difference versus logarithm of thrombin concentration at 1365 cm−1 for the aptamer biosensor. |
Diagnosis of Gastric Cancer
After analyzing the sensitivity of the aptamer biosensor, GC was diagnosed using gastric endoscopy and pathological analysis. Figure 5A showed the result of gastric endoscopy in a patient with GC. A deep-sunken ulcer with a surface covered with white moss was seen in the minor curvature of the stomach. The ulcer margin was red, swollen, irregular, brittle and easy to bleed. The section of gastric endoscopic biopsy tissue showed that the structure of the gland was disorganized, the nucleus appeared obvious atypia, and the ratio of nucleus to plasma was abnormal (Figure 5B). CT scan results show that the bottom of the stomach and the stomach body appeared thickening and edema (Figure 5C). There were several small lymph nodes on the lesser curvature of the stomach, some of which were slightly enlarged (Figure 5D). Pathological sections of the surgical sample confirmed that the patient had a poorly differentiated gastric adenocarcinoma (Figure 5E) with lymph node metastasis (Figure 5F).
 |
Figure 5 (A) The result of gastric endoscopy in a patient with GC. (B) The section of gastric endoscopic biopsy tissue. (C) and (D) CT scan. (E) and (F) Pathological sections of the surgical sample. |
Real Sample Analysis
The aptamer-functionalized biosensor proposed herein was used to detect PDGF-B and thrombin in the serum of 30 healthy individuals and GC patients, respectively, to assess the authenticity of its clinical detection. By comparing the serum-averaged SERS spectra of healthy individuals and GC patients, it was observed that the expression levels of PDGF-B and thrombin were significantly elevated in GC patients, as shown in Figure 6A. The mean intensities of the characteristic peaks at 1178 cm−1 and 1365 cm−1 corresponding to healthy individuals and GC patients were shown in Figure 6B. Comparison showed that the intensity of SERS at 1178 cm−1 was reduced in GC patients, indicating an elevated level of PDGF-B expression in serum. Similarly, the serum expression level of thrombin was significantly increased in GC patients (1365 cm−1). Student’s t-test (*p<0.05, * * p<0.01, * * * p<0.001) was used to test the significance of the characteristic peak intensities at 1178 cm−1 and 1365 cm−1 (Figure 6B), which showed that the differences in the expression levels of PDGF-B and thrombin in the serum of GC patients and healthy subjects were statistically significant. Afterward, the expression levels were calculated using the corresponding linear relationship curves, and the results were compared with those of the ELISA assay, which proved that the assay fidelity of the method could satisfy the clinical trials (Table 2).
 |
Table 2 Comparison of Results from SERS and ELISA Assay Detection |
 |
Figure 6 (A) The average spectra of healthy people and GC patients. (B) Histograms of SERS intensity at 1178 cm−1 and 1365 cm−1 in serum from healthy people and GC patients (***p<0.001). |
Conclusion
In summary, an aptamer biosensor based on the recognition release mechanism was proposed for the detection of GC-related markers PDGF-B and thrombin. Among them, the SERS substrate (Au/SiNUA), which was the main body of the sensor, has good SERS activity, homogeneity, reproducibility, and stability. In addition, the aptamer-functionalized Au/SiNUA exhibited excellent specificity and sensitivity for PDGF-B and thrombin, with LODs of 2.18 fM and 2.79 fM over a linear range of 10−14-10−9 M, respectively, and detection times as low as 18 min. Meanwhile, the aptamer biosensor was comparable to the ELISA method in terms of its fidelity for clinical detection. In conclusion, this strategy provides a simple, rapid, and ultrasensitive assay for PDGF-B and thrombin, as well as a new idea for other marker assays.
Acknowledgments
This work was supported by the Social Development Foundation of Yangzhou (YS202206), and the Jinshan Talent-Jiang Yan Program, National Clinical Research Base of TCM (Jiangsu Academy of TCM) project (JD2022SZXMS10), and Wuxi Health Commission project (Q202243).
Disclosure
The authors report no conflicts of interest in this work.
References
1. Li K, Zhang A, Li X, Zhang H, Zhao L. Advances in clinical immunotherapy for gastric cancer. Bba-Rev Cancer. 2021;1876(2):188615.
2. Sitarz R, Skierucha M, Mielko J, Offerhaus GJA, Maciejewski R, Polkowski WP. Gastric cancer: epidemiology, prevention, classification, and treatment. Cancer Manag Res. 2018;10:239–248. doi:10.2147/CMAR.S149619
3. Ang TL, Fock KM. Clinical epidemiology of gastric cancer. Singap Med J. 2014;55(12):621–628. doi:10.11622/smedj.2014174
4. Smyth EC, Nilsson M, Grabsch HI, van Grieken NCT, Lordick F. Gastric cancer. Lancet. 2020;396(10251):635–648. doi:10.1016/S0140-6736(20)31288-5
5. Guggenheim DE, Shah MA. Gastric cancer epidemiology and risk factors. J Surg Oncol. 2013;107(3):230–236. doi:10.1002/jso.23262
6. Tan Z. Recent advances in the surgical treatment of advanced gastric cancer: a review. Med Sci Monit. 2019;25:3537–3541. doi:10.12659/MSM.916475
7. Thrift AP, El-Serag HB. Burden of gastric cancer. Clin Gastroenterol Hepatol. 2020;18(3):534–542. doi:10.1016/j.cgh.2019.07.045
8. Orditura M, Galizia G, Sforza V, et al. Treatment of gastric cancer. World J Gastroenterol. 2014;20(7):1635–1649. doi:10.3748/wjg.v20.i7.1635
9. Song Z, Wu Y, Yang J, Yang D, Fang X. Progress in the treatment of advanced gastric cancer. Tumor Biol. 2017;39(7):714626. doi:10.1177/1010428317714626
10. Li W, Liu J-B, Hou L-K, et al. Liquid biopsy in lung cancer: significance in diagnostics, prediction, and treatment monitoring. Mol Cancer. 2022;21(1). doi:10.1186/s12943-022-01505-z
11. Poulet G, Massias J, Taly V. Liquid biopsy: general concepts. Acta Cytol. 2019;63(6):449–455. doi:10.1159/000499337
12. Chen S, Li T, Zhao Q, Xiao B, Guo J. Using circular RNA hsa_circ_0000190 as a new biomarker in the diagnosis of gastric cancer. Clin Chim Acta. 2017;466:167–171. doi:10.1016/j.cca.2017.01.025
13. Shin VY, Chu K-M. MiRNA as potential biomarkers and therapeutic targets for gastric cancer. World J Gastroentero. 2014;20(30):10432–10439. doi:10.3748/wjg.v20.i30.10432
14. So JBY, Kapoor R, Zhu F, et al. Development and validation of a serum microRNA biomarker panel for detecting gastric cancer in a high-risk population. Gut. 2021;70(5):829–837. doi:10.1136/gutjnl-2020-322065
15. Huang Z, Zhu D, Wu L, et al. Six serum-based mirnas as potential diagnostic biomarkers for gastric cancer. Cancer Epidem Biomar. 2017;26(2):188–196. doi:10.1158/1055-9965.EPI-16-0607
16. Matsuoka T, Yashiro M. Biomarkers of gastric cancer: current topics and future perspective. World J Gastroenterol. 2018;24(26):2818–2832. doi:10.3748/wjg.v24.i26.2818
17. Shimada H, Noie T, Ohashi M, Oba K, Takahashi Y. Clinical significance of serum tumor markers for gastric cancer: a systematic review of literature by the task force of the Japanese gastric cancer association. Gastric Cancer. 2014;17(1):26–33. doi:10.1007/s10120-013-0259-5
18. Guo Y, Yin J, Wang Z, Zha L. Overexpression of platelet-derived growth factor-B increases the growth, invasion, and angiogenesis of gastric carcinoma cells through protein kinase B. Neoplasma. 2013;60(6):605–612. doi:10.4149/neo_2013_078
19. Guo Y, Yin J, Zha L, Wang Z. Clinicopathological significance of platelet-derived growth factor B, platelet-derived growth factor receptor-beta, and E-cadherin expression in gastric carcinoma. Wspolczesna Onkol. 2013;17(2):150–155. doi:10.5114/wo.2013.34618
20. Suzuki S, Dobashi Y, Hatakeyama Y, et al. Clinicopathological significance of platelet-derived growth factor (PDGF)-B and vascular endothelial growth factor-A expression, PDGF receptor-beta phosphorylation, and microvessel density in gastric cancer. Bmc Cancer. 2010;10:659. doi:10.1186/1471-2407-10-659
21. Zhao X, Yu Z, Zang K. Platelet-derived growth factors affect clinical features and prognosis of gastric cancer. J Oncol. 2022;2022. doi:10.1155/2022/2108368
22. Fidan E, Kavgaci H, Orem A, et al. Thrombin activatable fibrinolysis inhibitor and thrombin-antithrombin-III-complex levels in patients with gastric cancer. Tumor Biol. 2012;33(5):1519–1525. doi:10.1007/s13277-012-0403-6
23. Otsuki T, Fujimoto D, Hirono Y, Goi T, Yamaguchi A. Thrombin conducts epithelial-mesenchymal transition via protease-activated receptor-1 in human gastric cancer. Int J Oncol. 2014;45(6):2287–2294. doi:10.3892/ijo.2014.2651
24. Fan M, Andrade GFS, Brolo AG. A review on recent advances in the applications of surface-enhanced Raman scattering in analytical chemistry. Anal Chim Acta. 2020;1097:1–29. doi:10.1016/j.aca.2019.11.049
25. Schluecker S. Surface-enhanced Raman spectroscopy: concepts and chemical applications. Angew Chem Int Edit. 2014;53(19):4756–4795. doi:10.1002/anie.201205748
26. Zong C, Xu M, Xu L-J, et al. Surface-enhanced Raman spectroscopy for bioanalysis: reliability and challenges. Chem Rev. 2018;118(10):4946–4980. doi:10.1021/acs.chemrev.7b00668
27. Chen C, Wang J. Optical biosensors: an exhaustive and comprehensive review. Analyst. 2020;145(5):1605–1628. doi:10.1039/C9AN01998G
28. Du Y, Dong S. Nucleic acid biosensors: recent advances and perspectives. Anal Chem. 2017;89(1):189–215. doi:10.1021/acs.analchem.6b04190
29. Vigneshvar S, Sudhakumari CC, Senthilkumaran B, Prakash H. Recent advances in biosensor technology for potential applications - an overview. Front Bioeng Biotech. 2016;4:11. doi:10.3389/fbioe.2016.00011
30. Ding S-Y, You E-M, Tian Z-Q, Moskovits M. Electromagnetic theories of surface-enhanced Raman spectroscopy. Chem Soc Rev. 2017;46(13):4042–4076. doi:10.1039/C7CS00238F
31. Jiang L, Hassan MM, Ali S, Li H, Sheng R, Chen Q. Evolving trends in SERS-based techniques for food quality and safety: a review. Trends Food Sci Tech. 2021;112:225–240. doi:10.1016/j.tifs.2021.04.006
32. Zheng J, He L. Surface-enhanced Raman spectroscopy for the chemical analysis of food. Compr Rev Food Sci Food Saf. 2014;13(3):317–328. doi:10.1111/1541-4337.12062
33. Cohen JD, Javed AA, Thoburn C, et al. Combined circulating tumor DNA and protein biomarker-based liquid biopsy for the earlier detection of pancreatic cancers. Proc Natl Acad Sci U S A. 2017;114(38):10202–10207. doi:10.1073/pnas.1704961114
34. Wang C, Liu S, Ju H. Electrochemiluminescence nanoemitters for immunoassay of protein biomarkers. Bioelectrochemistry. 2023;149:108281. doi:10.1016/j.bioelechem.2022.108281
35. Yu X, He L, Pentok M, et al. An aptamer-based new method for competitive fluorescence detection of exosomes. Nanoscale. 2019;11(33):15589–15595. doi:10.1039/C9NR04050A
36. Yu D, Zha Z, Tang S, Qiu Y, Liu D. Modification-free fluorescent biosensor for CEA based on polydopamine-coated upconversion nanoparticles. J Fluoresc. 2022;32(4):1289–1297. doi:10.1007/s10895-022-02973-8
37. Hwang BY, Kim E, Kim S-H, Hwang H. Evaluation of analytical performances of magnetic force-assisted electrochemical sandwich immunoassay for the quantification of carcinoembryonic antigen. Front Bioeng Biotech. 2022;9:798079. doi:10.3389/fbioe.2021.798079
38. Chen Y, Yang Y, Xie Q, Lai Q, Ji X, He Z. Homogeneous immunoassay for alpha-fetoprotein based on the quenching of the fluorescence of quantum dots by antibody labelled with complexed copper ion tags. Microchim Acta. 2020;187(4):252. doi:10.1007/s00604-020-04229-3
39. Li Q, Jin J, Lou F, Tang D. Metal sulfide quantum dots-aggregated PAMAM dendrimer for cadmium ion-selective electrode-based immunoassay of alpha-fetoprotein. Sci China Chem. 2018;61(6):750–756. doi:10.1007/s11426-017-9211-7
40. Vakh C, Likanov G, Bulatov A. Stir flat sheet membrane liquid phase microextraction for the selective chemiluminescence determination of ofloxacin and fleroxacin in human urine. Microchem J. 2021;163:105913. doi:10.1016/j.microc.2020.105913
41. Zhang C, Wang S, Fang G, Zhang Y, Jiang L. Competitive immunoassay by capillary electrophoresis with laser-induced fluorescence for the trace detection of chloramphenicol in animal-derived foods. Electrophoresis. 2008;29(16):3422–3428. doi:10.1002/elps.200800188
 © 2023 The Author(s). This work is published and licensed by Dove Medical Press Limited. The
full terms of this license are available at https://www.dovepress.com/terms
and incorporate the Creative Commons Attribution
- Non Commercial (unported, 3.0) License.
By accessing the work you hereby accept the Terms. Non-commercial uses of the work are permitted
without any further permission from Dove Medical Press Limited, provided the work is properly
attributed. For permission for commercial use of this work, please see paragraphs 4.2 and 5 of our Terms.
© 2023 The Author(s). This work is published and licensed by Dove Medical Press Limited. The
full terms of this license are available at https://www.dovepress.com/terms
and incorporate the Creative Commons Attribution
- Non Commercial (unported, 3.0) License.
By accessing the work you hereby accept the Terms. Non-commercial uses of the work are permitted
without any further permission from Dove Medical Press Limited, provided the work is properly
attributed. For permission for commercial use of this work, please see paragraphs 4.2 and 5 of our Terms.