")
Back to Journals » Infection and Drug Resistance » Volume 15
Application of the ARIMA Model in Forecasting the Incidence of Tuberculosis in Anhui During COVID-19 Pandemic from 2021 to 2022
Authors Chen S, Wang X, Zhao J, Zhang Y, Kan X
Received 22 March 2022
Accepted for publication 23 June 2022
Published 4 July 2022 Volume 2022:15 Pages 3503—3512
DOI https://doi.org/10.2147/IDR.S367528
Checked for plagiarism Yes
Review by Single anonymous peer review
Peer reviewer comments 3
Editor who approved publication: Professor Suresh Antony
Shuangshuang Chen,1,* Xinqiang Wang,2,* Jiawen Zhao,2 Yongzhong Zhang,3 Xiaohong Kan1,2
1Department of Scientific Research and Education, Anhui Chest Hospital (Anhui Provincial Tuberculosis Institute), Hefei, People’s Republic of China; 2Department of Epidemiology and Biostatistics, School of Public Health, Anhui Medical University, Hefei, People’s Republic of China; 3Department of Tuberculosis Prevent and Control, Anhui Provincial Tuberculosis Institute, Hefei, People’s Republic of China
*These authors contributed equally to this work
Correspondence: Xiaohong Kan, Department of Scientific Research and Education, Anhui Chest Hospital (Anhui Provincial Tuberculosis Institute), Hefei, 230022, People’s Republic of China, Tel +86 0551-63615340, Email [email protected]
Objective: Forecasting the seasonality and trend of pulmonary tuberculosis is important for the rational allocation of health resources. In this study, we predict the incidence of pulmonary tuberculosis by establishing the autoregressive integrated moving average (ARIMA) model and providing support for pulmonary tuberculosis prevention and control during COVID-19 pandemic.
Methods: Registered tuberculosis(TB) cases from January 2013 to December 2020 in Anhui province were analysed using traditional descriptive epidemiological methods. Then we used the monthly incidence rate of TB from January 2013 through June 2020 to construct ARIMA model, and used the incidence rate from July 2020 to December 2020 to evaluate the forecasting accuracy. Ljung Box test, Akaike’s information criterion(AICc), Bayesian information criterion(BIC) and Realtive error were used to evaluate the model fitting and forecasting effect, Finally, the optimal model was used to forecast the expected monthly incidence of tuberculosis for 2021 and 2022 to learn about the incidence trend.
Results: A total of 255,656 TB cases were registered. The reported rate of tuberculosis was highest in 2013 and lowest in 2020. The peak incidence was in March, Tongling (71.97/100,000), Chizhou (59.93/100,000), and Huainan (58.36/100,000) had the highest number of cases. The ratio of male to female incidence was 2.59:1, with the largest proportion of people being between 66 and 75 years old. The main occupation of patients was farmer. ARIMA (0, 1, 1) (0, 1, 1)12 model was the optimal model to forecast the incidence trend of TB.
Conclusion: Tongling, Chizhou, and Huainan should strengthen measures for TB. In particular, the government should pay more attention on elderly people to prevent tuberculosis infections. The rate of TB patient registration and reporting has decreased under the pandemic of COVID-19. The ARIMA model can be a useful tool for predicting future TB cases.
Keywords: tuberculosis, incidence, epidemiological characteristics, COVID-19, time-series study, ARIMA model
Introduction
Tuberculosis (TB) is a chronic infectious disease caused by the bacillus Mycobacterium tuberculosis, which most commonly affect the lungs. According to Global Tuberculosis Reports, there were 7.1 million new cases of TB in 20191 and the estimated number of tuberculosis cases in China was 842,000, in 2020, with an incidence rate of 59.00/100,000. Among the 30 countries with a high burden of tuberculosis, the estimated incidence of tuberculosis in China ranked second, next only to India. Tuberculosis has become one of the top ten leading causes of death affecting people’s health.2 Although the global TB incidence is declining by 1–2% per year, it remains a major public health problem in many developing countries.3,4
Due to the influence of population gathering culture, religion, climate and some festivals, the number of registered tuberculosis cases shows some months of high levels. It is of great significance to explore the incidence law and trend of tuberculosis and establish accurate prediction model for the prevention and control of tuberculosis.
Recently, the epidemic characteristics of tuberculosis have been studied in several regions of China, such as Wuhan,5 Chongqing,6 Xinjiang7 and Yunnan.8 Researches indicates that the peak incidence of TB in China occurs from March to September. However, few studies have been done in eastern China, such as Anhui province. Although Anhui province has one of the highest incidence of tuberculosis in China. Analysing the characteristics of time, region and population distribution can help to predict future outbreaks in order to prevent and control tuberculosis.
The Auto-regressive integrated moving average (ARIMA) model is one of the most common prediction models, which is a time series analysis tool raised in the 1970s.9 It is a time series prediction model based on the fitting value of the past data sequence to extrapolate into future. It has 5 expressions: AR(P), MA(q), ARMA(p,q), ARIMA(p,d,q), ARIMA(p,d,q)×(P,D,Q)s. ARIMA model has been extensively used in the early warning of infectious diseases, such as malaria,10 influenza,11 or hand, foot and mouth disease.12
In this study, we make attempts to use the ARIMA model, combining with the infectious disease report system from January 1, 2013 to December 31, 2020, to analyse epidemic characteristics and to forecast the incidence trend in Anhui province. R 4.1.1 software was used to fit the ARIMA model for the number of cases. The best fitting model was selected to predict expected cases in the next two years.
Materials and Methods
Study Area and Data Collection
Anhui province is located in eastern China and consist of 16 municipalities. It covers an area of 140.1 thousand square kilometers. All newly diagnosed cases [according to the diagnostic criteria for pulmonary TB issued by the National Health Commission of the People’s Republic of China (WS288–2008)] are reported and collected from an online Tuberculosis Management Information System (TBIMS), which is operated by the Center for Disease Control and Prevention (CDC) of China. For this study, we collected a time series of TB incidence from January 2013 to December 2020.
Research Methods
We analyze the characteristics of time, region and population distribution using traditional descriptive epidemiological methods. Construct the seasonal ARIMA model, which can combine seasonal differences with non-seasonal differences, and is suitable for analyzing trends and complex seasonal rules.13
The general form of the ARIMA models is written as follows:14
ARIMA(p,d,q) × (P,D,Q)s, where p, d and q stand for the autoregressive order, the non-seasonal differencing degree and the moving average order, respectively, and P, D and Q stand for the seasonal autoregressive order, the seasonal differencing degree and the seasonal moving average order. The expression s represents the period of seasonality. In this study, we define the s as 12.15
Statistical Analysis
The construction of the ARIMA model used in this research consists of four steps. First, data preparation: Augmented Dickey Fuller (ADF) test was used to verify the stationarity of the series. If the time series is not stable, data differencing should be carried out until stationarity is satisfied. The difference times of the series are the values of d and D in the model. And in this study, we performed ADF tests on the originate data indicating that the originate series is not stationary (P>0.05). We made one nonseasonal difference (d=1) and one seasonal difference (D=1) to stabilize the incidence series. Second, p and q were determined. We fixed parameters (p,q) to set up reasonable models by referring to the autocorrelation function (ACF) and partial autocorrelation function (PACF) plots of the stationary series. When the ACF plot truncates and the PACF plot drags, the q value corresponds to the truncated value in the ACF plot. When the ACF plot is tailed and the PACF plot truncates, the p value corresponds to the truncated value in the PACF plot. When the ACF plot and PACF plot are trailing, p and q are 1. Third, to choose the best model, P and Q were substituted into the model from low to high order (P and Q are usually less than 2). We use the Ljung Box test to check the residuals of the optimal model. The residuals should be white noise. Besides, the model with the lowest corrected Akaike’s information criterion (AICc) and Bayesian information criterion (BIC) was taken for the optimal model.16–18 Finally, the optimized ARIMA model was used to fit the data from July to December 2020. The result was compared with the actual data from July to December 2020 to evaluate the prediction accuracy of the model. In this research, we applied the ARIMA (0,1,1) (0,1,1)12 to forecast monthly TB notification rate in Anhui province from July to December 2020. At last, the optimal model was used to forecast the expected cases of tuberculosis for 2021 and 2022 to learn about the incidence trend.
Excel 2016 was used for data collation, R 4.1.1 for modeling, analysis and prediction. Arc GIS 10.3.1 was used to link the tuberculosis incidence information and geographic information of various cities in Anhui province. Different colors were used to represent the prevalence of tuberculosis, to allow intuitive representation of tuberculosis prevalence in different cities. Test level α =0.05.
Ethics Approval and Consent to Participate
This study was approved by the Ethics Committee of Anhui Chest Hospital (K2020-011), and this research complies with the Declaration of Helsinki. Personal information of patients did not appear in this study; thus, informed consent was not needed.
Results
Epidemical Trend
From January 1, 2013 to December 31, 2020, a total of 255,656 cases of tuberculosis were registered in Anhui Province, with an average annual incidence of 54.15/100,000, ranging from 40.60/100,000 to 62.90/100,000. 34,580 cases were reported in 2013 whereas only 25,493 were reported in 2020. This equals to a decline of 26.3% over eight years. The number of cases shows an overall decline from year to year, as shown in Figure 1.
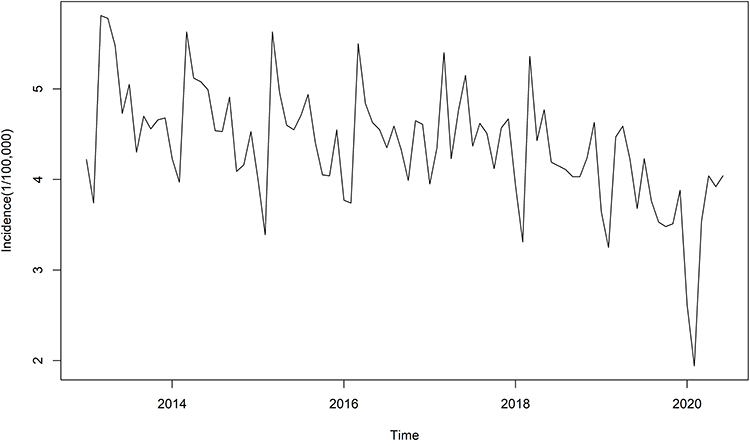 |
Figure 1 Time series of tuberculosis incidence in Anhui province from January 2013 to June 2020. |
Time Distribution
We plotted the number of reported TB cases in different months for each year from 2013 to 2020. It was found that March was the peak of TB incidence, while February was the trough (Figure 2).
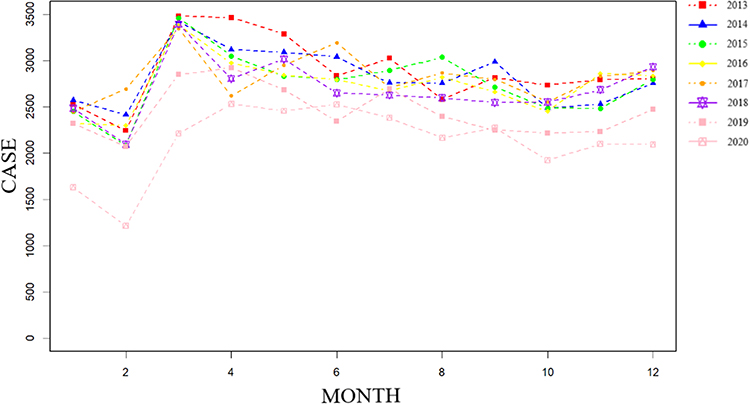 |
Figure 2 Monthly figure of tuberculosis incidence in Anhui province from 2013 to 2020. |
Region Distribution
Geographically, from 2013 to 2020, the top three reported annual incidence rates in Anhui province were Tongling (71.97/100,000), Chizhou (59.93/100,000) and Huainan (58.36/100,000). The lowest reported annual incidence rates were Fuyang (46.55/100,000), Suzhou (46.09/100,000) and Huangshan (21.31/100,000) (Figure 3).
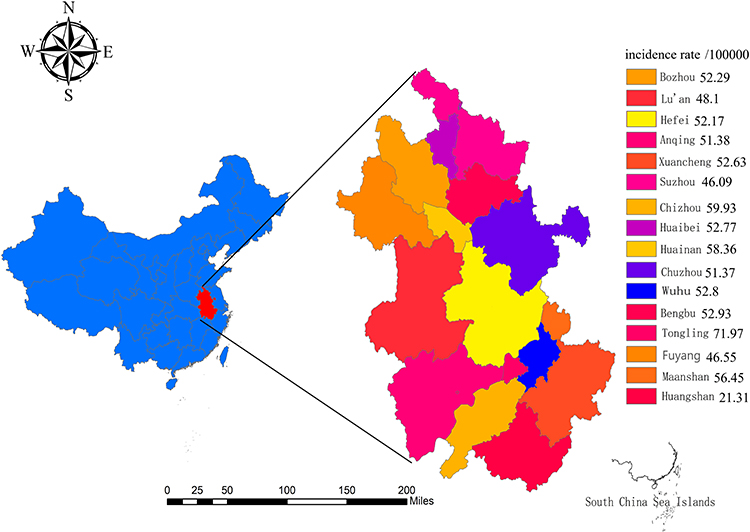 |
Figure 3 Geographic distribution of the average annual incidence of pulmonary tuberculosis in Anhui province, 2013–2020. |
Population Distribution
From 2013 to 2020, the Han population had the largest number of reported TB cases in Anhui Province, with a male to female ratio of 2.59:1, TB can affect anyone, regardless of sex. The highest burden is in men, who accounted for 72.17% of all TB cases in 2013–2020. By comparison, women accounted for 27.83%. It shows that TB disease affects men more often than women. The age group 66–75 accounted for the largest proportion, followed by 56–65 years old. The least proportion was found for under 15 years old.
ARIMA Model
The ADF test remained significant (P=0.01), demonstrating that the time series was stable (Figure 4). ACF and PACF function diagram after first order difference are shown in Figure 5. Through the ACF and PACF plots, the preliminary determination model is ARIMA (0,1,1) (P,1,Q)12. We selected ARIMA (0,1,1) (0,1,1)12 as the optimal model, because it showed minimum AICc and BIC values.
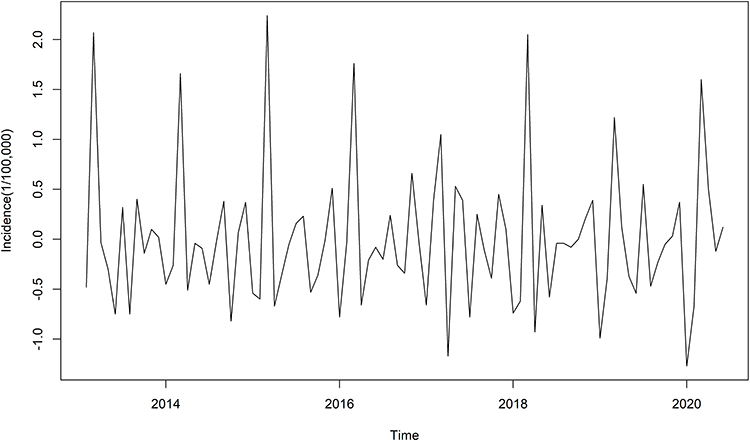 |
Figure 4 Time series of tuberculosis incidence in Anhui province from January 2013 to June 2020 after first order difference. |
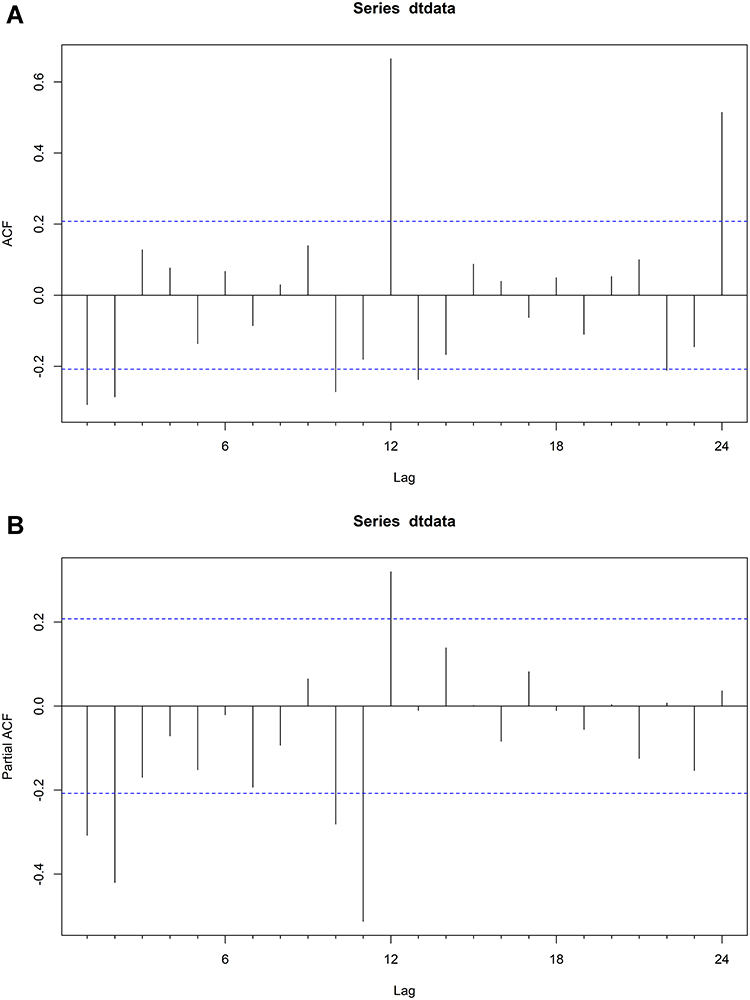 |
Figure 5 ACF(A) and PACF(B) function diagram after first order difference. |
Evaluate the Performance of the Model
The comparison with the actual data showed that the error between the actual data and the predictive value in all months (except for September) was less than 10%. The actual data of all months was included in the 95% confidence interval of the predictive value (Table 1), indicating the high prediction accuracy of the ARIMA model.
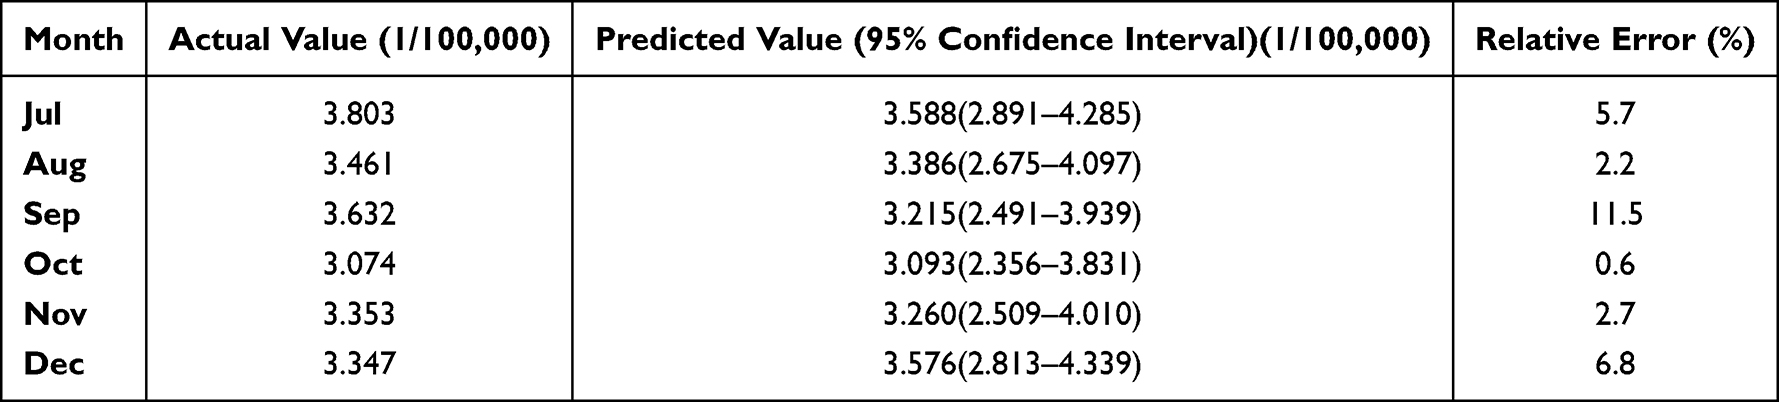 |
Table 1 Prediction of Tuberculosis Cases in Anhui from July to December in 2020 |
The Prediction of the Model
Using ARIMA to simulate and predict the monthly incidence of TB in 2021 and 2022, facilitating the understanding of trends in the incidence of TB (Table 2, Figure 6).
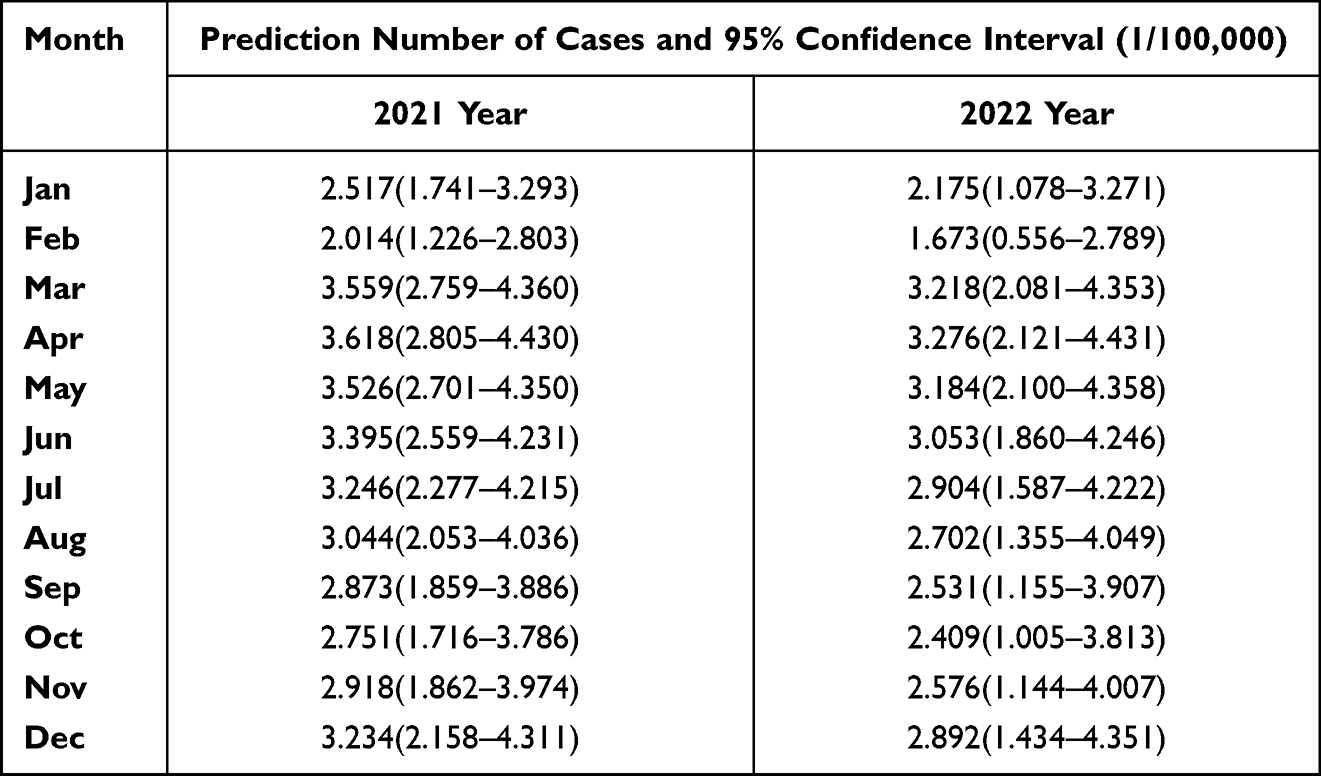 |
Table 2 Prediction Results of Monthly Incidence of Tuberculosis from January 2021 to December 2022 |
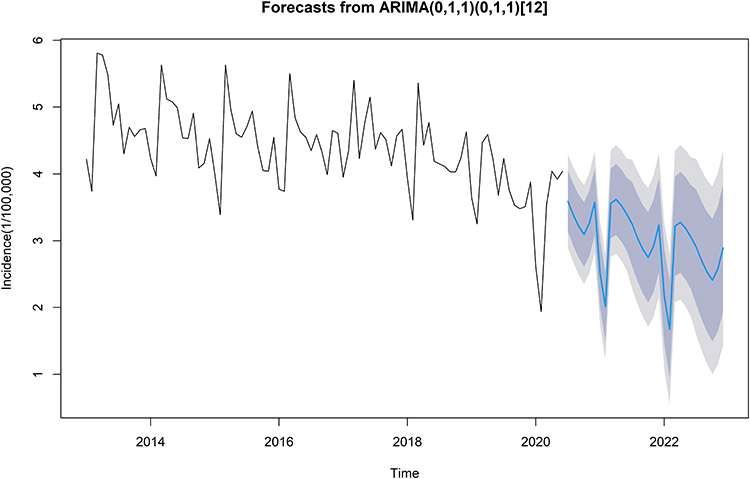 |
Figure 6 Prediction of tuberculosis incidence in 2021 and 2022 and 80% and 95% confidence intervals. |
Discussion
In 2015, the World Health Organization (WHO) approved the ambitious post-2015 global “End TB Strategy”19 with a goal of reducing TB incidence by 90% and TB deaths by 95% by 2035.20 Although the incidence of TB has decreased in recent years, China still has one of the highest TB infection rates in the world.21 Accurate prediction of TB incidence is crucial for policy makers to implement effective interventions and allocate health resources in a timely manner.22
In this study, we analyzed the distribution and epidemic trend of tuberculosis in Anhui Province from 2013 to 2020, describing the fitting, screening and verification process of ARIMA model, and using it to forecast the incidence tendency for the next two years.
The results of this study show that the prevalence of tuberculosis in Anhui province has the following characteristics: First, the overall incidence of tuberculosis in Anhui province is decreasing, which is consistent with the overall national level and reports of other provinces and cities.23,24 One possible reason for this development is that relevant departments of Anhui Provincial government attach great importance to the elimination of the tuberculosis following the termination strategy by the World Health Organization, and formulated a regionally specific and applicable prevention and control plan for the province. This allowed significant progress in tuberculosis prevention and control. Second, significant seasonal variation, the peak occurs in late winter and early spring, and the reported cases showed an obvious trough in February every year, which is similar to the time distribution of TB in other parts of China.25 Seasonal fluctuations may be related to the traditional Chinese spring festival. Due to the influence of customs and habits, it is taboo to go to the hospital to see a doctor during the Spring Festival. The phenomenon of delayed treatment is obvious, leading to a low point in February, whereas the number of registered infections will gradually increase in March, forming the so called “Spring Festival effect”.26,27 Finally, there is a large number of elderly patients with low income and weaker physical fitness and resistance to tuberculosis than young people, who are the main susceptible population to tuberculosis.28 In addition, this study also found that about 70% of the tuberculosis patients in Anhui province were farmers, and most of the agricultural workers were in this age stage. Poor living conditions, malnutrition, low levels of education, and considerable economic burden, may account for the high incidence of pulmonary TB among farmers.29,30 With the improvement of living and medical standards, China’s average life expectancy has increased, and the aging of the population is becoming increasingly serious, so more effective interventions including active case detection and easy access to high-quality health care for the elder should be implemented. Such efforts will help reduce the TB epidemic in the future.31
The ARIMA model is a combination of an autoregressive model and a moving average model, which can analyze both nonseasonal and seasonal time series.32 In this study, ACF and PACF plots were drawn for the differential monthly incidence data of tuberculosis in Anhui Province, and the possible value ranges of each parameter of ARIMA (p,d,q) (P,D,Q) S model were preliminarily determined, and the best fitting model was further determined by the exhaust method. Compared with other similar studies that only selected an optimal model from several alternative models by the size of AIC value,33 this study use program operation instead of manual selection to ensure the accurate and rapid screening of the best model under the evaluation criteria of AIC. By verifying the prediction effect of the model with monthly tuberculosis incidence data from July to December 2020, the results showed that ARIMA (0,1,1) (0,1,1) 12 model was accurate in predicting the monthly incidence of tuberculosis in Anhui, with an average error rate of only 1.91%. It is suggested that ARIMA seasonal product model is feasible to predict the monthly incidence of pulmonary tuberculosis in Anhui Province.
It should be highlighted that newly diagnosed cases declined significantly in 2020 compared to 2019, which may be related to the COVID-19 pandemic. This observation can be attributed to different reasons: First, the COVID-19 pandemic has disrupted many medical resources. Residents from remote areas have reduced the frequency or delayed of medical treatment, so some tuberculosis patients have not been timely and effectively diagnosed, affecting the reporting of new cases. To compensate for the large numbers of missed diagnosis as well as delayed diagnosis during the intensive period of COVID-19, an urgent restoration of normal TB services, increase the active screening of tuberculosis in the key population, and expand tracing and screening of household contacts for symptoms or manifestations associated with tuberculosis will be critical.34,35 Second, during the epidemic, all people wore masks, which effectively cut off the transmission way of tuberculosis and reduced the incidence of this disease. Third, healthcare staff from TB programs, TB laboratories, and TB wards have been re-assigned to fight against COVID-19, which reduced capacity of TB diagnosis, treatment, and management.36 Lastly, due to the impact of COVID-19, many places in China have adopted lockdown measures, and communities with serious outbreaks have adopted containment and control measures. In the containment areas, people in the communities are quarantined at home and forbidden to go out, and in the control areas, people can only enter and not leave, which has greatly reduced the transmission of TB.
The model ARIMA (0,1,1) (0,1,1) 12 gave 95% confidence intervals for the monthly incidence of TB in Anhui province in 2021 and 2022. If the actual incidence in the next two years is within the confidence interval, it indicates that the tuberculosis epidemic intensity is moderate and the tuberculosis epidemic is under control. If the monthly incidence exceeds the confidence interval, the government and relevant departments should pay more attention, find out the cause in time, and avoid large-scale outbreaks.
The data used in this study was obtained from the tuberculosis management information system, with high accuracy and credibility. However, the ARIMA model has several disadvantages: First, one of the characteristics of the modeling method is that it requires sequence stationary. Before applying the model, the sequence is preprocessed to ensure the stability of the mean and variance of the sequence. In this study, the first order seasonal and non-seasonal difference are used to stabilize the original sequence. In practical application, it is necessary to constantly improve the estimation method of the model and find a way to deal with the stationarity of the sequence, so as to improve the accuracy of the prediction model. Second, using notification date instead of date of diagnosis or onset of TB could influence the seasonality variation. Third, some of the factors that influence the spread of TB and improve the accuracy of prediction model, such as climate and socio-economic parameters, are not available. Finally, Anhui is also one of the regions with high incidence of drug-resistant TB patients. However, the study did not obtain data related to drug-resistant tuberculosis, so the incidence tendency and seasonality of drug-resistant TB in Anhui needs to be discussed further.
Conclusion
We analyzed the characteristics of time, region and population distribution, epidemic trend and incidence prediction of tuberculosis in Anhui province, we also found that the incidence of TB decreased during the COVID-19 pandemic due to various lockdown measures, wear masks, and re-assigned many medical resource. The ARIMA model can be a useful tool for predicting future TB cases. This findings provide reference for relevant disease control departments to formulate prevention and control measures, to reduce the burden of tuberculosis epidemic on society.
Data Sharing Statement
The data are not publicly available owing to privacy or ethical restrictions, as they contain sensitive information. The data are held by the Anhui Chest Hospital (Anhui Provincial Tuberculosis Institute). Requests to access the data can be sent to Xiao-Hong Kan ([email protected]), Chief of Scientific Research and Education at the Anhui Chest Hospital (Anhui Provincial Tuberculosis Institute).
Ethics Approval and Informed Consent
This study was approved by the Ethics Committee of Anhui Chest Hospital (K2020-011). Personal information of patients did not appear in this study; thus, informed consent was not needed.
Author Contributions
All authors made a significant contribution to the work reported, whether that is in the conception, study design, execution, acquisition of data, analysis and interpretation, or in all these areas; took part in drafting revising or critically reviewing the article; gave final approval of the version to be published; have agreed on the journal to which the article has been submitted; and agree to be accountable for all aspects of the work.
Funding
This study was supported by grants from National Key Project for infectious Disease of China (2018ZX10722301-001-004) and Project of Anhui Provincial Health Commission (AHWJ2021b001). The funders had no role in the study design, data collection and analysis, decision to publish, or preparation of the manuscript.
Disclosure
The authors declare that they have no competing interests.
References
1. World Health Organization. Global tuberculosis report 2020. Available from: https://www.who.int/multi-media/details/global-tuberculosis-report-2020—mobile.
2. World Health Organization. Global tuberculosis report 2021. Available from: https://www.who.int/publications/i/item/9789240037021.
3. Sgaragli G, Frosini M. Human tuberculosis I.Epidemiology, diagnosis and pathogenetic mechanisms. Curr Med Chem. 2016;23(25):2836–2873. doi:10.2174/0929867323666160607222854
4. Bele S, Jiang W, Lu H, et al. Population aging and migrant workers: bottlenecks in tuberculosis control in rural China. PLoS One. 2014;9(2):e88290. doi:10.1371/journal.pone.0088290
5. Yang X, Duan Q, Wang J, Zhang Z, Jiang G. Seasonal variation of newly notified pulmonary tuberculosis cases from 2004 to 2013 in Wuhan, China. PLoS One. 2014;9(10):e108369. doi:10.1371/journal.pone.0108369
6. Liao Z, Zhang X, Zhang Y, Peng D. Seasonality and trend forecasting of tuberculosis incidence in Chongqing, China. Interdiscip Sci. 2019;11(1):77–85. doi:10.1007/s12539-019-00318-x
7. Wubuli A, Li Y, Xue F, Yao X, Upur H, Wushouer Q. Seasonality of active tuberculosis notification from 2005 to 2014 in Xinjiang, China. PLoS One. 2017;12(7):e0180226. doi:10.1371/journal.pone.0180226
8. Huang L, Li XX, Abe EM, et al. Spatial-temporal analysis of pulmonary tuberculosis in the northeast of the Yunnan province, People’s Republic of China. Infect Dis Poverty. 2017;6(1):53. doi:10.1186/s40249-017-0268-4
9. Lin Y, Chen M, Chen G, Wu X, Lin T. Application of an auto-regressive integrated moving average model for predicting injury mortality in Xiamen, China. BMJ Open. 2015;5(12):e008491. doi:10.1136/bmjopen-2015-008491
10. Anwar MY, Lewnard JA, Parikh S, Pitzer VE. Time series analysis of malaria in Afghanistan: using ARIMA models to predict future trends in incidence. Malar J. 2016;15(1):566. doi:10.1186/s12936-016-1602-1
11. He Z, Tao H. Epidemiology and ARIMA model of positive-rate of influenza viruses among children in Wuhan, China: a nine-year retrospective study. Int J Infect Dis. 2018;74:61–70. doi:10.1016/j.ijid.2018.07.003
12. Liu L, Luan RS, Yin F, Zhu XP, Lü Q. Predicting the incidence of hand, foot and mouth disease in Sichuan province, China using the ARIMA model. Epidemiol Infect. 2016;144(1):144–151. doi:10.1017/S0950268815001144
13. Cao S, Wang F, Tam W, et al. A hybrid seasonal prediction model for tuberculosis incidence in China. BMC Med Inform Decis Mak. 2013;13:56. doi:10.1186/1472-6947-13-56
14. Zheng Y, Zhang L, Wang L, et al. Statistical methods for predicting tuberculosis incidence based on data from Guangxi, China. BMC Infect Dis. 2020;20(1):300. doi:10.1186/s12879-020-05033-3
15. Li ZQ, Pan HQ, Liu Q, et al. Comparing the performance of time series models with or without meteorological factors in predicting incident pulmonary tuberculosis in eastern China. Infect Dis Poverty. 2020;9(1):151. doi:10.1186/s40249-020-00771-7
16. Zhai M, Li W, Tie P, et al. Research on the predictive effect of a combined model of ARIMA and neural networks on human brucellosis in Shanxi Province, China: a time series predictive analysis. BMC Infect Dis. 2021;21(1):280. doi:10.1186/s12879-021-05973-4
17. Wang T, Liu J, Zhou Y, Cui F, Huang Z, Wang L. Prevalence of hemorrhagic fever with renal syndrome in Yiyuan County, China, 2005–2014. BMC Infect Dis. 2016;16(1):69. doi:10.1186/s12879-016-1404-7
18. Zhou L, Zhao P, Wu D, Cheng C, Huang H. Time series model for forecasting the number of new admission inpatients. BMC Med Inform Decis Mak. 2018;18(1):39. doi:10.1186/s12911-018-0616-8
19. Chen CH, Chen YM, Lee CW, Chang YJ, Cheng CY, Hung JK. Early diagnosis of spinal tuberculosis. J Formos Med Assoc. 2016;115(10):825–836. doi:10.1016/j.jfma.2016.07.001
20. Harries AD, Kumar AMV. Challenges and Progress with Diagnosing Pulmonary Tuberculosis in Low and Middle-Income Countries. Diagnostics. 2018;8(4):78. doi:10.3390/diagnostics8040078
21. World Health Organization. Global tuberculosis report 2020. Available from: https://www.who.int/teams/global-tuberculosis-programme/tb-reports/global-tuberculosis-report-2021.
22. Li ZQ, Pan HQ, Liu Q, Song H, Wang JM. Comparing the performance of time series models with or without meteorological factors in predicting incident pulmonary tuberculosis in eastern China. Infect Dis Poverty. 2020;9(1):151.
23. Liu Q, Li Z, Ji Y, et al. Forecasting the seasonality and trend of pulmonary tuberculosis in Jiangsu Province of China using advanced statistical time-series analyses. Infect Drug Resist. 2019;12:2311–2322. doi:10.2147/IDR.S207809
24. Wang Y, Xu C, Li Y, et al. An advanced data-driven hybrid model of SARIMA-NNNAR for tuberculosis incidence time series forecasting in Qinghai Province, China. Infect Drug Resist. 2020;13:867–880. doi:10.2147/IDR.S232854
25. Wang H, Tian CW, Wang WM, Luo XM. Time-series analysis of tuberculosis from 2005 to 2017 in China. Epidemiol Infect. 2018;146(8):935–939. doi:10.1017/S0950268818001115
26. Yan CQ, Wang RB, Liu HC, et al. Application of ARIMA model in predicting the incidence of tuberculosis in China from 2018 to 2019. Chin J Epidemiol. 2019;40(6):633-637.
27. Wei S, Lu YH, Gao MY, et al. “Spring Festival effects” on the main notifiable communicable diseases in China. Fudan Univ J Med Sci. 2013;40(2):153-158.
28. Wu B, Yu Y, Xie W, et al. Epidemiology of tuberculosis in Chongqing, China: a secular trend from 1992 to 2015. Sci Rep. 2017;7(1):7832–7837. doi:10.1038/s41598-017-07959-2
29. Luba TR, Tang S, Liu Q, Gebremedhin SA, Kisasi MD, Feng Z. Knowledge, attitude and associated factors towards tuberculosis in Lesotho: a population based study. BMC Infect Dis. 2019;19(1):96. doi:10.1186/s12879-019-3688-x
30. Qi Z, Yang W, Wang YF. Epidemiological analysis of pulmonary tuberculosis in Heilongjiang province China from 2008 to 2015. Int J Mycobacteriol. 2017;6(3):264–267. doi:10.4103/ijmy.ijmy_104_17
31. Huynh GH, Klein DJ, Chin DP, et al. Tuberculosis control strategies to reach the 2035 global targets in China: the role of changing demographics and reactivation disease. BMC Med. 2015;13:88. doi:10.1186/s12916-015-0341-4
32. Li ZQ, Wang ZZ, Song H, et al. Application of a hybrid model in predicting the incidence of tuberculosis in a Chinese population. Infect Drug Resist. 2019;12:1011–1020. doi:10.2147/IDR.S190418
33. Li Y, Zhu L, Lu W, Chen C, Yang H. Seasonal variation in notified tuberculosis cases from 2014 to 2018 in eastern China. J Int Med Res. 2020;48(8):1–11.
34. Wang X, He W, Lei J, Liu G, Huang F, Zhao Y. Impact of COVID-19 Pandemic on Pre-Treatment Delays, Detection, and Clinical Characteristics of Tuberculosis Patients in Ningxia Hui Autonomous Region, China. Front Public Health. 2021;9:644536. doi:10.3389/fpubh.2021.644536
35. Pan A, Liu L, Wang C, et al. Association of public health interventions with the epidemiology of the COVID-19 outbreak in Wuhan, China. JAMA. 2020;323(19):1915-1923. doi:10.1001/jama.2020.6130
36. Adepoju P. Tuberculosis and HIV responses threatened by COVID-19. Lancet. 2020;7(5):e319–e320. doi:10.1016/S2352-3018(20)30109-0
 © 2022 The Author(s). This work is published and licensed by Dove Medical Press Limited. The full terms of this license are available at https://www.dovepress.com/terms.php and incorporate the Creative Commons Attribution - Non Commercial (unported, v3.0) License.
By accessing the work you hereby accept the Terms. Non-commercial uses of the work are permitted without any further permission from Dove Medical Press Limited, provided the work is properly attributed. For permission for commercial use of this work, please see paragraphs 4.2 and 5 of our Terms.
© 2022 The Author(s). This work is published and licensed by Dove Medical Press Limited. The full terms of this license are available at https://www.dovepress.com/terms.php and incorporate the Creative Commons Attribution - Non Commercial (unported, v3.0) License.
By accessing the work you hereby accept the Terms. Non-commercial uses of the work are permitted without any further permission from Dove Medical Press Limited, provided the work is properly attributed. For permission for commercial use of this work, please see paragraphs 4.2 and 5 of our Terms.