
Back to Journals » Breast Cancer: Targets and Therapy » Volume 18
Application of Shear Wave Elastography Combined with Tumor Markers in the Differential Diagnosis of Benign and Malignant Breast Masses
Authors Liu J, Zhang Y, Zhou Q
Received 3 April 2026
Accepted for publication 3 July 2026
Published 13 July 2026 Volume 2026:18 614367
DOI https://doi.org/10.2147/BCTT.S614367
Checked for plagiarism Yes
Review by Single anonymous peer review
Peer reviewer comments 2
Editor who approved publication: Professor Harikrishna Nakshatri
Jing Liu,1,* Yuke Zhang,2,* Qiang Zhou3
1Ultrasound Medicine, The First Affiliated Hospital of Guizhou University of Traditional Chinese Medicine, Guiyang, Guizhou, 550001, People’s Republic of China; 2Department of Ultrasound Diagnosis, 958 Hospital of Army PLA, Chongqing, 400020, People’s Republic of China; 3Department of Ultrasound Diagnosis, Changzhou Traditional Chinese Medicine Hospital, Changzhou, Jiangsu, 213000, People’s Republic of China
*These authors contributed equally to this work
Correspondence: Qiang Zhou, Department of Ultrasound Diagnosis, Changzhou Traditional Chinese Medicine Hospital, Changzhou, Jiangsu, 213000, People’s Republic of China, Tel +86– 051989896754, Email [email protected]
Purpose: To explore the value of combined quantitative shear wave elastography (SWE) parameters and breast cancer molecular markers for the differential diagnosis of benign and malignant breast masses.
Methods: This study retrospectively analyzed the clinical data of 225 patients who underwent conventional ultrasound, SWE examinations, immunohistochemical analysis, and measurement of serum tumor markers CA15-3 and CA125. Based on the pathological diagnoses, the patients were categorized into malignant (n=107) and benign (n=118) mass groups.
Results: The malignant mass group exhibited significantly higher values of quantitative SWE parameters, including maximum elasticity (E max), Shell1 E max, Shell2 E max, and Shell3 E max, than the benign mass group (P< 0.05). Hemodynamic indicators, including the maximum blood flow velocity, resistance index, and pulsatility index, were also markedly elevated in the malignant mass group (P< 0.05). Regarding the SWE imaging classification, the malignant mass group primarily corresponded to Types IV and V, whereas the benign mass group was mainly classified as Types I and II (P< 0.001). Serum tumor markers CA15-3 and CA125 were significantly elevated in the malignant mass group. The combined detection of quantitative SWE parameters, CA15-3, and CA125 demonstrated higher AUC values than single detection, suggesting that the integration of SWE parameters with CA15-3 and CA125 significantly enhances diagnostic efficacy in differentiating benign from malignant breast masses (P< 0.01).
Conclusion: The combined detection of quantitative SWE parameters and breast cancer molecular markers significantly enhances the accuracy of differentiating benign from malignant breast masses.
Keywords: breast neoplasms, elasticity imaging techniques, tumor markers, differential diagnosis, diagnostic imaging
Introduction
Breast cancer is one of the most prevalent malignant tumors in women, and accurate early diagnosis is crucial for improving prognosis.1,2 Common imaging methods, such as ultrasound, mammography, and magnetic resonance imaging, are of great value for breast cancer screening. However, in lesions with complex morphologies or indistinct margins, a single imaging method is easily affected by subjective factors and may lead to misdiagnosis or missed diagnosis.3–5 Shear wave elastography (SWE) is an emerging quantitative ultrasound technology that non-invasively assesses the stiffness of masses by measuring the elastic moduli of tissues. Studies have shown that malignant masses typically exhibit higher elastic moduli, whereas benign masses exhibit lower elastic moduli.6,7 SWE parameters, such as the mean elasticity value (E mean), maximum elasticity value (E max), and standard deviation of elasticity (SD), have demonstrated good discriminatory potential, but single imaging information remains insufficient to fully reflect the molecular characteristics of tumors.
Tumor marker detection is an important auxiliary method for the diagnosis and treatment of breast cancer. Commonly used markers include carcinoembryonic antigen, carbohydrate antigen 15–3 (CA15-3), and HER2,8 According to the ASCO/CAP guidelines, estrogen receptor (ER), progesterone receptor (PR), and human epidermal growth factor receptor 2 (HER2) are important markers in the pathological evaluation, molecular subtyping, and treatment decision-making for breast cancer.9,10 In particular, HER2 overexpression is closely associated with high invasiveness and poor prognosis.11 Although carbohydrate antigen 125 (CA125) is not a breast cancer-specific marker and cannot be used alone for breast cancer diagnosis in clinical practice, previous research has suggested that CA125 levels may be elevated in some breast cancer patients and may be associated with tumor burden, disease progression, and prognosis.12 In recent years, the combined diagnostic strategy of imaging features and tumor markers has become a focus of research, aiming to integrate histological characteristics and molecular biology information to improve diagnostic sensitivity and specificity. This retrospective study evaluated the clinical value of quantitative SWE parameters combined with tumor marker detection for differentiating benign and malignant breast masses, providing reliable evidence for early diagnosis and individualized treatment.
Materials and Methods
General Data
This single-center retrospective study collected clinical and imaging data from patients with breast masses who underwent SWE at our hospital between September 2018 and October 2021. The age range of the patients was 37 to 66 years, with an average age of (47.9 ± 8.9) years. The duration of illness varied from 1 to 5 years, with an average duration of (3.7 ± 0.9) years. The body mass index (BMI) ranged from 20.87 to 24.65 kg/m2, with an average of (22.71 ± 1.62) kg/m2. The mass diameter ranged from 5 to 39 mm, with an average of (19.82 ± 4.31) mm. The mass locations were as follows: 53 on the left and 55 on the right. Based on the pathological diagnoses, the patients were categorized into the malignant (n=107) and benign (n=118) mass groups. The inclusion criteria were as follows: (1) female sex with unilateral breast masses with a tumor diameter of less than 50 mm; (2) availability of results from core needle biopsy or surgical pathology examination; (3) no prior history of mastitis, breast augmentation, radiotherapy, chemotherapy, or breast surgery; (4) no history of other malignant tumors; and (5) clear visualization of the mass on ultrasound, allowing for sufficient acquisition of SWE data. Exclusion criteria: (1) recurrent breast cancer; (2) an interval exceeding one month between breast ultrasound and pathological examination; (3) severe hepatic, renal, cardiovascular, or cerebrovascular diseases; (4) pregnancy or lactation; (5) scars or other lesions adjacent to the site that affected diagnosis; (6) contraindications for biopsy or surgery, such as bleeding disorders or severe coagulopathy; (7) allergy to contrast-enhanced ultrasound or ultrasound procedures; (8) tumor diameter exceeding 50 mm or multiple lesions.
All patients included in the study were consecutively enrolled in chronological order to minimize the impact of selection bias. All imaging examinations (including conventional ultrasound and SWE) and serum tumor marker tests were performed prior to pathological diagnosis. The time interval between imaging examinations and biopsy or surgical pathology did not exceed 1 month to minimize potential time-related bias. All SWE data were obtained from the hospital’s PACS and electronic medical records. No additional interventions were performed on the patients in this study. After assessing the data completeness, no missing values were identified for the key variables. Therefore, data imputation was not performed. All the cases were included in the final statistical analysis. A detailed flow diagram is presented in Figure 1.
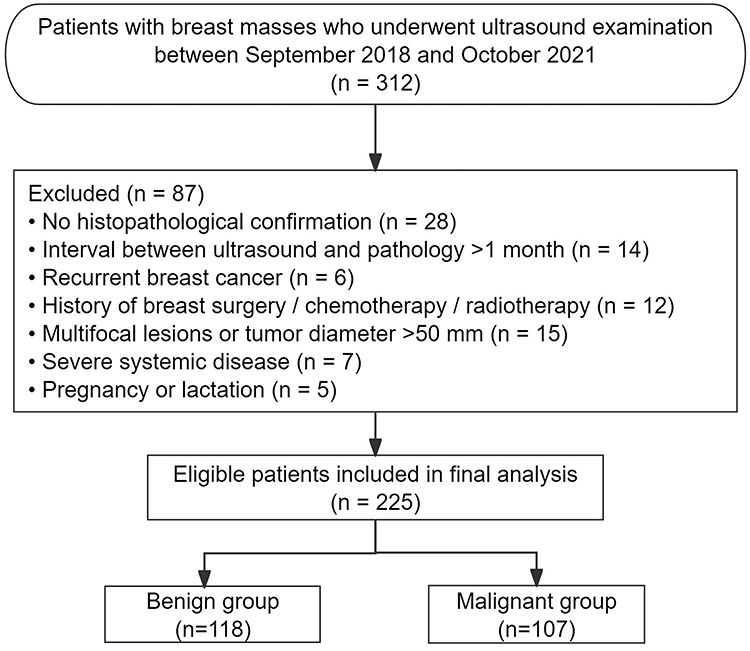 |
Figure 1 Flowchart of patient selection. |
This study was approved by the Ethics Committee of Changzhou Traditional Chinese Medicine Hospital (Approval No. K2024-013), and the requirement for informed consent was waived owing to the retrospective nature of the study. All patient information was anonymized prior to analysis, and confidentiality was strictly maintained. The study was conducted in accordance with the Declaration of Helsinki and the STROBE Statement.
Determination of Sample Size
The sample size was determined based on previous similar studies and the available number of cases. Additionally, to assess whether the sample size had sufficient power, the sample size was estimated using PASS 15.0 software (NCSS, LLC, Kaysville, Utah). Taking the main variable E max as an example for differentiating benign and malignant breast masses, based on the preliminary experimental data, the mean E max of the malignant mass group was 130.4 kPa, and the standard deviation was 19.5; the mean E max of the benign mass group was 110.2 kPa, and the standard deviation was 18.7. The significance level was set at α=0.05 with a two-sided test, and the power was set at 0.90. The calculated minimum sample size was 91 cases in each group for a total of 182 cases. A total of 107 malignant and 118 benign masses were ultimately included in this study, meeting the statistical requirements.
Detection Methods
SWE and Ultrasonic Blood Flow Detection
In this study, the tumor core area and surrounding annular areas of different thicknesses (Shell1 and Shell2) were selected as regions of interest (ROI) to comprehensively evaluate differences in the elastic distribution of lesions. This regional partitioning strategy was based on a study by Wang et al,13 who demonstrated that the elasticity characteristics of different ROI have significant differences in benign and malignant breast tumors, highlighting their high diagnostic value. Among the SWE parameters, the core parameters with higher diagnostic efficacy (such as E max and E mean) were retained based on the receiver operating characteristic (ROC) analysis results, and the Shell1 region was used as the representative ROI to reduce redundant analysis and highlight the main diagnostic indicators.
The EPIQ 5 color Doppler ultrasound diagnostic system (Philips, Netherlands) was used, coupled with the eL18-4 high-frequency linear array probe, operating within a frequency range of 3–22 MHz, to conduct routine ultrasound examinations in breast mode. First, sonographic imaging of the mass was performed, followed by switching to the SWE mode, setting the default range to 0–180 kPa, and selecting a 2 mm × 2 mm ROI. The probe was positioned >3 mm from the mass margin. During the procedure, it was essential to move slowly and gently with the patient holding their breath to ensure image stability. Only the stable image frames were stored. The quantitative SWE parameters were measured using Q-Box software, including the maximum elasticity modulus (E max) and E max of the Shell1, Shell2, and Shell3 regions. The definitions of the specific parameters are listed in Table 1. The tissue elasticity values of the 1-, 2-, and 3-mm regions of the mass were measured using shell function and tracing methods. Simultaneously, an ultrasound blood flow signal examination was performed to record key hemodynamic parameters such as maximum blood flow velocity, resistance index, and pulsatility index of the mass, aiding in the evaluation of its benign or malignant characteristics. According to the previous qualitative classification criteria for breast SWE, the SWE findings were divided into Types I–V based on the color hardness distribution pattern of the lesion and surrounding tissues on the elastogram. Type I showed uniform low stiffness; Type II showed relatively uniform low stiffness; Type III showed irregular heterogeneous stiffness; Type IV showed focal high stiffness within the lesion; and Type V showed stiff rim sign, with high stiffness surrounding the lesion. Generally, Types I–II were more commonly seen in benign lesions, while Types IV–V were more indicative of malignant lesions.14 Shell1, Shell2, and Shell3 represented the elastic measurement areas within 1 mm, 2 mm, and 3 mm of the lesion, respectively. Since the three Shell regions were progressively expanded areas, there was some overlap between their measurement ranges. In this study, they were treated as parameters reflecting changes in tissue stiffness at different distances from the lesion, rather than as completely independent anatomical regions.
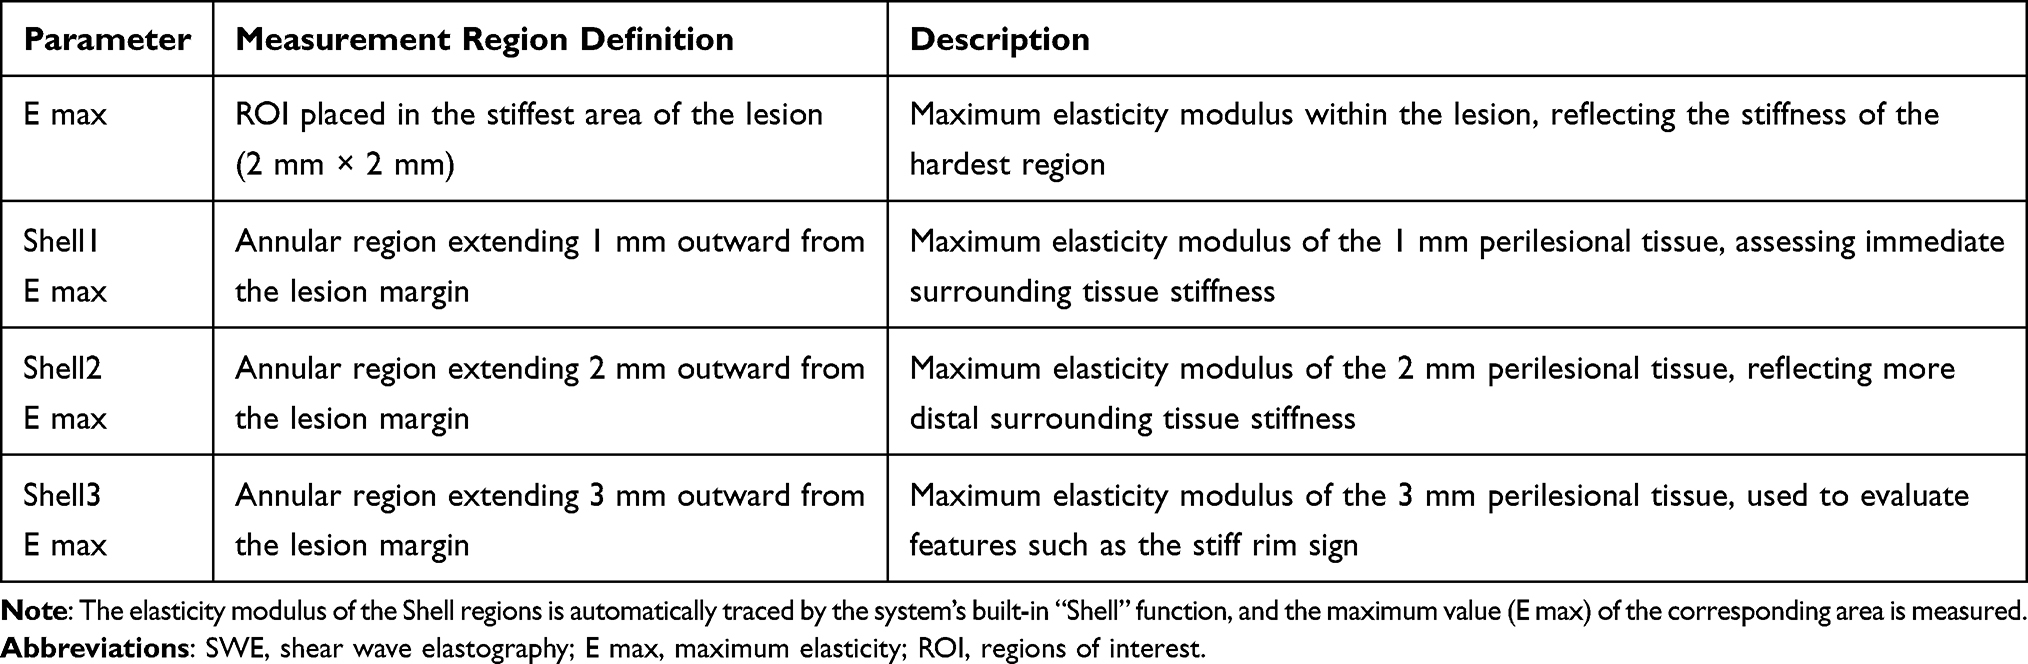 |
Table 1 Definitions and Measurement Areas of SWE Parameters |
Immunohistochemical Examination
For malignant breast mass specimens, 3-μm thick sections were prepared using formaldehyde fixation and paraffin embedding, followed by HE staining. The expression of cellular proliferation antigen markers in breast tissues, including PR, ER, HER2, and androgen receptor (AR) was assessed using immunohistochemistry. Cases were considered positive if the cell nuclei stained brown and the proportion of positive cells exceeded 10%. The specific groupings were as follows: 37 cases in the PR-positive group, 40 cases in the ER-positive group, 35 cases in the HER2-positive group, and 53 cases in the AR-positive group.
Detection of Serum CA15-3 and CA125 Levels
Serum CA15-3 and CA125 levels were measured in all patients. After blood sample collection, venous blood was centrifuged under standard conditions to obtain serum samples. The serum specimens were stored at −20°C to prevent repeated freeze-thaw cycles. A chemiluminescent immunoassay (CLIA) was used to measure the levels of CA15-3 and CA125 tumor markers in the serum, with all procedures strictly adhering to the manufacturer’s instructions to ensure the accuracy and reliability of the results. Serum tumor marker positivity was determined as follows: CA15-3 levels >25 U/mL and CA125 levels >35 U/mL according to the manufacturer’s instructions and established clinical diagnostic thresholds. All serum samples were collected once before testing and immediately aliquoted and frozen to avoid the impact of repeated freeze-thaw cycles on the accuracy of the results.
Statistical Methods
Data were analyzed using SPSS 23.0. Measurement data were expressed as mean ± standard deviation (x ± s), with intergroup comparisons conducted using t-tests. Count data are presented as percentages (%), and intergroup comparisons were performed using the chi-square test. Kendall’s tau-b test was conducted for correlation analysis, and a combined diagnostic model was constructed using binary logistic regression analysis. Using the pathological diagnosis results as the dependent variable, the SWE quantitative parameters (E max, Shell1 E max, Shell2 E max, and Shell3 E max), CA15-3, and CA125 were included in the model as independent variables. The predicted probability from the model was used as a combined diagnostic indicator for ROC curve analysis. Among them, United1 represents the combined model constructed by SWE quantitative parameters, and United2 represents the combined model constructed by SWE quantitative parameters combined with CA15-3 and CA125. ROC curve analysis was used to evaluate the diagnostic performance of individual indicators and the combined model, and the area under the curve (AUC) and its 95% confidence interval (95% CI) was calculated. The combined model used in this study was a logistic regression model constructed using statistical methods; it was not a result automatically generated by a machine learning product or commercial software. Statistical significance was set at P<0.05.
Results
Baseline Data
The two groups differed in terms of demographic and clinical characteristics. Compared with patients in the benign mass group, those in the malignant mass group were older (49.3 ± 8.5 vs. 46.6 ± 9.1 years), had significantly higher BMI (23.12 ± 1.55 vs. 22.35 ± 1.62 kg/m2), larger tumor diameter (21.30 ± 4.01 vs. 18.47 ± 4.11 mm), and longer disease duration (3.9 ± 0.7 vs. 3.5 ± 0.9 years). The proportion of left-sided lesions [59 (55.14%) vs. 50 (42.37%)] was higher in the malignant mass group, with statistically significant differences (P<0.05).
Pathological Examination results
Among the 107 malignant breast lesions, invasive ductal carcinoma (IDC) was the predominant pathological subtype, accounting for 94.39% (101 cases) of the malignant group. The remaining subtypes included intraductal carcinoma (3 cases, 2.80%), ductal carcinoma in situ (DCIS) (2 cases, 1.87%), and lymphoma (1 case, 0.93%).
Among the 225 breast masses, 107 (47.6%) were malignant, and 118 (52.4%) were benign. IDC was the most common malignant subtype, accounting for 44.9% of all cases, followed by intraductal carcinoma (3 cases, 1.3%), DCIS (2 cases, 0.9%), and lymphoma (1 case, 0.4%). Among benign lesions, adenosis (22.2%) and fibroadenoma (20.4%) were the most frequent, followed by breast inflammation (4.0%), intraductal papilloma (3.1%), and other benign conditions (2.7%). Overall, the number of benign lesions slightly exceeded that of malignant lesions.
Ultrasound Detection of Blood Flow Signal Indicators
Patients in the malignant mass group exhibited significantly higher maximum blood flow velocity, resistance index, and pulsatility index compared with those in the benign mass group, with statistically significant differences (P<0.05) (Figure 2).
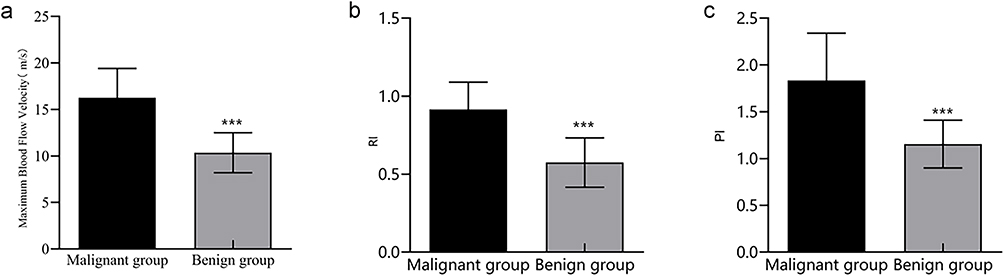 |
Figure 2 Comparison of ultrasound detection of blood flow signal indicators. (a) Maximum blood flow velocity. (b) Resistance index. (c) Pulsatility index. Abbreviations: RI, resistance index; PI, pulsatility index. Note: Compared with the malignant mass group, ***P<0.001. |
Quantitative SWE Parameters
The malignant mass group exhibited significantly higher values in quantitative SWE parameters, including E max, Shell1 E max, Shell2 E max, and Shell3 E max, compared with the benign mass group, with statistically significant differences (P<0.05) (Figure 3).
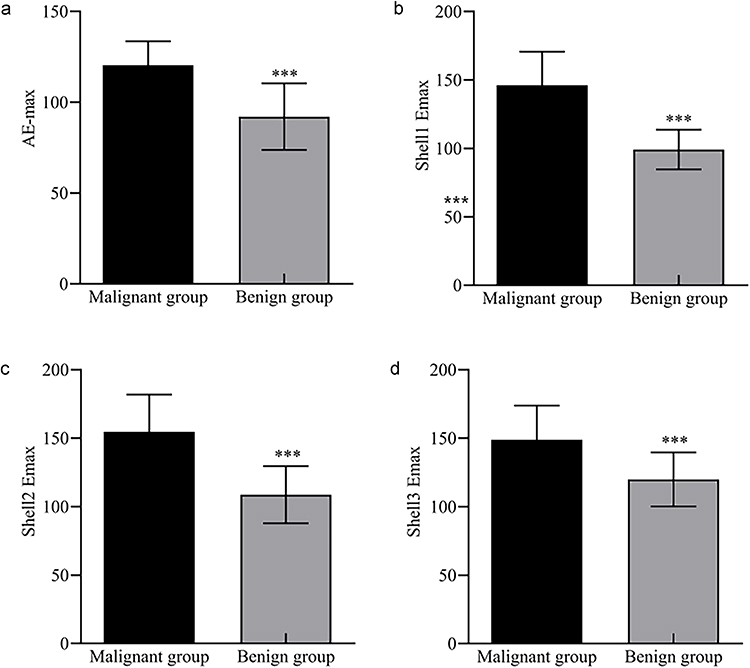 |
Figure 3 Differences in the quantitative SWE parameters between the malignant and benign breast masses. (a) E max. (b) Shell1 E max. (c) Shell2 E max. (d) Shell3 E max. Abbreviations: SWE, shear wave elastography; E max,maximum elasticity. Note: Compared with the malignant mass group, ***P<0.001. |
Comparison of SWE Image Classifications of Benign and Malignant Breast Tumors
In the benign mass group, there were 49 cases with Type I (41.43%), 46 with Type II (38.98%), 16 with Type III (13.56%), 5 with Type IV (4.24%), and 2 with Type V (1.69%). In the malignant mass group, there were 2 cases of Type I (1.87%), 13 cases of Type II (12.15%), 18 cases of Type III (16.83%), 48 cases of Type IV (44.86%), and 26 cases of Type V (24.30%). Significant differences were observed in the distribution of SWE image classifications between benign and malignant breast masses (P<0.001). The benign mass group predominantly corresponded to Types I and II, whereas the malignant mass group was primarily classified as Types IV and V, indicating obvious classification differences between the benign and malignant masses in SWE imaging features (Figure 4).
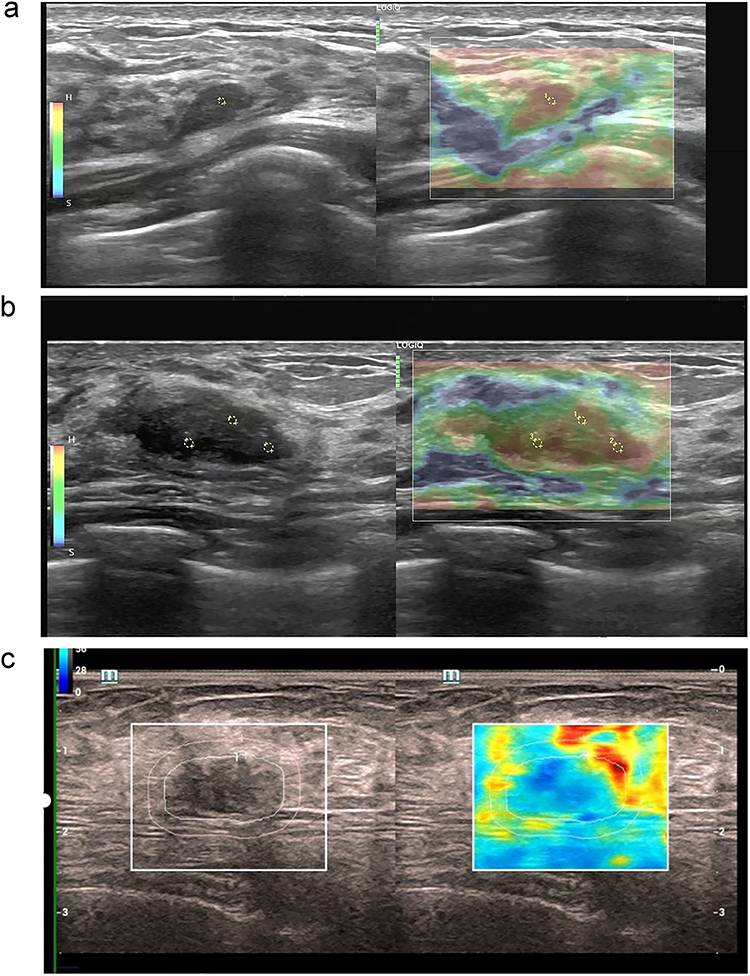 |
Figure 4 The representative images of breast masses in SWE imaging. (a) A small amount of skin and fibrofatty tissue with no tumor lesions. (b) A small amount of proliferative ductal epithelium, tending to be benign ductal epithelial proliferative lesions, and pathological examination of the mass diagnosed breast adenosis with fibroadenoma; (c) A solid mass in the breast, with a pathological diagnosis of invasive breast carcinoma. Immunohistochemistry: ER (++, approximately 90%), PR (++, approximately 70%), GATA-3 (++), Her2 (2+), P63 (-). Abbreviations: SWE, shear wave elastography; E max, maximum elasticity; ER, estrogen receptor; PR, progesterone receptor; Her2, human epidermal growth factor receptor 2. |
Comparison of Serum CA15-3 and CA125 Levels
Serum CA15-3 and CA125 levels in the malignant mass group were significantly higher than those in the benign mass group (P<0.05). This suggests that serum levels of CA15-3 and CA125 may hold significant reference values in the differential diagnosis of benign and malignant masses (Figure 5).
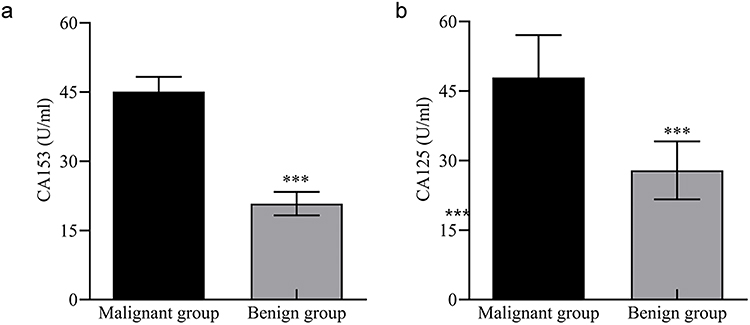 |
Figure 5 Comparison of serum CA15-3 and CA125 levels in benign and malignant breast masses. (a) CA15-3. (b) CA125.3. Abbreviations: CA15-3, carbohydrate antigen 15–3; CA125, carbohydrate antigen 125. Note: Compared with the malignant mass group, ***P<0.001. |
Correlation Analysis of Quantitative SWE Parameters of Breast Cancer Patients with Serum CA15-3 and CA125 Levels
Correlation analysis revealed that the quantitative SWE parameters in breast cancer patients at peak (E max, Shell1 E max, Shell2 E max, and Shell3 E max) positively correlated with serum CA15-3 (r=0.550, 0.456, 0.452, and 0.497, P<0.001) and CA125 (r=0.416, 0.413, 0.410, and 0.431, P<0.001) (Figure 6).
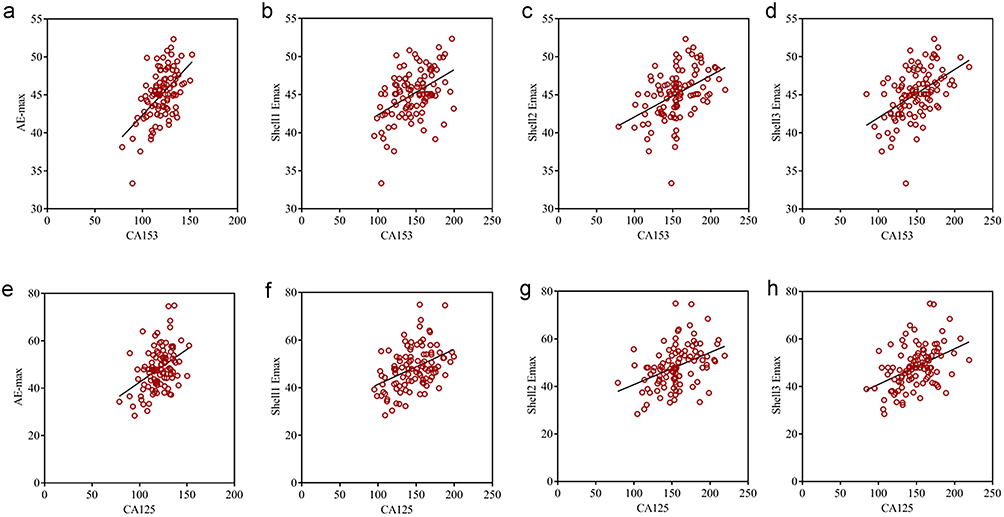 |
Figure 6 Correlation analysis of quantitative SWE parameters of breast cancer patients with serum CA15-3 and CA125 levels. (a) Correlation between E max and CA15-3. (b) Correlation between Shell1 E max and CA15-3. (c) Correlation between Shell2 E max and CA15-3. (d) Correlation between Shell3 E max and CA15-3. (e) Correlation between E max and CA125. (f) Correlation between Shell1 E max and CA125. (g) Correlation between Shell2 E max and CA125. (h) Correlation between Shell3 E max and CA125. Abbreviations: CA15-3, carbohydrate antigen 15–3; CA125, carbohydrate antigen 125; E max, maximum elasticity; SWE, shear wave elastography. |
Comparison of Quantitative SWE Parameters Between ER-Positive and ER-Negative Breast Cancer Patients
Among breast cancer patients, the quantitative SWE parameters (E max, Shell1 E max, Shell2 E max, and Shell3 E max) in the ER-positive group were significantly higher than those in the ER-negative group (P<0.05). Additionally, the proportion of ER-positive patients with tumor diameters ≤2 cm was markedly greater than that of ER-negative patients (P<0.05), whereas the proportion of spiculated margins was lower in the ER-positive group (P<0.05) (Table 2).
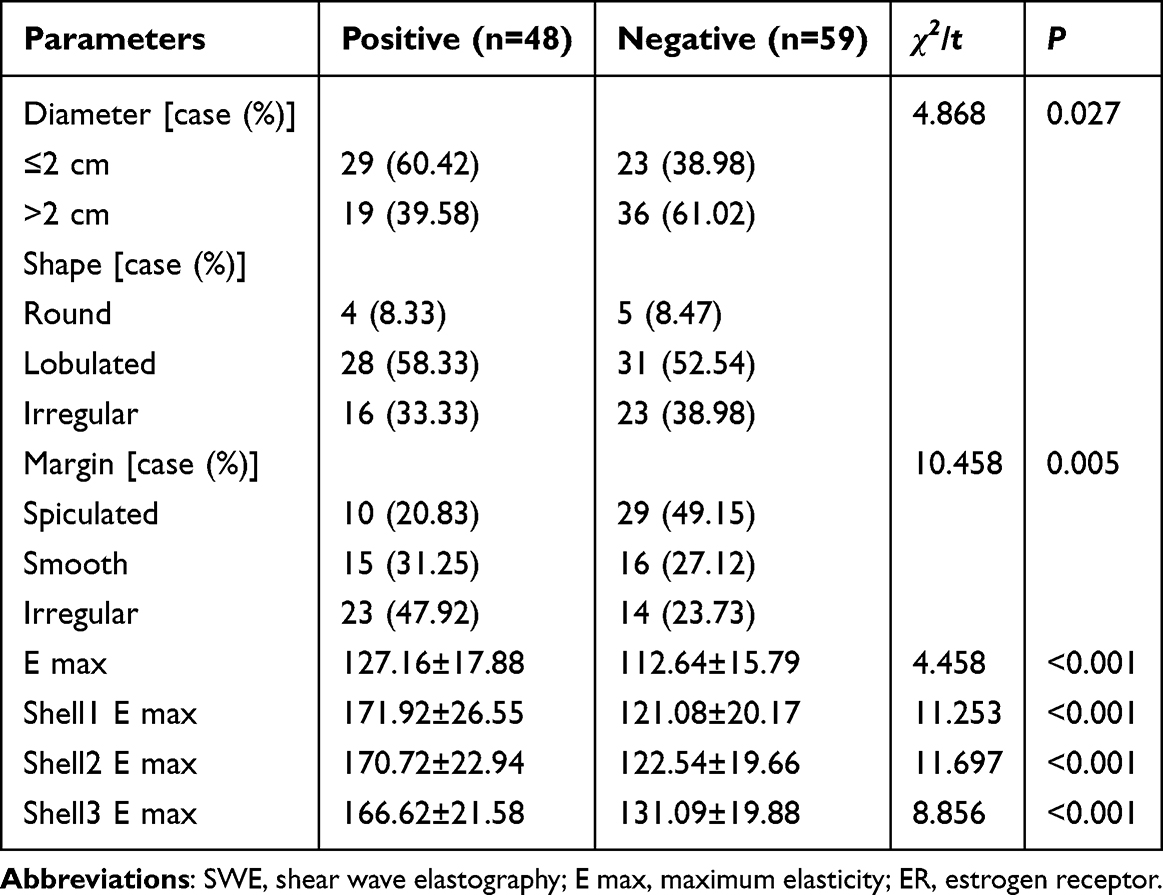 |
Table 2 Comparison of Quantitative SWE Parameters Between ER-Positive and ER-Negative Patients |
Comparison of Quantitative SWE Parameters Between PR-Positive and PR-Negative Breast Cancer Patients
Among the breast cancer patients, the quantitative SWE parameters (E max, Shell1 E max, Shell2 E max, and Shell3 E max) in the PR-positive group were significantly higher than those in the PR-negative group (P<0.05). Additionally, the proportion of PR-positive patients with tumor diameters ≤2 cm was markedly greater than that of PR-negative patients (P<0.05), whereas the proportion of spiculated margins was lower in the PR-positive group (P<0.05) (Table 3).
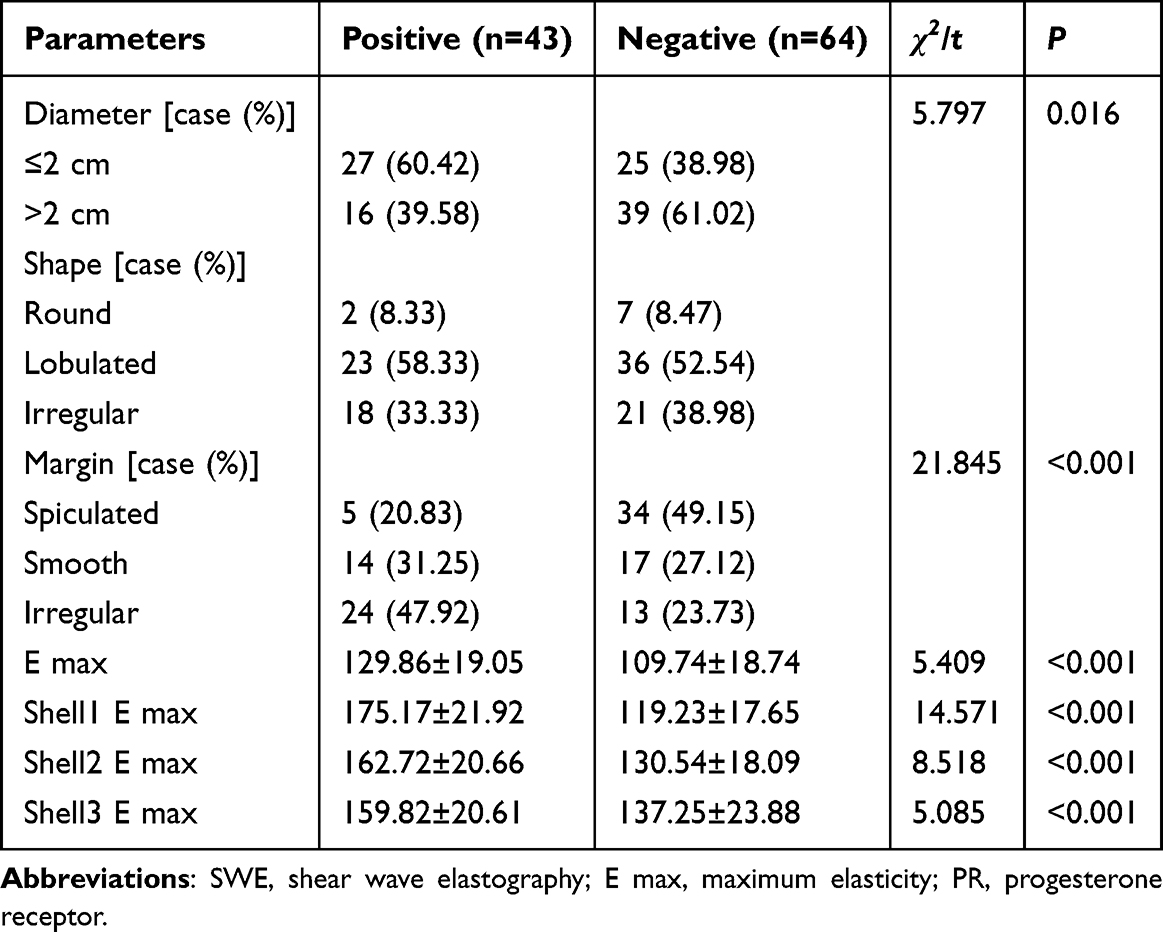 |
Table 3 Comparison of Quantitative SWE Parameters Between PR-Positive and PR-Negative Breast Cancer Patients |
Comparison of Quantitative SWE Parameters Between AR-Positive and AR-Negative Breast Cancer Patients
Among the breast cancer patients, the quantitative SWE parameters (E max, Shell1 E max, Shell2 E max, and Shell3 E max) in the AR-positive group were significantly higher than those in the AR-negative group (P<0.05). Additionally, the proportion of AR-positive patients with tumor diameters ≤2 cm was markedly greater than that of AR-negative patients (P<0.05), whereas the proportion of spiculated margins was lower in the AR-positive group (P<0.05) (Table 4).
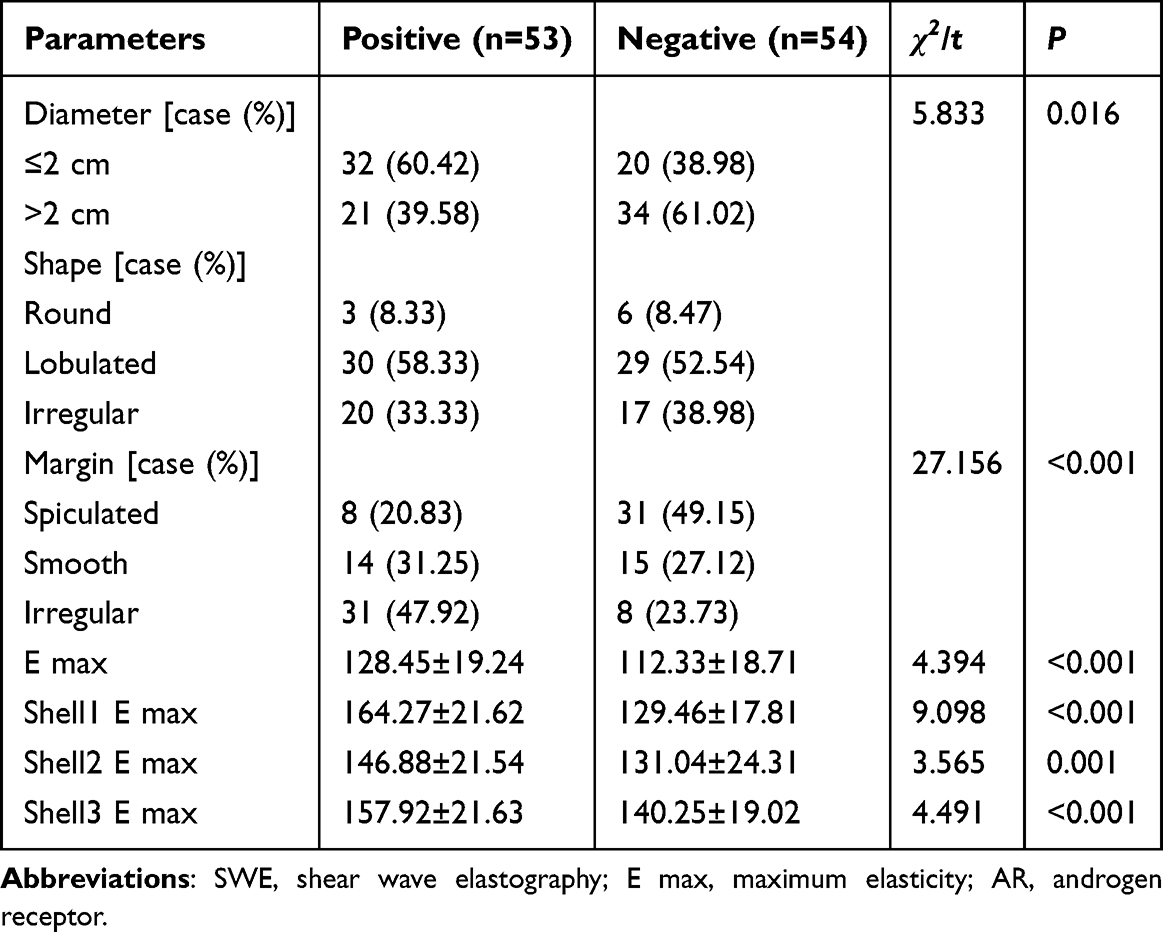 |
Table 4 Comparison of Quantitative SWE Parameters Between AR-Positive and AR-Negative Breast Cancer Patients |
Diagnostic Efficacy of SWE Parameters Combined with CA15-3 and CA125
Using pathological examination of the mass as the gold standard, ROC curve analysis was performed to evaluate the diagnostic performance of SWE quantitative parameters (E max, Shell1 E max, Shell2 E max, and Shell3 E max), CA15-3, CA125, and their combined model. The results showed that each individual indicator had some diagnostic value in distinguishing benign from malignant breast masses; among them, Shell1 E max had an AUC of 0.949 (95% CI: 0.923–0.974), which was higher than that of the other individual indicators. The AUC for the SWE quantitative parameter combined model (United1) was 0.996 (95% CI: 0.992–1.000), and the AUC for the combined model (United2) constructed by SWE quantitative parameters combined with CA15-3 and CA125 was 0.998 (95% CI: 0.995–1.000). Both were higher than those of any individual marker. The above results suggest that the combined use of SWE quantitative parameters and serum tumor markers may further improve the diagnostic performance in distinguishing benign from malignant breast masses (Table 5).
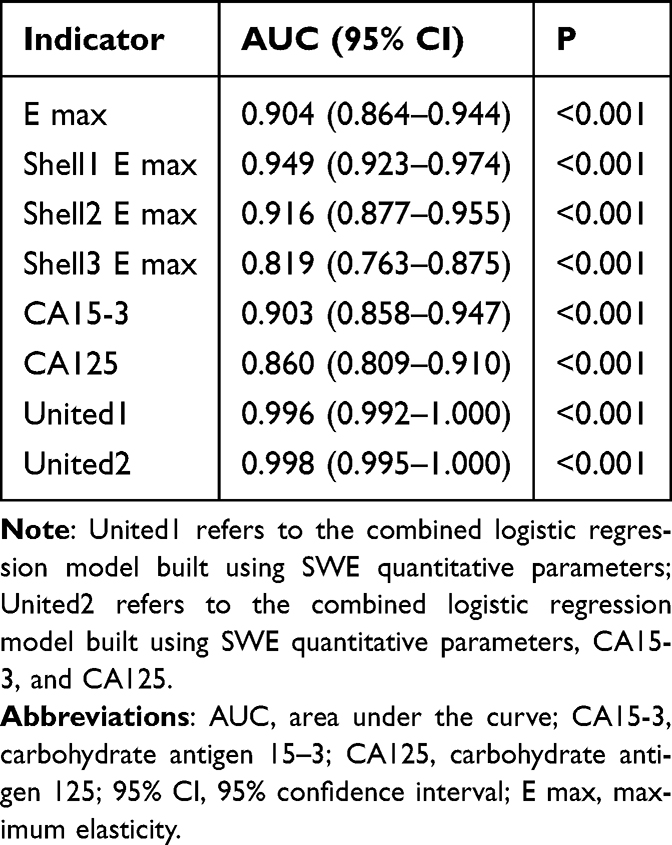 |
Table 5 ROC Analysis Results of SWE Parameters, CA15-3, CA125, and Combined Models for Differentiating Benign from Malignant Breast Masses |
Discussion
This study retrospectively analyzed the application of quantitative SWE parameters combined with breast cancer molecular markers to distinguish between benign and malignant breast masses and found that the integration of SWE parameters with molecular markers significantly enhanced diagnostic efficiency. Based on these results, this study explored the relationship between SWE and molecular markers of breast cancer, analyzed their potential mechanisms, and underscored their clinical significance.
Malignant breast masses exhibit significant differences from benign masses in terms of quantitative SWE parameters, blood flow signals, and molecular markers. The SWE parameters of malignant masses (E max, Shell1 E max, Shell2 E max, and Shell3 E max) were markedly higher than those of benign masses, which was attributable to the greater stiffness and higher cellular density of malignant tumors. Active tumor cell proliferation and angiogenesis result in increased tumor stiffness, which is reflected in SWE imaging as a higher elastic modulus.15 Moreover, malignant masses displayed a significantly higher blood flow velocity, resistance index, and pulsatility index than benign masses, further corroborating the heightened demand for nutrients and oxygen by tumor cells, with enhanced angiogenesis contributing to increased tumor blood flow.16
Regarding molecular markers, serum levels of CA15-3 and CA125 were significantly elevated in the malignant mass group compared with the benign mass group and demonstrated a positive correlation with quantitative SWE parameters. These findings suggest that the combined assessment of SWE and serum tumor markers can enhance the diagnostic accuracy of breast cancer. CA15-3 is a commonly used serum tumor marker in breast cancer.17 Although CA125 is not a breast cancer-specific marker, research has shown that it can be elevated in some breast cancer patients and may be associated with tumor burden, disease progression, and prognosis. Therefore, this study did not consider CA125 as a specific marker for diagnosing breast cancer. Instead, it was included as an adjunctive serum tumor marker, which was incorporated into the combined diagnostic model along with CA15-3 and SWE quantitative parameters. The results showed that CA125 levels were significantly higher in the malignant group than in the benign group, and that CA125 was positively correlated with SWE quantitative parameters, suggesting that CA125 may provide additional information for distinguishing benign from malignant breast masses. The stiff rim sign on SWE imaging refers to a ring-like area of high stiffness around the lesion. It usually reflects changes such as stromal reaction, fibrosis, or infiltrative growth around the tumor, and is considered one of the important elastographic signs of malignant breast lesions. Therefore, SWE can provide physical characteristics such as lesion stiffness,18 while CA15-3 and CA125 offer supplementary serological information. The combination of these modalities may help improve the diagnostic performance in differentiating benign from malignant breast masses.
Further analysis revealed a significant correlation between molecular markers such as ER, PR, and AR in patients with breast cancer and quantitative SWE parameters. SWE parameters in ER-positive patients were markedly higher than those in ER-negative patients. Moreover, ER-positive masses exhibited smaller diameters and fewer spiculated margins, likely reflecting the lower aggressiveness and slower growth rate of ER-positive breast cancers.19 Similarly, PR-positive patients demonstrated significantly elevated SWE parameters and smaller mass diameters than PR-negative patients, suggesting that PR expression may be associated with benign features of the tumor.20 The correlation between these molecular markers and the SWE parameters revealed a connection between the molecular characteristics of breast cancer and the mechanical properties of the mass. The results of this study showed that some SWE quantitative parameters were higher in ER-, PR-, and AR-positive patients than in negative patients, suggesting that hormone receptor expression status may be associated with breast cancer tissue stiffness and changes in the tumor microenvironment. It should be noted that SWE parameters reflect the overall mechanical properties of tumor tissue and its surrounding stroma, and changes in these parameters may be influenced by a combination of factors, including tumor cell density, stromal fibrosis, collagen deposition, and the surrounding tissue response.21 Therefore, the findings of this study suggest that there is a correlation between ER, PR, and AR expression and SWE quantitative parameters. However, the underlying mechanisms require further investigation and validation. The integration of quantitative SWE parameters with these molecular markers not only aids in assessing breast cancer malignancy but also provides robust support for the formulation of individualized treatment strategies.
Furthermore, the combined use of SWE and serum tumor markers CA15-3 and CA125 demonstrated significantly superior diagnostic efficacy in distinguishing between benign and malignant breast masses compared with single detection. This integrated detection strategy enhances diagnostic accuracy, particularly in cases where single methods struggle to provide definitive assessments. The combination of SWE with molecular markers not only provides insights into the physical properties of the masses but also reveals the molecular characteristics of the tumor, yielding a more comprehensive and precise diagnosis. The mechanistic investigation in this study suggests that the relationship between SWE and molecular markers may be linked to alterations in the tumor microenvironment. The high stiffness and hemodynamic changes observed in malignant masses reflect the biological characteristics of tumor cell proliferation, migration, and angiogenesis, which are closely associated with the expression levels of molecular markers, such as ER, PR, and AR. The integration of SWE with molecular markers provides a more comprehensive depiction of the biological behavior and histological features of masses, thereby enhancing the diagnostic accuracy of breast cancer.
This study has some limitations. First, this was a single-center retrospective study with a relatively concentrated patient population, which may have introduced selection bias. The external generalizability of our findings requires further validation through prospective multicenter studies. Second, an external validation cohort was not established. The stability and generalizability of the combined model must be further evaluated. Third, the malignant group included patients with different pathological subtypes. Although SWE performance may vary among subtypes, IDC accounted for 94.4% of malignant cases in this study, while the remaining subtypes were rare (≤3 cases each), making reliable subgroup analysis statistically infeasible. Stratified comparisons under such limited sample sizes may lead to unstable estimates and increased statistical bias. Therefore, the overall findings of this study primarily reflected the imaging characteristics of IDC. Further research with larger sample sizes is needed to explore the differences in SWE manifestations among the different pathological subtypes. Furthermore, CA125 is not a routine tumor marker for breast cancer. This study included it as an exploratory indicator in the analysis; however, its clinical value requires further validation. Finally, this study did not construct a multivariate prediction model but only evaluated the results based on the ROC analysis of the single-factor and combined indicators. Therefore, the independent diagnostic value of each parameter was not fully clarified. Given the exploratory nature of this study, strict corrections for multiple comparisons were not applied to any statistical tests, and the results should be interpreted with caution in the clinical context. In addition, external validation and sensitivity analyses were not performed, and the stability of the combined model requires further confirmation in larger multicenter studies.
Conclusions
In summary, the combination of SWE quantitative parameters with CA15-3 and CA125 testing can improve the diagnostic performance in differentiating benign from malignant breast masses and holds promise for clinical application. However, as this study is a single-center, retrospective analysis with a limited sample size, the findings still need to be further validated in larger, multicenter, prospective studies, and their clinical applicability should be confirmed through external validation. In addition, this study involved comparisons among multiple imaging parameters and molecular markers without adjustment for multiple comparisons, which may increase the risk of type I error. Therefore, the positive findings still need further confirmation in larger samples and external validation cohorts.
Funding
This research did not receive any specific grants from funding agencies in the public, commercial, or not-for-profit sectors.
Disclosure
Jing Liu and Yuke Zhang are co-first authors for this study. The authors report no conflicts of interest in this work.
References
1. Liu B, Song Y, Xu Y, Sun Q, Zhou Y, Lin Y. Optimizing treatment sequence for inoperable locally advanced breast cancer: long-term outcomes of surgery first versus neoadjuvant chemotherapy in a real-world setting. Int, J, Cancer. 2025;156(2):368–13. doi:10.1002/ijc.35140
2. Yao L, Pang Z, Wang M, et al. The choice of a neoadjuvant chemotherapy cycle for breast cancer has significance in clinical practice: results from a population-based, real world study. Cancer Biol Med. 2021;19(5):755–767. doi:10.20892/j.issn.2095-3941.2020.0800
3. Palaniswamy SS, Subramanyam P. Diagnostic performance of simultaneous PET-MR versus PET-CT in oncology with an overview on clinical utility and referral pattern of PET-MR: a single institutional study. Nucl Med Commun. 2024;45(12):1022–1032. doi:10.1097/mnm.0000000000001900
4. Zhao S, Wang S, Li Y, et al. Quantitative parameters of intravoxel incoherent movement imaging and dynamic contrast enhancement MRI for the prediction of HER2-zero, -low, and -positive breast cancers. Acad Radiol. 2025;32(4):1851–1860. doi:10.1016/j.acra.2024.11.011
5. Christensen EW, Rosenblatt RB, Patel AG, et al. Differential access to breast magnetic resonance imaging compared with mammography and ultrasound. Am J Prev Med. 2024;67(6):897–905. doi:10.1016/j.amepre.2024.07.007
6. Huang JX, Liu FT, Tan YT, et al. Enhancing detection of high-level axillary lymph node metastasis after neoadjuvant therapy in breast cancer patients with nodal involvement: a combined approach of axilla ultrasound and breast elastography. Radiol Med. 2025;130(1):121–131. doi:10.1007/s11547-024-01936-2
7. Karan B. Editorial for “diffusion-weighted MRI-based virtual elastography and shear-wave elastography for the assessment of breast lesions”. J Magn Reson Imaging. 2024;60(5):2214–2215. doi:10.1002/jmri.29325
8. Yilihamu Y, Wang L, Ma T, Zhao T, Wang Y, Sun G. The effects of preoperative serum carcinoembryonic antigen, cancer antigen 15-3 and cancer antigen 125 on the prognosis of breast cancer patients with different molecular subtypes. J Clin Med Res. 2024;16(10):491–502. doi:10.14740/jocmr5237
9. Allison KH, Hammond MEH, Dowsett M, et al. Estrogen and progesterone receptor testing in breast cancer: ASCO/CAP guideline update. J Clin Oncol. 2020;38(12):1346–1366. doi:10.1200/JCO.19.02309
10. Wolff AC, Somerfield MR, Dowsett M, et al. Human epidermal growth factor receptor 2 testing in breast cancer: ASCO-college of American pathologists guideline update. J Clin Oncol. 2023;41(22):3867–3872. doi:10.1200/JCO.22.02864
11. Qian X, Jin X, He J, Zhang J, Hu S. Exploring lipidomic profiles and their correlation with hormone receptor and HER2 status in breast cancer. Oncol Lett. 2024;29(1):34. doi:10.3892/ol.2024.14781
12. Fang C, Cao Y, Liu X, Zeng XT, Li Y. Serum CA125 is a predictive marker for breast cancer outcomes and correlates with molecular subtypes. Oncotarget. 2017;8(38):63963–63970. doi:10.18632/oncotarget.19246
13. Wang JT, Zhao L, Yin SL, Tian XL. Efficacy of quantitative parameters of shear wave elastography in differential diagnosis of breast masses and their correlations with biological parameters. China J Modern Med. 2022;32(6):56–62.
14. Cong R, Li J, Guo S. A new qualitative pattern classification of shear wave elastograghy for solid breast mass evaluation. Eur J Radiol. 2017;87:111–119. doi:10.1016/j.ejrad.2016.12.021
15. Niu J, Ma J, Guan X, Zhao X, Li P, Zhang M. Correlation between doppler ultrasound blood flow parameters and angiogenesis and proliferation activity in breast cancer. Med Sci Monit. 2019;25:7035–7041. doi:10.12659/msm.914395
16. Li N, Li M, Zhou F. Multimodal ultrasound plus tumor markers demonstrates a high value in enhanced diagnosis of breast cancer. Am J Transl Res. 2024;16(10):5497–5506. doi:10.62347/qvci6027
17. La Rocca LR, Caruso M, Stanzione A, et al. Machine learning-based discrimination of benign and malignant breast lesions on US: the contribution of shear-wave elastography. Eur J Radiol. 2024;181:111795. doi:10.1016/j.ejrad.2024.111795
18. Shin DS, Lee J, Kang E, et al. Age and late recurrence in young patients with ER-positive, ERBB2-negative breast cancer. JAMA Network Open. 2024;7(11):e2442663. doi:10.1001/jamanetworkopen.2024.42663
19. Zou X, Han H, Zou Y. Correlation between enhanced MRI and ER, PR, CerbB-2 in breast cancer. J Med Imaging. 2023;33(7):1288–1291.
20. Cho DH, Park CS, Kim SH, et al. Correlation of the strain elastography-derived elasticity scores with prognostichistologic features, immunohistochemical markers, and molecular subtypes of invasive ductal carcinoma. J Korean Soci Radiol. 2019;80(4):717–727. doi:10.3348/jksr.2019.80.4.717
21. Chang JM, Park IA, Lee SH, et al. Stiffness of tumours measured by shear-wave elastography correlated with subtypes of breast cancer. Eur Radiol. 2013;23(9):2450–2458. doi:10.1007/s00330-013-2866-2
 © 2026 The Author(s). This work is published and licensed by Dove Medical Press Limited. The
full terms of this license are available at https://www.dovepress.com/terms
and incorporate the Creative Commons Attribution
- Non Commercial (unported, 4.0) License.
By accessing the work you hereby accept the Terms. Non-commercial uses of the work are permitted
without any further permission from Dove Medical Press Limited, provided the work is properly
attributed. For permission for commercial use of this work, please see paragraphs 4.2 and 5 of our Terms.
© 2026 The Author(s). This work is published and licensed by Dove Medical Press Limited. The
full terms of this license are available at https://www.dovepress.com/terms
and incorporate the Creative Commons Attribution
- Non Commercial (unported, 4.0) License.
By accessing the work you hereby accept the Terms. Non-commercial uses of the work are permitted
without any further permission from Dove Medical Press Limited, provided the work is properly
attributed. For permission for commercial use of this work, please see paragraphs 4.2 and 5 of our Terms.