Back to Journals » International Journal of General Medicine » Volume 15
Application of Dual-Energy Spectral Computed Tomography in Bone Mineral Density Measurement: Phantom and Clinical Research
Authors Wang M, Wu Y, Zhou Y, Dong J, Hu S, Hou P, Gao J
Received 15 July 2022
Accepted for publication 16 August 2022
Published 29 August 2022 Volume 2022:15 Pages 6887—6896
DOI https://doi.org/10.2147/IJGM.S381857
Checked for plagiarism Yes
Review by Single anonymous peer review
Peer reviewer comments 2
Editor who approved publication: Dr Scott Fraser
Mingyue Wang, Yan Wu, Yue Zhou, Junqiang Dong, Shenshen Hu, Ping Hou, Jianbo Gao
Department of Radiology, the First Affiliated Hospital of Zhengzhou University, Zhengzhou, People’s Republic of China
Correspondence: Jianbo Gao, Email [email protected]
Introduction: Early detection and treatment of osteoporosis through bone mineral density (BMD) measurement could aid in the prevention of osteoporosis-related fractures. We aimed to assess the parameter of dual-energy spectral CT (DesCT) consistency with BMD determination using quantitative computed tomography (QCT), thereby establishing a basis for further DesCT application for BMD determination.
Methods: We subjected the European spine phantom, which contains three vertebral bodies (V1, V2, and V3), to DesCT with different radiation doses. The basis material pairs were hydroxyapatite (water), calcium (water), and hydroxyapatite (fat). Additionally, the medical records of 152 patients who underwent QCT and DesCT for chest scans in a two-month period were reviewed to measure BMD values.
Results: No significant differences were found in the basis pair values of the V1, V2, or V3 vertebrae under different radiation doses in the phantom; in particular, the hydroxyapatite (water), hydroxyapatite (fat), relative error values of V1, V2, and V3 under different radiation doses were not significantly different (all p > 0.05). For patients, the hydroxyapatite (water), hydroxyapatite (fat), and hydroxyapatite (average) values measured by DesCT had a significant correlation with BMD measured by QCT Among 242 vertebrae (152 T12 and 90 L1 vertebrae), there was no significant difference between the BMD measured by QCT and the HAP (average) measured by DesCT (p = 0.071). The interclass correlation coefficient (ICC) value was 0.925 between the HAP (average) and HAP (average) with DesCT and BMD measured by QCT (p < 0.001). Bland-Altman diagram indicated that both measurements were in good agreement.
Discussion: We showed that BMD values measured by DesCT were stable and repeatable under different radiation doses. DesCT and QCT measurements of human BMD were highly correlated. Thus, DesCT-based BMD assessment of the spine in a clinical setting could be considered feasible.
Keywords: dual-energy spectral computed tomography, quantitative computed tomography, bone mineral density, European spine phantom, spine
Introduction
Osteoporosis is a common disease that primarily endangers the health of middle-aged and older adults. The most serious complication is bone fracture, which significantly affects the quality of life of older adults.1–3 In individuals over 50 years, the lifetime risk of sustaining any fracture is approximately 50% for women and 20% for men in developed countries.4,5 Bone mineral density (BMD) measurement is an important indicator in osteoporosis diagnosis, fracture risk prediction, and treatment effect evaluation.6,7 Therefore, accurate and convenient BMD measurement is of great clinical and research interest.8,9
Dual-energy X-ray absorptiometry (DXA) and quantitative computed tomography (QCT) are considered the reference standards for BMD measurement.10 DXA is widely used owing to its low cost and radiation exposure. While DXA provides accurate BMD measurements in vitro (eg, vertebrae in homogeneous fluid),11 difficulties may arise, particularly in older individuals in whom factors such as vascular calcification, scoliosis, and spinal degeneration could cause diagnostic inaccuracies. Moreover, DXA measures the entire vertebral body BMD and is unable to distinguish between cortical and cancellous bone.12,13
QCT has advantages over DXA owing to its three-dimensional nature and opportunistic exploitation of routine CT scans.14 However, QCT uses conventional mixed energy scanning, which could potentially be influenced by scanner instability, X-ray tube voltage, beam-hardening artefacts, and metal artefacts.15,16
In contrast to DXA and QCT, dual-energy spectral CT (DesCT) can reduce beam hardening primarily through pseudo-monochromatic imaging.17,18 Moreover, it can be used for BMD measurement with bone separation technology, which has attracted considerable attention recently. Wesarg et al19 demonstrated that DesCT permits the assessment and three-dimensional display of spatial BMD distribution, facilitating a more detailed evaluation of local bone solidity than DXA. Some studies14,21,25 have reported the application of dual-energy computed tomography for the BMD measurement; however, the conclusions were different and the complex calculation process related to BMD of the dual-energy CT limits its clinical application.
Thus, this study aimed to evaluate the stability and reproducibility of DesCT material separation technology in measuring the BMD of the European Spine Phantom (ESP). We also aimed to assess the parameter of DesCT consistency with BMD determination using QCT and provide a basis for further DesCT application for BMD determination.
Materials and Methods
Phantom Materials
This study measured and analysed the European spine phantom (ESP) (No. 145, Orm Bergold Chemie GmbH & Co. KG, Bochum, Germany). The ESP comprises plastic made of epoxy resin and hydroxyapatite (HAP), which is equivalent to water and solid bone material composition, including three trabeculae of unequal BMD. Three vertebrae with different cancellous bone densities were recorded from top to bottom, namely, V1, V2, and V3. The cancellous bone HAP content in the three vertebral bodies was 50 mg/cm3, 100 mg/cm3, and 200 mg/cm3, respectively. According to the manufacturer’s protocol, two parameters (ie, HAP (water) and HAP (fat) values) were selected and measured at different radiation doses. These values were then compared with the actual values to assess their accuracy as BMD measurement parameters.
Patients
The study was conducted in accordance with the Declaration of Helsinki (as revised in 2013). The study was approved by the ethics committee of Zhengzhou University (approval number: KY-2021-0112). Owing to the retrospective nature of this study, the requirement for informed consent was waived. Consent for image publication was not necessary for photographs were completely unidentified and there were no details on persons mentioned within the text. Continuous inpatient electronic medical records at the Department of Radiology, The First Affiliated Hospital of Zhengzhou University, were reviewed for patients who underwent QCT and DesCT for chest scans between February 1, 2021, and March 31, 2022; the interval between the two examinations was no more than two months. After a detailed evaluation using the inclusion and exclusion criteria, we included 152 patients in this study. The participants’ demographic characteristics before scanning were recorded. The exclusion criteria were spinal tumours, tumour-like lesions or infections, fractures, surgery, multiple vertebral internal fixations, bone cement, severe degenerative changes, bone deformities, and hematologic disorders.
Scanning Methods
Scanning of the Phantom
We used a GE Revolution 256-row CT scanning device (GE Healthcare, Chicago, IL, USA) for all phantom experiments. The phantom was placed on the scanning bed and analysed using the energy spectrum scanning mode. The pitch was 0.984:1, and the tube voltage was instantaneously switched between high and low energy (140/80 kVp). During the scanning, three radiation dose grades were selected. Table 1 shows the scanning parameters corresponding to the three radiation doses. Scanning was repeated 10 times under the same conditions. The recombination layer thickness and spacing were set as 0.625 mm. The reconstructed data were transferred to the GE AW4.7 workstation (GE Healthcare) for measurement.
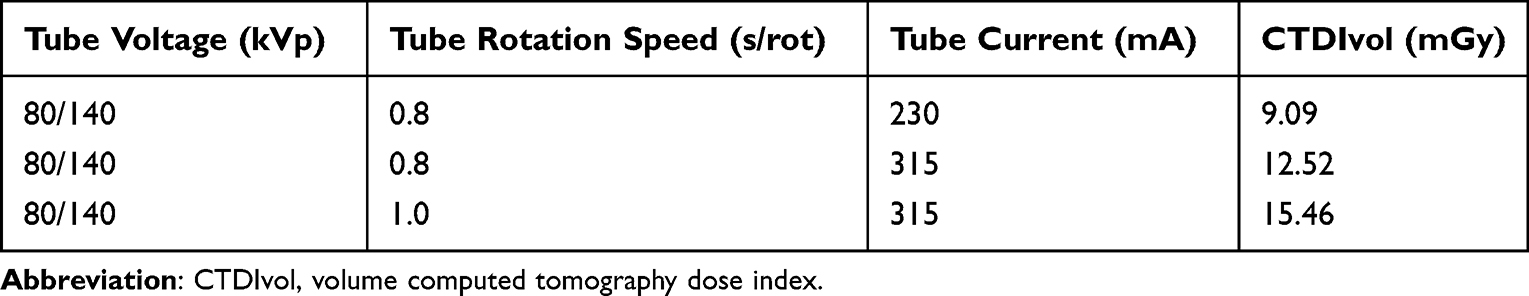 |
Table 1 Scanning Parameters Corresponding to the Three Radiation Doses of the Phantom Scanning |
Human Vertebral Body Scanning
We used the same GE Revolution 256-row CT scanning device to perform QCT and DesCT scans. All examinations of enrolled participants were performed simultaneously with a bone density calibration phantom placed beneath the spine. Table 2 shows the detailed scanning parameters of the QCT and DesCT.
 |
Table 2 Scanning Parameters of the QCT and Dual-Energy Spectral CT of the Patients |
Data Measurement for the Bone Phantom and Patients
The phantom measurement was obtained as follows. An attending physician who was unaware of the true value of the phantom vertebra used the Gemstone Spectral Imaging (GSI) Viewer (GE Healthcare) to measure the phantom at the GE AW4.7 workstation. When measuring the phantom, a circular region of interest (ROI) was set at the median plane of the vertebral body, with an area of 408.42 mm2 (Figure 1), and as much cancellous bone in the plane was included as possible, avoiding areas with high BMD, such as the cortical bone and its pedicle. The same ROI was measured twice, and the average value was recorded. A formula was used to calculate the relative error (RE): RE = (measured value - true value)/true value × 100.
 |
Figure 1 When measuring the phantom, a circular region of interest (bluey-green circle) was set at the median plane of the vertebral body, with an area of 408.42 mm2. |
The patient measurements were obtained as follows. Two attending physicians performed the measurements at the QCT Pro (Mindways QCT Pro; Mindways Software, Inc., Austin, TX, USA) and GE AW4.7 workstations separately. During the GSI measurement, the upper, middle, and lower levels of the vertebral body were selected as ROIs to determine HAP (water) and HAP (fat) values using the GSI software. The ROI size was 2/3 of the vertebral body size and was selected to avoid structures, such as bone islands and the vertebral venous plexus. The average of the three ROI values was calculated and the HAP (water) and HAP (fat) average values were recorded as HAP (average). For the QCT measurement, data were transferred to the QCT Pro analysis software (Mindways Software, Inc.). The patients’ information was verified. The T12, L1 and L2 vertebrae were identified (Figure 2) and scan analysis performed according to the manufacturer’s instructions. During the abovementioned measurements, workstation software tools were adapted for automatic analysis, including automatic functions, detection of boundaries, and generation of ROIs, unless obvious errors were observed perioperatively.
 |
Figure 2 Measurement of the bone mineral density of T12, L1 and L2 with Mindways quantitative computed tomography pro system. (A) Volume rendering view of a quantitative computed tomography scan. (B) Positioning of the sagittal and axial views for subsequent automatic placement of region of interest (ROIs). (C) ROIs shown as red ellipse in axial view and yellow rectangle in sagittal view. |
Statistical Analyses
SPSS 21.0 statistical software (IBM Corp., Armonk, NY, USA) was used for the statistical analyses. For the ESP data, one-way analysis of variance was used to compare the HAP (water) and HAP (fat) values of the V1, V2, and V3 vertebrae under different radiation doses. A one-sample t-test was used to compare the measured value with the true value of the corresponding phantom vertebra. For patient data, the Pearson correlation test was used to analyse the correlation between the QCT and DesCT measurement results; a paired t-test was used to analyse whether there was a difference in the structural averages measured by the two methods; and an interclass correlation coefficient (two-way random model, consistency type) and the Bland-Altman plot were used to analyse the consistency between methods. P < 0.05 was considered statistically significant.
Results
Phantom Results
Lumbar HAP (Water) and HAP (Fat) Values Under Different Radiation Doses
The HAP (water) and HAP (fat) values of V1, V2, and V3 under different radiation doses were not significantly different (n = 10; p > 0.05) (Table 3).
 |
Table 3 Lumbar HAP (Water) and HAP (Fat) Values of the Phantom Under Different Radiation Doses |
HAP (Water) and HAP (Fat) Values Compared with Actual Values
As shown in Table 4, the RE values of V1, V2, and V3 under different radiation doses were not significantly different (n = 10; p > 0.05) according to the RE ([measured value - true value]/true value × 100%). These data demonstrated that through phantom analysis, DesCT values were stable and repeatable under different radiation doses when measuring the substance content.
 |
Table 4 Comparison of HAP (Water) and HAP (Fat) Values with the Actual Values |
Human Results
In total, 152 patients were enrolled between February 1, 2021, and March 31, 2022. The average age of the enrolled patients was 55.49 years (range 18–96 years); 46.1% were men. All patients underwent QCT and DesCT for chest scans. The interval between the two examinations was two months or less.
BMD Measurement Results of the Two Methods and Their Correlation
The T12 vertebral BMD measured by QCT was 122.61 ± 33.74 mg/cm3, and the HAP (water) and HAP (fat) values of the corresponding area measured by DesCT were 103.36 ± 32.91 mg/cm3 and 139.86 ± 31.15 mg/cm3 (compared with BMD values measured by QCT, both p < 0.01), respectively. However, there was no significant difference between BMD measured by QCT and HAP (average) measured by DesCT (p > 0.05). All HAP (water), HAP (fat), and HAP (average) values measured by DesCT had significant correlations with BMD measured by QCT at the T12 vertebral body (correlation coefficients: 0.860, 0.880, and 0.932, respectively; all p < 0.01).
Among the 152 patients who underwent chest scanning, 90 had images from the lower part of the L1 vertebral body (38 men, 52 women). The L1 vertebral BMD measured by QCT was 120.93 ± 33.45mg/cm3, and the HAP (water) and HAP (fat) values of the corresponding area measured by DesCT were 100.11 ± 30.00 mg/cm3 and 137.64 ± 28.14 mg/cm3, respectively (both p < 0.01). There was no significant difference between the BMD measured by QCT and the HAP (average) measured by DesCT at the L1 vertebral body (p > 0.05). Moreover, all HAP (water), HAP (fat), and HAP (average) values measured by DesCT had strong correlations with BMD measured by QCT at the L1 vertebral body (correlation coefficients: 0.928, 0.936, and 0.934, respectively; all p < 0.01). The DesCT results, QCT BMD measurements, and statistical analysis were shown in Table 5.
 |
Table 5 Comparison of Bone Mineral Density Measurement Results Between QCT and Dual-Energy Spectral CT in Patients |
Evaluation of Consistency Between QCT and DesCT in BMD Measurement
Among the 242 vertebrae (152 T12 and 90 L1 vertebrae), there was no significant difference between the BMD measured by QCT and the HAP (average) measured by DesCT (p = 0.071). The 242 vertebrae were divided into three groups according to BMD as measured by QCT: osteoporosis group, (BMD < 80 mg/cm3), osteopenia group (80 mg/cm3 ≤ BMD ≤ 120 mg/cm3), and normal bone mass group (BMD >120 mg/cm3). BMD measured by QCT was 68.80 ± 10.65 mg/cm3 for the osteoporosis group and 148.38 ± 20.13 mg/cm3 for the normal group, compared with a HAP (average) as measured by DesCT of 76.15 ± 12.12 mg/cm3 and 142.96 ± 18.72 mg/cm3, respectively; the differences were significant (both p < 0.01). However, there was no significant difference between BMD measured by QCT (101.84 ± 12.00 mg/cm3) and HAP (average) (102.61 ± 12.00 mg/cm3) measured by DesCT for the osteopenia group (p = 0.264). The DesCT results, QCT BMD measurements, and statistical analysis are shown in Table 6.
 |
Table 6 Comparison of Bone Mineral Density Measurements Between QCT and Dual-Energy Spectral CT for Different Groups |
The interclass correlation coefficient (ICC) value was 0.925 between the HAP (average) by HAP (average) with DesCT and BMD measured by QCT (p < 0.001). We used the mean value of the BMD measured by HAP (average) with DesCT and BMD measured by QCT as the abscissa, the difference of BMD measured by HAP (average) with DesCT and BMD measured by QCT as the ordinate, and mean difference ± 1.96 times the standard deviation (d ±1.96SD) as the consistency limit to draw the Bland-Altman diagram. Figure 3 showed that most of the differences were within the consistency limit, indicating that both measurements were in good agreement.
 |
Figure 3 Bland–Altman plot showing the data of 242 vertebral bodies of 152 patients. The solid line denotes the mean difference between HAP(average) and QCT-based BMD values, and the dotted lines represent the 95% limits of agreement (mean differences ± 1.96 (SD)). The mean of HAP (average) and QCT-based BMD value is plotted on the x-axis, and the difference between the two values (HAP (average) –QCT-based BMD) is plotted on the y-axis. The mean difference d = −1.39 (95% CI: −2.95, 0.16), standard deviation (SD) = 12.28 mg/cm3, and d ± 1.96SD were 22.68 mg/cm3 and −25.46 mg/cm3, respectively, indicating a high level of consistency between the two measurement methods. Green, red, and blue circles represent osteoporosis, osteopenia, and normal group, respectively. Abbreviations: BMD, bone mineral density; CI, confidence interval; HAP (average), the mean of HAP (water) and HAP (fat); QCT, quantitative computed tomography; SD, standard deviation. |
Discussion
This study first measured and analysed the ESP, which comprised epoxy resin and HAP. We confirmed that the HAP (water) and HAP (fat) values of the same vertebra under different radiation doses were not significantly different, providing an experimental basis for future low-dose scanning. Our results also demonstrated that under different radiation doses, there was no significant difference in the RE between HAP (water), HAP (fat), and the true value, suggesting that the substance content measured by DesCT is stable under different radiation doses.
Previous studies20,21 have reported that DesCT can be used to measure BMD; however, differences in the methodologies used exist between studies. We used energy spectrum imaging technology to scan the ESP and explore the accuracy of DesCT in measuring spine BMD in patients to lay the foundation for clinical application.
Material separation technology is a major feature of DesCT, and is based on the principle that the X-ray absorption characteristics of any tissue in the human body can be expressed by the other two basis materials.22 The main component of the lumbar vertebrae is HAP, which largely determines the BMD and reflects bone strength.23 The main components of ESP used in this study, namely, HAP and epoxy resin, are equivalent to HAP and water.
QCT is widely used to measure BMD in vivo.24 Therefore, we compared HAP (water), HAP (fat), and HAP (average) by DesCT with BMD measured by QCT. In this study, the HAP (water) value measured by the DesCT material separation technology was lower than that of the corresponding area by QCT, which is consistent with the results of Mei et al.25 The in vivo measurement of QCT BMD is affected by the vertebral body’s fat content,26 while the energy spectrum material separation technology uses HAP (water) as the basis material to measure BMD. However, the actual vertebral composition is complicated and includes not only HAP and water but also fat, a collagen matrix, and other substances; HAP content measured by energy spectrum material separation is also affected by other substances in the vertebra. Considering that the fat content of the bone marrow is closely related to BMD,27,28 we measured HAP (fat) to evaluate BMD. Our results demonstrate that although HAP (water) and HAP (fat) measured by DesCT were significantly different from BMD values measured by QCT, there was no significant difference between BMD values and HAP (average).
The BMD values of cancellous bone measured with HAP (water), HAP (fat), and HAP (average) via the DesCT material separation method were significantly linearly correlated with BMD measured by QCT. The interclass correlation coefficient of the two measurements was significant, consistent with the results obtained by Mei et al,25 indicating that cancellous BMD determined by the rapid kV-switching energy spectrum material separation method can be used for BMD evaluation.
Similar to our study, a study by Zhou et al14 evaluated the feasibility and accuracy of phantomless in vivo DesCT-based BMD quantification in comparison with QCT. However, unlike those authors, who performed linear regression analysis to measure the BMD values, we obtained the data through direct measurement, which is clinically convenient and fast, has low requirements on the measurer, and can be widely used in clinical settings. This study further grouped by BMD measured by QCT and found that HAP (average) measure by the DesCT was not significantly different from QCT in the diagnosis of osteopenia. Although the differences between DesCT and QCT were significant in the osteoporosis group, but the diagnostic consistency between the two methods was good. In the normal group HAP (average) measure by the DesCT lower than the BMD measured by QCT, which may make the DesCT more sensitive than QCT for osteopenia in the normal group. Therefore, it is appropriate to use HAP (average) to screen for osteoporosis in clinical work.
This study has certain limitations. First, when scanning the phantom for different radiation dose settings, three grades for the GSI mode were selected (low, medium, and high grade). There was no other energy grade paired. The measurement results could potentially be different if we were to use an ultra-low or ultra-high dose grade. Second, only human T12 vertebrae and L1 vertebrae were measured. Therefore, the measurement and analysis results of human T12 and L1 vertebrae still need further confirmation with other human vertebra specimens or in vivo studies. Third, there is no further classification of the population by age or sex. In future studies, it would be beneficial for the sample size to be expanded, further classified, and compared.
Thus, this phantom study confirmed the stability and good repeatability of the DesCT measurement of HAP. Moreover, the patients’ data demonstrated that DesCT can be used to predict BMD, and that HAP (average) can replace the QCT value, which requires larger sample sizes to confirm. As previous studies have shown, DesCT has many applications for chest and abdomen scanning, and has advantages over conventional CT in disease detection, disease diagnosis, and differentiation of benign and malignant tumours.29–33 DesCT also has advantages in improving image quality and eliminating metal artefacts.34,35 The diagnostic consistency between the between the HAP (average) values measured by DesCT and the BMD values measured by QCT was good. Therefore, we suggest that doctors can procure both image and BMD data in one scan with DesCT without the associated risks of additional radiation doses, which can greatly benefit the patient.
Conclusions
In conclusion, DesCT measurement of the phantom BMD was stable and repeatable under different radiation doses. The diagnostic consistency between the DesCT and QCT was good. We demonstrated the feasibility of DesCT-based BMD assessment of the spine in a clinical setting.
Data Sharing Statement
The data used to support the findings of this study are included within the article.
Funding
This research did not receive any specific grant from funding agencies in the public, commercial, or not-for-profit sectors.
Disclosure
The authors declare that there is no conflict of interest regarding the publication of this paper.
References
1. Levin VA, Jiang X, Kagan R. Estrogen therapy for osteoporosis in the modern era. Osteoporos Int. 2018;29:1049–1055.
2. Wang L, Yu W, Yin X, et al. Prevalence of osteoporosis and fracture in China: the China Osteoporosis Prevalence Study. JAMA Netw Open. 2021;4:e2121106.
3. Cummings SR, Melton LJ. Epidemiology and outcomes of osteoporotic fractures. Lancet. 2002;359:1761–1767.
4. Boudin E, Steenackers E, de Freitas F, et al. A common LRP4 haplotype is associated with bone mineral density and Hip geometry in men-data from the Odense Androgen Study (OAS). Bone. 2013;53:414–420.
5. Sànchez-Riera L, Carnahan E, Vos T, et al. The global burden attributable to low bone mineral density. Ann Rheum Dis. 2014;73:1635–1645.
6. Cosman F, De Beur SJ, LeBoff MS, et al. Clinician’s guide to prevention and treatment of osteoporosis. Osteoporos Int. 2014;25:2359–2381.
7. Marques EA, Elbejjani M, Gudnason V, et al. Proximal femur volumetric bone mineral density and mortality: 13 years of follow-up of the AGES-Reykjavik study. J Bone Miner Res. 2017;32:1237–1242.
8. Oei L, Koromani F, Rivadeneira F, Zillikens MC, Oei EH. Quantitative imaging methods in osteoporosis. Quant Imaging Med Surg. 2016;6:680–698.
9. Johnston CB, Dagar M. Osteoporosis in older adults. Med Clin North Am. 2020;104:873–884.
10. Wu Y, Jiang Y, Han X, Wang M, Gao J. Application of low-tube current with iterative model reconstruction on Philips Brilliance iCT Elite FHD in the accuracy of spinal QCT using a European spine phantom. Quant Imaging Med Surg. 2018;8:32–38.
11. Ho CP, Kim RW, Schaffler MB, Sartoris DJ. Accuracy of dual-energy radiographic absorptiometry of the lumbar spine: cadaver study. Radiology. 1990;176:171–173.
12. Link TM. Osteoporosis imaging: state of the art and advanced imaging. Radiology. 2012;263:3–17.
13. Alawi M, Begum A, Harraz M, et al. Dual-energy X-ray absorptiometry (DEXA) scan versus computed tomography for bone density assessment. Cureus. 2021;13:e13261.
14. Zhou S, Zhu L, You T, et al. In vivo quantification of bone mineral density of lumbar vertebrae using fast kVp switching dual-energy CT: correlation with quantitative computed tomography. Quant Imaging Med Surg. 2021;11:341–350.
15. Garner HW, Paturzo MM, Gaudier G, Pickhardt PJ, Wessell DE. Variation in attenuation in L1 trabecular bone at different tube voltages: caution is warranted when screening for osteoporosis with the use of opportunistic CT. AJR Am J Roentgenol. 2017;208:165–170.
16. Engelke K, Lang T, Khosla S, et al. Clinical use of quantitative computed tomography-based advanced techniques in the management of osteoporosis in adults: the 2015 ISCD Official Positions-Part III. J Clin Densitom. 2015;18:393–407.
17. Kanatani R, Shirasaka T, Kojima T, Kato T, Kawakubo M. Influence of beam hardening in dual-energy CT imaging: phantom study for iodine mapping, virtual monoenergetic imaging, and virtual non-contrast imaging. Eur Radiol Exp. 2021;5:18.
18. Lewis M, Reid K, Toms AP. Reducing the effects of metal artefact using high keV monoenergetic reconstruction of dual energy CT (DECT) in Hip replacements. Skeletal Radiol. 2013;42:275–282.
19. Wesarg S, Kirschner M, Becker M, et al. T-based assessment of the trabecular bone in vertebrae. Methods Inf Med. 2012;51:398–405.
20. Wait JM, Cody D, Jones AK, Rong J, Baladandayuthapani V, Kappadath SC. Performance evaluation of material decomposition with rapid-kilovoltage-switching dual-energy CT and implications for assessing bone mineral density. Am J Roentgenol. 2015;204:1234–1241.
21. Booz C, Noeske J, Albrecht MH, et al. Diagnostic accuracy of quantitative dual-energy CT-based bone mineral density assessment in comparison to Hounsfield unit measurements using dual x-ray absorptiometry as standard of reference. Eur J Radiol. 2020;132:109321.
22. Lv P, Zhang Y, Liu J, Ji L, Gao J. Material decomposition images generated from spectral CT: detectability of urinary calculi and influencing factors. Acad Radiol. 2014;21:79–85.
23. Wichmann JL, Booz C, Wesarg S, et al. Dual-energy CT-based phantomless in vivo three-dimensional bone mineral density assessment of the lumbar spine. Radiology. 2014;271:778–784.
24. Giambini H, Dragomir-Daescu D, Huddleston PM, Camp JJ, An KN, Nassr A. The effect of quantitative computed tomography acquisition protocols on bone mineral density estimation. J Biomech Eng. 2015;137:114502.
25. Mei K, Schwaiger BJ, Kopp FK, et al. Bone mineral density measurements in vertebral specimens and phantoms using dual-layer spectral computed tomography. Sci Rep. 2017;7:17519.
26. Laval-Jeantet AM, Roger B, Bouysee S, Bergot C, Mazess RB. Influence of vertebral fat content on quantitative CT density. Radiology. 1986;159:463–466.
27. Sheu Y, Amati F, Schwartz AV, et al. Vertebral bone marrow fat, bone mineral density and diabetes: the Osteoporotic Fractures in Men (MrOS) study. Bone. 2017;97:299–305.
28. Chen CC, Liu YJ, Lee SP, Yang HT, Chan WP. Gender interactions between vertebral bone mineral density and fat content in the elderly: assessment using fat-water MRI. J Magn Reson Imaging. 2020;51:1382–1389.
29. Li M, Zhang L, Tang W, et al. Quantitative features of dual-energy spectral computed tomography for solid lung adenocarcinoma with EGFR and KRAS mutations, and ALK rearrangement: a preliminary study. Transl Lung Cancer Res. 2019;8:401–412.
30. Fehrmann A, Garcia Borrega JG, Holz J, et al. Metastatic pulmonary calcification: first report of pulmonary calcium suppression using dual-energy CT. Radiol Case Rep. 2020;15:900–903.
31. Wang X, Liu D, Zeng X, et al. Dual-energy CT quantitative parameters for the differentiation of benign from malignant lesions and the prediction of histopathological and molecular subtypes in breast cancer. Quant Imaging Med Surg. 2021;11:1946–1957.
32. Yang CB, Zhang S, Jia YJ, et al. Dual energy spectral CT imaging for the evaluation of small hepatocellular carcinoma microvascular invasion. Eur J Radiol. 2017;95:222–227.
33. Nagayama Y, Tanoue S, Inoue T, et al. Dual-layer spectral CT improves image quality of multiphasic pancreas CT in patients with pancreatic ductal adenocarcinoma. Eur Radiol. 2020;30:394–403.
34. Kang HJ, Lee JM, Lee SM, et al. Value of virtual monochromatic spectral image of dual-layer spectral detector CT with noise reduction algorithm for image quality improvement in obese simulated body phantom. BMC Med Imaging. 2019;19:76.
35. Tahmasebi Birgani MJ, Mahdavi M, Zabihzadeh M, Lotfi M, Mosleh-Shirazi MS. Simultaneous characterization of electron density and effective atomic number for radiotherapy planning using stoichiometric calibration method and dual energy algorithms. Australas Phys Eng Sci Med. 2018;41:601–619.
 © 2022 The Author(s). This work is published and licensed by Dove Medical Press Limited. The
full terms of this license are available at https://www.dovepress.com/terms
and incorporate the Creative Commons Attribution
- Non Commercial (unported, 3.0) License.
By accessing the work you hereby accept the Terms. Non-commercial uses of the work are permitted
without any further permission from Dove Medical Press Limited, provided the work is properly
attributed. For permission for commercial use of this work, please see paragraphs 4.2 and 5 of our Terms.
© 2022 The Author(s). This work is published and licensed by Dove Medical Press Limited. The
full terms of this license are available at https://www.dovepress.com/terms
and incorporate the Creative Commons Attribution
- Non Commercial (unported, 3.0) License.
By accessing the work you hereby accept the Terms. Non-commercial uses of the work are permitted
without any further permission from Dove Medical Press Limited, provided the work is properly
attributed. For permission for commercial use of this work, please see paragraphs 4.2 and 5 of our Terms.