")
Back to Journals » International Journal of General Medicine » Volume 15
APOA1 Level is Negatively Correlated with the Severity of COVID-19
Authors Yu X , Xu X, Wu T, Huang W, Xu C, Xie W, Long X
Received 11 August 2021
Accepted for publication 1 November 2021
Published 18 January 2022 Volume 2022:15 Pages 689—698
DOI https://doi.org/10.2147/IJGM.S332956
Checked for plagiarism Yes
Review by Single anonymous peer review
Peer reviewer comments 2
Editor who approved publication: Dr Scott Fraser
Xiaosi Yu,1,2,* Xianqun Xu,1,* Tianpeng Wu,3,* Wenjie Huang,1 Chen Xu,1 Wen Xie,1 Xinghua Long1
1Department of Laboratory Medicine, Zhongnan Hospital of Wuhan University, Wuhan, People’s Republic of China; 2Tongji Hospital, Tongji Medical College of Huazhong University of Science and Technology, Wuhan, People’s Republic of China; 3Department of Urology, Renmin Hospital of Wuhan University, Wuhan, People’s Republic of China
*These authors contributed equally to this work
Correspondence: Xinghua Long; Wen Xie Email [email protected]; [email protected]
Objective: We used public data to analyze the proteomics, metabolomics and transcriptomics characteristics of COVID-19 patients to identify potential therapeutic targets. More importantly, we also collected clinical data for verification to make the analysis results more reliable.
Methods: Download the serum proteomics and metabolomics data of COVID-19 patients and describe their changes in serum proteins and metabolites, and use bioinformatics analysis methods to identify potential biomarkers and therapeutic targets. Finally, clinical data and experimental data of cell infection were combined for verification.
Results: It was found that the serum apolipoprotein A1 (APOA1) protein level in COVID-19 patients was down-regulated (log2FC = ? 0.39, false discovery rate (FDR) < 0.001), and the degree of reduction in the severe group was more significant (kruskal-test p = 2.5e-05). What is more, APOA1 was not only expressed lower in male patients (Wilcox-test p = 0.012), but also negatively correlated with C-reactive protein (CRP, r = ? 0.37, p = 0.019). The experiment data from SARS-CoV-2 infected cells further showed that the protein and transcript level of APOA1 gradually decreased as the infection time increased, and the transcription level (log2FC = ? 8.3, FDR = 0.0015) was more down-regulated than protein level (log2FC = ? 0.95, FDR = 0.0014). More importantly, the collected clinical data also confirmed that APOA1 was down-regulated in COVID-19 patients (kruskal-test p = 0.001), and APOA1 levels are negatively correlated with IL6 (r = ? 0.396, p = 2.22e-07), D-dimers (DD, r = ? 0.262, p = 8.19e-04), prothrombin time (PT, r = ? 0.464, p = 6.68e-10) and thrombin time (TT, r = ? 0.279, p = 3.46e-04).
Conclusion: The degree of down-regulation of APOA1 is positively correlated with the severity of COVID-19, and the expression level of APOA1 is negatively correlated with CRP, IL6, DD, PT, TT, and positively correlated with HD and LDL. This indicates that APOA1 may be a key molecule in tandem acute inflammatory response, coagulation abnormalities and cholesterol metabolism disorder in COVID-19, and could be a potential therapeutic target.
Keywords: COVID-19, SARS-CoV-2, APOA1, proteomics
Introduction
Coronavirus disease 2019 (COVID-19) is a rapidly spreading disease caused by severe acute respiratory syndrome coronavirus-2 (SARS-CoV-2). It was first discovered in Wuhan, China, and has rapidly spread and become a major global disease.1,2 According to the World Health Organization (WHO, https://www.who.int/emergencies/diseases/novel-coronavirus-2019), as of October 30, 2020, there were 44,351,506 confirmed cases in 219 countries, including 1,171,255 deaths, and the number of infections is still rising rapidly. While there are many clinical trials underway for COVID-19, there is no specific vaccine or effective treatment.
One of the known pathogenesis of COVID-19 is an excessive inflammatory response,3 a sharp increase in pro-inflammatory cytokines, known as “cytokine storms”, leading to respiratory distress and coagulation disorders in patients. The patient developed elevated D-dimer, deep vein thrombosis.4 Cardiovascular injury has been reported in 20–30% of COVID19 patients.5 And hyperlipidemia and diabetes impair immune responses and lead to persistent chronic inflammation, which increases the risk of cardiovascular disease (CVD).6–8
The application of proteomics and metabolomics research technology has greatly promoted the progress of biological research and is of great significance for the identification of biomarkers.9–11 In this study, we performed a series of statistical analyses based on the serum proteomics and metabolomics data of COVID-19 patients to determine potential therapeutic targets and find diagnostic biomarker. And verify it in the proteome and transcriptome data of the SARS-CoV-2 infected cell experiment. Finally, combined with the clinical data of the hospital, we successfully verified that the expression of APOA1 in the patient’s serum was significantly down-regulated, and that the degree of decline was positively correlated with the severity of the disease. This indicates that APOA1 is likely to be a potential therapeutic target for COVID-19.
Methods
Publicly Available Data
Serum proteomic and metabolomic data for COVID-19 was downloaded from Shen et al.11 Only 41 COVID-19 patients and 18 healthy controls with both proteomic and metabolomic data were included in the follow-up analysis. Urine proteomic data for COVID-19 were downloaded from Li et al,12 data from 6 patients and 32 healthy control samples were included. Proteomic data and transcriptomic data from SARS-CoV-2 infected cell experiments were downloaded from Bojkova et al.13
Data Standardization
The “Metaboanalyst” website (https://www.metaboanalyst.ca/)14 was used for data standardization. We removed the feature of missing > 50% values, and replaced the missing values with 1/5 of the minimum positive value of each variable. Finally, we perform log transformations to standardize the data for subsequent analysis.
Gene Set Enrichment Analysis (GSEA)
GSEA (https://www.gsea-msigdb.org/gsea/msigdb)15 uses gene expression matrices and gene function annotation files to compare differences in gene function enrichment between the two groups. In order to explore the potential molecular mechanism of COVID-19 infection, GSEA was used to compare the differences in the KEGG signaling pathway between COVID-19 patients and healthy people. Nominal p-value < 0.05 was considered statistically significant.
Differential Analysis
“Limma” package16 was used for differential analysis, |log2FC| > 0.25 and FDR < 0.05 were considered as the cutoff values for differentially expressed proteins (DEPs) screening. Volcano plot and heatmap were performed through the corresponding package of R (version 3.6.3). In addition, function enrichment analysis was carried out by the Metascape website (https://metascape.org/gp/index.html).17
Weighted Gene Co-Expression Network Analysis (WGCNA)
WGCNA18 can identify highly synergistically altered gene sets and identify potential biomarker genes or therapeutic targets based on their internal connectivity and association with phenotypes. Therefore, the “WGCNA” package was used to put the features with similar expression patterns into the module by average linkage clustering to identify gene modules related to clinical traits.
Protein-Protein Interaction Networks (PPI)
The intersection of the significant module and the differentially expressed proteins were used for subsequent analysis. The PPI network was retrieved from STRING (https://string-db.org/)19 website and visualized by Cytoscape software (version 3.6.0).20 The “CytoHubba”21 plug-in, which can use 12 different algorithms to calculate the importance of each point, were used to find important features. Besides, the plug-in of “MCODE”22 was used to find clusters based on topology to locate densely connected regions. SPSS (Version 24.0) was used to calculate the poisson correlation. |Correlation coefficient (r)| > 0.2 and p < 0.05 were selected.
Clinical Data Collection
We retrospectively collected blood test data of inpatients in Zhongnan Hospital of Wuhan University from January 20 to March 20. First, we screened patients with confirmed COVID-19. Then we screened out the data of 160 COVID-19 patients who have tested APOA1, APOB, HDL, LDL, APTT, TT, PT, DD and IL6 at the same time, of which 6 patients were diagnosed with severe pneumonia. At the same time, we also collected 31 healthy control of ApoA1, APOB, HDL and LDL blood test data during routine health examination in January 2020.
Ethical Approval
This study was reviewed and approved by the Ethical Committee of Zhongnan Hospital of Wuhan University. This was a retrospective study, written informed consent was waived by the Ethics Commission of the designated hospital for emerging infectious diseases. The data was kept confidential and complies with the Declaration of Helsinki.
Results
GSEA: Changes in Signaling Pathways in COVID-19 Patients
The serum proteome data of Shen et al were analyzed by GSEA to explore the changes in the KEGG signaling pathway between COVID-19 patients and healthy controls. Among them, 7 pathways were significantly different. The two KEGG signaling pathways, complement and coagulation cascade and systemic lupus erythematosus, were significantly up-regulated in COVID-19 patients (Figure 1A and B). Pathways in cancer, ECM receptor interaction, focal adhesion, chemokine and TGF-β signaling pathway were significantly down-regulated in healthy people (Figure 1C–G). This indicates that these signaling pathways may be related to the pathogenesis of COVID-19.
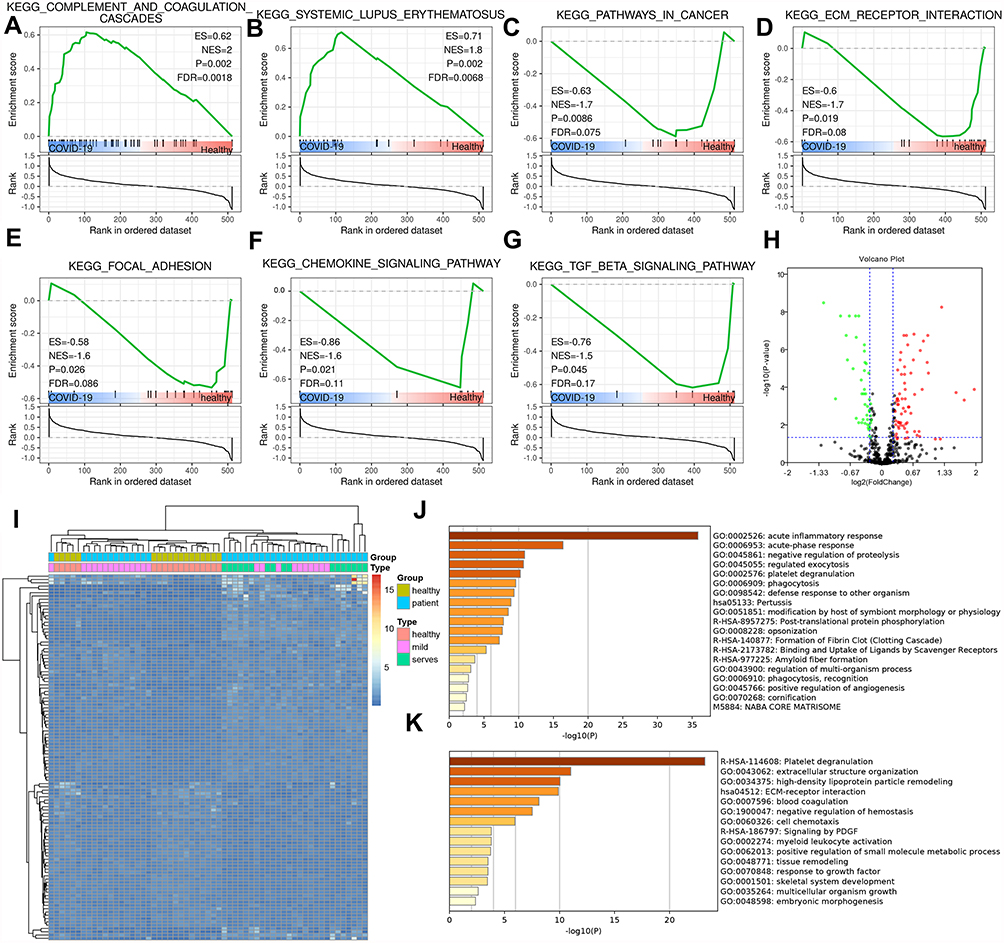 |
Figure 1 Gene set enrichment analysis and differential analysis. (A–G) Significantly enriched KEGG signaling pathway between COVID-19 patients and healthy people. (H) Serum proteome difference analysis volcano plot, the red dots indicate up-regulated, and the green dots indicate down-regulated (|log2FC| > 0.25 and FDR < 0.05). (I) Heatmap, differentially expressed genes in COVID-19. (J) Functional enrichment analysis of 67 up-regulated proteins. (K) Functional enrichment analysis of 44 down-regulated proteins. |
Differentially Expressed Proteins (DEPs)
Analysis of the differential expression of serum proteins in COVID-19 patients showed that 67 proteins were up-regulated and 44 proteins were down-regulated (Figure 1H and I). Enrichment analysis showed that the top three significantly enriched terms in up-regulated proteins were “acute inflammatory response”, “acute-phase response” and “negative regulation of proteolysis” (Figure 1J). While in down-regulated proteins were “platelet degranulation”, “extracellular structure organization” and “high-density lipoprotein particle remodeling” (Figure 1K). These were consistent with the known excessive inflammatory response and coagulation dysfunction in patients with COVID-19.
WGCNA: Screening of Significant Proteins
WGCNA was used to put the proteins with similar expression patterns into modules and analyzed the correlation between each module and disease severity, gender, age and BMI. It was found that turquoise module was significantly positively correlated with disease severity (r = 0.87, p = 2e-18) and had the highest connectivity (r = 0.94, p =1.8e-115) (Figure 2A–D). The turquoise module contains 245 proteins, of which 116 proteins with p < 0.05 were considered as significant proteins. The enrichment analysis showed that the top three biological functions of significant enrichment were “acute inflammatory response”, “platelet degranulation”, and “regulation of insulin-like growth factor (IGF) transport and uptake by insulin-like growth factor Bi” (Figure 2E). These results further confirmed the important role of acute inflammation and platelet degranulation in the pathogenesis of COVID-19.
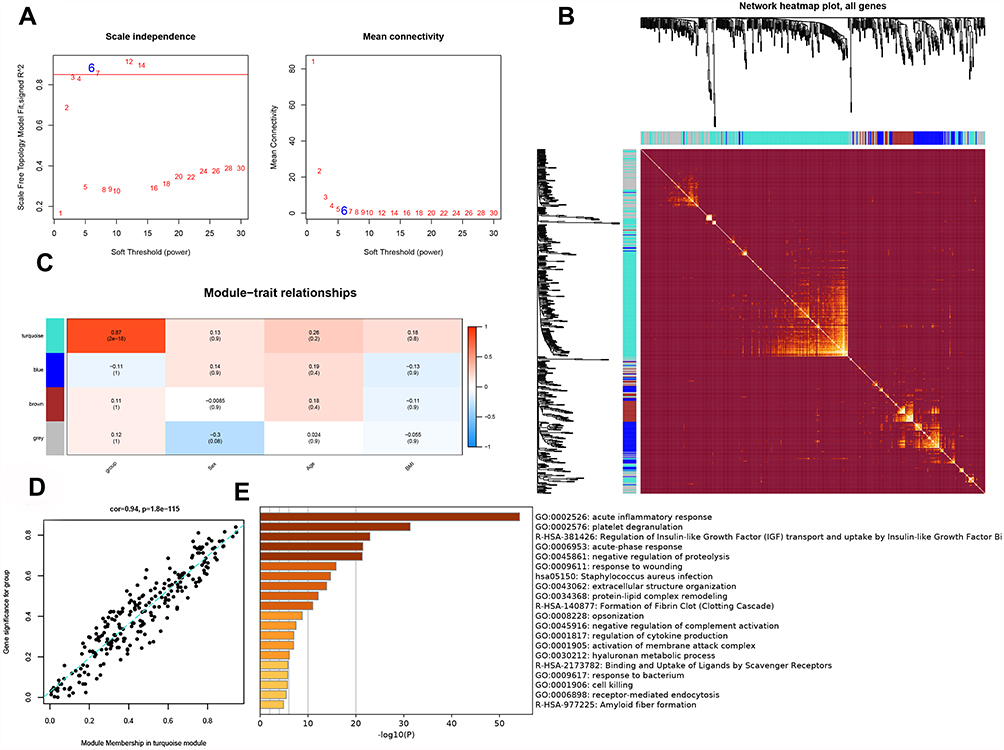 |
Figure 2 Weighted gene co-expression network analysis. (A) The result of Soft threshold (power = 6). (B) Dendrogram of clustered based on a dissimilarity measure (1-TOM). (C) Correlation heatmap between module eigengenes and clinical traits, the color indicates the correlation. (D) The correlation between gene and group (severity of disease) in turquoise module (cor = 0.94, p = 1.8e-115). (E) Functional enrichment analysis of 116 important proteins in turquoise module. |
PPI Networks: Identify the Most Important Protein
A total of 73 proteins with 111 DEPs and 116 significant proteins intersections were used for subsequent analysis (Figure 3A). The protein interaction network was constructed through the “String” website and introduced into “Cytoscape” for visualization. “CytoHubba” plug-in was used to screen the key genes in the PPI network. It was found that APOA1 have the most significant among various algorithms. Figure 3B showed the top 5 notable proteins in degree, betweenness, closeness, EcCentricity and maximal clique centrality (MCC). Through the “MCODE” plug-in, we obtained 3 modules. APOA1 was present in MCODE1, which contains 22 proteins, and enrichment analysis showed that it was significantly related to “platelet degranulation” and “acute phase response” (Figure 3C and D). We further compared the expression of APOA1 protein between different groups, and found that the expression level of severe group was the lowest (kruskal-test p = 2.5e-05, Figure 3E). Moreover, the APOA1 protein level of men was lower than that of women (Wilcox-test p = 0.012, Figure 3F), and the expression of APOA1 was negatively correlated with CRP (r = −0.37, p = 0.019, Figure 3G).
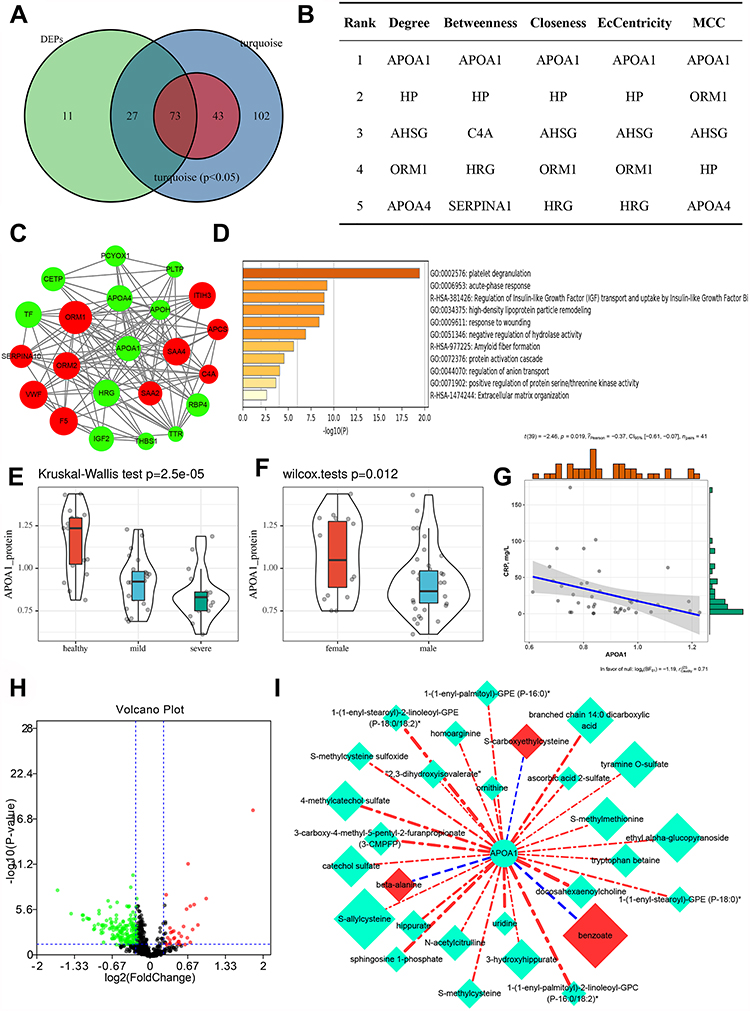 |
Figure 3 Identify the most important protein and serum metabolome analysis. (A) The intersection of differentially expressed proteins (DEPs) and significant genes in the turquoise module (p < 0.05). (B) The top 5 notable proteins in degree, betweenness, closeness, EcCentricity and maximal clique centrality (MCC). (C) The MCODE1 identified from the PPI network using the “MCODE” plug-in. Green means down regulation, red means up regulation, and the size of the node represents the |log2FC| value. (D) Functional enrichment analysis of 22 DEPs in MCODE1. (E) The difference of APOA1 protein expression between different groups. (F) The expression difference of APOA1 protein level in gender. (G) Scatter plot of correlation between CRP (mg/L) level and APOA1 protein level (r = −0.37, p = 0.019). (H) Serum metabolome difference analysis volcano plot, the red dots indicate up-regulated, and the green dots indicate down-regulated (|log2FC| > 0.25 and FDR < 0.05). (I) 28 differential metabolites significantly related to APOA1 protein (|r|> 0.2, p <0.05). The color of light green means down-regulated, red means up-regulated; the size of the dot means |log2FC| value, the larger the point, the larger |log2FC| value; the color of the edge means the correlation, blue means the negative correlation, red indicates a positive correlation; the thickness of the edge is positively related to |r|. |
Serum Metabolome Analysis
In order to further understand the changes of related metabolites, a difference analysis was carried out on the metabolome data. 224 metabolites were differentially expressed (DEMs, |log2FC| > 0.25, FDR < 0.05), of which 32 were up-regulated and 192 were down-regulated (Figure 3H). Subsequently, we analyzed the correlation between the DEMs and APOA1. 25 DEMs were significantly positively correlated with APOA1, and 3 were significantly negatively correlated (|r| > 0.2, p < 0.05, Figure 3I). Among them, the top three with the highest correlation are docosahexaenoylcholine, 1-(1-alkenyl-palmitoyl)-2-linoleoyl-GPC (P-16:0/18:2) and 1-(1-alkenyl-stearoyl)-2-linoleoyl-GPE (P-18:0/18:2). These metabolites were closely related to cholesterol metabolism.
Urine Proteomic Verification
In the urine proteomic data of COVID-19 patients, APOA1 was down-regulated as well (Wilcox-test p = 0.00058), which further confirms the analysis results of plasma proteomics (Figure 4A).
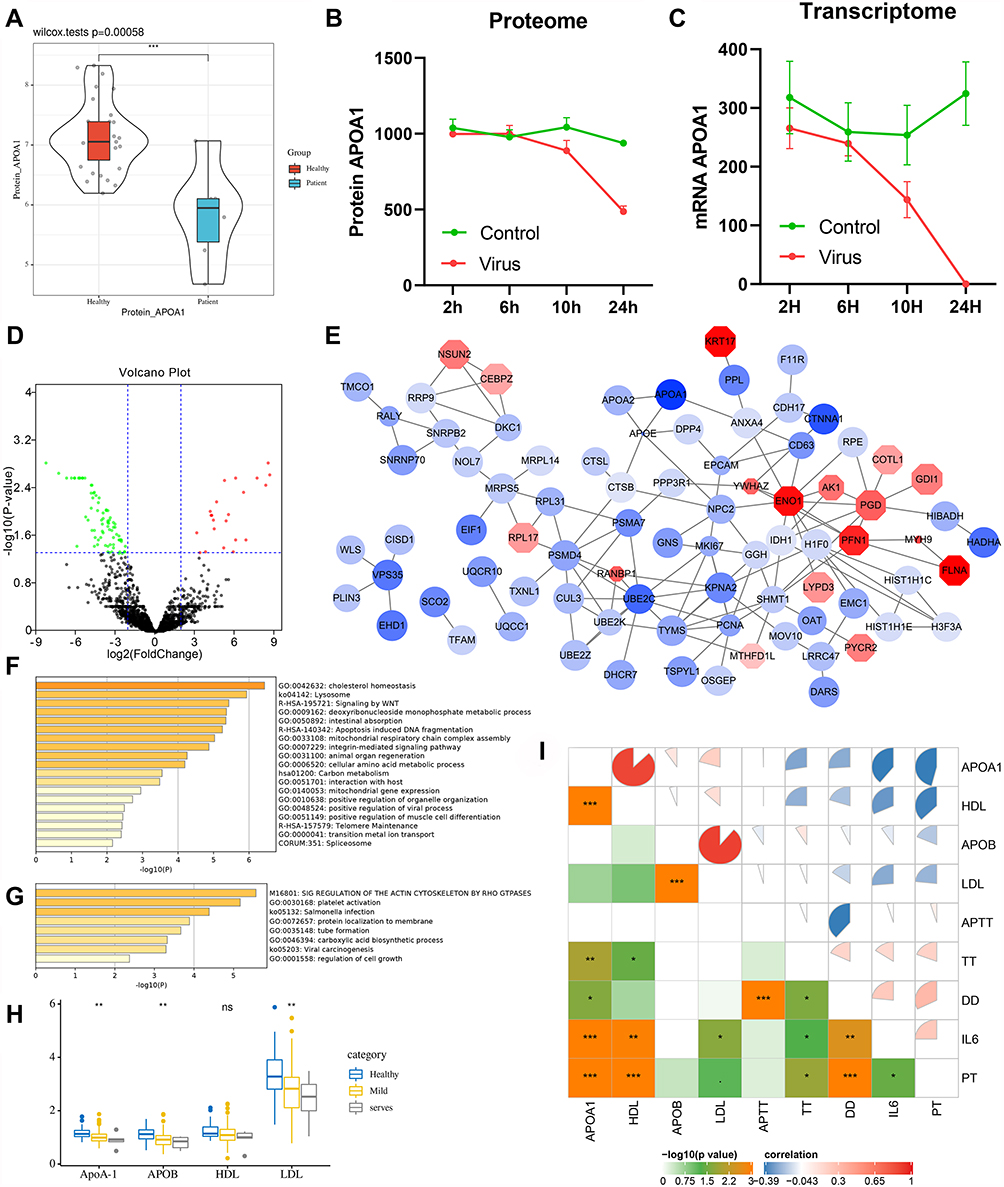 |
Figure 4 SARS-CoV-2 infection cell experiment and clinical data verification. (A) The expression level of APOA1 in urine proteome (transformed by log10). (B) Changes of APOA1 protein level in SARS-CoV-2 infection cell experiment with infection time. (C) Changes of APOA1 transcription level in SARS-CoV-2 infection cell experiment with infection time. (D) Transcriptome difference analysis volcano plot, red dots indicate up-regulated, green dots indicate down-regulated (|log2FC| > 2, FDR < 0.05). (E) 99 DEGs significantly related to APOA1 protein expression. The color of the dot represents the value of log2FC, blue means down regulation, and red means up regulation. Point size is negatively correlated with APOA1 correlation p-value. (F) Functional enrichment analysis of 77 genes positively correlated with APOA1 protein expression. (G) Functional enrichment analysis of 22 genes negatively related to APOA1 protein expression. (H) The expression levels of APOA1, APOB, HDL and LDL in different groups in clinical data. (I) Correlation analysis of patient examination indexes in clinical data (|r| > 0.2, p < 0.05). The heatmap in the bottomleft represents -log10 (p-value), the pie chart in the topright represents the correlation coefficient, red represents positive correlation, blue represents negative correlation, and size represents |r|. *p<0.05, **p<0.01, ***p<0.001. |
Experimental Verification of SARS-CoV-2 Infected Cells
The analysis of the proteome and transcriptome data of the SARS-CoV-2 infection cell experiment found that with the increase of infection time, the protein and transcription levels of APOA1 decreased significantly (Figure 4B and C). In order to further understand the relevant transcriptional regulation mechanism, the differential expression analysis was carried out on the transcription data of transfection 24h, and 99 genes were differentially expressed (DEGs, |log2FC| >2, FDR < 0.05, Figure 4D). Next, the correlation between DEGs and APOA1 protein expression was analyzed (|r| > 0.5, p < 0.05). It was found that these DEGs were significantly correlated with APOA1 protein expression, of which 77 down-regulated genes were significantly positively correlated, and 22 up-regulated genes were significantly negatively correlated (Figure 4E). Enrichment analysis showed that “cholesterol homeostasis”, “lysosome” and “signaling by WNT” were significantly enriched in 77 genes positively correlated with APOA1 protein expression (Figure 4F). Meanwhile, “sig regulation of the actin cytosketon by rho gtpases”, “platelet activation” and “salmonella infection” were significantly enriched in 22 negatively related genes (Figure 4G).
Clinical Data Validation
In order to clinically verify the analysis results, blood test data were collected from inpatients confirmed with COVID-19 in Zhongnan Hospital (Supplementary Data). It was found that APOA1, APOB and LDL were all down-regulated in patients, and the down-regulation was more significant in severe patients (Figure 4H). The correlation analysis of examination indexes of patients showed that APOA1 was positively correlated with HDL (r = 0.876, p = 7.45e-52) and LDL (r = 0.207, p = 0.0085), and negatively correlated with IL6 (r = −0.396, p = 2.22e-07), DD (R = −0.262, p = 8.19e-04), PT (r = −0.464, p = 6.68e-10) and TT (r = −0.279, p = 3.46e-04) (Figure 4I). As we all known excessive inflammation, coagulation dysfunction, and elevated IL6 and D-dimers were the most common pathological features in patients with COVID-19. This means that APOA1 was closely related to the pathogenesis of COVID-19 and was likely to be a potential therapeutic target.
Discussion
At present, COVID-19 has caused millions of deaths. Although there are a large number of clinical trials in progress, there is still a lack of effective treatment methods.23 What is exciting is that many breakthrough results have been achieved in the research of COVID-19,24,25 but it is undeniable that we have not fully grasped the pathogenic mechanism of this new virus.2,26 In this study, we comprehensively analyzed the changes in the serum proteome and metabolome of COVID-19 to explore the underlying pathogenesis and therapeutic targets. Moreover, we also used SARS-CoV-2 infected cell experimental data and COVID-19 patient’s clinical examination data for experimental and clinical verification. It was found that the APOA1 protein level and transcription level of patients were down-regulated, and the transcription level was down-regulated more significantly. What’s more, the more severe the disease, the lower the expression level of APOA1.
We used bioinformatics to analyze the serum proteome and metabolome data of COVID-19 patients from Shen et al. GSEA analysis shown that the two KEGG signaling pathways, “complement and coagulation cascade” and “systemic lupus erythematosus”, were significantly enriched in COVID-19 patients. The enrichment analysis of DEPs showed that the up-regulated proteins were mainly related to “acute inflammatory response”, and the down-regulated proteins were mainly related to “platelet degranulation”. In addition, the subsequent gene enrichment results were highly consistent with these. According to reports, invasive inflammation caused by virus replication was the main pathogenic mechanism of SARS-CoV infection.27 In COVID-19, patients’ inflammatory markers also increased significantly,28 and even cytokine storm appeared.29 Moreover, COVID-19 patients have also been reported to be at high risk of thrombotic complications, especially in critically ill patients.4,30 These indicated that acute inflammation and venous thromboembolism were both important pathogenic mechanisms of SRSA-Cov-2, which are consistent with our analysis results.
Further analysis showed that APOA1 was not only differentially expressed in COVID-19 patients, but also negatively related to the severity of the disease, which was a critical protein in COVID-19. The serum protein data of Shen et al11 shown that APOA1 was down-regulated in COVID-19 patients, and down-regulated more significantly in critically ill patients and men, and its expression level was negatively correlated with CRP. Analysis of APOA1 related metabolites found that these metabolites were closely related to cholesterol metabolism. Furthermore, the clinical data we collected further showed that APOA1 was down-regulated more significantly in severe patients, and its expression level was positively correlated with HDL and LDL, and negatively correlated with IL6, DD, PT, and TT. CRP reflected the patient’s acute inflammatory response, and IL6 was a key factor in the cytokine storm caused by excessive inflammation. IL6 and CRP were important indicators to assess the severity of patients and predict the outcome.31 DD, PT, and TT reflected the coagulation and fibrinolysis status. Abnormal coagulation was also a common complication of COVID-19 patients, and it was positively related to the risk of death.32 The most common coagulation abnormalities in COVID-19 patients were elevated DD and PT.33 Low levels of HDL and LDL have been reported to increase the risk of COVID-19 developing into a serious event.34–36 Studies have suggested that targeting lipid rafts could be a potential therapy for COVID-19.37 Excitingly, our analysis results were completely consistent with the reported articles, which further confirmed the correctness of our analysis results. APOA1 was closely related to acute inflammation, cytokine storm, coagulation abnormalities and cholesterol metabolism. It concatenated non-specific symptoms of COVID-19 and was likely to be a key molecule in unraveling the pathogenesis of COVID-19.
APOA1 is a major protein component of HDL, which promotes the extranodation of cholesterol from tissues to the liver, and is involved in inflammatory response and immune regulation.38 APOA1 can regulate platelet activity and was used in the treatment of atherosclerosis.39,40 Moreover, it has been found that APOA1 has antiviral activity41 which not only shows host defense function in Yersinia enterocolitis,42 but also targets lysosomal membrane to promote the dissolution of trypanosomes.43 However, the inhibitory effect of APOA1 on SARS-CoV-2 has not been realized.
In summary, using bioinformatics analysis and combined with sarS-COV-2 infected cell experiments and clinical data, we found that the expression level of APOA was negatively correlated with the severity of COVID-19 patients, and significantly correlated with acute inflammation, coagulation abnormalities, and cholesterol metabolism disorder caused by SARS-COV-2 infection. APOA1 is likely to be a key molecule in decoding the pathogenesis of SARS-COV-2 and a potential target for the treatment of COVID-19. In the current study, the potential link between APOA1 and COVID-19 pathogenesis was clearly proposed for the first time. However, the research is limited to sample size for data analysis and theoretical verification, and further study was needed. The research can provide new biomarker and target for diagnosis and treatment of severe COVID-19.
Abbreviations
COVID-19, coronavirus disease 2019; SARS-CoV-2, severe acute respiratory syndrome coronavirus-2; APOA1, apolipoprotein A1; WGCNA, weighted gene co-expression network analysis; FDR, false discovery rate; GSEA, gene set enrichment analysis; PPI, protein-protein interaction networks; R, correlation coefficient; DEPs, differentially expressed proteins; DEMs, differentially expressed metabolites; DEGs, differentially expressed genes; CRP, C-reactive protein; DD, D-dimers; PT, prothrombin time; TT, thrombin time; HDL, high density lipoprotein; LDL, low density lipoprotein.
Data Sharing Statement
All data used are contained within the article.
Acknowledgments
This work was supported by grant from National Natural Science Foundation of China (81272372) and by Zhongnan Hospital of Wuhan University Science, Technology and Innovation Seed Fund (znpy2016033). The Project-sponsored by SRF for ROCS, SEM.
Disclosure
All authors declare no conflicts of interest in relation to this work.
References
1. Wang C, Horby PW, Hayden FG, Gao GF. A novel coronavirus outbreak of global health concern. Lancet (London, England). 2020;395(10223):470–473. doi:10.1016/S0140-6736(20)30185-9
2. Mahase E. Covid-19: WHO declares pandemic because of “alarming levels” of spread, severity, and inaction. BMJ (Clinical Research Ed). 2020;368:m1036. doi:10.1136/bmj.m1036
3. Gong J, Dong H, Xia SQ, et al. Correlation analysis between disease severity and inflammation-related parameters in patients with COVID-19 pneumonia. MedRxiv. 2020. doi:10.1101/2020.02.25.20025643
4. Middeldorp S, Coppens M, van Haaps TF, et al. Incidence of venous thromboembolism in hospitalized patients with COVID-19. JTH. 2020;18(8):1995–2002. doi:10.1111/jth.14888
5. Akhmerov A, Marbán E. COVID-19 and the Heart. Circ Res. 2020;126(10):1443–1455. doi:10.1161/CIRCRESAHA.120.317055
6. Soares MP, Teixeira L, Moita LF. Disease tolerance and immunity in host protection against infection. Nat Rev Immunol. 2017;17(2):83–96. doi:10.1038/nri.2016.136
7. Libby P, Loscalzo J, Ridker PM, et al. Inflammation, immunity, and infection in atherothrombosis: JACC review topic of the week. J Am Coll Cardiol. 2018;72(17):2071–2081. doi:10.1016/j.jacc.2018.08.1043
8. Goeijenbier M, van Sloten TT, Slobbe L, et al. Benefits of flu vaccination for persons with diabetes mellitus: a review. Vaccine. 2017;35(38):5095–5101. doi:10.1016/j.vaccine.2017.07.095
9. Dubin RF, Rhee EP. Proteomics and metabolomics in kidney disease, including insights into etiology, treatment, and prevention. CJASN. 2020;15(3):404–411. doi:10.2215/CJN.07420619
10. Rinschen MM, Ivanisevic J, Giera M, Siuzdak G. Identification of bioactive metabolites using activity metabolomics. Nat Rev Mol Cell Biol. 2019;20(6):353–367. doi:10.1038/s41580-019-0108-4
11. Shen B, Yi X, Sun Y, et al. Proteomic and metabolomic characterization of COVID-19 patient sera. Cell. 2020;182(1):59–72.e15. doi:10.1016/j.cell.2020.05.032
12. Li Y, Wang Y, Liu H, et al. Urine proteome of COVID-19 patients. URINE. 2020;2:1–8. doi:10.1016/j.urine.2021.02.001
13. Bojkova D, Klann K, Koch B, et al. Proteomics of SARS-CoV-2-infected host cells reveals therapy targets. Nature. 2020;583(7816):469–472. doi:10.1038/s41586-020-2332-7
14. Chong J, Wishart DS, Xia J. Using metaboAnalyst 4.0 for comprehensive and integrative metabolomics data analysis. Curr Protocols Bioinform. 2019;68(1):e86. doi:10.1002/cpbi.86
15. Subramanian A, Tamayo P, Mootha VK, et al. Gene set enrichment analysis: a knowledge-based approach for interpreting genome-wide expression profiles. Proc Natl Acad Sci U S A. 2005;102(43):15545–15550. doi:10.1073/pnas.0506580102
16. Ritchie ME, Phipson B, Wu D, et al. limma powers differential expression analyses for RNA-sequencing and microarray studies. Nucleic Acids Res. 2015;43(7):e47. doi:10.1093/nar/gkv007
17. Zhou Y, Zhou B, Pache L, et al. Metascape provides a biologist-oriented resource for the analysis of systems-level datasets. Nat Commun. 2019;10(1):1523. doi:10.1038/s41467-019-09234-6
18. Langfelder P, Horvath S. WGCNA: an R package for weighted correlation network analysis. BMC Bioinform. 2008;9:559. doi:10.1186/1471-2105-9-559
19. Szklarczyk D, Gable AL, Lyon D, et al. STRING v11: protein-protein association networks with increased coverage, supporting functional discovery in genome-wide experimental datasets. Nucleic Acids Res. 2019;47(D1):D607–D613. doi:10.1093/nar/gky1131
20. Shannon P, Markiel A, Ozier O, et al. Cytoscape: a software environment for integrated models of biomolecular interaction networks. Genome Res. 2003;13(11):2498–2504. doi:10.1101/gr.1239303
21. Chin CH, Chen SH, Wu HH, Ho CW, Ko MT, Lin CY. cytoHubba: identifying hub objects and sub-networks from complex interactome. BMC Syst Biol. 2014;8(Suppl 4):S11. doi:10.1186/1752-0509-8-S4-S11
22. Bader GD, Hogue CW. An automated method for finding molecular complexes in large protein interaction networks. BMC Bioinform. 2003;4:2. doi:10.1186/1471-2105-4-2
23. Shanmugaraj B, Malla A, Phoolcharoen W. Emergence of Novel Coronavirus 2019-nCoV: need for rapid vaccine and biologics development. Pathogens (Basel, Switzerland). 2020;9(2). doi:10.3390/pathogens9020148
24. Al-Tawfiq JA, Al-Homoud AH, Memish ZA. Remdesivir as a possible therapeutic option for the COVID-19. Travel Med Infect Dis. 2020;34:101615. doi:10.1016/j.tmaid.2020.101615
25. Gao J, Tian Z, Yang X. Breakthrough: chloroquine phosphate has shown apparent efficacy in treatment of COVID-19 associated pneumonia in clinical studies. Biosci Trends. 2020;14(1):72–73. doi:10.5582/bst.2020.01047
26. Pang J, Wang MX, Ang IYH, et al. Potential rapid diagnostics, vaccine and therapeutics for 2019 Novel Coronavirus (2019-nCoV): a systematic review. J Clin Med. 2020;9(3):623. doi:10.3390/jcm9030623
27. Wong CK, Lam CW, Wu AK, et al. Plasma inflammatory cytokines and chemokines in severe acute respiratory syndrome. Clin Exp Immunol. 2004;136(1):95–103. doi:10.1111/j.1365-2249.2004.02415.x
28. Huang C, Wang Y, Li X, et al. Clinical features of patients infected with 2019 novel coronavirus in Wuhan, China. Lancet (London, England). 2020;395(10223):497–506. doi:10.1016/S0140-6736(20)30183-5
29. Hu B, Huang S, Yin L. The cytokine storm and COVID-19. J Med Virol. 2020;93:250–256.
30. Klok FA, Kruip M, van der Meer NJM, et al. Confirmation of the high cumulative incidence of thrombotic complications in critically ill ICU patients with COVID-19: an updated analysis. Thromb Res. 2020;191:148–150. doi:10.1016/j.thromres.2020.04.041
31. Liu F, Li L, Xu M, et al. Prognostic value of interleukin-6, C-reactive protein, and procalcitonin in patients with COVID-19. J Clin Virol. 2020;127:104370. doi:10.1016/j.jcv.2020.104370
32. Levi M, Thachil J, Iba T, Levy JH. Coagulation abnormalities and thrombosis in patients with COVID-19. Lancet Haematol. 2020;7(6):e438–e440. doi:10.1016/S2352-3026(20)30145-9
33. Thachil J, Tang N, Gando S, et al. ISTH interim guidance on recognition and management of coagulopathy in COVID-19. JTH. 2020;18(5):1023–1026. doi:10.1111/jth.14810
34. Choi GJ, Kim HM, Kang H. The potential role of dyslipidemia in COVID-19 severity: an umbrella review of systematic reviews. J Lipid Atheroscleros. 2020;9(3):435–448. doi:10.12997/jla.2020.9.3.435
35. Wei X, Zeng W, Su J, et al. Hypolipidemia is associated with the severity of COVID-19. J Clin Lipidol. 2020;14(3):297–304. doi:10.1016/j.jacl.2020.04.008
36. Hu X, Chen D, Wu L, He G, Ye W. Declined serum high density lipoprotein cholesterol is associated with the severity of COVID-19 infection. Clin Chim Acta. 2020;510:105–110. doi:10.1016/j.cca.2020.07.015
37. Sviridov D, Miller YI, Ballout RA, Remaley AT, Bukrinsky M. Targeting lipid rafts-a potential therapy for COVID-19. Front Immunol. 2020;11:574508. doi:10.3389/fimmu.2020.574508
38. Georgila K, Vyrla D, Drakos E. Apolipoprotein A-I (ApoA-I), immunity, inflammation and cancer. Cancers. 2019;11(8):1097. doi:10.3390/cancers11081097
39. Gurbel PA, Tantry US, D’Andrea D, et al. Evaluation of potential antiplatelet effects of CSL112 (Apolipoprotein A-I [Human]) in patients with atherosclerosis: results from a phase 2a study. J Thromb Thrombolysis. 2018;45(4):469–476. doi:10.1007/s11239-018-1644-z
40. Rosenson RS, Brewer HB, Rader DJ. Lipoproteins as biomarkers and therapeutic targets in the setting of acute coronary syndrome. Circ Res. 2014;114(12):1880–1889. doi:10.1161/CIRCRESAHA.114.302805
41. Catapano AL, Pirillo A, Bonacina F, Norata GD. HDL in innate and adaptive immunity. Cardiovasc Res. 2014;103(3):372–383. doi:10.1093/cvr/cvu150
42. Biedzka-Sarek M, Metso J, Kateifides A, et al. Apolipoprotein A-I exerts bactericidal activity against Yersinia enterocolitica serotype O:3. J Biol Chem. 2011;286(44):38211–38219. doi:10.1074/jbc.M111.249482
43. Pérez-Morga D, Vanhollebeke B, Paturiaux-Hanocq F, et al. Apolipoprotein L-I promotes trypanosome lysis by forming pores in lysosomal membranes. Science (New York, NY). 2005;309(5733):469–472. doi:10.1126/science.1114566
 © 2022 The Author(s). This work is published and licensed by Dove Medical Press Limited. The full terms of this license are available at https://www.dovepress.com/terms.php and incorporate the Creative Commons Attribution - Non Commercial (unported, v3.0) License.
By accessing the work you hereby accept the Terms. Non-commercial uses of the work are permitted without any further permission from Dove Medical Press Limited, provided the work is properly attributed. For permission for commercial use of this work, please see paragraphs 4.2 and 5 of our Terms.
© 2022 The Author(s). This work is published and licensed by Dove Medical Press Limited. The full terms of this license are available at https://www.dovepress.com/terms.php and incorporate the Creative Commons Attribution - Non Commercial (unported, v3.0) License.
By accessing the work you hereby accept the Terms. Non-commercial uses of the work are permitted without any further permission from Dove Medical Press Limited, provided the work is properly attributed. For permission for commercial use of this work, please see paragraphs 4.2 and 5 of our Terms.