
Back to Journals » Cancer Management and Research » Volume 18

Anticancer Activity and Cell Mechanism of a Novel Flavonoid Derivative from Chrysanthemum × morifolium (Ramat). Hemsl Leaves Against the MCF-7 Breast Cancer Line in vitro
Authors Maesaroh I, Muhaimin M  , Abdulah R, Barliana MI
Received 18 April 2026
Accepted for publication 3 July 2026
Published 16 July 2026 Volume 2026:18 618125
DOI https://doi.org/10.2147/CMAR.S618125
Checked for plagiarism Yes
Review by Single anonymous peer review
Peer reviewer comments 3
Editor who approved publication: Professor Seema Singh
Imas Maesaroh,1,2 Muhaimin Muhaimin,3,4 Rizky Abdulah,5,6 Melisa Intan Barliana3,4
1Doctoral Program of Pharmacy, Faculty of Pharmacy, Universitas Padjadjaran, Sumedang, 45363, Indonesia; 2Department of Biological Pharmacy, Faculty of Pharmacy, Health and Science, Universitas Muhammadiyah Kuningan, Kuningan, 45552, Indonesia; 3Department of Biological Pharmacy, Faculty of Pharmacy, Universitas Padjadjaran, Jatinangor, 45363, Indonesia; 4Center for Herbal Studies, Universitas Padjadjaran, Jatinangor, 45363, Indonesia; 5Center of Excellence in Pharmaceutical Care Innovation, Universitas Padjadjaran, Jatinangor, 45363, Indonesia; 6Department of Pharmacology and Clinical Pharmacy, Faculty of Pharmacy, Universitas Padjadjaran, Jatinangor, 45363, Indonesia
Correspondence: Muhaimin Muhaimin, Department of Biological Pharmacy, Faculty of Pharmacy, Universitas Padjadjaran, Sumedang, 45363, Indonesia, Tel +6281394014688, Email [email protected]
Background: Breast cancer has the highest number of cases and deaths in women. Cell cycle dysregulation and decreased cell apoptosis are among the causes of cancer cell growth. An ideal anticancer drug has selective toxicity, meaning it can kill cancer cells without damaging normal tissue cells. Several cultivars of Chrysanthemum morifolium leaves (CML) contain the main active compounds, such as flavonoids, as active ingredients of drugs that have potential as anticancer agents.
Purpose: The main objective of this study was to investigate the potential anticancer effects of a compound extracted from CML.
Methods: Chromatographic isolation of compounds using different separation techniques, including extraction, separation, and purification; characterization using ultraviolet (UV), infrared (IR), nuclear magnetic resonance (NMR), and mass spectroscopy; and evaluation of anticancer activity in vitro (WST-8 assay), cell mechanism: cell cycle inhibition, and apoptosis activity (flow cytometry), and analysis of the ESR1 gene expression (RT-qPCR).
Results: Bioactive components found in the ethyl acetate extract of CML were acaetin ( 1), 3,5,5′-Trihydroxy-4′-methoxy flavone ( 2), and kaempferide-7-O-glycoside ( 3). The lowest percentage of cell viability was shown in isolate ( 2) with an IC50 value of 49.37 and 225.045 ppm in MCF-7 and HEK-293 cells. Isolate 2 at a concentration of 1 × IC50 caused a significant increase in the G2/M phase (50.73 ± 4.13%), indicating G2/M arrest. Meanwhile, in the apoptosis assay, the same treatment increased early apoptosis of up to 38.87 ± 11.43%. Isolate 2 CML showed increased ESR1 gene expression at a dose of 1 × IC50 of 1.34 ± 0.13 and at a dose of ½ × IC50 of 1.01 ± 0.14.
Conclusion: Isolate 2 CML showed selective potential as an anticancer agent through G2/M cell cycle inhibition, early apoptosis, and suppression of ESR1 gene expression.
Keywords: Chrysanthemum morifolium, cytotoxicity, MCF-7 cells, in vitro, cell mechanism
Introduction
Cancer is a non-communicable disease that poses a global health burden. According to the World Health Organization (WHO), cancer is one of the main causes of mortality globally. According to data from the World Health Organization’s Global Burden of Cancer (GLOBOCAN), there were 20 million cancer cases and 9.7 million cancer-related deaths in 2022. Cancer deaths are expected to continue to increase to 35 million cases by 2030. After heart disease and stroke, cancer is the third most common cause of death in Indonesia. In 2022, the Global Cancer Observatory (GLOBOCAN) reported 242,988 cancer-related deaths and 408,661 new cases. The highest number of cases was breast cancer in women and lung cancer in men, with the highest number of deaths caused by breast, cervical, and lung cancer.1 Hormonal factors, genetics, oxidative stress, advanced age, and unhealthy lifestyles influence the high incidence of breast cancer.2
Breast cancer is thought to be caused by excessive exposure to endogenous estrogen during a woman’s life. Estrogen is a steroid hormone that contributes to female sexual characteristics, affects various specialized organs and tissues, and regulates cell proliferation and differentiation in both women and men. Estrogen stimulates the establishment of an extensive ductal system, the development of breast stromal tissue, and the accumulation of breast fat.3 Estrogen receptors (ER) and androgen receptors are often co-expressed in breast cancer.4,5
Research to identify potential new anticancer drug candidates is essential to address these issues. Developing drugs from natural sources is expected to offer a solution in selecting therapies for breast cancer patients with a high selectivity index. One plant with potential as an anticancer agent for breast cancer cells is Chrysanthemum morifolium. Chrysanthemum morifolium has been reported to have produced 60 isolates of flavonoid compounds, most of which are glycoside derivatives of luteolin, apigenin, acacetin, diosmetin, or eriodictyol at the C7 position. Detection of active compounds, especially with high flavonoid levels in Chrysanthemum, provides its pharmacological effects.6 Flavonoids and phenolic acids are the main components of secondary metabolites that are essential for providing therapeutic activity in Chrysanthemum species.7,8 Several leaf cultivars of Chrysanthemum morifolium contain main active compounds such as flavonoids, galuteolin, quercitrin, chlorogenic acid, and 3,5-O-caffeoylquinic acid as active ingredients with potential as anticancer agents.9
The anticancer activity of Chrysanthemum morifolium and Chrysanthemum indicum extracts has been reported in several in vitro and in vivo studies. Flavonoids such as luteolin, apigenin, and acacetin showed strong cytotoxicity, with IC50 values ranging from 1.08–25 µg/mL against breast (MCF-7), lung (A549), and liver (HepG2) cancer cells. These compounds modulate key molecular pathways, including NF-κB, PI3K/AKT/mTOR, STAT3, and MAPK/ERK1/2, leading to apoptosis through mitochondrial dysfunction, activation of caspase-3 and −9, as well as altered BAX/BCL-2 ratios.10
In the study of the metabolite profiling test on the ethyl acetate fraction of Chrysanthemum morifolium leaves using UHPLC-HRMS11 was reported that Chrysanthemum morifolium has the most dominant compounds, namely flavonoid compounds that can act as breast cancer anticancer, such as glycitein,12–16 diosmetin,17–21 kaempferol,22–28 esculetin,29–33 scopoletin,34,35 dihydroartemisinin,36–40 and chrysin.41–47
Flavonoids have significant impacts on chemotherapy and cancer prevention. Numerous genes and enzymes, including those involved in antiproliferation, cell cycle arrest, apoptosis, angiogenesis, and multidrug resistance, have been demonstrated to interact with flavonoids.48 Flavonoid compounds play a role in inhibiting cell proliferation and regulating tumor suppressor genes that play an important role in the cell cycle and p53 in cancer cells and can increase cell apoptosis in breast cancer.49 One type of phytoestrogen that functions as a selective estrogen modulator (SERM) is flavonoids. Because flavonoids require a phenolic ring to connect to estrogen receptors, these SERMs can interact with receptors to induce modest oestrogenic or antiestrogenic effects.50–52 After passing through the cell membrane, these SERMs attach to cytosolic estrogen receptors to form a complex. The estrogen response element (ERE), which is close to the gene whose transcription is being regulated, is then bound by this complex. The complex then binds to the corepressor protein NCoR, thereby suppressing transcription of genes that regulate cell proliferation.53,54
Until now, there has been no research that examines the isolation and elucidation of the structure and anticancer bioactivity test of Chrysanthemum morifolium leaves against MCF-7 cells. Therefore, this study was conducted to examine the analysis, compound isolation, cytotoxic activity, and cell mechanisms of Chrysanthemum morifolium leaf isolates in inhibiting MCF-7 cell proliferation through cell cycle modulation, apoptosis induction, and changes in ESR1 gene expression for breast cancer therapy.
The novelty of this study lies in: (1) the isolation and structural elucidation of flavonoid derivatives from Chrysanthemum morifolium leaves, (2) evaluation of their cytotoxicity and selectivity against MCF-7 and HEK-293 cells, and (3) investigation of their effects on gene ESR1 expression, apoptosis, and cell-cycle progression.
Materials and Methods
Materials
Chrysanthemum × morifolium (Ramat). Hemsl. Leaves were collected from a chrysanthemum plantation in the Bandungan area of Semarang, Central Java, Indonesia. The plants were identified and stored in the Biosystematics and Molecular Laboratory, Department of Biology, Faculty of Mathematics and Natural Sciences, Padjadjaran University (No.190/LBM/IT/V/2023(No.IV.K.78a)) and identified by Mr. Joko Kusmoro. The distilled organic solvents used for extraction, separation, and purification included ethanol, n-hexane, ethyl acetate, acetone, methanol, chloroform, and distilled water, while the chemicals for spectroscopic analysis were pro-analyzed (p.a.) grade. Chromatographic separation was performed on silica gel 60 (230–400 mesh) (Merck), silica gel 60 (30–70 mesh) (Merck), silica gel 60 PF254 (Merck), silica gel 60 F254 thin film plates (Merck) were used for thin‑layer chromatography (TLC) and detection was achieved by spraying with 5% H2SO4 in ethanol (v/v), followed by heating. Breast cancer cell line MCF-7 (ECACC) and normal cell line HEK-293 (ECACC), cisplatin, and Dulbecco’s Modified Eagle Medium (DMEM) growth medium. In addition to the above materials, 0.25% Trypsin-EDTA (Gibco), DMSO (Sigma), PBS (Sigma), high glucose (Sigma), fetal bovine serum (Sigma), penicillin–streptomycin (Sigma), WST-8 [3-(4,5-dimethylthiazol-2-yl)-2,5-diphenyltetrazolium bromide] (Sigma), Annexin V (BioLegend), Propidium Iodine (PI) (BioLegend), Total RNA kit (Geneaid), Rever Tra-Ace (Toyobo), wash buffer, β-mercaptoethanol, DNase, water-free RNase, EGTA, β-actin primer, REα primer, and GoTaq®Green Master Mix (Promega) were also used.
Instruments
The chemical structures of isolated compounds were determined using infrared and ultraviolet (UV) spectra, which were recorded using a Perkin-Elmer Spectrum 100 FTIR spectrometer and a Perkin-Elmer Lambda 35 UV/VIS Double Beam spectrometer. Mass Spectrometry uses Waters LCT Premier XE-MS. NMR spectra were obtained using an Agilent DD2 console system spectrometer at 500 MHz for 1H and 125 MHz for 13C. Chemical shifts were measured in δ (ppm), with a δH signal of 7.26 and a δC signal of 77.16 for the reference solvents acetone and DMSO, respectively. Column chromatography (CTC) was performed using silica gel 60 (Merck, 70–230 and 230–400 mesh) and octadecylsilane (Fuji Silysia Chemical Ltd, Chromatorex® C18 DM1020 M, 100–200 mesh). Thin-layer chromatography (TLC) was performed on pre-coated silica gel 60 F254 plates (Merck) and RP-18 F254 plates (Merck). TLC spots were observed under UV light (254 and 365 nm), and heated after soaking with 10% H2SO4 in ethanol. For the cytotoxicity assay, 96-well microplates, micropipettes, microtubes, incubators, and Biochrom microplate readers were used. FACScan flow cytometer, PCR multibox (Proflex, Applied Biosystems), thermal cycler (ProFlexTM 3x32-well PCR System, Applied Biosystems.
Isolation of Components Chrysanthemum morifolium (Leaves (CML))
Chrysanthemum × morifolium (Ramat). Hemsl leaves (8.9 kg) that had been air-dried were ground up and extracted using 70% ethanol (EtOH) at room temperature (3 × 12 L each, for 24 hours). After the solvent was removed under reduced pressure, the EtOH extract (3 kg) was partitioned between n-hexane and ethyl acetate (EtOAc). The organic layer was evaporated to yield crude n-hexane (187.5 g) and EtOAc extracts (750 g), respectively. Ethyl acetate fraction (2 g) was extracted by silica gel column chromatography and eluted with a gradient of n-hexane–chloroform–ethyl acetate (3:3:4) to obtain an eluate collected in 40 vials. The composition of the column chromatography results was monitored by TLC with n-hexane:chloroform:ethyl acetate (3:3:4) mixture. Spot visualization was monitored under UV light at 254 and 365 nm, both without spraying and with spraying using 10% H2SO4 ethanol and heating, to detect the flavonoid compound group. The results of the column chromatography TLC test are shown in Figure 1. From the TLC results, the column chromatography results that had the same spot pattern were combined to obtain 3 isolates, namely isolate 1 CML (12 mg), isolate 2 CML (10 mg), and isolate 3 CML (20 mg). The purity test for the isolates was carried out by two-way TLC using mobile Phase I n-hexane:chloroform:ethyl acetate (3:3:4) and mobile Phase II n-hexane:ethyl acetate (5:5) with a pre-coated plate stationary phase and a suitable reagent spot visualizer. From the elution results, there was one spot in each mobile phase, which was used to indicate that the isolate was pure. To ensure that an isolate is truly pure (consisting of only one compound), several supporting methods are required, such as chromatography (two-dimensional/two-way TLC), HPLC, and thermal analysis with melting point determination. In this study, only two-way TLC was used to determine compound purity. Melting point determination and HPLC was not performed due to the limited number of isolates obtained.
 |
Figure 1 Elucidation of the structure of isolates 1: (i) UV–Vis spectrum, (ii) IR spectrum, (iii) MS spectrum, (iv) 1H-NMR spectrum analysis, (v) 13C-NMR spectrum analysis. |
Cytotoxicity Assay and Selectivity Index of Compounds 1, 2, and 3 Chrysanthemum morifolium Leaves (CML)
The cytotoxicity of compounds 1–3 CML was evaluated using the Water-Soluble Tetrazolium salt-8 (WST-8) technique against two human cancer cell lines, MCF-7 and HEK-293. These cells were grown at 37°C in DMEM supplemented with 10% fetal bovine serum and antibiotics (100 IU/mL penicillin, 10 µg/mL streptomycin) in 5% CO2. Following a 24-hour incubation period, both were seeded into 96-well plates at an initial density of roughly 3 × 10^4 cells cm-3. Meanwhile, the compounds were dissolved in 2% dimethyl sulfoxide (DMSO) solutions at the required concentrations of 120, 60, 30, 15, and 12.5 ppm. Cisplatin was utilized as a positive control, and the cells were subjected to the test chemicals in triplicate for 48 hours. Following a 24-hour incubation period, 10 μL of WST-8 (Sigma) Cell Viability Reagent was added, and the mixture was then incubated for an additional 1–2 hours until the colour changed. The IC50 value was ascertained by comparing the graph of the percentage of living cells with the control, which was given only phosphate-buffered saline (PBS) and DMSO, at different doses of the tested substance (ppm). The observed absorbance was analysed using a microplate reader at 570 nm.

Cell Cycle Assay
The culture medium from each sample was transferred into a 15 mL centrifuge tube. The cells were subsequently washed twice with cold PBS (1 mL each wash) and then detached using trypsin. After detachment, the cells were collected into a tube and centrifuged. The resulting pellet was washed more with cold PBS and centrifuged again. The supernatant was discarded, and the cell pellet was vortexed. The cells were then resuspended in 300 µL of PBS. Subsequently, 1.2 mL of cold absolute ethanol was added, followed by vortexing, and the samples were stored at −20 °C for at least 1 to 24 hours. After incubation, the samples were centrifuged, the ethanol was removed, and the remaining cell pellet was retained. Finally, PBS was added, and the cells were resuspended and incubated for 15 minutes. The samples were centrifuged, the supernatant was discarded, 100 µL of RNaSe A was added, suspended, and incubated at 37°C. The tubes were lined with aluminum foil, and 400 µL of PI reagent (50 µg/mL) was added and vortexed. Incubated at 2–8°C for 30 minutes. The samples were read on a flow cytometry device within 1 hour. The assay procedure was according to the Cell Cycle kit (Elabscience).
Apoptosis Assay
The cell medium from each test was collected in a 15 mL centrifuge tube, washed twice with cold PBS (1 mL volume), and then released with trypsin. The cells were collected and placed in a tube and then centrifuged. The cells were washed again with cold PBS once and centrifuged. The PBS was discarded, then the cell pellet was vortexed. 1 mL of binding buffer was added; the cells were resuspended with 500 µL of 1× binding buffer. The samples were placed in 1.5 mL tubes lined with aluminum foil. To each tube, 5 μL of Annexin V FITC Conjugate and 5 μL of propidium iodide were added, then vortexed. Next, they were incubated at room temperature for 20 minutes and protected from sunlight. Samples were measured using a flow cytometer every 1 hour. The test procedure was according to the Annexin V-FITC PI Apoptosis Kit (Elabscience).
ESR1 Gene Expression
The preparation was carried out following the working instructions of the SensiFAST™ SYBR® No-ROX Kit. ESR1 expression was examined by taking cDNA, adding up to 20 μL of PCR Master Mix (2x SensiFAST SYBR® No-ROX Mix 10 μL final concentration 1×; 10 nM forward primer 0.8 μL final concentration 400 nM; 10 nM reverse primer 0.8 μL final concentration 400 nM; template up to 8.4 μL; H2O (NFW) as needed). ESR1 and ACTB Gene Sequence Primers are shown in Table 1. The mixed samples were inserted into the real-time PCR device and operated according to the protocol. One cycle of polymerase activation was carried out for 2 minutes at 95°C. Forty cycles of amplification were performed, with each cycle consisting of 5 seconds at 95°C (denaturation), 10 seconds at the annealing temperature according to the optimization results (60°C for β-actin, END 48°C–54°C), 5–20 seconds at 72°C (extension), and a melting curve stage with automatic temperature and time. ACTB is a housekeeping gene used as an internal control to standardize the relative expression levels for all biomarkers.
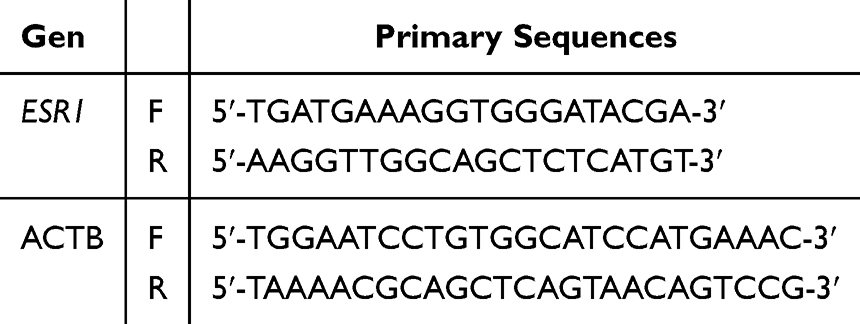 |
Table 1 ESR1 and ACTB Gene Sequence Primers |
Gene Expression Analysis and Data Processing
All CT data were analyzed to determine target gene expression using the Livak method (delta-delta CT) after normalization using a housekeeping gene (beta-actin). Several controls were included in this assay, including a negative reverse transcription, no reverse transcription, and a no-template control. These controls were used to detect the presence of gDNA and possible reagent contamination. The ΔΔCT method was used to normalize particular gene expression in relation to an endogenous control. This process involves comparing the quantification cycle (ΔCT) values of the target gene with those of an endogenous control, a reference gene that exhibits stable expression levels. Beta-actin gene expression served as the selected endogenous control. The ΔΔCT method provides a precise method for quantifying and assessing changes in gene expression levels under different experimental conditions.
The normalized ΔCT values of the treated samples were compared with those of the omitted reference control (ΔCT (ref)) to obtain ΔΔCT values, which were then used to calculate the relative fold change compared to the control. Quantification of estrogen receptor alpha (ERα) by RT-qPCR in MCF-7 cells treated for 24 hours with or without 2 µM E2. Data presented are the mean ± standard deviation (SEM) obtained from a minimum of three different experiments, with each experiment involving three replicates.
Results
Structural Characterization of Compounds 1, 2, and 3 from Chrysanthemum morifolium Leaves (CML)
Based on the interpretation of spectroscopic data, including UV–Vis, IR, MS, 1H-NMR, 13C-NMR, HMBC, and HSQC, as shown in Figure 1 for the structural characterization of compound 1, Figure 2 for the structural characterization of compound 2, and Figure 3 for the structural characterization of compound 3. According to High Resolution Electrospray Ionization Mass Spectrometry (HR-ESI-MS) data of m/z [M+H]+ 285.0566 (calculated for 284.07), Compound 1 CML was isolated as an amorphous powder with the chemical formula C16H12O5, which represents 10 double bond equivalents (DBE). Spectral data of compound 1 CML are as follows: IR: 3398.365 cm−1 contained OH functional groups, 1646.707 cm−1, and 1421.166 cm−1 indicated the presence of C=O (carbonyl) and C=C Sp2 aromatic functional groups, respectively. 1H-NMR: The chemical shift of isolated compound 1 δH 12.9937 ppm indicates the presence of typical chelate protons, and δH 3.9149 ppm indicates the presence of methoxy protons. Typical aromatic Sp2 protons are found in the chemical shift region δH 6.2603 ppm and δH 6.2643 ppm (H-6 and H-8) with a bond constant value of j = 1.60, where H-6 and H-8 indicate meta positions, each in a splitting doublet pattern (d) which shows the characteristics of ring A in the flavonoid framework. Chemical shift area δH 7.1202 ppm and 7.1381 ppm (H-3’ and H-5’) with a bond constant value j=7.14, where H-3’ and H-5’ indicate the ortho position; δH 8.0194 ppm and 8.0372 ppm (H-2’ and H-6’) with a bond constant value j=7.14, where H-3’ and H-5’ indicate the ortho position. Each in a doublet splitting pattern (d), which shows the characteristics of ring B in the flavonoid framework. Then the chemical shift δH 6.6791 ppm (H-3) in ring C of the flavonoid framework. 13C-NMR: Based on the spectrum, it shows a chemical shift for the carbon atoms that comprise the flavonol compound framework, which has 16 carbons. In the chemical shift areas, respectively δC 164.65 ppm (C-2); δC 104.57 ppm (C-3); δC 182.96 ppm (C-4); δC 163.04 ppm (C-5); δC 165.16 ppm (C-7); δC 104.57 ppm (C-10); δC 124.31 ppm (C-1’); δC 158.82 ppm (C-4’) there are two methine carbons (CH) in a singlet (s) splitting pattern. In the chemical shift areas, δC 99.70 ppm (C-6); δC 94.83 ppm (C-8); δC 129.05 ppm (C-2’); δC 115.36 ppm (C-3’); δC 115.36 ppm (C-5’), and δC 129.05 ppm (C-6’) each have two methine carbons (CH) in a doublet splitting pattern (d). Quaternary carbon appears in the chemical shift region of δC 55.96 ppm (C-4’ OCH3). Based on the description above, it can be assumed that the structural framework of the compound obtained is a flavonol compound.
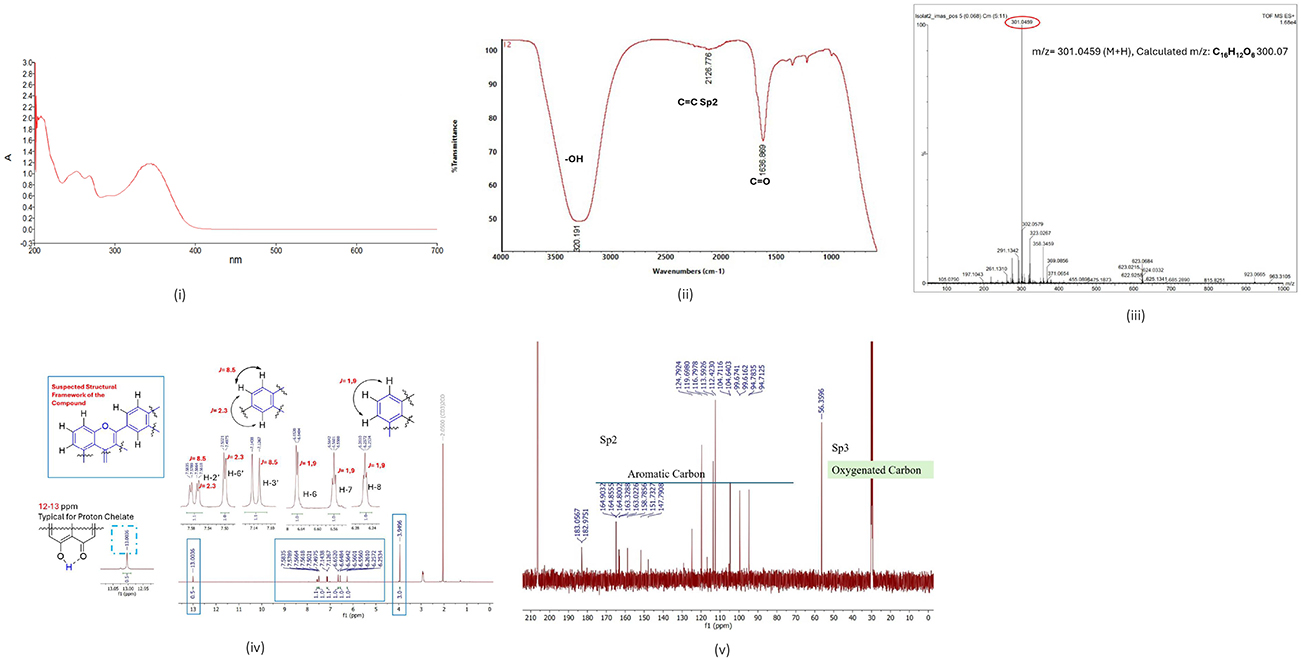 |
Figure 2 Elucidation of the structure of isolates 2: (i) UV–Vis spectrum, (ii) IR spectrum, (iii) MS spectrum, (iv) 1H-NMR spectrum analysis, (v) 13C-NMR spectrum analysis. |
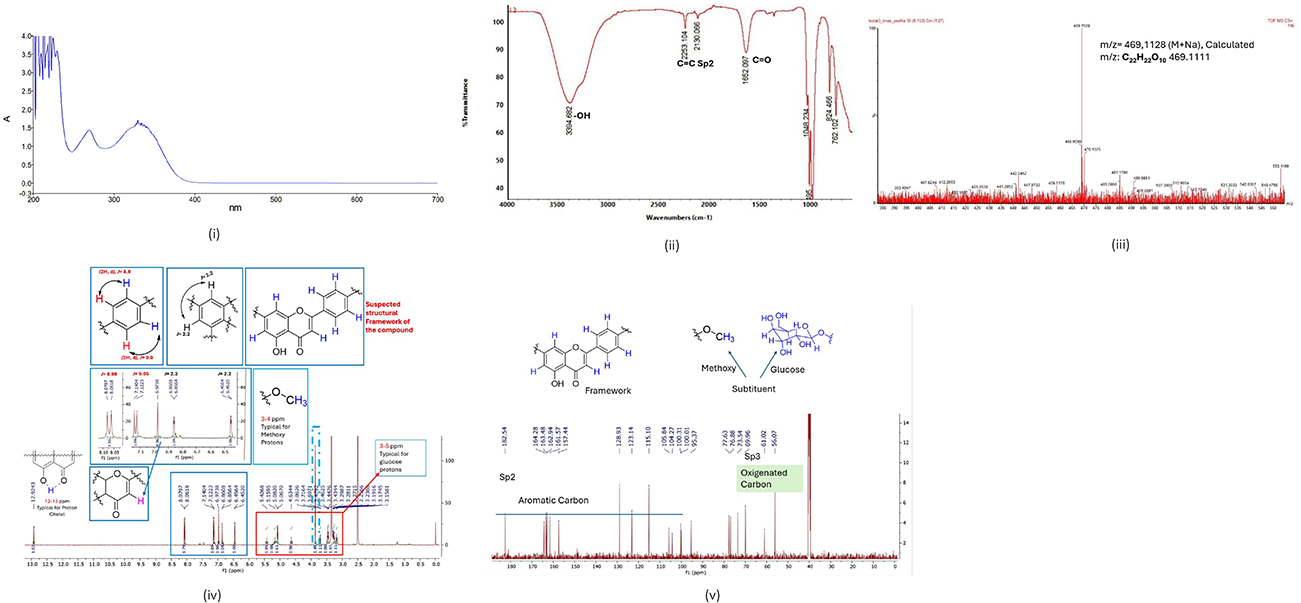 |
Figure 3 Elucidation of the structure of isolates 3: (i) UV–Vis spectrum, (ii) IR spectrum, (iii) MS spectrum, (iv) 1H-NMR spectrum analysis, (v) 13C-NMR spectrum analysis. |
The chemical formula of Compound 2 CML, which was produced as an amorphous powder, was determined to be C16H12O6 with 12 degrees of DBEs based on the molecular ion peak at m/z [M+H2] 301.0459 (calculated for 300.07). The following are compound 2 CML’s spectral data: IR: has the aromatic functional groups C=O (carbonyl) and C=C Sp2 at wave numbers 1636.869 cm-1 and 2126.776 cm-1, respectively, and the OH functional group at wave number 3320.191 cm-1.
1H-NMR: The chemical shift of isolated compound 2 CML δH 13.0036 ppm indicates the presence of typical chelate protons, and δH 3.9496 ppm indicates the presence of methoxy protons. Typical aromatic protons Sp2 are found in the chemical shift region δH 6.6520 (H-6) with a bond constant value of j = 1.19, chemical shift δH 6.6484 (H-7) with a bond constant value of j = 1.19 and chemical shift δH 6.5642 (H-8) with a bond constant value of j = 1.19 where H-6 and H-8 indicate meta positions, each in a splitting doublet pattern (d) which shows the characteristics of ring A in the flavonoid framework. The chemical shift area δH 7.5835–7.5618 (H-2’) with the bond constant value j1=8.5 and j2=2.3; and the chemical shift δH 7.1438–7.1267 (H-6’) with the bond constant value j=2.3. The bond constant value j=8.5, where H-2’ and H-3’ indicate the ortho position; with the bond constant value j=2.3, where H-2’ and H-6’ indicate the meta position. Each in the doublet splitting pattern (d) shows the characteristics of the B ring in the flavonoid skeleton. 13C-NMR: Based on the spectrum, it shows a chemical shift for the carbon atoms that make up the flavonol compound framework, which selects a total number of carbons. In the chemical shift areas of δC 116.8 ppm (C-2); δC 163.0 ppm (C-3); δC 182.9 ppm (C-4); δC 163.4 ppm (C-5); δC 158.7 ppm (C-9); δC 164.8 ppm (C-10); δC 123.9 ppm (C-1’); δC 151.7 ppm (C-4’); δC 147.9 ppm (C-5’) there are two methine carbons (CH) in a splitting singlet (s) pattern, respectively. In the chemical shift areas of δC 99.70 ppm (C-6); δC 94.83 ppm (C-8); δC 129.05 ppm (C-2’); δC 115.36 ppm (C-3’); δC 115.36 ppm (C-5’) and δC 129.05 ppm (C-6’), each contains two methine carbons (CH) in a doublet splitting pattern (d). Quaternary carbon appears in the chemical shift region of δC 55.96 ppm (C-4’ OCH3). Based on the description above, it can be assumed that the structural framework of the compound obtained is a flavonol compound, as shown in Table 2. The results of ultraviolet spectrophotometric analysis of isolate 2 CML showed maximum absorption in band II with a λmax wavelength of 201 nm and band I at a λmax wavelength of 300–400 nm.
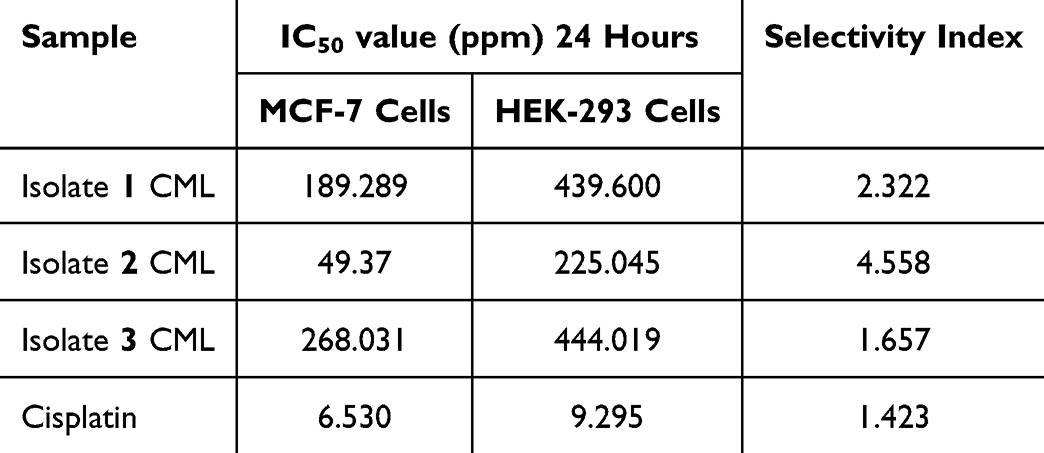 |
Table 2 IC50 Value and Selectivity Index of Isolates 1, 2, 3 CML |
Compound 3 CML is a yellow amorphous powder having the formula C22H22O10 with 16 degrees DBEs, as determined by the molecular ion peak at m/z [M+Na] 469.1128 (calculated for 469.1111). Spectral data of compound 3 are as follows: IR: contains an OH functional group at wave number 3394.682 cm-1, C=O (carbonyl) and aromatic C=C Sp2 functional groups at wave numbers 1652.097 cm-1 and 2253.104 cm-1, respectively. The presence of OH, C=O (carbonyl); and aromatic C=C Sp2 functional groups is a characteristic of flavonoid compounds. 1H-NMR: The chemical shift of the isolated compound 2 CML δH 12.9243 ppm indicates the presence of typical chelate protons, δH 3–4 ppm indicates the presence of methoxy protons, and δH 3–5 ppm indicates typical sugar protons. The typical aromatic Sp2 protons are found in the chemical shift region δH 6.8 (H-6) and chemical shift δH 6.4 (H-8) with a bond constant value of j=2.2 where H-6 and H-8 indicate the meta position, each in a splitting doublet pattern (d) which shows the characteristics of ring A and chemical shift δH 8.05 (H-6) with a bond constant value of j=8.98 and chemical shift δH 7.1 (H-8) with a bond constant value of j=9.05 where H-6 and H-8 indicate the ortho position, each in a splitting doublet pattern (d) which shows the characteristics of ring B in the flavonoid framework. The chemical shift region δH 6.9738 (H-3) shows the characteristics of ring C in the flavonoid framework. 13C-NMR: Based on the spectrum, it shows a chemical shift for the carbon atoms that make up the flavonol compound framework, which indicates the presence of these carbons. In the chemical shift regions of δC 164.3 ppm (C-2); δC 104.3 ppm (C-3); δC 182.9 ppm (C-4); δC 161.5 ppm (C-5); δC 163.4 ppm (C-7); δC 157.4 ppm (C-9); δC 105.8 ppm (C-10); δC 123.4 ppm (C-1’); δC 162.9 ppm (C-4’) there are two methine carbons (CH) in a splitting singlet (s) pattern, respectively. In the chemical shift regions of δC 99.9 ppm (C-6); δC 95.3 ppm (C-8), δC 128.9 ppm (C-2’), δC 115.1 ppm (C-3’), δC 115.1 ppm (C-5’), and δC 126.9 ppm (C-6’), each have two methine carbons (CH) in a doublet splitting pattern (d). Quaternary carbon appears in the chemical shift region of δC 56.1 ppm (C-4’ OCH3). In the chemical shift region of δC 100.3 ppm, there are two methine carbons (CH) in a doublet splitting pattern (d). In the chemical shift regions of δC 77.6 ppm; δC 60.9 ppm; δC 69.9 ppm; δC 73.5 ppm; δC 76.8 ppm; δC 77.6 ppm, each contains two methine carbons (CH) in a singlet (s) splitting pattern. Based on the description above, it can be assumed that the structural framework of the compound obtained is a flavonol glycoside compound.
1H-13C-HSQC: The relationship between carbon and protons in isolates 2 and 3 CML indicates a relationship between the signals of the carbon nucleus and protons, as shown in Figure 4. The same spot in the spectrum indicates that both are directly connected by a bond. Two C-H bonds in Ring A are formed from chemical shifts of δH 6.56 ppm (H-8), which correlate with δC 94.7 ppm (C-8); δH 6.25 ppm (H-6), which correlates with δC 94.7 ppm (C-6); δH 6.65 ppm (H-7), which correlates with δC 104.7 ppm (C-7). Four C-H bonds in Ring B are formed from chemical shifts of δH 3.94 ppm (H-4’) which correlate with δC 56.4 ppm (4’-OCH3); δH 7.13 ppm (H-6’) which correlates with δC 112.4 ppm (C-6’); δH 7.49 ppm (H-3’) which correlates with δC 113.6 ppm (C-3’) and δH 7.57 ppm (H-2’) which correlates with δC 119.7 ppm (C-2’). The correlation of carbon with proton 1H-13C-HSQC for isolate 3 can be seen. Two C-H bonds in Ring A are formed from chemical shifts of δH 6.86 ppm (H-8), which correlates with δC 95.3 ppm (C-8) and δH 6.45 ppm (H-6), which correlates with δC 99.9 ppm (C-6). Four C-H bonds in Ring B are formed from chemical shifts of δH 7.13 ppm (H-3’ and H-5’), which correlate with δC 115.1 ppm (C-3’ and C-5’) forming two C-H bonds (overlapping) and δH 8.07 ppm (H-2’ and H-6’) which correlate with δC 128.9 ppm (C-3’ and C-5’) forming two C-H bonds (overlapping).
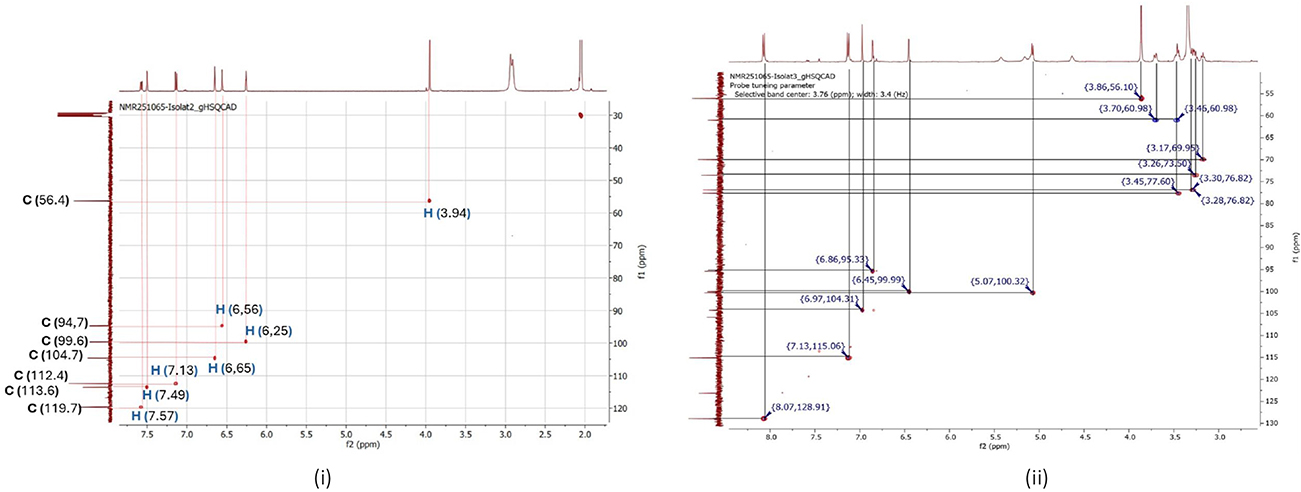 |
Figure 4 2D HSQC NMR spectrum of isolate 2: (i) 2D HSQC NMR spectrum of isolate 3 (ii). |
HMBC: The results of the HMBC spectrum analysis show a relationship between protons and carbons that are more than one bond apart, as shown in Figure 5. The ordinate axis in the HMBC spectrum is plotted with the 1H chemical shift of the proton nucleus. The HMBC spectrum of isolate compound 2 CML gives a proton signal at δH 6.25 ppm (H-6) when a vertical line is drawn from the signal, 4 bonds will be obtained, which are the result of long-distance relationships with carbon. Each of these spots belongs to carbon from the position of C-8 (δC 94.7); C-7 (δC 104.7); C-5 (δC 163.4); and C-7 (δC 104.7). If drawn from δH 6.56 ppm (H-8), four spots will be obtained at C-6 (δC 99.6); C-7 (δC 104.7); C-9 (δC 158.7); C-7 (δC 104.7); C-10 (δC 164.8) and C-4 (δC 182.9). If drawn from δH 7.57 ppm (H-2’), then three spots will be obtained at C-1’ at C-1’ (δC 123.9 ppm); C-3’ (δC 113.6 ppm); C-4’ (151.7 ppm); C-2 (116.8 ppm). Then for δH 7.13 ppm (H-6’), two spots will be obtained at C-5’ (δC 147.9 ppm); C-4’ (δC 151.7 ppm); C2 (δC 116.8 ppm), and C-3 (δC 163.0 ppm). Isolate compound 3 gives a proton signal at δH 6.45 ppm (H-6) when a vertical line is drawn from the signal, 4 bonds will be obtained, which are the result of long-distance relationships with carbon. Each of these spots belongs to carbon from the C-8 position (δC 95.3), C-9 (δC 157.4), C-5 (δC 161.5), and C-7 (δC 163.4). If drawn from δH 6.86 ppm (H-8), four spots will be obtained at C-6 (δC 99.9), C-9 (δC 157.4), and C-7 (δC 163.4). If drawn from δH 7.13 ppm (H-3’ and H-5’), then three spots will be obtained at C-2’ or C-6’, giving the same signal at δC 126.9 ppm; C-3’ (δC 115.1) and C-1’ (δC 123.4). Then for δH 7.13 ppm (H-3’ and H-5’), four spots will be obtained at C-1’ (δC 123.4); at C-3’ or C-5’ giving the same signal at δC 115.1 ppm; C-4’ (δC 162.9) and C-1’ (δC 123.4).
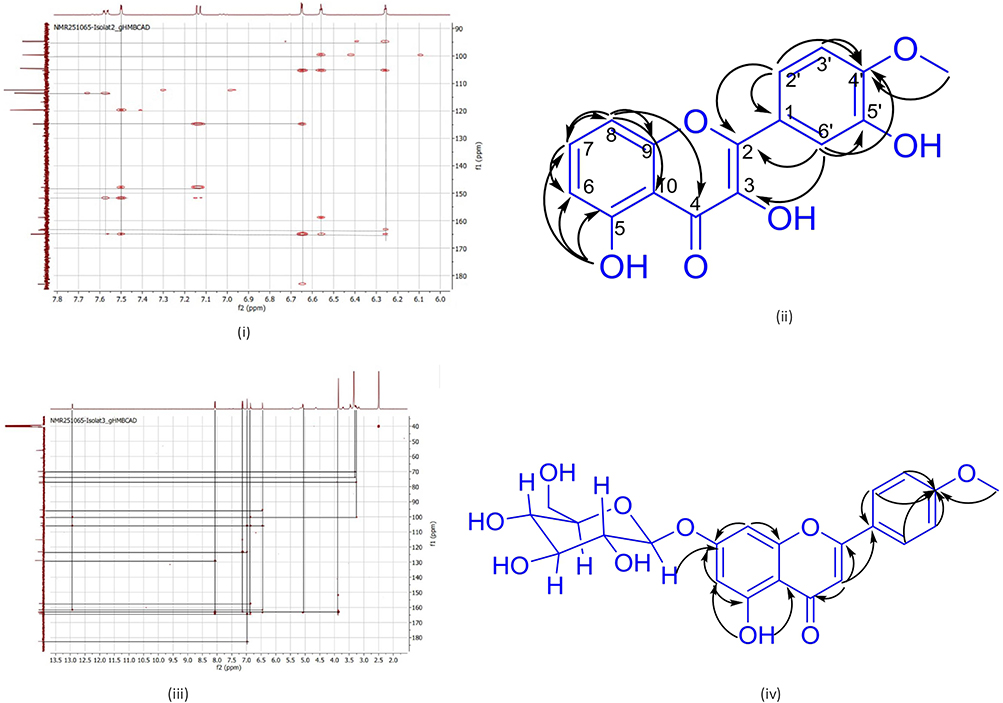 |
Figure 5 2D HMBC NMR spectrum of isolate 2 (i), HMBC isolate 2 correlation diagram (ii), 2D HMBC NMR spectrum of isolate 3 (iii), HMBC isolate 3 correlation diagram (iv). |
Cytotoxic Bioassay and Selectivity Index of Compounds 1, 2, and 3 CML
The cytotoxic activities of compounds 1 and 2 CML were evaluated against the MCF-7 breast cancer cell line according to a previously published method.11 The results of the cytotoxic test of the test solution on MCF-7 and HEK-293 cells obtained the % survival rate values shown in Figure 6, and the IC50 values and selectivity index presented in Table 2. The IC50 value (ppm) indicates the concentration of a compound that inhibits cell viability by 50%. The lower the value, the stronger the cytotoxicity. The Selectivity Index is calculated by comparing the IC50 value of HEK-293 with the IC50 value of MCF-7. A Selectivity Index value > 2 indicates good selectivity against cancer cells, an IS value ≈ of 1 is categorized as non-selective, and an IS value < 1 is categorized as more toxic to normal cells.
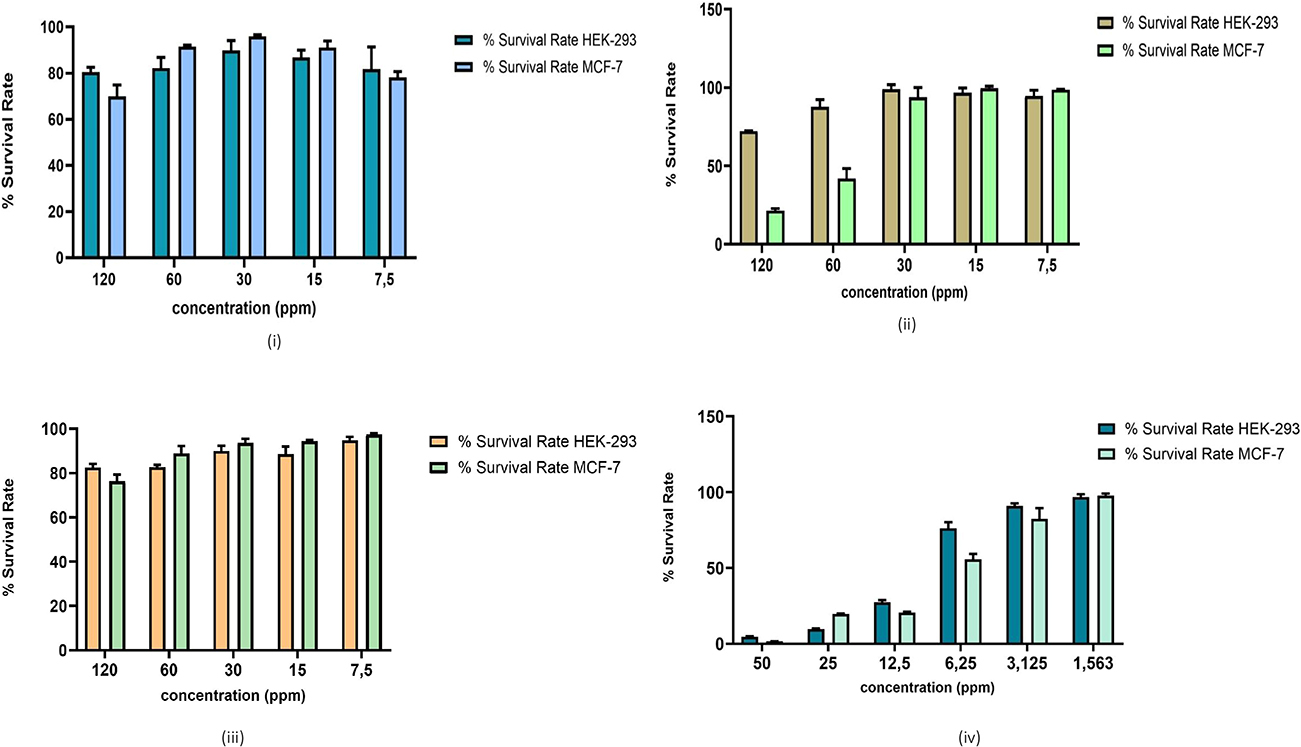 |
Figure 6 % Survival rate of isolates 1 (i), isolate 2 (ii), isolate 3 (iii), and cisplatin (iv). |
Cell Cycle Assay
From the results of the cell cycle inhibition test using propidium iodide reagent with a flow cytometer, the percentage of inhibition in each phase was obtained, namely the percentage of accumulation in each phase in the cell cycle, as shown in Table 3 and Figure 7.
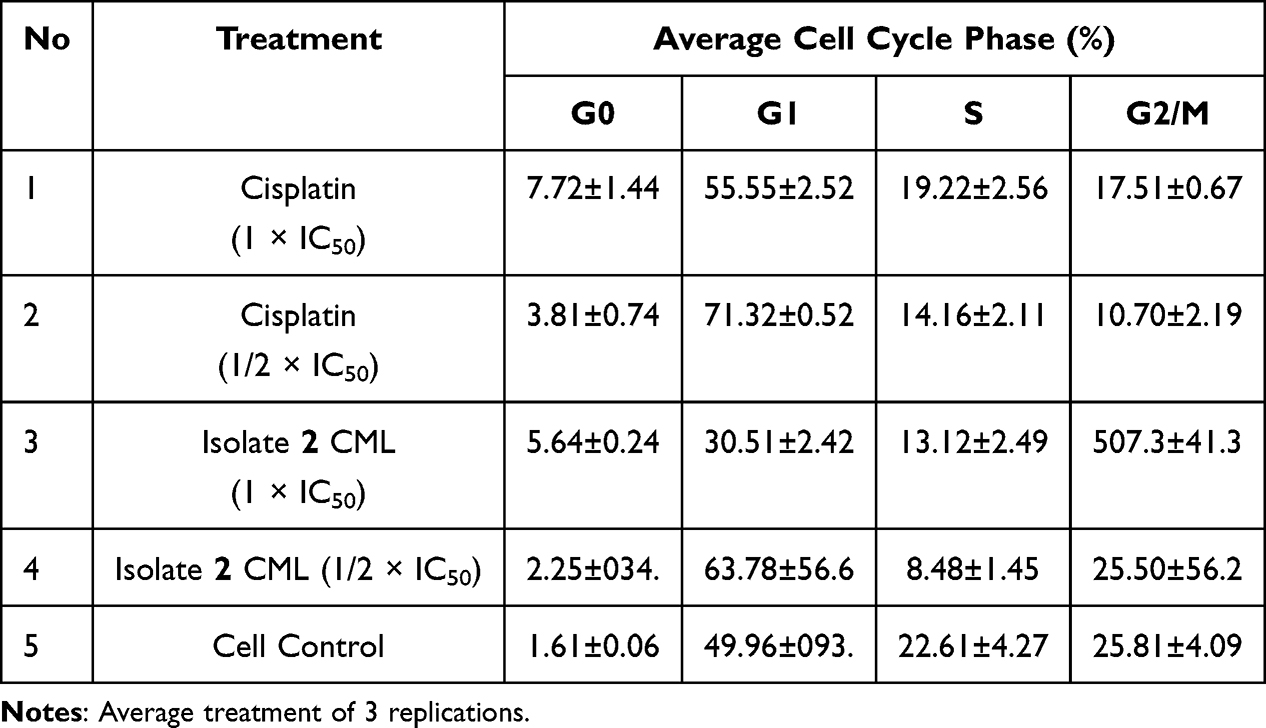 |
Table 3 Percentage of Accumulation of Isolate 2 CML and Cisplatin Against MCF Cell Lines at Each Phase of the Cell Cycle |
 |
Figure 7 Flow cytometer image results MCF-7 cell cycle: (i) Cisplatin 1/2 × IC50, (ii) cisplatin 1 × IC50, (iii) isolate 2 CML 1/2 × IC50, (iv) isolate 2 CML 1 × IC50, (v) Cell control. |
The results of the cell cycle distribution analysis showed that treatment with cisplatin and isolate 2 CML resulted in significant changes in the distribution of cell cycle phases compared to the control. In control cells, the cell cycle distribution was relatively normal with a predominance in the G1 phase (49.96 ± 0.93%), followed by the S phase (22.61 ±.4.27%) and G2/M phase (25.81 ± 4.09%), indicating stable cell proliferation activity.
Cisplatin treatment at a concentration of 1× IC50 increased the proportion of cells in the G1 phase to 55.55 ± 2.52% and decreased the S phase to 19.22 ± 2.56%. At a concentration of ½ × IC50, the increase in the G1 phase was higher, namely 71.32 ± 0.52%. In contrast, isolate 2 DKP at a concentration of 1 × IC50 showed a significant increase in the G2/M phase to 50.73 ± 4.13%, while at a concentration of ½ × IC50, there was an increase in the G1 phase by 63.78 ± 5.66%.
The results of the statistical test analysis of the cell cycle distribution showed that treatment using cisplatin and isolate 2 CML in the G0, G1, S, and G2/M cycles resulted in significant changes to the distribution of the cell cycle phases compared to the control, as seen in Figure 8.
 |
Figure 8 Comparison of cell cycle phases G0 (i), G1 (ii), S (iii), and G2/M (iv) in control, cisplatin (1 × IC50), cisplatin (1/2 × IC50), isolate 2 (1 × IC50), isolate 2 (1/2 × IC50). *(p < 0.05) significant. ** (p < 0.01) highly significant. *** (p < 0.001) very highly significant. **** (p < 0.0001) extremely significant. |
The results of this study indicate that cisplatin and isolate 2 CML treatments can inhibit cell proliferation through different cell cycle inhibition mechanisms. Cell cycle distribution is an important indicator in determining the point of action of an anticancer agent in inhibiting cancer cell growth.55
Apoptosis Assay
The flow cytometry data, presented as the percentage of live MCF-7 cells, those undergoing apoptosis, and those undergoing necrosis, are shown in Table 4 and Figure 9. In cell cycle analysis, isolate 2 CML at the 1 × IC50 concentration caused a significant increase in the G2/M phase (50.73 ± 4.13%), indicating G2/M arrest. Meanwhile, in the apoptosis assay, the same treatment increased early apoptosis of up to 38.87±11.43%. This relationship suggests that cell cycle arrest at the G2/M phase contributes directly to the induction of apoptosis.
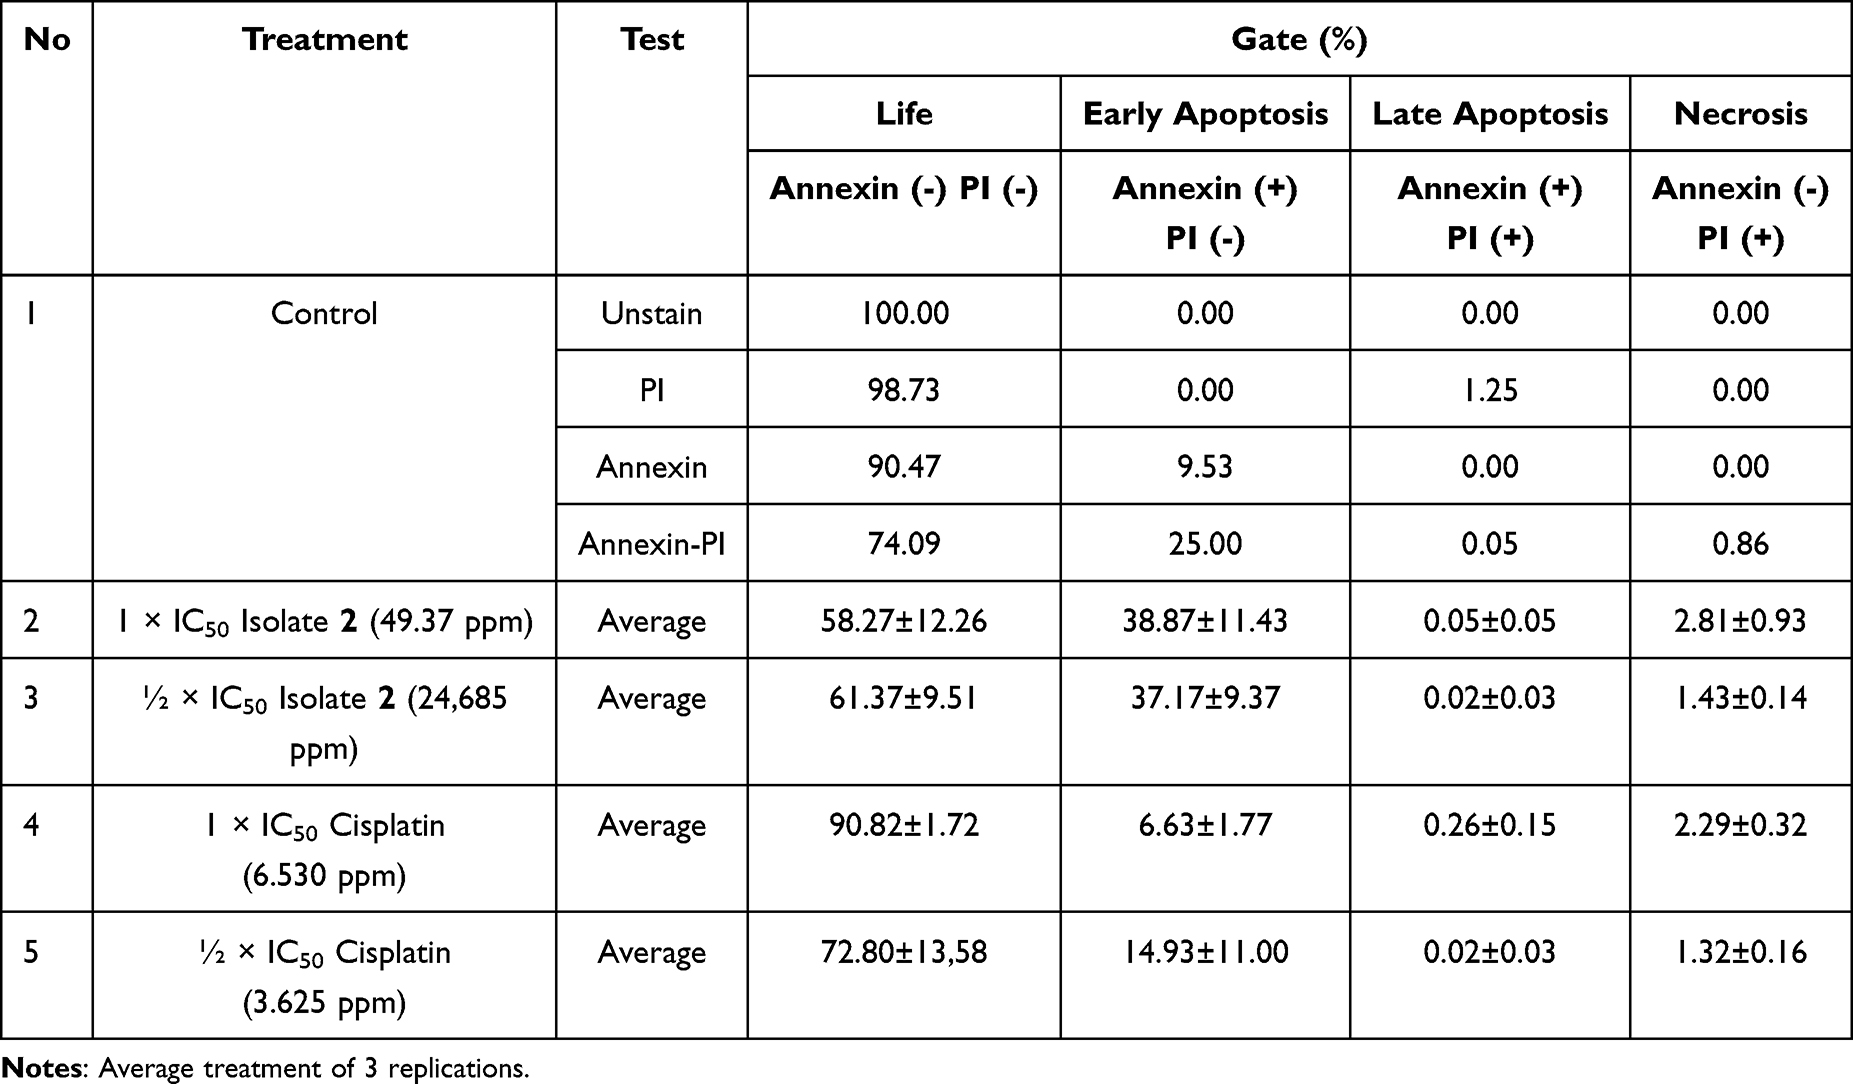 |
Table 4 Apoptosis Test Results of Isolate 2 CML and Cisplatin Against MCF Cell Lines |
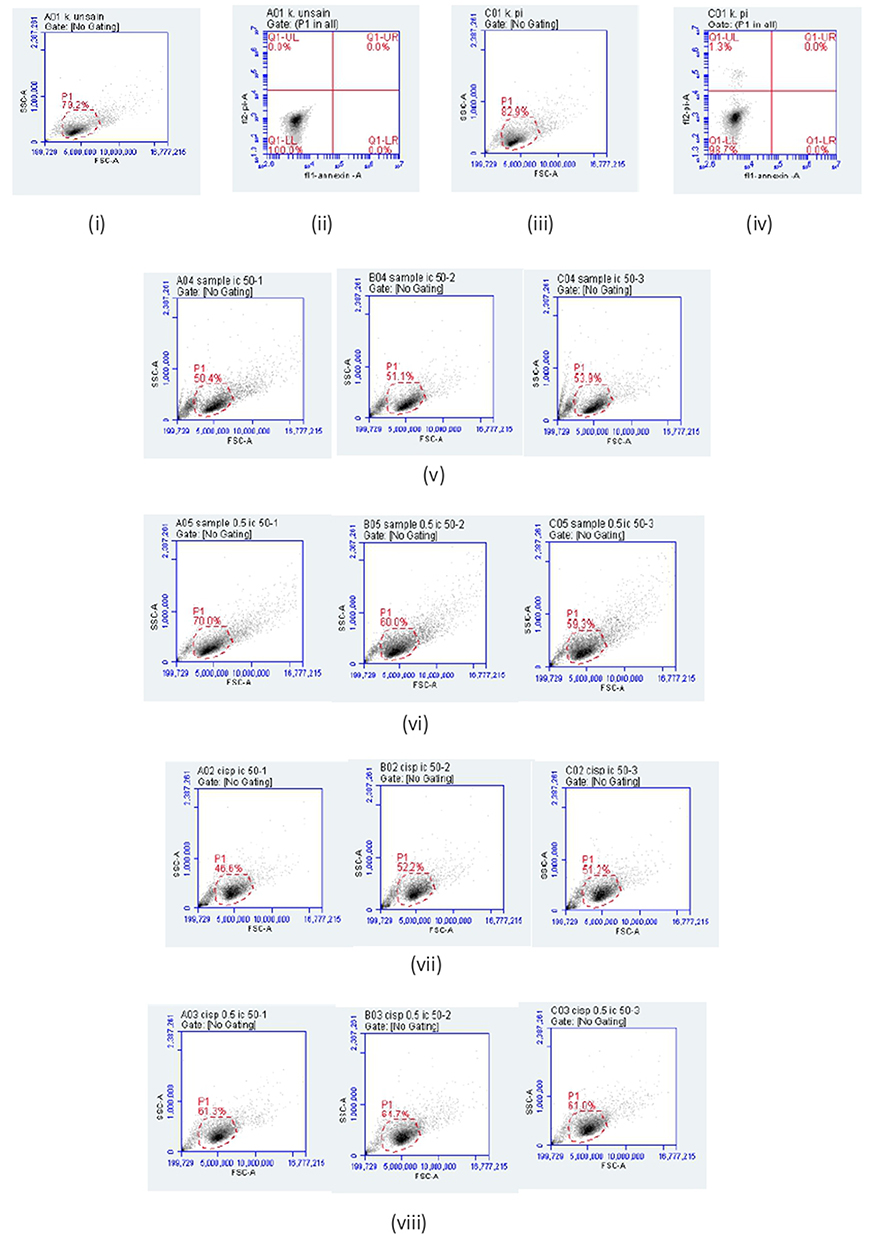 |
Figure 9 Apoptosis analysis by flow cytometry method of MCF-7 cells. The gated cell population (P1): (i) Unstained control, (ii) PI-stained control, (iii) Annexin V-stained control, (iv) Annexin V/PI dual-stained control, (v) Isolate 2 (1 × IC50)-treated MCF-7 cells, (vi) Isolate 2 (1/2 × IC50)-treated MCF-7 cells, (vii) Cisplatin (1 × IC50)-treated MCF-7 cells, (viii) Cisplatin (1/2 × IC50)-treated MCF-7 cells, (ix) Viable cells distribution unstained control, (x) PI-positive cell distribution, (xi) Annexin V-positive cell distribution, (xii) Annexin V/PI cell distribution. Apoptosis distribution: (xiii) Isolate 2 (1 × IC50) treated MCF-7 cells, (xiv) Isolate 2 (1/2 × IC50)-treated MCF-7 cells, (xv) Cisplatin (1 × IC50)-treated MCF-7 cells, (xvi) Cisplatin (1/2 × IC50)-treated MCF-7 cells. |
 |
Figure 9 continued. |
In contrast, cisplatin showed a dominant effect on the G1 phase with an increase of up to 71.32 ± 0.52% at a concentration of ½ the IC50. However, the effect on apoptosis was relatively low, with initial apoptosis only around 6.63 ± 1.77% at the 1× IC50. This suggests that cisplatin in this condition acts more as a cytostatic agent that inhibits cell proliferation through G1 arrest, without directly inducing significant apoptosis. The results of the statistical test on the apoptosis test results are shown in Figure 10.
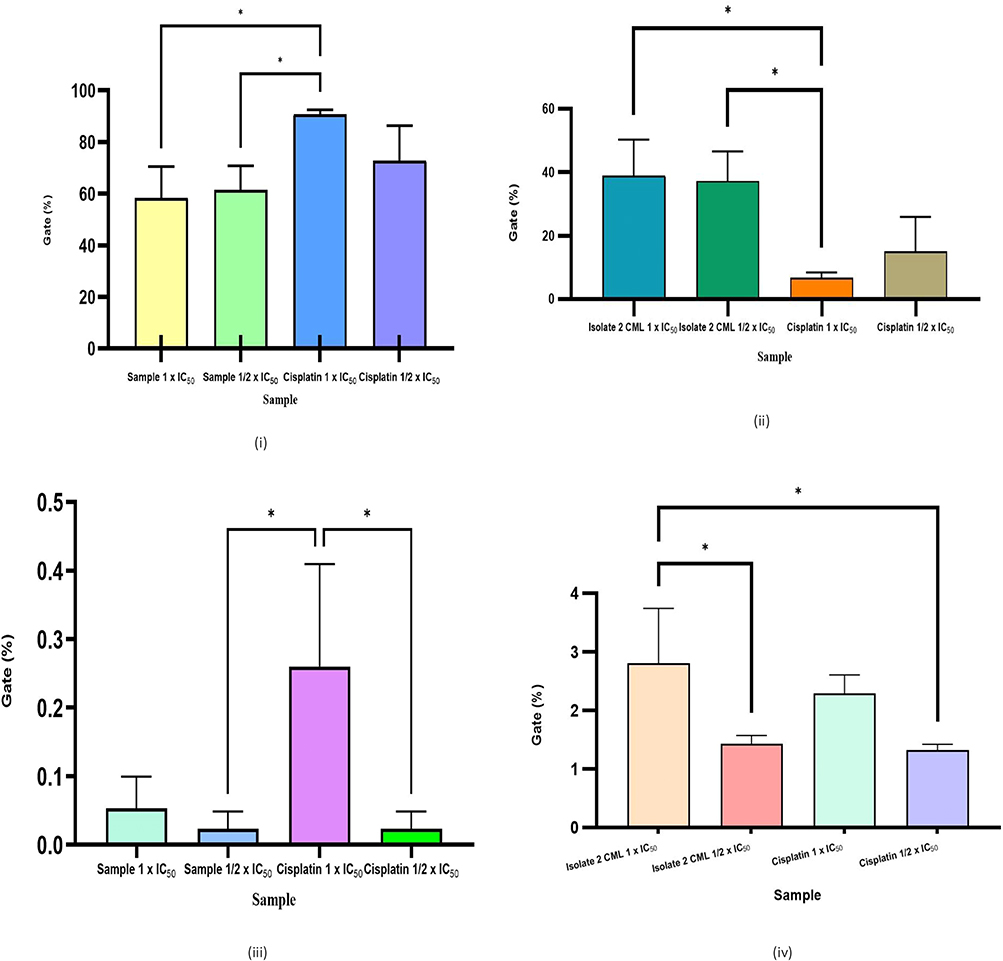 |
Figure 10 Comparison of the percentage of live cells (i), early apoptosis (ii), late apoptosis (iii), and necrosis (iv) in isolate 2 (1 × IC50), isolate 2 (1/2 × IC50), cisplatin (1 × IC50), and cisplatin (1/2 × IC50). * (p < 0.05) significant. |
The results of this study indicate that cisplatin and isolate 2 CML treatments can inhibit cell proliferation through different cell cycle inhibition mechanisms. Cell cycle distribution is an important indicator in determining the point of action of an anticancer agent in inhibiting cancer cell growth.55
ESR1 Gene Expression
Reverse transcriptase-PCR (RT-PCR) is a method for synthesizing single-stranded DNA from mRNA. The basic principle of RT-PCR is to convert mRNA strands into DNA using the reverse transcriptase enzyme and oligonucleotide primers. The primers used in the PCR process are forward and reverse. The resulting double-stranded DNA is then amplified using standard PCR techniques.56 In this test, MCF-7 cells were treated with isolate 2 test compound and cisplatin with concentrations of 1 × IC50 and 1/2 × IC50 in each MCF-7 cell. Measurement of ESR1 and ACTB expression was carried out using RT-qPCR to produce an amplification curve in the form of a melting curve, then the data were analyzed using the ∆∆Ct or 2-∆∆Ct method to calculate the ratio of expression changes (fold change) between the control and treatment groups. The results of the gene expression test are shown in Table 5.
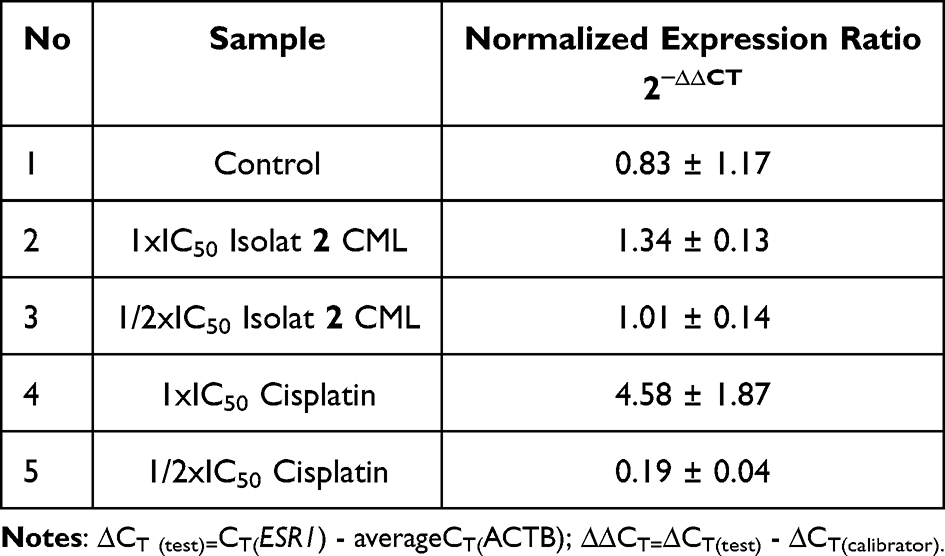 |
Table 5 Results ESR1 Gene Expression Analysis Test of Isolate 2 CML with Cisplatin |
The results showed that ESR1 gene expression experienced different changes in each treatment. The control group had a relative expression value of 0.83 ± 1.17. The Isolate 2 CML treatment group at a dose of 1 × IC50 showed an increase in expression to 1.34 ± 0.13, while at a dose of 1/2 × IC50 showed a value close to normal, namely 1.01 ± 0.14. In the cisplatin treatment group at a dose of 1 × IC50, there was a very high increase in expression, namely 4.58 ± 1.87, while at a dose of 1/2 × IC50, there was a significant decrease in expression to 0.19 ± 0.04. These results indicate that the treatment provides a modulatory effect on ESR1 gene expression that is dose-dependent.
Statistical analysis of the t-test comparing the expression of the ESR1 gene of isolate 2 CML and Cisplatin against the control is presented in Figure 11. The results showed that treatment with isolate 2 CML and cisplatin resulted in differences in gene expression levels as indicated by the normalized expression ratio value. ESR1 gene expression analysis showed that treatment of isolate 2 CML at concentrations of 1 × IC50 and ½ × IC50 did not provide a significant difference compared to the control group (p > 0.05). Isolate 2 DKP 1 × IC50 increased ESR1 expression compared to the control, but the very large variation in the control caused the difference to be insignificant. Isolate 2 DKP ½ × IC50 showed ESR1 expression that was almost the same as the control. Cisplatin treatment 1 × IC50 resulted in the highest increase in ESR1 gene expression, but this increase was also not statistically significant (p > 0.05). Cisplatin ½ × IC50 showed a tendency to decrease ESR1 expression compared to the control.
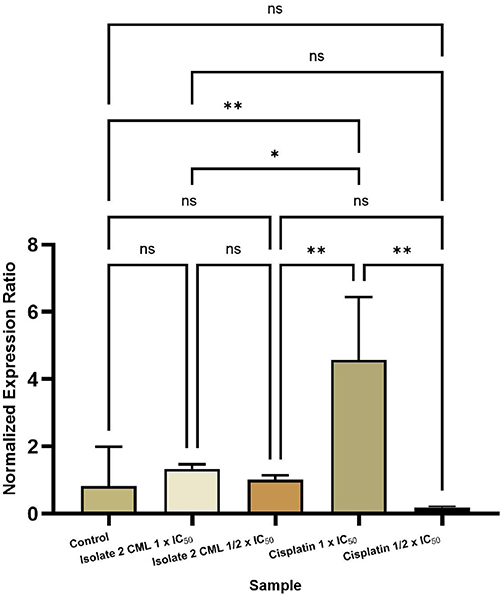 |
Figure 11 Comparison of ESR1 gene expression of isolate 2 CML and cisplatin against control. ns (p > 0.05) non-significant. * (p < 0.05) significant. ** (p < 0.01) highly significant. |
Disscusion
Based on the UV, IR, 1-dimensional NMR (proton and carbon) spectrum data, mass spectrum, and by comparing the chemical shift data (proton and carbon) with the acacetin compound, the chemical structure of isolate compound 1 can be determined as acacetin compound. Based on the UV, IR, 1-dimensional NMR (proton and carbon), 2-dimensional NMR (HSQC and HMBC), and mass spectrum data on isolate 2, it is predicted to be a 3,5,5’-Trihydroxy-4’-methoxy flavone compound. Meanwhile, isolate 3 is predicted to be a kaempferide-7-O-glycoside compound. The chemical structure of isolate compounds 1, 2, and 3 is shown in Figure 12.
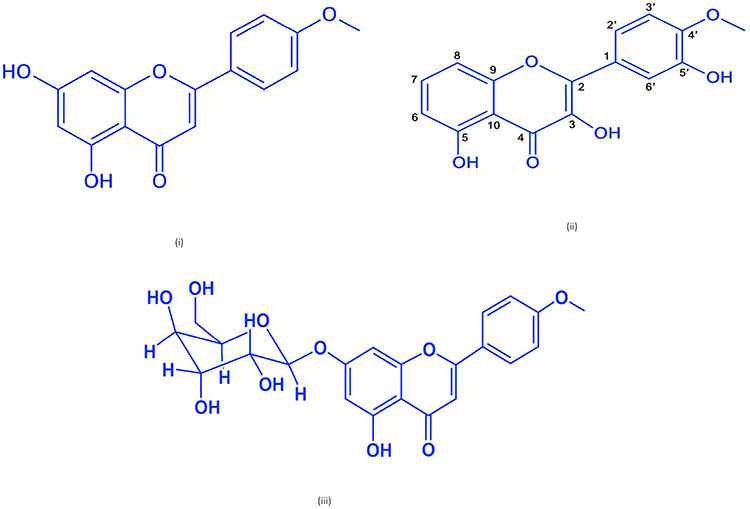 |
Figure 12 Structure of Isolate 1 (acacetin) (i), isolate 2 (3,5,5‑Trihydroksi‑4’-metoksi flavon) (ii), isolate 3 (Kaempferide-7-O-glikosida) (iii). |
From the results of the cytotoxicity test, IC50 value, and selectivity index value, isolate 1 CML has moderate cytotoxic activity with good selectivity against MCF-7. Isolate 2 CML has moderate but selective anticancer activity against MCF-7, and is the best candidate as a selective anticancer compound. Isolate 3 CML has moderate cytotoxic activity; selectivity is not optimal, and cisplatin, as a comparison, is very potent but less selective, in line with the toxic effects of cisplatin on normal cells.
The overall results indicate that the cytotoxic activity of isolate compound 2 is higher compared to other flavonoids (isolate compounds 1 and 3), largely due to the presence of more hydroxyl groups in isolate compound 2. This claim is fully supported by the literature, proving that flavonoid derivatives with methoxy content and having many free hydroxyl groups are more potent as cytotoxic agents and have a higher ability to inhibit tumor cells than flavonoid derivatives in the form of glycosides.57–59 The literature also concludes that methoxy-flavonoids exhibit remarkable chemoprotective properties and are potentially useful as anticancer agents (Mohammed et al, 2021).58
Cisplatin is known to work as a chemotherapeutic agent that induces DNA damage through the formation of DNA crosslinks. This damage activates cell cycle checkpoints, particularly in the G1 phase, via the p53 protein pathway, which subsequently increases the expression of p21, a CDK inhibitor.60 In this study, the increase in the G1 phase at both 1× IC50 and ½× IC50 concentrations indicates that cisplatin causes G1 arrest, preventing cells from progressing to the DNA synthesis phase (S phase). The decrease in the S phase in both treatments further strengthens the inhibition of the G1 to S transition. Furthermore, the stronger effect at ½× IC50 concentrations indicates that cisplatin at low doses is more cytostatic, meaning it inhibits proliferation without directly causing cell death. This is consistent with reports that cisplatin can induce cell cycle arrest before leading to apoptosis.61
In contrast to cisplatin, isolate 2 CML at a concentration of 1 × IC50 showed a significant increase in the G2/M phase. This indicates the occurrence of G2/M arrest, which is the arrest of the cell cycle before entering mitosis. The G2/M phase is a critical checkpoint to ensure that DNA has been properly replicated before cell division occurs. Disruption of this phase is often associated with severe DNA damage, impaired mitotic spindle formation, and inhibition of the cyclin B/CDK1 complex. The accumulation of cells in the G2/M phase indicates that isolate 2 CML has potential as an antimitotic agent, acting by inhibiting mitosis. Compounds with this mechanism generally have high cytotoxic potential because cells that fail to pass through this phase will undergo apoptosis.62,63 At a concentration of ½× IC50, isolate 2 CML showed an increase in the G1 phase, indicating that at lower doses, the effect tends to shift to cytostatic. This suggests a dose-dependent relationship with the compound’s mechanism of action.
Figure 13 illustrates the differences in cell cycle distribution between the two treatments, indicating different mechanisms of action: cisplatin predominantly causes G1 arrest through DNA damage, while isolate 2 CML predominantly causes G2/M arrest through mitosis disruption. This difference indicates that isolate 2 CML has a different target of action than cisplatin. This is crucial in the development of cancer therapies, as the combination of two agents with different mechanisms can increase the effectiveness of therapy and reduce cancer cell resistance.
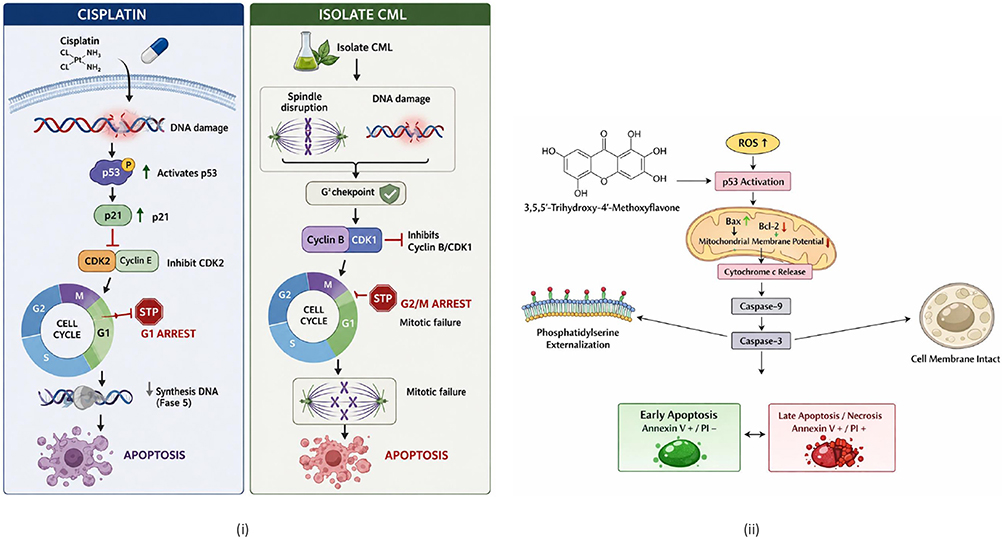 |
Figure 13 Differences in cell cycle distribution between cisplatin and isolate 2 CML (i); molecular mechanism of early apoptosis of isolate compound 2 CML (ii). |
Apoptosis is a desirable mechanism in the development of anticancer agents. Apoptosis can be observed physiologically, including cell shrinkage, plasma membrane damage, and chromatin condensation. Cells that die in this state do not lose their internal contents and do not elicit an inflammatory response. Necrosis, on the other hand, is characterized by an increase in cell volume and a loss of membrane tension. Necrosis is caused by the release of lytic enzymes, followed by an inflammatory response. Necrosis is a pathological process caused by exposure to physical or chemical stress that affects cells.64
Treatment with isolate 2 CML increased the percentage of cells in the early apoptotic phase (Annexin V+/PI−). These results indicate that isolate 2 is capable of inducing cell death via the apoptotic pathway. In contrast, the percentage of necrotic cells (Annexin V−/PI+) was relatively low, indicating that the primary cytotoxic mechanism is apoptosis, not necrosis.
Administration of Isolate 2 CML at a dose of 1×IC50 caused an increase in ESR1 gene expression compared to the control. This indicates that at high doses, Isolate 2 CML can activate the estrogen receptor pathway. ESR1 activation plays a role in regulating cell proliferation and survival of breast cancer cells. In contrast, at a dose of 1/2×IC50, ESR1 gene expression did not experience significant changes. This indicates that the effect of Isolate 2 CML on ESR1 gene expression is dose-dependent, where lower doses are not strong enough to modulate the hormone pathway. Increased ESR1 gene expression may reflect a mechanism of cell adaptation to stress due to compound exposure, so that cells try to maintain survival through activation of the proliferation pathway.
In several previous studies, flavone compounds such as apigenin and luteolin demonstrated high binding affinity for ESR1 ligands in silico.65 Another study on Anhydroicaritin (AHI), a prenylated flavonoid, demonstrated that it can reduce ESR1 gene expression.66 Other studies have also shown that flavonoid phytochemicals act as agonists and antagonists of the human estrogen receptor. Although some of these compounds act by binding directly to the estrogen receptor, certain phytochemicals, such as flavonoid chalcones and flavones, exert antagonistic effects on estrogen signaling independent of direct receptor binding. Chalcones and flavones function as selective, cell-type-specific estrogen receptor modulators. In MCF-7 breast carcinoma cells, chalcones and flavones suppress ESR1 activity through stimulation of members of the stress-activated mitogen-activated protein kinase (MAPK) family: c-Jun N-terminal kinase (JNK)1 and JNK2.51
Cisplatin is a chemotherapy agent that works by inducing DNA damage through the formation of DNA cross-links. This DNA damage inhibits replication and transcription and activates the apoptosis pathway. In this study, cisplatin at a dose of 1×IC50 significantly increased ESR1 expression. This increase is likely a compensatory response of cells to chemotherapy-induced stress. ESR1 activation can increase the expression of antiapoptotic genes, thereby helping cells survive. Conversely, at a dose of 1/2×IC50, cisplatin drastically decreased ESR1 gene expression. This decrease indicates that under certain conditions, cisplatin can suppress the estrogen receptor pathway and increase cell sensitivity to programmed cell death. The difference in response between high and low doses indicates that the effect of cisplatin on ESR1 gene expression is complex and influenced by the balance between cell adaptation mechanisms and apoptosis induction.
Particularly in ER-positive cells like MCF-7, the ESR1 gene is essential for controlling the growth and survival of breast cancer cells. ESR1 activation can prevent apoptosis and boost the production of genes related to the cell cycle. Increased ESR1 expression in several treatment groups indicates potential activation of the estrogen pathway, which can support cell proliferation. Conversely, decreased ESR1 gene expression indicates potential induction of apoptosis through suppression of the hormone pathway. The results of this study suggest that modulating ESR1 expression can influence cancer cell response to therapy, making ESR1 a potential therapeutic target for ER-positive breast cancer.67
Conclusion
Based on UV, IR, 1-dimensional NMR (proton and carbon), 2-dimensional NMR (HSQC and HMBC), and mass spectra data for isolates (1), (2), and (3), it is predicted that the compounds are (1) acacetin, (2) 3,5,5’-Trihydroxy-4’-methoxy flavone, and (3) kaempferide-7-O-glycoside. Isolate 2 CML has an IC50 value of 225.045 in HEK-293 cells, thus having a higher selectivity index (4.558) compared to other isolates and cisplatin. Isolate 2 CML can inhibit the cell cycle by causing arrest in the G2/M phase, as indicated by an increase in the percentage of cells in that phase. Isolate 2 CML can significantly induce early-stage apoptosis, as indicated by an increase in Annexin V-positive/PI-negative cells. Administration of Isolate 2 CML at doses of 1×IC50 and 1/2×IC50 caused an increase in ESR1 gene expression compared to the control, meaning that transcriptional activation occurred in MCF-7 cells.
Acknowledgments
This research was funded by the Directorate of Research and Community Service, Ministry of Research, Technology, and Higher Education of Indonesia under the Doctoral Dissertation Research Scheme (2023). This study did not involve human participants or animal experiments. The MCF-7 breast cancer cell line used in this study is a commercially available established cell line, which was obtained from the Translational Pharmacy Research Laboratory, Faculty of Pharmacy, Universitas Padjadjaran, Indonesia. Therefore, ethical approval was not required. This publication charge is funded by Universitas Padjadjaran through the Indonesian Endowment Fund for Education (LPDP) on behalf of the Indonesian Ministry of Higher Education, Science and Technology and managed under the EQUITY Program (Contract No. 4303/ B3/DT.03.08/2025 and 3927/UN6. RKT/HK.07.00/2025).
Disclosure
The authors report no conflicts of interest in this work.
References
1. Kemenkes RI. Rencana Kanker Nasional 2024-2034. Kementerian Kesehatan Republik Indonesia; 2024.
2. Dong R, Wang J, Guan R, et al. Role of oxidative stress in the occurrence, development, and treatment of breast cancer. Antioxidants. 2025;14(1):104. doi:10.3390/antiox14010104
3. Al-Shami K, Awadi S, Khamees A, et al. Estrogens and the risk of breast cancer: a narrative review of literature. Heliyon. 2023;9(9):e20224. PMID: 37809638; PMCID: PMC10559995. doi:10.1016/j.heliyon.2023.e20224
4. Brandão DC, Lima PMAP, Martins IC, et al. Arrabidaea chica chloroform extract modulates estrogen and androgen receptors on luminal breast cancer cells. BMC Complement Med Therap. 2022;22(1):1–27. doi:10.1186/s12906-022-03506-3
5. To NB, Truong VNP, Ediriweera MK, et al. Effects of combined pentadecanoic acid and tamoxifen treatment on tamoxifen resistance in MCF−7/SC breast cancer cells. Int J Mol Sci. 2022;23(19). doi:10.3390/ijms231911340
6. Yuan H, Jiang S, Liu Y, et al. The flower head of Chrysanthemum morifolium Ramat. (Juhua): a paradigm of flowers serving as Chinese dietary herbal medicine. J Ethnopharmacol. 2020;261:113043.
7. Liu YH, Mou X, Zhou DY, et al. Extraction of flavonoids from Chrysanthemum morifolium and antitumor activity in vitro. Exp Ther Med. 2017;15(2):1203–1210. PMID: 29399116; PMCID: PMC5774524. doi:10.3892/etm.2017.5574
8. Yang PF, Yang YN, Feng ZM, et al. Six new compounds from the flowers of Chrysanthemum morifolium and their biological activities. Bio-Organic Chemistry. 2019;82:139–144. doi:10.1016/j.bioorg.2018.10.007
9. Wang T, Shen XG, Guo QS, Zhou JS, Mao PF, Shen ZG. Comparison of major bioactive components from leaves of Chrysanthemum morifolium. Zhongguo Zhong Yao Za Zhi. 2015;40(9):1670–1675. Chinese. PMID: 26323127.
10. Maesaroh I, Barliana MI, Abdulah R, et al. A review of chrysanthemum phytochemical-based herbal medicine as molecular therapy for anticancer. Egyptian J Botany (EJBO). 2026;66(2):25–47. doi:10.21608/ejbo.2026.358366.3214
11. Maesaroh I, Barliana MI, Abdulah R, et al. Anticancer activities and metabolite profiling of UHPLC-HRMS method from Chrysanthemum x morifolium (Ramat.) Hemsl leaves. HAYATI J Biosci. 2026;33(1):167–180. doi:10.4308/hjb.33.1.167-180
12. Wu H, Feng Y, Xie X, et al. Glycitin in soy beans: a mine of their structures, functions, and potential applications. Foods. 2025;14(17):2940. doi:10.3390/foods14172940
13. BenchChem Technical Support Team. Glycitein’s impact on gene expression in breast cancer cells: a technical guide. Foundational & Exploratory. BenchChem; 2025.
14. Abdulkadir WS, Taupik M, Tungadi R, et al. In silico analysis of isoflavone compounds in soybean (Glycine max L) as anti-breast cancer agents targeting estrogen receptor alpha. Trop J Phytochem Pharm Sci. 2024;3(7):375–379. doi:10.26538/tjpps/v3i7.3
15. Ferriere F, Aasi N, Flouriot G, Pakdel F. Exploring the complex mechanisms of isoflavones: from cell bioavailability, to cell dynamics and breast cancer. Phytother Res. 2025;39(2):957–979. PMID: 39707600; PMCID: PMC11832364. doi:10.1002/ptr.8417
16. Zhang B, Su JP, Bai Y, et al. Inhibitory effects of O-methylated isoflavone glycitein on human breast cancer SKBR-3 cells. Int J Clin Exp Pathol. 2015;8(7):7809–7817. PMID: 26339345; PMCID: PMC4555673.
17. Michalczyk M, Humeniuk E, Kubik J, et al. Enhancement of doxorubicin efficacy by diosmetin through DNA damage accumulation and P-glycoprotein inhibition in breast cancer cells. Sci Rep. 2025;15(1):30814. PMID: 40841424; PMCID: PMC12371033. doi:10.1038/s41598-025-16681-3
18. Wang N. Dietary compound diosmetin chemosensitizes breast cancer stem cells by suppressing HMGB1-mediated autophagy. BIO Web Conferences. 2023;72:02008. doi:10.1051/bioconf/20237202008
19. Wang J, Ma S, Li L, et al. Investigation into the in vivo mechanism of diosmetin in patients with breast cancer and COVID-19 using bioinformatics. Front Pharmacol. 2022;13:983821. doi:10.3389/fphar.2022.983821
20. Chan EWC, Ng YK, Tan CY, et al. Diosmetin and tamarixetin (methylated flavonoids): a review on their chemistry, sources, pharmacology, and anticancer properties. J Appl Pharm Sci. 2021;11(03):022–028. doi:10.7324/JAPS.2021.110302
21. Wang C, Li S, Ren H, et al. Anti-proliferation and pro-apoptotic effects of diosmetin via modulating cell cycle arrest and mitochondria-mediated intrinsic apoptotic pathway in MDA-MB-231 cells. Med Sci Monit. 2019;25:4639–4647. PMID: 31228347; PMCID: PMC6601365. doi:10.12659/MSM.914058
22. Minaei S, Kavousi M, Jamshidian F. The apoptotic and anti-metastatic effects of niosome kaempferol in MCF-7 breast cancer cells. Sci Rep. 2025;15(1):20741. PMID: 40596252; PMCID: PMC12216897. doi:10.1038/s41598-025-07221-0
23. Kaur S, Mendonca P, Soliman KFA. The anticancer effects and therapeutic potential of kaempferol in triple-negative breast cancer. Nutrients. 2024;16(15):2392. doi:10.3390/nu16152392
24. Widyananda MH, Fatchiyah F, Muflikhah L, et al. Computational examination to reveal Kaempferol as the most potent active compound from Euphorbia hirta against breast cancer by targeting AKT1 and ERα. Egypt J Basic Appl Sci. 2023;10(1):753–767. doi:10.1080/2314808X.2023.2272385
25. Shah ND, Shah PS, Panchal YY, et al. Mutation analysis of BRCA1/2 mutations with special reference to polymorphic SNPs in Indian breast cancer patients. Appl Clin Genet. 2018;11:59–67. PMID: 29785135; PMCID: PMC5953318. doi:10.2147/TACG.S155955
26. Zhu Q, Han Y, He Y, et al. Kaempferol improves breast cancer-related depression through the COX-2/PGE2 pathway. Front Biosci. 2023;28(11):311. PMID: 38062826. doi:10.31083/j.fbl2811311
27. Imran M, Salehi B, Sharifi-Rad J, et al. Kaempferol: a key emphasis to its anticancer potential. Molecules. 2019;24(12):2277.
28. Yi X, Zuo J, Tan C, et al. Kaempferol, A flavonoid compound from Gynura Medica induced apoptosis and growth inhibition in MCF-7 breast cancer cell. Afr J Tradit Complement Altern Med. 2016;13(4):210–215. PMID: 28852738; PMCID: PMC5566146. doi:10.21010/ajtcam.v13i4.27
29. Thirugnanam SS, Ragunathan S, Prasad M. Esculetin loaded chitosan nanoparticles (ESC-CNPs) Ameliorates 7, 12 Dimethylbenz [a] Anthracene (DMBA) induced breast cancer in rat model. Pharmacogn Res. 2025;17(1):207–220. doi:10.5530/pres.20251996
30. Liu M, Sheng Y, Guo F, et al. Therapeutic potential of esculetin in various cancer types (Review). Oncol Lett. 2024;28(1):305. PMID: 38774454; PMCID: PMC11106741. doi:10.3892/ol.2024.14438
31. Singh A, Singh K, Kaur K, et al. Coumarin as an elite scaffold in anti-breast cancer drug development: design strategies, mechanistic insights, and structure–activity relationships. Biomedicines. 2024;12(6):1192. doi:10.3390/biomedicines12061192
32. Choi J, Yoo MJ, Park SY, et al. Antitumor effects of esculetin, a natural coumarin derivative, against canine mammary gland tumor cells by inducing cell cycle arrest and apoptosis. Vet Sci. 2023;10(2):84. doi:10.3390/vetsci10020084
33. Rezoan Hossain M, Zahra Shova FT, Akter M, et al. Esculetin unveiled: decoding its anti-tumor potential through molecular mechanisms-A comprehensive review. Cancer Rep. 2024;7(1):e1948. PMID: 38062981; PMCID: PMC10809201. doi:10.1002/cnr2.1948
34. Cao Y, Yu M, Dong G, et al. Digital PCR as an emerging tool for monitoring of microbial biodegradation. Molecules. 2020;25(3):706. PMID: 32041334; PMCID: PMC7037809. doi:10.3390/molecules25030706
35. Meilawati L, Dewi R, Tasfiyati A, et al. Scopoletin: anticancer potential and mechanism of action. Asian Pac J Trop Biomed. 2023;13(1):1–8. doi:10.4103/2221-1691.367685
36. Wen L, Chan BCL, Qiu MH, et al. Artemisinin and Its derivatives as potential anticancer agents. Molecules. 2024;29(16):3886. doi:10.3390/molecules29163886
37. Yao Y, Wang H, Xu J, et al. The anti-breast cancer activity of dihydroartemisinin-5-methylisatin hybrids tethered via different carbon spacers. Molecules. 2022;27(22):7994. doi:10.3390/molecules27227994
38. Zhou X, Soto-Gamez A, Nijdam F, et al. Dihydroartemisinin-transferrin adducts enhance TRAIL-induced apoptosis in triple-negative breast cancer in a P53-independent and ROS-dependent manner. Front Oncol. 2022;11:789336. PMID: 35047402; PMCID: PMC8762273. doi:10.3389/fonc.2021.789336
39. Dai D, Chen C, Lu C, et al. Apoptosis, autophagy, ferroptosis, and pyroptosis in cisplatin-induced ototoxicity and protective agents. Front Pharmacol. 2024;24(15):1430469. PMID: 39380912; PMCID: PMC11459463. doi:10.3389/fphar.2024.1430469
40. Feng MX, Hong JX, Wang Q, et al. Dihydroartemisinin prevents breast cancer-induced osteolysis via inhibiting both breast cancer cells and osteoclasts. Sci Rep. 2016;6:19074. Erratum in: Sci Rep. 2018 Jan 08;8:46935. PMID: 26743690; PMCID: PMC4705478. doi:10.1038/srep19074
41. Jafari S, Ostadrahimi A, Farjami A, et al. Synergistic anticancer effects of Chrysin and trastuzumab in HER2-Positive breast cancer cells. Sci Rep. 2025;15(1):41215. PMID: 41271943; PMCID: PMC12638914. doi:10.1038/s41598-025-25098-x
42. Kurkiewicz M, Moździerz A, Rzepecka-Stojko A, et al. Chrysin: a comprehensive review of its pharmacological properties and therapeutic potential. Pharmaceuticals. 2025;18(8):1162. doi:10.3390/ph18081162
43. Hapsari WK, Saputra AR. Chrysin’s potential as an anticancer: a review. SJBIOS. 2024;3(2):33–39. PMC4098834.
44. Sood A, Mehrotra A, Sharma U, et al. Advancements and recent explorations of anti-cancer activity of chrysin: from molecular targets to therapeutic perspective. Explor Target Antitumor Ther. 2024;5(3):477–494. PMID: 38966181; PMCID: PMC11220305. doi:10.37349/etat.2024.00230
45. Çetinkaya S. Chrysin mediates the induction of apoptosis in breast cancer cells via the inhibition of the WNT/β-catenin signaling pathway. Preprints. 2023;2023100736. doi:10.20944/preprints202310.0736.v1
46. Javan Maasomi Z, Pilehvar Soltanahmadi Y, Dadashpour M, et al. Synergistic anticancer effects of silibinin and chrysin in T47D breast cancer cells. Asian Pac J Cancer Prev. 2017;18(5):1283–1287. PMID: 28610415; PMCID: PMC5555536. doi:10.22034/APJCP.2017.18.5.1283
47. Samarghandian S, Azimi-Nezhad M, Borji A, et al. Inhibitory and cytotoxic activities of chrysin on human breast adenocarcinoma cells by induction of apoptosis. Pharmacogn Mag. 2016;12(4):436–440. PMID: 27761071; PMCID: PMC5068120. doi:10.4103/0973-1296.191453
48. Abotaleb M, Samuel SM, Varghese E, et al. Flavonoids in cancer and apoptosis. Cancers. 2018;11(1):28. PMID: 30597838; PMCID: PMC6357032. doi:10.3390/cancers11010028
49. Kopustinskiene DM, Jakstas V, Savickas A, et al. Flavonoids as anticancer agents. Nutrients. 2020;12(2):457. PMID: 32059369; PMCID: PMC7071196. doi:10.3390/nu12020457
50. D’Arrigo G, Gianquinto E, Rossetti G, et al. Binding of androgen- and estrogen-like flavonoids to their cognate (non)nuclear receptors: a comparison by computational prediction. Molecules. 2021;26(6):1613. PMID: 33799482; PMCID: PMC8001607. doi:10.3390/molecules26061613
51. Collins-Burow BM, Antoon JW, Frigo DE, et al. Antiestrogenic activity of flavonoid phytochemicals mediated via the c-Jun N-terminal protein kinase pathway. Cell-type specific regulation of estrogen receptor alpha. J Steroid Biochem Mol Biol. 2012;132(1–2):186–193. PMID: 22634477; PMCID: PMC4083692. doi:10.1016/j.jsbmb.2012.05.004
52. Miksicek RJ. Estrogenic flavonoids: structural requirements for biological activity. Proc Soc Exp Biol Med. 1995;208(1):44–50. PMID: 7892294. doi:10.3181/00379727-208-43830
53. Reynaldi MA, Faradilla A, Erwansani E, et al. Docking Sinergis Allicin, Alliin, dan Diallyl Sulfide terhadap Reseptor Estrogen Alfa pada Kanker Payudara. JIFI (Jurnal Ilmiah Farmasi Imelda). 2025;9(1):34–40.
54. Linowiecka K, Szpotan J, Godlewska M, et al. Selective Estrogen Receptor Modulators’ (SERMs) influence on TET3 expression in breast cancer cell lines with distinct biological subtypes. Int J Mol Sci. 2024;25(16):8561. doi:10.3390/ijms25168561
55. Mohiuddin M, Kasahara K. Cisplatin activates the growth inhibitory signaling pathways by enhancing the production of reactive oxygen species in non-small cell lung cancer carrying an EGFR Exon 19 deletion. Cancer Genomics Proteomics. 2021;18(3 Suppl):471–486. PMID: 33994369; PMCID: PMC8240041. doi:10.21873/cgp.20273
56. Mo Y, Wan R, Zhang Q. Application of reverse transcription-PCR and real-time PCR in nanotoxicity research. Methods Mol Biol. 2012;926:99–112. PMID: 22975959; PMCID: PMC5087796. doi:10.1007/978-1-62703-002-1_7
57. Ahmed ZSO, Khan E, Elias N, et al. Updated review on natural polyphenols: molecular mechanisms, biological effects, and clinical applications for cancer management. Biomolecules. 2025;15(5):629. doi:10.3390/biom15050629
58. Mohammed HA, Abd El-Wahab MF, Shaheen U, et al. Isolation, characterization, complete structural assignment, and anticancer activities of the methoxylated flavonoids from Rhamnus disperma roots. Molecules. 2021;26(19):5827. PMID: 34641372; PMCID: PMC8510169. doi:10.3390/molecules26195827
59. Sak K. Cytotoxicity of dietary flavonoids on different human cancer types. Pharmacogn Rev. 2014;8(16):122–146. PMID: 25125885; PMCID: PMC4127821. doi:10.4103/0973-7847.134247
60. Huang JY, Lin YC, Chen HM, et al. RETRACTED: adenine combined with cisplatin promotes anticancer activity against hepatocellular cancer cells through AMPK-mediated p53/p21 and p38 MAPK cascades. Pharmaceuticals. 2022;15(7):795. Retraction in: Pharmaceuticals (Basel). 2025;18(2):263. PMID: 35890094; PMCID: PMC9322617. doi:10.3390/ph15070795
61. Ranasinghe R, Mathai ML, Zulli A. Cisplatin for cancer therapy and overcoming chemoresistance. Heliyon. 2022;8(9):e10608. PMID: 36158077; PMCID: PMC9489975. doi:10.1016/j.heliyon.2022.e10608
62. van Vuuren RJ, Visagie MH, Theron AE, et al. Antimitotic drugs in the treatment of cancer. Cancer Chemother Pharmacol. 2015;76(6):1101–1112. PMID: 26563258; PMCID: PMC4648954. doi:10.1007/s00280-015-2903-8
63. Miranda CAN, Souza ATB, AKMDC S, et al. Apoptosis and G2/M phase cell cycle arrest induced by alkaloid erythraline isolated from Erythrina velutina in SiHa cervical cancer cell. Int J Mol Sci. 2025;26(10):4627. PMID: 40429769; PMCID: PMC12111132. doi:10.3390/ijms26104627
64. Pistritto G, Trisciuoglio D, Ceci C, Garufi A, D’Orazi G. Apoptosis as anticancer mechanism: function and dysfunction of its modulators and targeted therapeutic strategies. Aging (Albany, NY). 2016;8(4):603–619. PMID: 27019364; PMCID: PMC4925817. doi:10.18632/aging.100934
65. Hodaei M, Rahimmalek M, Behbahani M. Anticancer drug discovery from Iranian Chrysanthemum cultivars through system pharmacology exploration and experimental validation. Sci Rep. 2021;1(1):1–11.
66. Ying H, Zheng J, Jiang M, et al. Selective cytotoxicity of anhydroicaritin in ER-positive breast cancer via ESR1-mediated MAPK and apoptotic signaling. Chem Biol Interact. 2026;423:111825. PMID: 41232639. doi:10.1016/j.cbi.2025.111825
67. Porras L, Ismail H, Mader S. Positive regulation of estrogen receptor alpha in breast tumorigenesis. Cells. 2021;10(11):2966. PMID: 34831189; PMCID: PMC8616513. doi:10.3390/cells10112966
 © 2026 The Author(s). This work is published and licensed by Dove Medical Press Limited. The
full terms of this license are available at https://www.dovepress.com/terms
and incorporate the Creative Commons Attribution
- Non Commercial (unported, 4.0) License.
By accessing the work you hereby accept the Terms. Non-commercial uses of the work are permitted
without any further permission from Dove Medical Press Limited, provided the work is properly
attributed. For permission for commercial use of this work, please see paragraphs 4.2 and 5 of our Terms.
© 2026 The Author(s). This work is published and licensed by Dove Medical Press Limited. The
full terms of this license are available at https://www.dovepress.com/terms
and incorporate the Creative Commons Attribution
- Non Commercial (unported, 4.0) License.
By accessing the work you hereby accept the Terms. Non-commercial uses of the work are permitted
without any further permission from Dove Medical Press Limited, provided the work is properly
attributed. For permission for commercial use of this work, please see paragraphs 4.2 and 5 of our Terms.
Recommended articles

TEAD1 Silencing Regulates Cell Proliferation and Resistance to 5-Fluorouracil in Cutaneous Squamous Cell Carcinoma
Wang Z, Liu M, Lei H, Xiao S, Zheng Y
Clinical, Cosmetic and Investigational Dermatology 2022, 15:2685-2692
Published Date: 13 December 2022
Combined Treatment with Shuyu Pills and Everolimus Suppresses Triple-Negative Breast Cancer Growth via the PI3K/AKT/mTOR Pathway
Zhao J, Luo X, Li H, Cheng Y, Xie S, Lin X
Breast Cancer: Targets and Therapy 2026, 18:580570
Published Date: 4 March 2026