Back to Journals » Journal of Hepatocellular Carcinoma » Volume 12
ANT Score Nomogram for Predicting Very Early Recurrence of Hepatocellular Carcinoma
Authors Yu Z, Wang H, Huo Q, Cao W, Jin L, Liu J, Wei F ![]()
Received 28 July 2025
Accepted for publication 25 October 2025
Published 5 November 2025 Volume 2025:12 Pages 2477—2490
DOI https://doi.org/10.2147/JHC.S556733
Checked for plagiarism Yes
Review by Single anonymous peer review
Peer reviewer comments 2
Editor who approved publication: Dr Mohamed Shaker
Zichen Yu,1,2 Hanyu Wang,1,3 Qiang Huo,4 Wenli Cao,1,3 Liming Jin,1 Jie Liu,1 Fangqiang Wei1
1Department of General Surgery, Cancer Center, Division of Hepatobiliary and Pancreatic Surgery, Zhejiang Provincial People’s Hospital, Affiliated People’s Hospital, Hangzhou Medical College, Hangzhou, Zhejiang Province, 310014, People’s Republic of China; 2Department of Postgraduate Training Base Alliance of Wenzhou Medical University, Wenzhou, Zhejiang Province, People’s Republic of China; 3Department of Public Health, Hangzhou Medical College, Hangzhou, Zhejiang Province, 310059, People’s Republic of China; 4Department of General Surgery, Zhoushan Dinghai Central Hospital, Dinghai District of Zhejiang Provincial People’s Hospital, Zhoushan, Zhejiang Province, 316000, People’s Republic of China
Correspondence: Fangqiang Wei, Department of General Surgery, Cancer center, Division of Hepatobiliary and Pancreatic Surgery, Zhejiang Provincial People’s Hospital, Affiliated People’s Hospital, Hangzhou Medical College, Hangzhou, Zhejiang Province, 310014, People’s Republic of China, Email [email protected]
Background: Very early recurrence (VER), defined as recurrence within one year after curative resection of hepatocellular carcinoma (HCC), significantly impacts long-term survival. This study aimed to develop and validate the ANT Score, a novel prognostic model integrating nutrition, inflammation, and tumor burden to refine VER prediction.
Methods: A retrospective cohort of HCC patients undergoing curative liver resection was analyzed. Key predictors were identified using least absolute shrinkage and selection operator (LASSO) regression and multivariate logistic regression, forming the ANT Score. Model performance was evaluated through receiver operating characteristic (ROC) curve analysis, DeLong’s test, calibration curves, and decision curve analysis (DCA). The prognostic value of capsule integrity was also assessed.
Results: Among 459 included patients, 118 (25.7%) experienced VER. Patients were randomly assigned to training (70%) and test (30%) cohorts. The ANT Score, comprising albumin-to-alkaline phosphatase ratio (AAPR), neutrophil-to-albumin ratio (NPAR), and tumor burden score (TBS), demonstrated superior predictive performance (area under the curve [AUC] = 0.751, 95% confidence interval: 0.669– 0.832, P < 0.05) compared to conventional markers. Capsule incompleteness was an independent risk factor but did not significantly enhance predictive accuracy (AUC = 0.76 vs 0.751, P > 0.05, DeLong test). The ANT Score-based nomogram exhibited excellent calibration and clinical utility in DCA.
Conclusion: The ANT Score is an independent and superior predictor of VER after curative HCC resection. The ANT Score-based nomogram showed promising predictive value, offering a practical tool for individualized risk assessment. External validation and prospective studies are warranted to further assess its clinical applicability.
Keywords: hepatocellular carcinoma, very early recurrence, ANT score, curative resection, model
Introduction
Liver cancer ranks as the third leading cause of cancer-related mortality worldwide, with hepatocellular carcinoma (HCC) accounting for 90% of primary liver malignancies and posing a significant global health burden.1–3 Curative liver resection remains the cornerstone of HCC treatment, endorsed by major clinical guidelines such as those from the European Association for the Study of the Liver (EASL) and the American Association for the Study of Liver Diseases (AASLD).3–5 However, long-term outcomes are marred by high postoperative recurrence rates, exceeding 70% within five years, which drastically diminishes overall survival.6,7 Among these recurrences, very early recurrence (VER), defined as recurrence within one year post-resection, represents an aggressive subset associated with particularly poor prognosis.8,9 Unlike late recurrence, which often stems from de novo tumors, VER is primarily driven by pre-existing microscopic metastases, reflecting inherent tumor aggressiveness.10,11 Although a 2-year threshold remains the conventional standard for defining early recurrence, accumulating evidence indicates that shorter intervals may better identify aggressive disease patterns, with the 1-year definition now established as VER.12
Despite its clinical significance, predictive models for VER remain underdeveloped. Emerging evidence highlights the roles of nutritional depletion, systemic inflammation, and tumor burden in driving VER, yet existing models fail to integrate these multidimensional factors.13,14 Nutritional deficiency impairs host defenses, whereas systemic inflammation facilitates tumor progression via immune evasion and microenvironmental modulation, and tumor burden serves as a marker of intrinsic aggressiveness.15–17 Traditional prognostic scores, such as albumin-bilirubin (ALBI), systemic immune-inflammation index (SII), neutrophil-to-lymphocyte ratio (NLR), and tumor burden score (TBS), are limited by their single-dimensional focus. These models inadequately account for the critical interplay of nutritional, inflammatory, and tumor-related factors in patients with VER.14,18 Previous studies have explored composite prognostic models that integrate hepatic function, tumor burden, and host-related factors such as nutritional or inflammatory status, and these multidimensional approaches have shown improved performance for predicting overall or recurrence-free survival in HCC19,20 However, such models were not specifically designed for very early recurrence (VER), a biologically distinct and clinically aggressive entity within the first postoperative year. To date, no dedicated tool has systematically incorporated these dimensions into a single framework targeting VER prediction. To address this gap, we developed and validated the ANT Score, a novel prognostic model that integrates nutrition, inflammation, and tumor burden to enhance VER prediction. By enabling early risk stratification, this model may facilitate timely interventions, ultimately improving long-term outcomes for HCC patients.
Methods
Patients
This retrospective cohort study included consecutive HCC patients who underwent curative liver resection at Zhejiang Provincial People’s Hospital between October 2018 and December 2023. The ethics approval was obtained on May 14, 2025 for the subsequent research activity, which involved a retrospective review and analysis of the data generated from those past surgeries. The current study adhered to the principles outlined in the Declaration of Helsinki and received approval (Approval NO.: ZJPPHEC 2025O(120)) from the Institutional Review Board of Zhejiang Provincial People’s Hospital. Because of the retrospective nature of this study, the Institutional Review Board of Zhejiang Provincial People’s Hospital waived the need of obtaining informed consent. Patients were stratified by VER status (recurrence within one year post-resection). Exclusion criteria comprised: (1) extrahepatic metastasis, (2) history of other malignancies, (3) perioperative mortality, (4) incomplete medical records, and (5) loss to follow-up within one year. The study adhered to Strengthening the Reporting of Observational Studies in Epidemiology (STROBE) guidelines.
Data Collection and Variables
We retrospectively analyzed clinical and pathological data from the Hospital Information System (HIS) of Zhejiang Provincial People’s Hospital, including three categories of variables: (1) demographic characteristics (age, gender, smoking/drinking history, hypertension, diabetes, American society of Aneshesiologists classification, cirrhosis status, and liver disease etiology); (2) tumor-related parameters including Barcelona Clinic Liver Cancer (BCLC) staging system, Child-Pugh grade, clinically significant portal hypertension, tumor markers (alpha-fetoprotein[AFP], carbohydrate antigen 19–9[CA19-9]), pathological features (microvascular invasion, tumor differentiation, capsule integrity), and surgical details (resection margin, anatomical resection, intraoperative blood loss, portal vein occlusion, operation time); and (3) seventeen biochemical/composite indices evaluating tumor biology and systemic status - nutritional indices (albumin-to-alkaline phosphatase ratio[AAPR], prognostic nutritional index[PNI], hemoglobin, albumin, lymphocyte, and platelet score[HALP], ALBI), inflammatory markers (neutrophil-to-albumin ratio[NPAR], NLR, SII), fibrosis/tumor burden scores (TBS, fibrosis-4 index[FIB-4], gamma-glutamyl transpeptidase-to-platelet ratio[GPR], total tumor volume[TTV]), and standard liver function tests (alanine aminotransferase[ALT], aspartate aminotransferase[AST], alkaline phosphatase[ALP], gamma-glutamyl transferase [GGT], prothrombin time[PT], international normalized ratio[INR]).
The calculation methods for all composite indices were as follows: the ALBI score was computed using the formula log10(bilirubin [μmol/L]) × 0.66 − albumin [g/L] × 0.085; the AAPR as albumin [g/L]/ALP [IU/L]; the GPR as GGT [μ/L]/platelet count; and the HALP index as hemoglobin [g/L] × albumin [g/L] × lymphocyte count/platelet count. Inflammatory markers were calculated with NLR as neutrophil count/lymphocyte count and NPAR as neutrophil count/albumin [g/L]. Nutritional status was assessed through PNI (albumin [g/L] + 5 × lymphocyte count) and SII (platelet count × neutrophil count/lymphocyte count). Liver fibrosis was estimated using the FIB-4 index (age × AST)/(platelet count × √ALT). Tumor characteristics were quantified by TBS (√[(maximum tumor diameter [cm])2 + (tumor number)2]) and TTV ((4/3) × π × (maximum tumor radius [cm])3).
Follow‑Up
Patients received postoperative surveillance through combined clinical follow-up (outpatient visits and telephone interviews) and HIS records monitoring. The surveillance plan included routine imaging evaluations (computed tomography/magnetic resonance imaging) and serum tumor marker testing at 3–6 month intervals during the initial 24 postoperative months, with subsequent annual assessments. VER was strictly defined as radiologically or histologically confirmed tumor recurrence occurring within 12 months after curative resection.
Statistical Analysis
Statistical analysis was performed in three stages. First, the distribution patterns of all 17 continuous variables were visualized using box-scatter plots to compare recurrence versus non-recurrence groups. Normality testing was performed with the Shapiro–Wilk method, with normally distributed variables analyzed by independent t-tests and non-normal variables evaluated using Wilcoxon rank-sum tests. Statistical significance was set at p<0.05 for identifying potential VER-associated factors.
Second, the dataset was randomly divided into training (70%) and testing (30%) cohorts. The primary outcome was defined as VER, referring to radiologically or histologically confirmed tumor relapse within 12 months following curative resection. Given its binary nature, logistic regression was deemed statistically appropriate and aligns with prior studies modeling early recurrence in hepatocellular carcinoma.21–24 The training cohort underwent variance inflation factor (VIF) analysis to assess multicollinearity. In line with prior recommendations, predictors with VIF >10 were excluded, and all remaining variables demonstrated VIF <5, which is considered an acceptable threshold for minimizing residual collinearity.25,26 Subsequently, least absolute shrinkage and selection operator (LASSO) regression with 10-fold cross-validation was applied to identify the most relevant predictors, selecting the penalty parameter (λ) based on the 1-standard error rule. The retained variables were then entered into a multivariate logistic regression model to determine independent risk factors. The β coefficients from these variables were utilized to develop the ANT Score, a composite index integrating nutritional, inflammatory and tumor burden parameters. This score, combined with categorical clinical variables, underwent both univariate and multivariate logistic regression analyses, with variables demonstrating p<0.1 in univariate analysis progressing to multivariate modeling to establish the final independent predictors.
Third, model validation was performed on the testing cohort through ROC curve analysis (assessing discrimination) and DeLong’s test (comparing models). The ANT Score’s predictive performance was benchmarked against conventional markers (nutritional, inflammatory, hepatic function, tumor burden) and combined models. The optimal model was transformed into a nomogram, with calibration curves and DCA evaluating its accuracy and clinical applicability. To further evaluate the temporal stability of the ANT Score, sensitivity analyses were conducted by redefining recurrence at 6 and 18 months. Logistic regression was repeated for each cutoff, and odds ratios (ORs) with 95% confidence intervals (CIs) were calculated.
In addition, survival analyses were performed to further assess the predictive performance of the ANT Score over time. Cox proportional hazards models were fitted with surgery as the time origin, and predictive discrimination was quantified using C-index with 95% confidence intervals. Landmark Cox analysis was conducted by restricting the cohort to patients who remained recurrence-free at 12 months, with follow-up re-initiated from this point. Time-dependent ROC analyses at 6 and 12 months were used to estimate the AUC, while calibration-over-time was examined using calibration plots at both time points.
To evaluate the potential clinical utility of the ANT Score in surveillance planning, we simulated two alternative follow-up strategies during the first postoperative year, drawing on approaches previously applied in surveillance modeling studies.27,28 Patients were stratified into high-risk and low-risk groups. The standard strategy applied uniform 6-monthly imaging, whereas the risk-stratified strategy adopted intensified 3-monthly imaging for the high-risk group and standard 6-monthly imaging for the low-risk group. For each scenario, we estimated the detection rate of VER and the corresponding imaging burden, expressed as the total number of scans performed. Statistical analyses were conducted using IBM SPSS Statistics (v26.0) for data management and R software (v4.4.2) for advanced analytics, including descriptive statistics, comparative analyses, LASSO regression, predictive modeling, validation, and graphical visualizations.
Results
Patients Characteristics
This study enrolled 459 HCC patients who had undergone curative liver resection, with 118 (25.7%) developing VER within one postoperative year. Patients were randomly allocated to training (70%) and testing (30%) cohorts for model development and validation (Table S1), with balanced baseline characteristics (all p>0.05).
Table 1 compares clinicopathological and biochemical features between VER and non-VER groups. Significant categorical predictors included drinking history (p=0.033), advanced BCLC stage (p<0.001), AFP>400 ng/mL (p=0.008), microvascular invasion (p=0.011), poor differentiation (p<0.001), incomplete capsule (p=0.043), and intraoperative blood loss>400 mL (p=0.002). Continuous variables, tested for normality (Shapiro–Wilk test) and analyzed appropriately (independent t-test or Wilcoxon rank-sum test), showed significant differences in AST, ALP, GGT, PT, INR, NLR, NPAR, PNI, ALBI, AAPR, FIB-4, GPR, HALP, TTV, and TBS (all p<0.05, Figure S1).
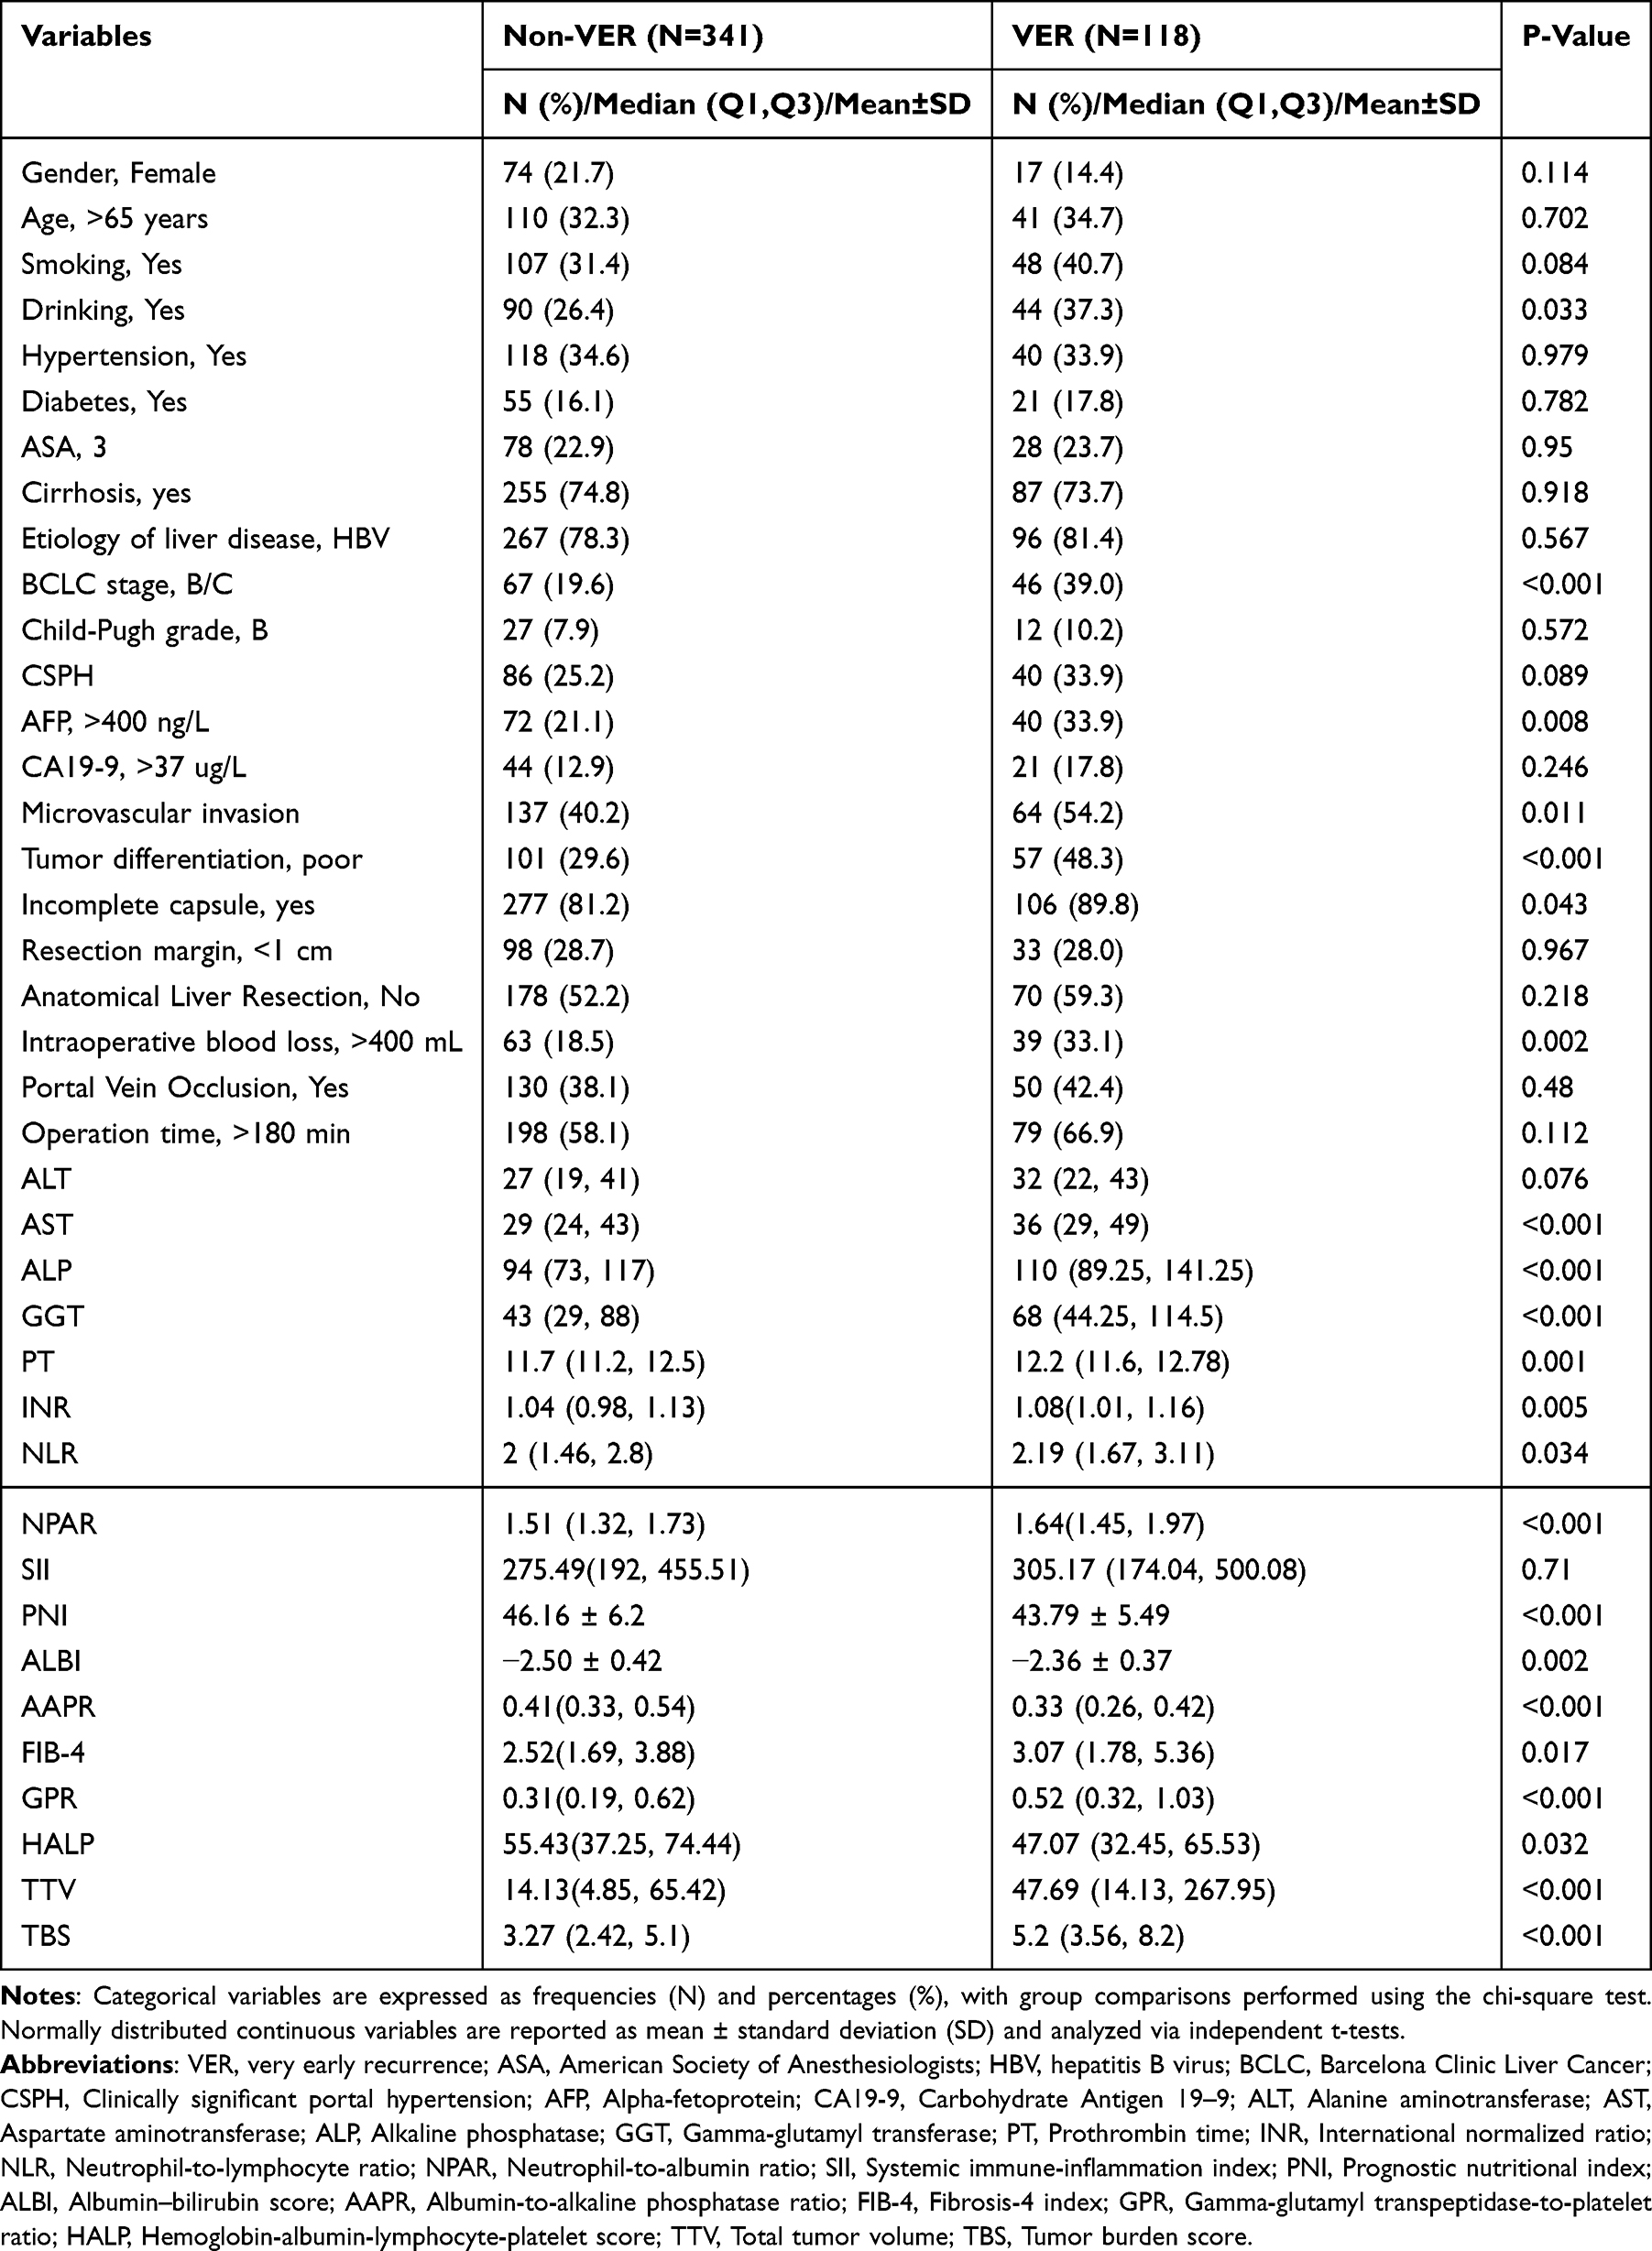 |
Table 1 Comparison of Clinicopathological Characteristics in VER and Non-VER Sets |
Variable Selection and Model Construction
To identify key VER predictors, multicollinearity among 17 continuous variables was evaluated via VIF analysis. GGT and PNI exhibited the highest VIF values (12.39 and 8.75, respectively; Figure 1A), exceeding the threshold of 5, suggesting significant collinearity. After their removal, subsequent VIF analysis (Figure 1B) confirmed acceptable collinearity (all VIFs <5). To optimize variable selection and minimize overfitting, LASSO regression was performed in the training cohort. Cross-validation (Figure 2) determined the optimal λ, selecting five predictors: AAPR, TBS, NPAR, SII, and FIB-4. Multivariate logistic regression then identified independent prognostic factors (Table 2). Among these, AAPR (odds ratio[OR]=0.125, 95% confidence interval[CI]:0.017–0.922, p=0.041), TBS (OR=1.130, 95% CI:1.040–1.220, p=0.003), and NPAR (OR=3.890, 95% CI:1.630–9.250, p=0.002) remained significant. SII and FIB-4, though LASSO-selected, lacked significance (p>0.05) and were excluded from the final model.
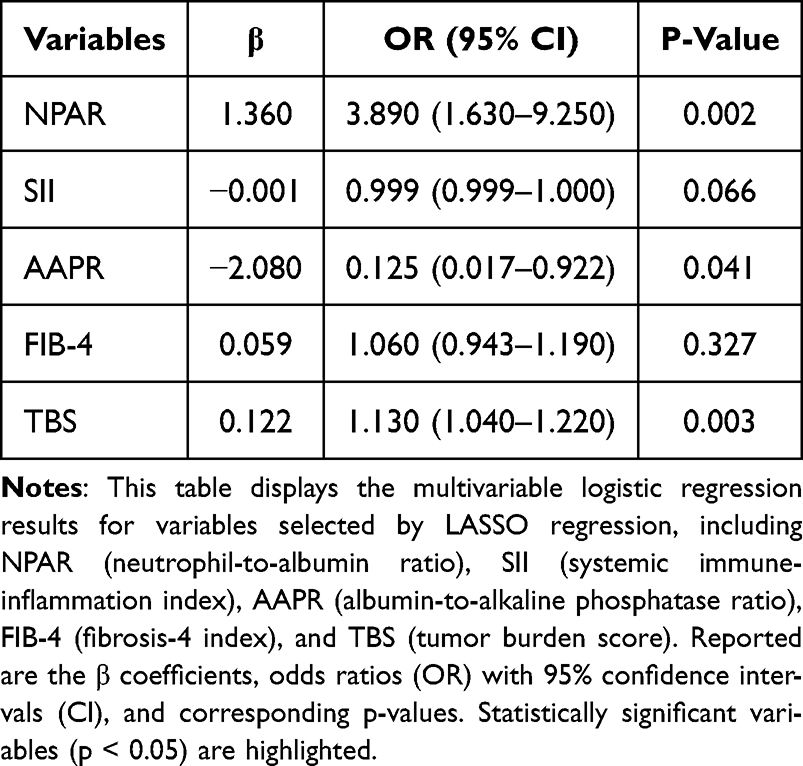 |
Table 2 LASSO-Multivariable Logistic Regression Results |
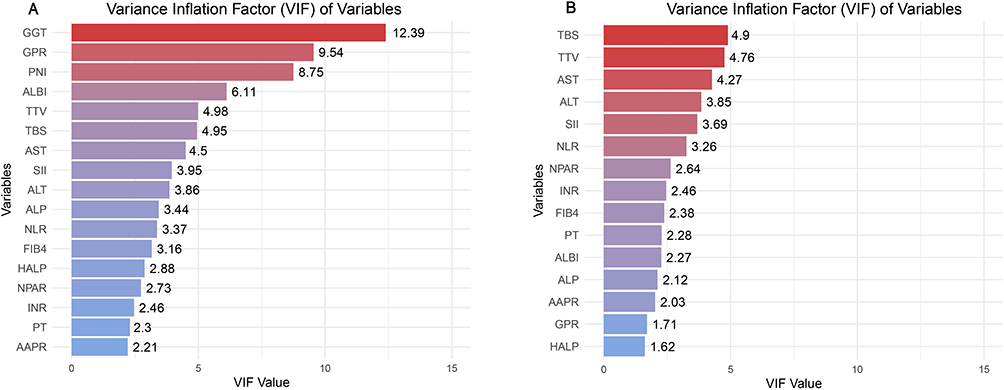 |
Figure 1 Variance Inflation Factor (VIF) of selected variables. (A) Presents bar plots of VIF values for each variable, demonstrating their multicollinearity levels. (B) Shows the updated VIF values after excluding highly collinear variables (GGT and PNI), with all remaining variables exhibiting VIF <5, confirming the regression model’s stability. |
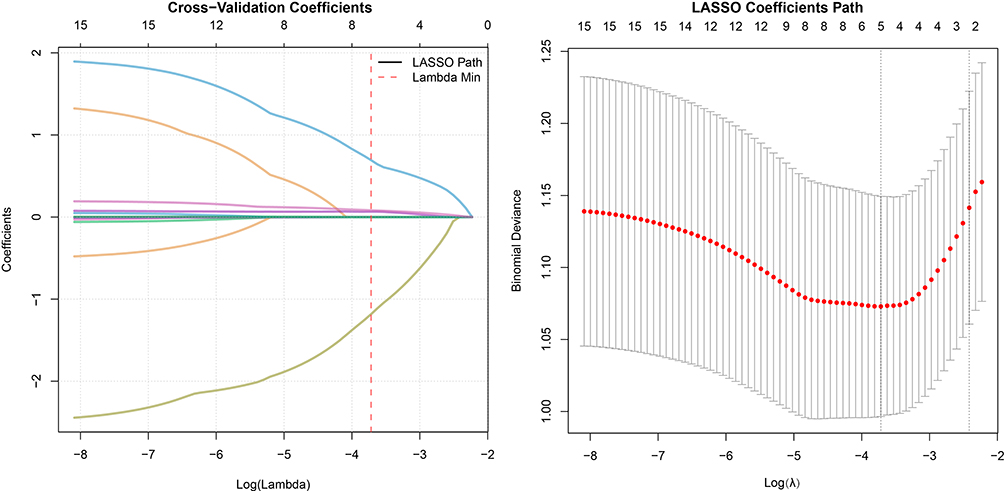 |
Figure 2 LASSO regression coefficients and cross-validation results. The left panel displays the LASSO coefficient paths, showing how variable coefficients vary with log(Lambda). The red dashed line marks Lambda Min, the value minimizing cross-validation error. The right panel shows the binomial deviance versus lambda, with red dots indicating deviance values at each lambda point. |
The ANT Score, a novel composite risk score, was developed using logistic regression β coefficients:

where the β coefficients were as follows: NPAR: β=1.360, TBS: β=0.122, AAPR: β=−2.080, yielding:

To assess predictive performance, ANT Score was compared with clinical parameters via univariate logistic regression (p<0.1 threshold for multivariate inclusion). As shown in Table 3, independent VER predictors were ANT Score (OR=2.40, 95% CI:1.70–3.39, p<0.001) and incomplete capsule (OR=3.71, 95% CI:1.39–9.90, p=0.009). The optimal ANT Score cutoff (2.025) was determined by Youden’s index in the training set and validated in the test set for risk stratification, enabling reliable high-risk patient identification.
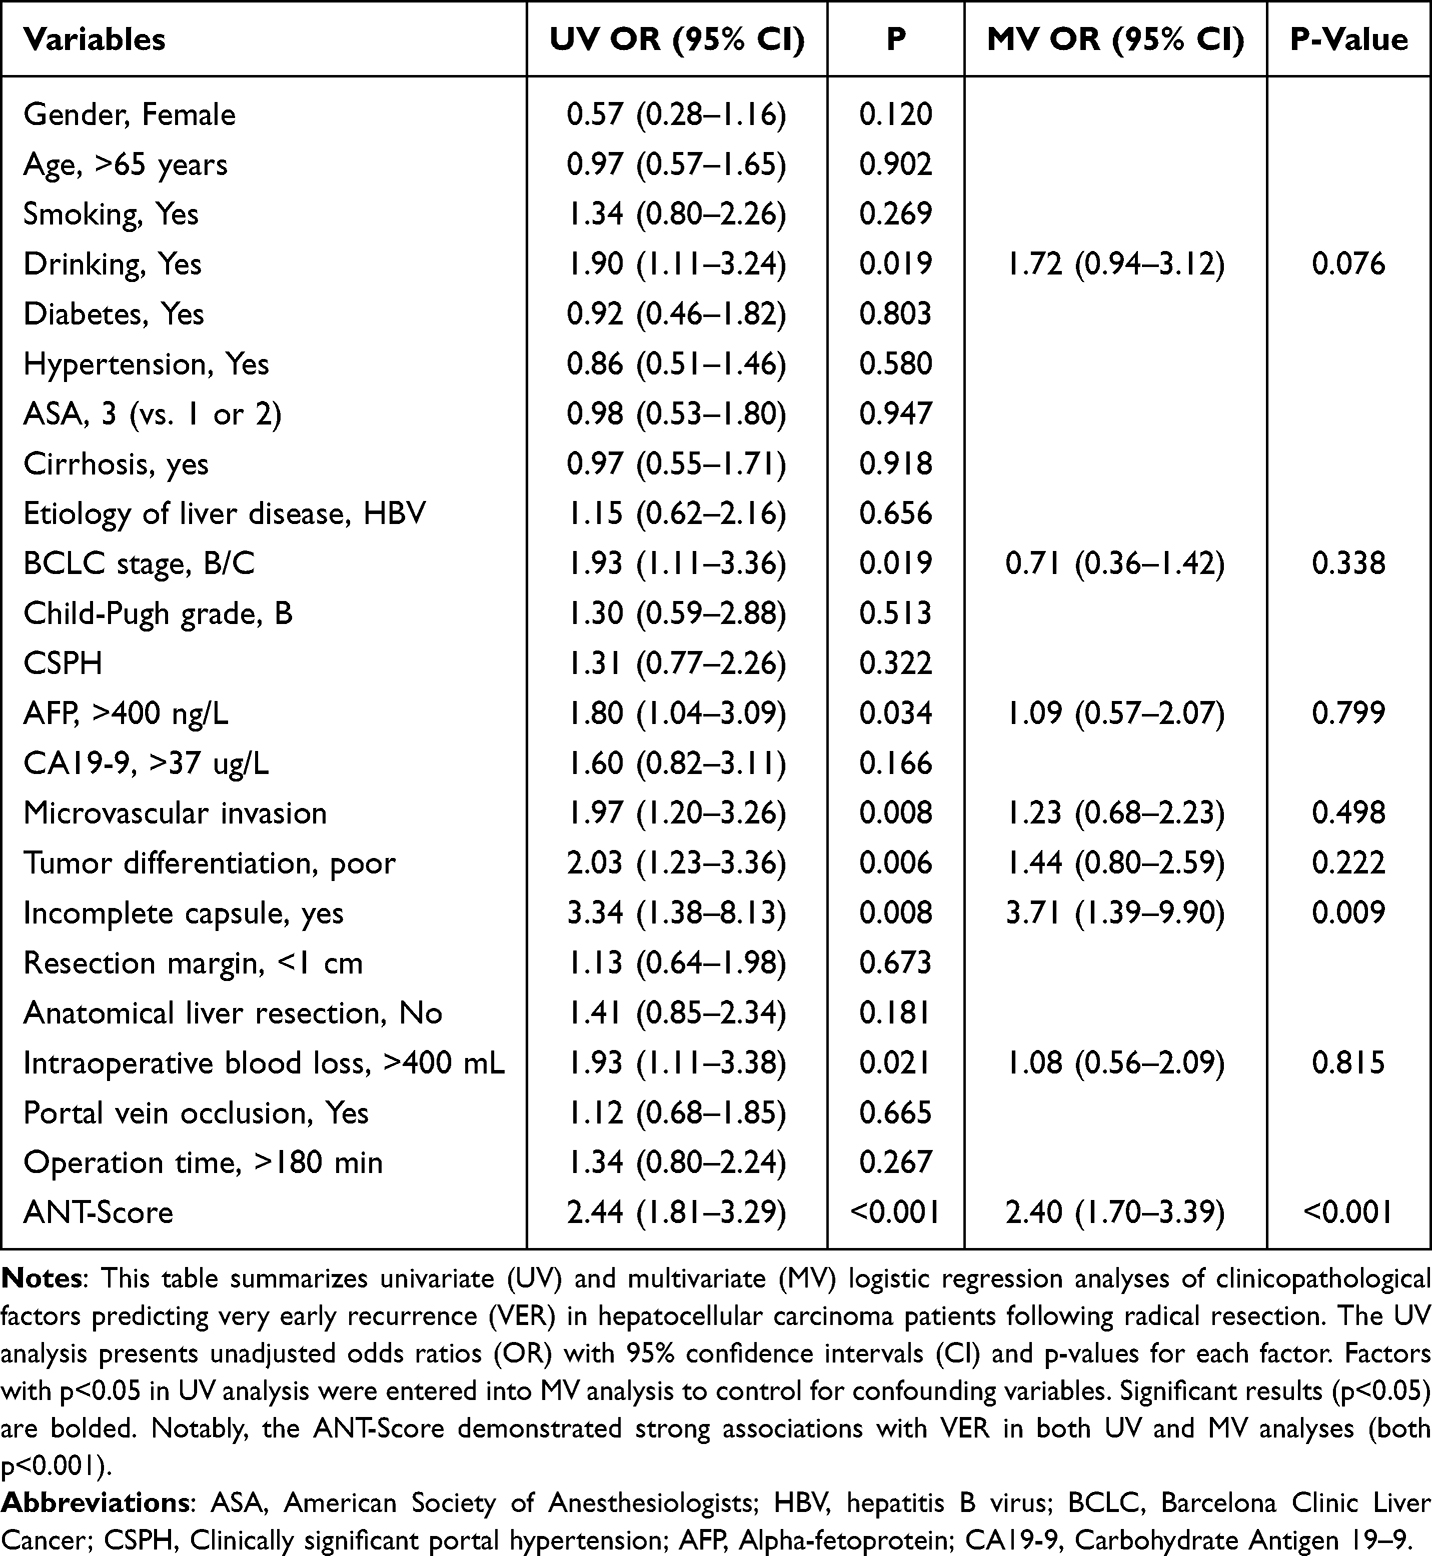 |
Table 3 Univariate and Multivariate Analyses of the VER for Hepatocellular Carcinoma After Radical Resection in the Training Set |
Model Performance Evaluation and Comparison
We compared its performance with conventional models including NPAR, TBS, AAPR, FIB-4, SII, HALP, and ALBI (Table 4). The ANT Score achieved the highest discrimination for VER prediction, with an AUC of 0.751 (95% CI, 0.669–0.832), outperforming all other models (Figure 3A). It also showed superior overall accuracy (lowest Brier score), favorable calibration (slope 1.34, intercept 0.49), and balanced predictive ability as reflected by sensitivity/specificity and PPV/NPV values. Collectively, these findings highlight the incremental value of integrating nutritional, inflammatory, and tumor burden parameters in the ANT Score over single-dimension models.To assess potential improvement, we incorporated capsule integrity into an extended model (Figure 3B), which achieved an AUC of 0.76 (95% CI:0.672–0.848). However, DeLong’s test showed no significant difference (p=0.6956), demonstrating that adding capsule integrity provided minimal predictive enhancement.
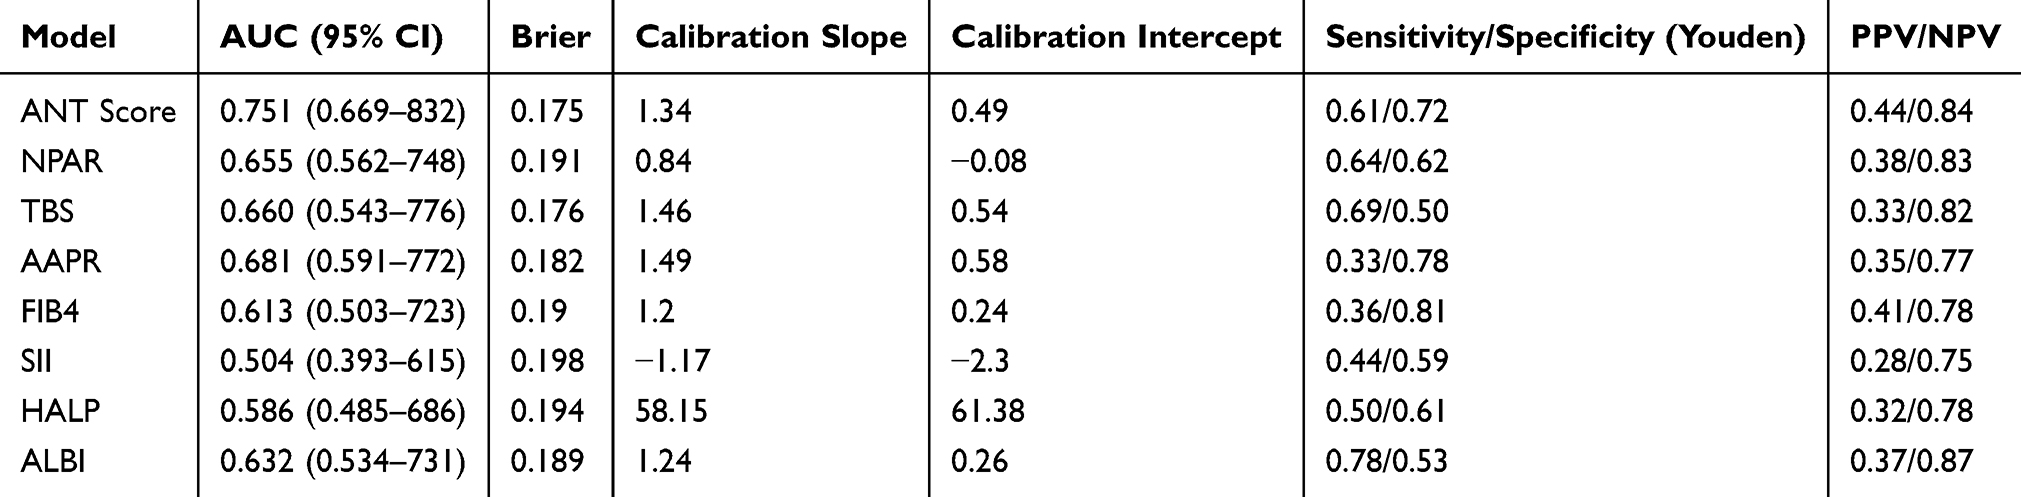 |
Table 4 Comparison of Multiple Prognostic Models for Predicting VER |
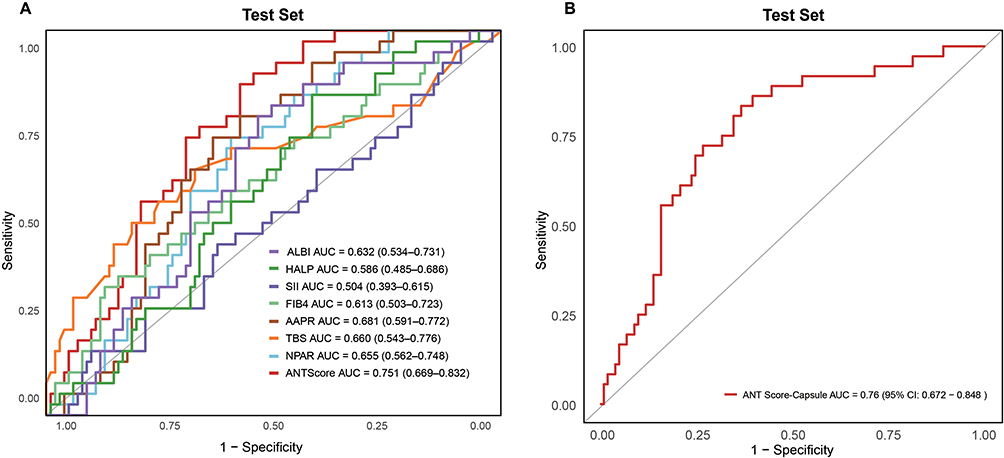 |
Figure 3 ROC curve analysis for predicting VER in the test set. (A) displays the ROC curve of the ANT Score for VER prediction. (B) shows the ROC curve combining ANT Score with capsule integrity. AUC values with 95% CIs are presented. The ANT Score achieves the highest AUC, demonstrating optimal VER prediction, while the combined model exhibits marginally better performance than ANT Score alone. |
In the primary Cox model with surgery as the time origin, the ANT Score achieved a C-index of 0.674 (95% CI, 0.592–0.756) in the testing cohort. Time-dependent ROC analyses further confirmed good performance, with an AUC of 0.738 (95% CI, 0.637–0.839) at 6 months and 0.747 (95% CI, 0.656–0.837) at 12 months (Figure 4A). Calibration curves at both time points showed good agreement between predicted and observed recurrence probabilities (Figure 4B). In the landmark Cox analysis restricted to patients who remained recurrence-free at 12 months, the model yielded a C-index of 0.555 (95% CI, 0.410–0.700), indicating diminished discrimination for predicting recurrence beyond the first postoperative year. In sensitivity analyses using alternative recurrence cutoffs, the ANT Score consistently demonstrated predictive value. At 6 months, the OR was 1.789 (95% CI, 1.398–2.303; p < 0.001), at 12 months 2.099 (95% CI, 1.667–2.675; p < 0.001), and at 18 months 1.927 (95% CI, 1.551–2.423; p < 0.001) (Table S2). These findings support the temporal stability of the ANT Score.
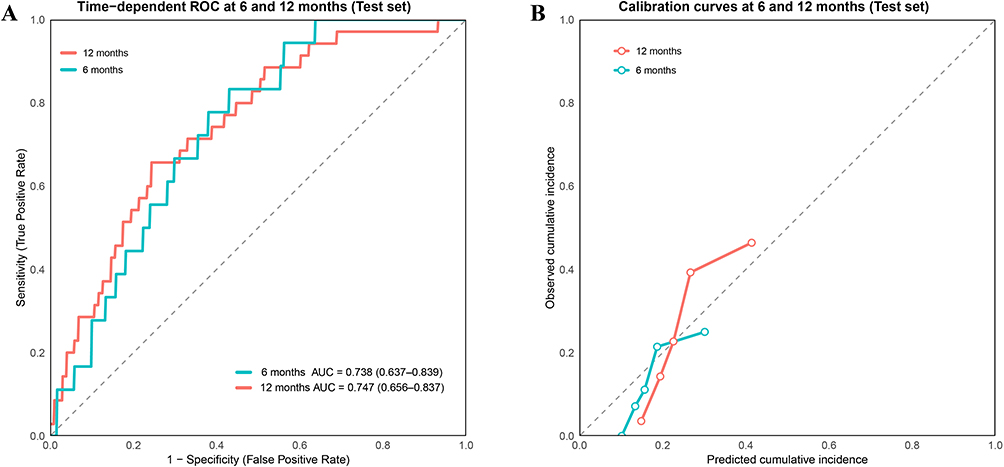 |
Figure 4 Time-dependent discrimination and calibration of the ANT Score model. (A) Time-dependent ROC curves for predicting very early recurrence (VER) at 6 and 12 months in the test cohort. The model showed consistent discrimination with an AUC of 0.738 (95% CI, 0.637–0.839) at 6 months and 0.747 (95% CI, 0.656–0.837) at 12 months. (B) Calibration curves at 6 and 12 months in the test cohort, demonstrating good agreement between predicted and observed recurrence probabilities. |
To improve clinical applicability, we developed a nomogram for individualized VER risk estimation in HCC patients (Figure 5A), where higher ANT Scores indicated greater recurrence risk. Calibration analysis (Figure 5B) showed excellent agreement between predicted and observed outcomes, affirming model reliability. DCA (Figure 5C) confirmed the ANT Score’s clinical utility, outperforming alternative strategies (treat all vs treat none) across threshold probabilities. With robust discrimination, calibration, and clinical relevance, the ANT Score emerged as the optimal VER predictor. Although capsule integrity integration offered no significant improvement, the ANT Score alone provided superior prognostic stratification, enhancing personalized risk assessment.
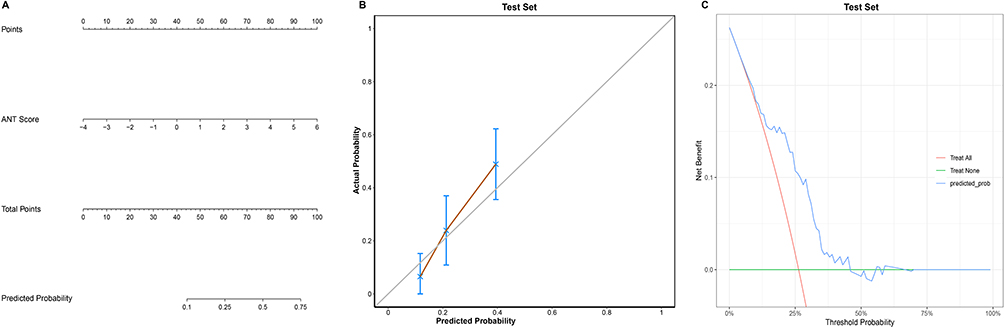 |
Figure 5 Nomogram based on the ANT Score, Calibration Curve, and Decision Curve Analysis (DCA). (A) Presents the VER prediction nomogram for HCC patients, incorporating the ANT Score. Total points translate to VER probability, offering clinicians a practical risk assessment tool. (B) demonstrates the calibration plot comparing predicted versus observed VER probabilities, with 95% CI error bars. (C) shows the DCA evaluating the ANT Score’s clinical utility, plotting net benefit across threshold probabilities against “treat-all” and “treat-none” strategies. |
To enhance usability, we deployed an interactive web-based calculator (https://doctoryu.shinyapps.io/ANT-Score-Calculator/), enabling clinicians to rapidly compute individualized ANT Scores by entering albumin, ALP, neutrophil percentage, and tumor characteristics. A screenshot of the interface is presented in Figure S2, illustrating its straightforward functionality and potential for integration into clinical workflows.
Simulation analysis suggested that a risk-stratified surveillance approach, with intensified 3-monthly imaging for high-risk patients, could improve VER detection (82.1% vs 72.6% under standard biannual surveillance) at the expense of increased imaging load (1278 vs 918 total scans) (Figure S3). This trade-off highlights the potential clinical benefit of tailoring follow-up intensity according to the ANT Score.
Discussion
VER, characterized by HCC recurrence within one year post-curative resection, poses a major clinical challenge by substantially impairing long-term survival. Precise preoperative identification of high-risk patients is crucial for optimizing postoperative care, yet current prediction models primarily focus on tumor morphology or isolated biomarkers, compromising their accuracy and utility. For instance, prior studies have identified tumor diameter as an independent VER predictor, emphasizing tumor burden’s role.8,29 However, morphology-based approaches overlook the complex biological mechanisms driving recurrence. Likewise, while individual nutritional/inflammatory markers (NLR, ALBI, PNI) show associations with early recurrence, their predictive value is constrained by their unidimensional perspective and failure to accurately assess integrated recurrence risk.30,31 To overcome these limitations, we established the ANT Score, incorporating critical clinical elements—nutritional status, systemic inflammation, and tumor burden—offering a more holistic assessment of VER in HCC.
AAPR as a Prognostic Biomarker in HCC
The AAPR, a novel biomarker derived from serum ALB and ALP levels, has demonstrated significant correlation with HCC recurrence rates.32,33 Zhang et al’s meta-analysis demonstrated that decreased AAPR serves as a robust prognostic indicator in HCC, revealing a significant association between lower AAPR values and poorer survival outcomes, including reduced overall survival (OS) (hazard ratio[HR] 2.02, 95% CI: 1.78–2.30) and shorter recurrence-free survival (RFS) (HR 1.88, 95% CI: 1.37–2.57).34 ALB serves as a key nutritional indicator, with reduced levels reflecting malnutrition or liver dysfunction. In HCC patients, prevalent nutritional impairments compromise immunity, elevating recurrence risk. Importantly, ALB depletion promotes HCC progression by facilitating metastasis. Studies demonstrate that ALB deficiency markedly boosts HCC cell invasion and migration.35,36 Consequently, ALB represents a vital predictor for both tumor recurrence and disease progression. ALP, a well-established indicator of hepatic impairment, is typically elevated in HCC-associated liver damage and cholestasis. Elevated ALP levels reflect chronic hepatic inflammation, which fosters a tumor-favorable microenvironment that accelerates HCC progression and recurrence.37 Yu et al revealed that preoperative ALP levels >82 U/L significantly predict higher recurrence risk in HCC patients, with those exceeding this threshold demonstrating markedly poorer recurrence outcomes versus patients with ALP ≤82 U/L (p<0.001).38 The ANT Score’s incorporation of AAPR significantly improves early HCC recurrence prediction, demonstrating superior performance (AUC=0.751; 95% CI:0.669–0.832) versus AAPR alone (AUC=0.681; 95% CI:0.591–0.772), resulting in enhanced predictive accuracy.
NPAR as a Novel Biomarker for HCC Recurrence
NPAR, derived from neutrophil percentage and ALB, quantifies systemic inflammation and nutritional status - critical determinants of HCC progression. Although no direct studies link NPAR to HCC recurrence, its known association with liver inflammation and fibrosis—critical processes in HCC pathogenesis—supports its potential prognostic value. NPAR’s consistent associations with nonalcoholic fatty liver disease progression, advanced fibrosis, and metabolic liver diseases further justify investigating NPAR’s role in predicting HCC recurrence.39,40 Neutrophils actively drive HCC progression and recurrence by establishing a tumor-favorable microenvironment.41,42 Their pro-tumor effects are amplified through neutrophil extracellular traps, which capture HCC cells, augment metastatic capacity, and induce Sorafenib resistance.43,44 Concurrently, hypoalbuminemia, indicating malnutrition and immunosuppression, independently elevates recurrence risk.13 The synergistic effect of neutrophilia and hypoalbuminemia markedly increases HCC recurrence probability. As a composite biomarker reflecting these critical pathways, NPAR (AUC=0.655, 95% CI: 0.562–0.748) offers a biologically validated recurrence predictor. When incorporated into the ANT Score (AUC=0.751, 95% CI: 0.669–0.832), it markedly improves VER prediction accuracy, thereby boosting the model’s clinical applicability.
Tumor Burden in HCC Recurrence Prediction
The TBS serves as a robust prognostic indicator for HCC, quantifying disease extent through two critical parameters: tumor size and lesion number. These well-established predictors significantly influence VER risk post-curative resection.14,45 Tumor size directly correlates with disease aggressiveness. HCC lesions exceeding 5 cm commonly exhibit vascular invasion and metastatic propensity,46 with robust evidence linking them to higher recurrence rates post-curative treatment.47,48 Feng et al demonstrated that >5 cm tumors independently predicted both macrotrabecular-massive subtype (OR 3.8, 95% CI:1.7–8.1) and vascular invasion (OR 5.4, 95% CI:1.3–23.3) - two established predictors of poor postoperative outcomes and elevated recurrence.49 This parameter effectively captures both local invasiveness and distant dissemination risk. Lesion multiplicity similarly impacts prognosis,50,51 with multifocal disease representing advanced HCC biology and poorer outcomes.52,53 Multiple tumors substantially increase VER likelihood by presenting greater therapeutic challenges. When integrated into TBS, these parameters form a powerful composite biomarker for recurrence risk. The ANT Score, integrating TBS with additional prognostic factors, showed superior predictive performance (AUC=0.751; 95% CI:0.669–0.832) compared to TBS alone (AUC=0.660; 95% CI:0.543–0.776), demonstrating a clinically meaningful enhancement in VER prediction accuracy.
Tumor Capsule Integrity in HCC Prognosis
An incomplete tumor capsule has been established as a crucial prognostic factor for HCC recurrence. Huang et al found that incomplete encapsulation, when combined with large tumor size and vascular invasion, strongly predicts higher recurrence rates in patients with macroscopic vascular invasion, underscoring its prognostic significance.54 Likewise, Jun L. et al confirmed incomplete capsule, microvascular invasion, and tumor size as independent predictors of postoperative extrahepatic metastasis and recurrence (AUC=0.82).55 These results underscore the prognostic value of capsule integrity in HCC recurrence and metastasis post-resection. Although adding capsule data to the ANT Score marginally improved the AUC (0.76 vs 0.751), DeLong’s test showed no significant enhancement (p=0.6956), suggesting the existing ANT Score components already effectively capture recurrence risk. The model’s current tumor characteristics provide sufficient predictive power without capsule data, which would introduce additional complexity without meaningful benefit. Thus, we retained the original ANT Score to preserve its clinical practicality and predictive efficiency.
Clinical Advantages and Novelty of the ANT Score
The ANT Score synergistically combines AAPR, NPAR, and TBS to offer a multidimensional approach for predicting VER in post-resection HCC. Distinct from conventional models focusing solely on tumor morphology or single biomarkers, it comprehensively evaluates nutritional status, systemic inflammation, and tumor burden. Existing HCC prognostic models emphasize long-term outcomes (OS/RFS) using parameters like AAPR, TBS, or PNI,19 the ANT Score specifically targets VER prediction. Although the ANT Score achieved numerically higher AUC values compared with conventional indices, the absolute differences were modest. Nevertheless, its consistent performance across multiple evaluation domains—including discrimination, calibration, overall accuracy, and net clinical benefit—suggests that the integration of nutritional, inflammatory, and tumor burden parameters may provide more balanced and clinically meaningful risk stratification than single-dimension models.
Study Limitations and Future Research Directions
Several aspects of the current study should be acknowledged when interpreting the findings. Our study was conducted in a single-center HBV-predominant cohort, which inevitably limits the external generalizability of the ANT Score, particularly in non-Asian and non-HBV populations. The robustness of the score in this high-risk population underscores its clinical utility in regions with similar disease profiles. Future work should focus on external validation across multicenter and international cohorts with diverse etiologies, including HCV- and metabolic-related HCC, to ensure broader applicability and to refine the model for global use Additionally, our model did not incorporate molecular markers, such as circulating tumor DNA, or imaging-based radiomics, which may further enhance predictive accuracy. Future research should focus on prospective, multicenter validation to establish broader clinical applicability and explore integration with molecular markers, including circulating tumor DNA and immune checkpoint profiles. Application of advanced machine learning algorithms may also further refine predictive accuracy, providing more personalized risk assessments and interventions for patients. Our dataset did not consistently capture competing events such as death without recurrence, precluding the robust application of cause-specific Cox or Fine–Gray models. This limitation reflects the inherent constraints of retrospective clinical datasets, and future prospective studies with more comprehensive event recording are warranted to address this gap.
Conclusion
The ANT Score is an independent and superior predictor of VER after curative HCC resection. The ANT Score-based nomogram showed promising predictive value, offering a practical tool for individualized risk assessment. External validation and prospective studies are warranted to further assess its clinical applicability.
Data Sharing Statement
The data gathered in the current study are available from the corresponding author on reasonable request.
Ethics Approval and Patient Data Confidentiality
The study was approved (Approval NO.: ZJPPHEC 2025O(120)) by the Institutional Review Board of Zhejiang Provincial People’s Hospital. As this was a retrospective study using de-identified clinical data, the requirement for patient consent was waived. All patient data were kept strictly confidential and handled in accordance with the Declaration of Helsinki and institutional regulations.
Author Contributions
All authors made a significant contribution to the work reported, whether in the conception, study design, execution, acquisition of data, analysis and interpretation, or in all these areas; took part in drafting, revising, or critically reviewing the article; gave final approval of the version to be published; have agreed on the journal to which the article has been submitted; and agree to be accountable for all aspects of the work.
Funding
The current study was supported by the fund of the Joint Project of Department of Science and Technology of State Administration of Traditional Chinese Medicine and Zhejiang Administration of Traditional Chinese Medicine (No.GZY-ZJ-KJ-23059) to Wei FQ. The funders had no role in study design, data collection and analysis, decision to publish, or preparation of the manuscript.
Disclosure
The authors report no conflicts of interest in this work.
References
1. Vogel A, Meyer T, Sapisochin G, Salem R, Saborowski A. Hepatocellular carcinoma. Lancet. 2022;400:1345–1362. doi:10.1016/S0140-6736(22)01200-4
2. Bray F, Laversanne M, Sung H, et al. Global cancer statistics 2022: GLOBOCAN estimates of incidence and mortality worldwide for 36 cancers in 185 countries. CA Cancer J Clin. 2024;74:229–263. doi:10.3322/caac.21834
3. European Association for the Study of the Liver. EASL Clinical Practice Guidelines on the management of hepatocellular carcinoma. J Hepatol. 2025;82:315–374. doi:10.1016/j.jhep.2024.08.028
4. Heimbach JK, Kulik LM, Finn RS, et al. AASLD guidelines for the treatment of hepatocellular carcinoma. Hepatology. 2018;67:358–380. doi:10.1002/hep.29086
5. Magyar CTJ, Rajendran L, Li Z, et al. Precision surgery for hepatocellular carcinoma. Lancet Gastroenterol Hepatol. 2025:S2468–1253(24)00434–5. doi:10.1016/S2468-1253(24)00434-5.
6. Fuster-Anglada C, Mauro E, Ferrer-Fàbrega J, et al. Histological predictors of aggressive recurrence of hepatocellular carcinoma after liver resection. J Hepatol. 2024:S0168–8278(24)02324–9. doi:10.1016/j.jhep.2024.06.018.
7. Tabrizian P, Jibara G, Shrager B, Schwartz M, Roayaie S. Recurrence of hepatocellular cancer after resection: patterns, treatments, and prognosis. Ann Surg. 2015;261:947–955. doi:10.1097/SLA.0000000000000710
8. Liu L, Qin S, Lin K, et al. Development and comprehensive validation of a predictive prognosis model for very early HCC recurrence within one year after curative resection: a multicenter cohort study. Int J Surg. 2024;110:3401–3411. doi:10.1097/JS9.0000000000001467
9. Hayashi M, Shimizu T, Hirokawa F, et al. Clinicopathological risk factors for recurrence within one year after initial hepatectomy for hepatocellular carcinoma. Am Surg. 2011;77:572–578.
10. Sapisochin G, Goldaracena N, Astete S, et al. Benefit of Treating Hepatocellular Carcinoma Recurrence after Liver Transplantation and Analysis of Prognostic Factors for Survival in a Large Euro-American Series. Ann Surg Oncol. 2015;22:2286–2294. doi:10.1245/s10434-014-4273-6
11. Goldaracena N, Scalera I, Sposito C, et al. Multicenter validation of a score to predict prognosis after the development of HCC recurrence following liver transplantation. HPB. 2019;21:731–738. doi:10.1016/j.hpb.2018.10.005
12. Yamamoto Y, Ikoma H, Morimura R, et al. Optimal duration of the early and late recurrence of hepatocellular carcinoma after hepatectomy. World J Gastroenterol. 2015;21:1207–1215. doi:10.3748/wjg.v21.i4.1207
13. Tsukagoshi M, Araki K, Igarashi T, et al. Lower Geriatric Nutritional Risk Index and Prognostic Nutritional Index Predict Postoperative Prognosis in Patients with Hepatocellular Carcinoma. Nutrients. 2024;16:940. doi:10.3390/nu16070940
14. Guan R, Zheng Z, Deng M, Mei J, Lin Y. Assessment of Tumor Burden Score as a Feasible and Reliable Tool for Prognosis Prediction for Hepatocellular Carcinoma Undergoing Hepatectomy: a Multicenter, Retrospective Study. J Hepatocell Carcinoma. 2025;12:247–260. doi:10.2147/JHC.S488927
15. Liu Y, Xu Q, Deng F, et al. HERC2 promotes inflammation-driven cancer stemness and immune evasion in hepatocellular carcinoma by activating STAT3 pathway. J Exp Clin Cancer Res. 2023;42:38. doi:10.1186/s13046-023-02609-0
16. Wang X-H, Fu Y-L, Xu Y-N, et al. Ginsenoside Rh1 regulates the immune microenvironment of hepatocellular carcinoma via the glucocorticoid receptor. J Integr Med. 2024;22:709–718. doi:10.1016/j.joim.2024.09.004
17. Wu J, Liu W, Qiu X, et al. A Noninvasive Approach to Evaluate Tumor Immune Microenvironment and Predict Outcomes in Hepatocellular Carcinoma. Phenomics. 2023;3:549–564. doi:10.1007/s43657-023-00136-8
18. Huang J, Zhou Y, Wei S, et al. The impact of tumor burden score on prognosis in patients after radical resection of hepatocellular carcinoma: a single-center retrospective study. Front Oncol. 2024;14:1359017. doi:10.3389/fonc.2024.1359017
19. Su Y, Zhong D, Yan H, et al. Construction and validation of a novel liver function-tumor burden-inflammation-nutrition (LTIN) score for HCC patients underwent hepatectomy. BMC Cancer. 2025;25:504. doi:10.1186/s12885-025-13867-w
20. Zhou J, Yang D. Prognostic Significance of Hemoglobin, Albumin, Lymphocyte and Platelet (HALP) Score in Hepatocellular Carcinoma. J Hepatocell Carcinoma. 2023;10:821–831. doi:10.2147/JHC.S411521
21. Wu Y, Liu H, Zeng J, et al. Development and validation of nomogram to predict very early recurrence of combined hepatocellular-cholangiocarcinoma after hepatic resection: a multi-institutional study. World J Surg Oncol. 2022;20:60. doi:10.1186/s12957-022-02536-y
22. Ni Z, Wu B, Li M, et al. Prediction Model and Nomogram of Early Recurrence of Hepatocellular Carcinoma after Radiofrequency Ablation Based on Logistic Regression Analysis. Ultrasound Med Biol. 2022;48:1733–1744. doi:10.1016/j.ultrasmedbio.2022.04.217
23. Shinkawa H, Tanaka S, Takemura S, et al. Nomograms predicting extra- and early intrahepatic recurrence after hepatic resection of hepatocellular carcinoma. Surgery. 2021;169:922–928. doi:10.1016/j.surg.2020.10.012
24. Xing H, Zhang W-G, Cescon M, et al. Defining and predicting early recurrence after liver resection of hepatocellular carcinoma: a multi-institutional study. HPB. 2020;22:677–689. doi:10.1016/j.hpb.2019.09.006
25. Kim JH. Multicollinearity and misleading statistical results. Korean J Anesthesiol. 2019;72:558–569. doi:10.4097/kja.19087
26. Vatcheva KP, Lee M, McCormick JB, Rahbar MH. Multicollinearity in Regression Analyses Conducted in Epidemiologic Studies. Epidemiology. 2016;6:227. doi:10.4172/2161-1165.1000227
27. Kim KA, Kim M-J, Choi J-Y, et al. Detection of recurrent hepatocellular carcinoma on post-operative surveillance: comparison of MDCT and gadoxetic acid-enhanced MRI. Abdom Imaging. 2014;39:291–299. doi:10.1007/s00261-013-0064-y
28. Osho A, Rich NE, Singal AG. Role of imaging in management of hepatocellular carcinoma: surveillance, diagnosis, and treatment response. Hepatoma Res. 2020;6:55. doi:10.20517/2394-5079.2020.42
29. Lee HA, Lee Y-S, Kim BK, et al. Change in the Recurrence Pattern and Predictors over Time after Complete Cure of Hepatocellular Carcinoma. Gut Liver. 2021;15:420–429. doi:10.5009/gnl20101
30. Ho S-Y, Hsu C-Y, Liu P-H, et al. Albumin-bilirubin (ALBI) grade-based nomogram to predict tumor recurrence in patients with hepatocellular carcinoma. Eur J Surg Oncol. 2019;45:776–781. doi:10.1016/j.ejso.2018.10.541
31. Tong Y, Li J-X, Chang D-H, et al. An Integrated Liver Function, Systemic Inflammation, and Tumor Characteristic Score Predicts Prognosis in Hepatocellular Carcinoma After Curative Resection. Ann Surg Oncol. 2023;30:2007–2020. doi:10.1245/s10434-022-12899-x
32. Huang W, Wei S, Dong X, et al. Preoperative albumin-alkaline phosphatase ratio affects the prognosis of patients undergoing hepatocellular carcinoma surgery. Cancer Biomark. 2024;39:15–26. doi:10.3233/CBM-230108
33. Tian G, Li G, Guan L, Yang Y, Li N. Pretreatment albumin-to-alkaline phosphatase ratio as a prognostic indicator in solid cancers: a meta-analysis with trial sequential analysis. Int J Surg. 2020;81:66–73. doi:10.1016/j.ijsu.2020.07.024
34. Zhang X, Xin Y, Chen Y, Zhou X. Prognostic effect of albumin-to-alkaline phosphatase ratio on patients with hepatocellular carcinoma: a systematic review and meta-analysis. Sci Rep. 2023;13:1808. doi:10.1038/s41598-023-28889-2
35. Fu X, Yang Y, Zhang D. Molecular mechanism of albumin in suppressing invasion and metastasis of hepatocellular carcinoma. Liver Int. 2022;42:696–709. doi:10.1111/liv.15115
36. Bağırsakçı E, Şahin E, Atabey N, Erdal E, Guerra V, Carr BI. Role of Albumin in Growth Inhibition in Hepatocellular Carcinoma. Oncology. 2017;93:136–142. doi:10.1159/000471807
37. Wu S-J, Lin Y-X, Ye H, Xiong X-Z, Li F-Y, Cheng N-S. Prognostic value of alkaline phosphatase, gamma-glutamyl transpeptidase and lactate dehydrogenase in hepatocellular carcinoma patients treated with liver resection. Int J Surg. 2016;36:143–151. doi:10.1016/j.ijsu.2016.10.033
38. Yu M-C, Chan K-M, Eldeen FZ, et al. Alkaline phosphatase: does it have a role in predicting hepatocellular carcinoma recurrence? J Gastrointest Surg. 2011;15:1440–1449. doi:10.1007/s11605-011-1537-3
39. Dong K, Zheng Y, Wang Y, Guo Q. Predictive role of neutrophil percentage-to-albumin ratio, neutrophil-to-lymphocyte ratio, and systemic immune-inflammation index for mortality in patients with MASLD. Sci Rep. 2024;14:30403. doi:10.1038/s41598-024-80801-8
40. Liu C-F, Chien L-W. Predictive Role of Neutrophil-Percentage-to-Albumin Ratio (NPAR) in Nonalcoholic Fatty Liver Disease and Advanced Liver Fibrosis in Nondiabetic US Adults: evidence from NHANES 2017-2018. Nutrients. 2023;15:1892. doi:10.3390/nu15081892
41. Chen H, Zhou X-H, Li J-R, et al. Neutrophils: driving inflammation during the development of hepatocellular carcinoma. Cancer Lett. 2021;522:22–31. doi:10.1016/j.canlet.2021.09.011
42. Margetts J, Ogle LF, Chan SL, et al. Neutrophils: driving progression and poor prognosis in hepatocellular carcinoma? Br J Cancer. 2018;118:248–257. doi:10.1038/bjc.2017.386
43. Yang L-Y, Luo Q, Lu L, et al. Increased neutrophil extracellular traps promote metastasis potential of hepatocellular carcinoma via provoking tumorous inflammatory response. J Hematol Oncol. 2020;13:3. doi:10.1186/s13045-019-0836-0
44. Zhou S-L, Zhou Z-J, Hu Z-Q, et al. Tumor-Associated Neutrophils Recruit Macrophages and T-Regulatory Cells to Promote Progression of Hepatocellular Carcinoma and Resistance to Sorafenib. Gastroenterology. 2016;150:1646–1658.e17. doi:10.1053/j.gastro.2016.02.040
45. Wei H, Zheng T, Zhang X, et al. Deep learning-based 3D quantitative total tumor burden predicts early recurrence of BCLC A and B HCC after resection. Eur Radiol. 2025;35:127–139. doi:10.1007/s00330-024-10941-y
46. Lei Z, Li J, Wu D, et al. Nomogram for Preoperative Estimation of Microvascular Invasion Risk in Hepatitis B Virus-Related Hepatocellular Carcinoma Within the Milan Criteria. JAMA Surg. 2016;151:356–363. doi:10.1001/jamasurg.2015.4257
47. Yan W-T, Li C, Yao L-Q, et al. Predictors and long-term prognosis of early and late recurrence for patients undergoing hepatic resection of hepatocellular carcinoma: a large-scale multicenter study. Hepatobiliary Surg Nutr. 2023;12:155–168. doi:10.21037/hbsn-21-288
48. Li W-F, Yen Y-H, Liu Y-W, et al. Preoperative predictors of early recurrence after resection for hepatocellular carcinoma. Am J Surg. 2022;223:945–950. doi:10.1016/j.amjsurg.2021.08.012
49. Feng Z, Li H, Zhao H, et al. Preoperative CT for Characterization of Aggressive Macrotrabecular-Massive Subtype and Vessels That Encapsulate Tumor Clusters Pattern in Hepatocellular Carcinoma. Radiology. 2021;300:219–229. doi:10.1148/radiol.2021203614
50. Liu S, Wu Z, Wang C, et al. Prognosis predictors of hepatocellular carcinoma after hepatectomy following conversion therapy. Eur J Surg Oncol. 2025;51:109375. doi:10.1016/j.ejso.2024.109375
51. Wang K, Xiang Y-J, Yu H-M, et al. A novel classification in predicting prognosis and guiding postoperative management after R0 liver resection for patients with hepatocellular carcinoma and microvascular invasion. Eur J Surg Oncol. 2022;48:1348–1355. doi:10.1016/j.ejso.2021.12.466
52. Zhang H, Liu F, Wen N, Li B, Wei Y. Patterns, timing, and predictors of recurrence after laparoscopic liver resection for hepatocellular carcinoma: results from a high-volume HPB center. Surg Endosc. 2022;36:1215–1223. doi:10.1007/s00464-021-08390-5
53. Dong L-Q, Peng L-H, Ma L-J, et al. Heterogeneous immunogenomic features and distinct escape mechanisms in multifocal hepatocellular carcinoma. J Hepatol. 2020;72:896–908. doi:10.1016/j.jhep.2019.12.014
54. Huang Y, Su Y, Chen Y, et al. Risk factors and nomogram predictive models for postsurgical progression/hyperprogression recurrence in hepatocellular carcinoma with macroscopic vascular invasion. World J Surg Oncol. 2024;22:305. doi:10.1186/s12957-024-03572-6
55. Jun L, Zhenlin Y, Renyan G, et al. Independent factors and predictive score for extrahepatic metastasis of hepatocellular carcinoma following curative hepatectomy. Oncologist. 2012;17:963–969. doi:10.1634/theoncologist.2011-0447
 © 2025 The Author(s). This work is published and licensed by Dove Medical Press Limited. The
full terms of this license are available at https://www.dovepress.com/terms
and incorporate the Creative Commons Attribution
- Non Commercial (unported, 4.0) License.
By accessing the work you hereby accept the Terms. Non-commercial uses of the work are permitted
without any further permission from Dove Medical Press Limited, provided the work is properly
attributed. For permission for commercial use of this work, please see paragraphs 4.2 and 5 of our Terms.
© 2025 The Author(s). This work is published and licensed by Dove Medical Press Limited. The
full terms of this license are available at https://www.dovepress.com/terms
and incorporate the Creative Commons Attribution
- Non Commercial (unported, 4.0) License.
By accessing the work you hereby accept the Terms. Non-commercial uses of the work are permitted
without any further permission from Dove Medical Press Limited, provided the work is properly
attributed. For permission for commercial use of this work, please see paragraphs 4.2 and 5 of our Terms.
Recommended articles
Prognostic Factors for Patients with Proliferative Hepatocellular Carcinoma After Liver Resection
Li HM, Huang W, Hu C, Zhang ZS, Xiao YD, Wang TC
Journal of Hepatocellular Carcinoma 2023, 10:2059-2071
Published Date: 20 November 2023
Gamma-Glutamyl Transpeptidase to Neutrophil Ratio as Prognostic Indicator for Hepatocellular Carcinoma Patients Post-Curative Resection
Shen X, Niu X
Journal of Hepatocellular Carcinoma 2024, 11:2077-2085
Published Date: 27 October 2024