Back to Journals » Journal of Inflammation Research » Volume 16
ANGPTL4 May Regulate the Crosstalk Between Intervertebral Disc Degeneration and Type 2 Diabetes Mellitus: A Combined Analysis of Bioinformatics and Rat Models
Authors Chen Y, Du H, Wang X, Li B, Chen X, Yang X ![]() , Zhao C, Zhao J
, Zhao C, Zhao J ![]()
Received 17 July 2023
Accepted for publication 19 December 2023
Published 27 December 2023 Volume 2023:16 Pages 6361—6384
DOI https://doi.org/10.2147/JIR.S426439
Checked for plagiarism Yes
Review by Single anonymous peer review
Peer reviewer comments 2
Editor who approved publication: Professor Ning Quan
Yan Chen,1,* Han Du,1,* Xin Wang,1,* Baixing Li,1 Xuzhuo Chen,2 Xiao Yang,1 Changqing Zhao,1 Jie Zhao1
1Shanghai Key Laboratory of Orthopaedic Implants, Department of Orthopaedic Surgery, Shanghai Ninth People’s Hospital, Shanghai Jiao Tong University School of Medicine, Shanghai, 200011, People’s Republic of China; 2Department of Oral Surgery, Shanghai Key Laboratory of Stomatology & Shanghai Research Institute of Stomatology, National Clinical Research Center for Oral Diseases, Shanghai Ninth People’s Hospital, College of Stomatology, Shanghai Jiao Tong University School of Medicine, Shanghai, 200011, People’s Republic of China
*These authors contributed equally to this work
Correspondence: Changqing Zhao; Xiao Yang, Shanghai Key Laboratory of Orthopaedic Implants, Department of Orthopaedic Surgery, Shanghai Ninth People’s Hospital, Shanghai Jiao Tong University School of Medicine, Shanghai, 200011, People’s Republic of China, Email [email protected]; [email protected]
Introduction: The crosstalk between intervertebral disc degeneration (IVDD) and type 2 diabetes mellitus (T2DM) has been investigated. However, the common mechanism underlying this phenomenon has not been clearly elucidated. This study aimed to explore the shared gene signatures of IVDD and T2DM.
Methods: The expression profiles of IVDD (GSE27494) and T2DM (GSE20966) were acquired from the Gene Expression Omnibus database. Five hub genes including ANGPTL4, CCL2, CCN3, THBS2, and INHBA were preliminarily screened. GO (Gene Ontology) enrichment analysis, functional correlation analysis, immune filtration, Transcription factors (TFs)-mRNA-miRNA coregulatory network, and potential drugs prediction were performed following the identification of hub genes. RNA sequencing, in vivo and in vitro experiments on rats were further performed to validate the expression and function of the target gene.
Results: Five hub genes (ANGPTL4, CCL2, CCN3, THBS2, and INHBA) were identified. GO analysis demonstrated the regulation of the immune system, extracellular matrix (ECM), and SMAD protein signal transduction. There was a strong correlation between hub genes and different functions, including lipid metabolism, mitochondrial function, and ECM degradation. The immune filtration pattern grouped by disease and the expression of hub genes showed significant changes in the immune cell composition. TFs-mRNA-miRNA co-expression networks were constructed. In addition, pepstatin showed great drug-targeting relevance based on potential drugs prediction of hub genes. ANGPTL4, a gene that mediates the inhibition of lipoprotein lipase activity, was eventually determined after hub gene screening, validation by different datasets, RNA sequencing, and experiments.
Discussion: This study screened five hub genes and ANGPTL4 was eventually determined as a potential target for the regulation of the crosstalk in patients with IVDD and T2DM.
Keywords: ANGPTL4, biomarker, functional analysis, intervertebral disc degeneration, type 2 diabetes mellitus
Introduction
Low back pain (LBP) is one of the top ten injury causes affecting disability-adjusted life-years.1 This has been reported to have an enormous socioeconomic impact.2 Intervertebral disc degeneration (IVDD) is regarded as an important risk factor for LBP.3–5 The intervertebral disc consists mainly of the nucleus pulposus (NP), cartilage endplates (CEP), and annulus fibrosus (AF). IVDD is characterized by progressive NP cell death, CEP calcification and sclerosis, AF fissure, breakdown of the extracellular matrix (ECM), immune cell infiltration and so on.6–9 Based on the current lack of clear understanding of IVDD, it is necessary to further explore the underlying mechanisms.
Type 2 diabetes mellitus (T2DM) is a common metabolic disease characterized by insulin resistance, activation of inflammatory responses, accumulation of advanced glycation end-products (AGEs), and augmentation of oxidative stress. The activation of these mechanisms leads to alterations in connective tissues, including bone and cartilage, which also include the reduction of intervertebral height, degradation of CEP, and potential abnormalities in its diffusion performance.10–13 It should also be noted that due to the regulation of bone metabolism by insulin, hyperglycemia induced by T2DM will lead to an increase in bone density and osteogenic activity, which leads to sclerosis of the bone endplate and may have detrimental effects on the nutrient supply of intervertebral discs, ultimately leading to IVDD.14–16 The abnormal microenvironment in patients with T2DM also causes the accumulation of reactive oxygen species in IVDs, disorders of lipid metabolism and mitochondrial function, and stress-related premature senescence.17–19 In addition, AGEs can cause calcification and sclerosis of the endplate, microstructural changes, intervertebral disc ECM degradation, and inflammatory cascade responses.20–24 Therefore, the risk of IVDD in T2DM patients may inevitably increase, and it is necessary to understand the mechanisms of IVDD and T2DM.25,26
Since there are various connections between IVDD and T2DM, our study aimed to find deeper links between them to provide new insights for the diagnosis and treatment of IVDD. In recent years, the development of RNA sequencing technology and bioinformatics has enabled the genetic investigation of the common etiologies of crosstalk in diseases genetically.27–29 First, the GSE27494 and GSE20966 datasets were selected to identify differentially expressed genes (DEGs) that regulate IVDD and T2DM, respectively. Common DEGs were identified and protein interaction networks (PPIs) were constructed to select five hub genes. Hub genes were further verified and functional enrichment was performed to assess the biological processes involved. Functional correlation analysis, immune infiltration, transcription factors (TFs), miRNAs, and potential drugs estimated in the DSigDB database were performed for analysis based on hub genes. Finally, hub gene expression was verified by RNA sequencing and experiments using a rat model. The workflow of this study is illustrated in Figure 1.
 |
Figure 1 The overall workflow of this study. Abbreviations: IVDD, intervertebral disc degeneration; DEGs, differentially expressed genes; GO, Gene Ontology; TFs, transcription factors. |
Materials and Methods
Data Collection
All the included datasets were downloaded from the Gene Expression Omnibus (GEO, http://www.ncbi.nlm.nih.gov/geo/). Keywords: “type 2 diabetes mellitus” or “intervertebral disc degeneration” were used to search for profiles of patients with T2DM and IVDD. The inclusion criteria were as follows:1) the arrays should contain both case and control groups; 2) the included datasets should contain at least three samples in each group for both IVDD and T2DM; 3) raw data could be easily acquired for deeper analysis; and 4) the included test specimens were from human sources. Finally, GSE27494, GSE20966, GSE25724, and GSE56081 were screened for further analyses (Table 1).
 |
Table 1 Information of Included GEO Datasets Containing T2DM and IVDD Patients |
Identification of Common DEGs Between IVDD and T2DM
DEGs from the GSE27494 and GSE20966 datasets were identified using the GEOquery and limma packages in R.30,31 The cutoff criteria were set as P-value<0.05 and |fold change|≥1 transformed by “log2” algorithm to identify DEGs. The obtainment and exhibition of common DEGs were assisted by Venn diagrams using the interactive viewer Venny 2.1.32
PPI Network Construction
Common DEGs of T2DM and IVDD were identified and imported into the STRING.33 The visualization and integration of PPIs networks were further assisted with the Cytoscape platform (https://cytoscape.org/) for the analysis of protein and genetic interactions.34
Establishment of the Topological Algorithm and Identification of Hub Nodes
In this study, highly interconnected hub nodes were identified using cytoHubba, a Cytoscape plugin.35 Nodes were calculated using 11 topological algorithms with cytoHubba (https://apps.cytoscape.org/apps/cytohubba), and MCC, which has a better performance in predicting essential proteins, was used to determine hub genes.35
Functional Analysis
Gene Ontology (GO) based on hub genes was analyzed using |fold change|≥1 and adjusted P-value <0.05 and visualized using clusterProfiler.36 P-values were adjusted using the Benjamini–Hochberg method, and the top 10 pathways for each with cutoff criteria adjusted P-value<0.05 were exhibited.30 CIBERSORT is a novel tool for analyzing biomarkers based on the expression of 22 immune cell subtypes (http://cibersort.stanford.edu/).37 The calculation of the cell composition of the 22 immune cell subtype distributions was performed according to the codes downloaded from CIBERSORT. The scores were further analyzed in patients with disease and hub genes with high or low expression levels. The results were visualized using the R package ggplot.
Identification of the Correlation Between Hub Genes and Multiple Function-Related Genes
1491 genes associated with mitochondrial function were acquired from the Integrated Mitochondrial Protein Index (IMPI; https://mitominer.mrc-mbu.cam.ac.uk/release-4.0/impi.do). A total of 828 genes associated with lipid metabolism were acquired from Reactome (https://reactome.org/) and KEGG (https://www.kegg.jp/, Kyoto Encyclopedia of Genes and Genomes) databases. A total of 507 genes associated with ECM were obtained from a previous report and the KEGG database.38 Intersection genes of DEGs and mitochondrial function-related genes (MFRGs), lipid metabolism-related genes (LMRGs) and ECM-related genes (ECMRGs) were identified as differentially expressed mitochondrial function-related genes (DE-MFRGs), lipid metabolism-related genes (DE-LMRGs) and ECM-related genes (DE-ECMRGs). Pearson’s correlation between hub genes and DEGs was determined using the R statistical package. The results were displayed in the form of a heatmap based on scale bar of z-score.
Recognition of Related TFs and miRNAs
TFs and miRNAs, which were identified by TRRUST (http://www.grnpedia.org/trrust/) and miRnet (https://www.mirnet.ca/miRNet/home.xhtml), constitute two major regulatory modes of gene expression, including transcription and post-transcription.39,40 To select TFs and miRNAs, a coregulatory network was visualized using Cytoscape.
Potential Therapeutic Drug Prediction
Protein-drug interaction data from DSigDB (http://tanlab.ucdenver.edu/DSigDB) were used to predict potential drugs for treating IVDD and T2DM based on hub genes, with the cutoff criteria of adjusted P-value < 0.05 and composite score > 1000.41
NP Primary Cells Isolation and Culture
Primary NP tissues were achieved from six-week-old male Sprague-Dawley (S-D) rats following cervical dislocation, rinsed in 75% ethanol, and digested with 1% collagenase II solution for 2 h (Beyotime Biotechnology, China). Specifically, the gelatinous NP tissues inside IVD were isolated from annular AF and hyaline CEP using a sterile scalpel. After centrifugation and suspension, the monolayer culture of cells was according to the conditions of DMEM medium with 10% fetal bovine serum (Thermo Fisher Scientific, USA) and 1% penicillin-streptomycin (Thermo Fisher Scientific, USA), room temperature of 37°C and 5% CO2.
RNA Sequencing
NP cells were stimulated with or without TNF-α (10 ng/mL; R&D Systems, Minneapolis, MN, USA) for 24 h at 37°C and 5% CO2. Then, TRIzol reagent (Thermo Fisher Scientific, USA) was used to isolate RNA by protocol and total RNAs were subjected to further analysis via transcriptome sequencing in Wuhan Huada Gene Technology Co., Ltd. (China): KEGG pathways and volcano plot (|fold change| ≥ 0, normalized to control, Q-value <0.001) were applied for the determination of changes under stimulation of TNF-α using transcripts per kilobase million TPM for analysis, which were documented in the Mybgi platform (WuhanHuada Gene Technology, https://mybgi.bgi.com/tech/login).
RNA Extraction and Real-Time Quantitative PCR Analyses
Cells were treated with TNF-α (10ng/mL) or exogenous addition of glucose and palmitic acid (HGHF, 25.5 mmol·L−1 glucose + 300 μmolL−1 palmitic acid, Thermo Fisher Scientific, USA) for 24 h to mimic the microenvironment of T2DM.42 RNA was extracted using the TRIzol reagent. Following with the reversed transcription to first strand complementary DNAs (cDNAs) from RNAs using A cDNA Synthesis Kit (Takara Bio, Otsu, Japan) was used to reverse-transcribe cDNA from RNA. Real-time qPCR was performed using an Applied Biosystems QuantStudio 6 Flex Real-Time PCR System (Thermo Fisher Scientific, USA). Primers were designed using NCBI BLAST, and primer information is provided in Table 2. The 2−ΔΔCT method was used to quantify the relative expression levels of target genes after normalization to β-actin.
 |
Table 2 Primers Information and siRNA Sequences |
siRNA Transfection
si-ANGPTL4 was purchased from Integrated Biotech Solutions Co. Ltd. (China). Six-well plates were used for cell inoculation and culture after 24h when the cells achieved 60–70% density. Then, 50nM of control (siNC) or siANGPTL4 was added using Lipofectamine 3000 siRNA transfection protocols. The siNC and siANGPTL4 sequences were generated as previous study.43 The siRNA sequences are listed in Table 2. The efficacy of siANGPTL4 was verified by RT-qPCR.
Protein Extraction and Western Blot Analysis
To analyze the protein expression and function of ANGPTL4, NP cells were subjected to previous treatments. Total proteins were obtained by washing twice with 1 × phosphate-buffered saline (PBS) using a mixture of RIPA and inhibitors of phosphatase, and protease inhibitors. The lysate was quantified by centrifugation (12,000×g for 15 min) using BCA quantification kit (Beyotime Biotechnology, China). Samples were separated on a 4–20% SDS-PAGE gel, electroblotted, and transferred onto 0.22-μm PVDF membranes after dissolving in SDS-sample loading buffer. The PVDF membranes were blocked using 5% bovine serum albumin (BSA) at room temperature for 2 h and then incubated overnight at 4 °C with primary antibodies (1:1000 in 5% BSA–TBST). Primary antibodies against ANGPTL4 (ab196746), SOX9 (ab185966), MMP13 (ab39012), and β-actin (D6A8) were purchased from Abcam and Cell Signaling Technology. Membranes were washed thrice with TBST for 10 min and subsequently incubated with anti-rabbit or anti-mouse IgG (Cell Signaling Technology, Danvers, MA, United States) secondary antibodies (1:10,000) for 2 h at room temperature to avoid exposure to light. Immunoreactivity was detected using the LI-COR Odyssey fluorescence imaging system after washing thrice with TBST for 10 min. The OD values were measured using the ImageJ software (National Institutes of Health, United States).
Immunofluorescence
Slides were placed in a six-well plate following disinfection with 75% ethanol to culture NP cells at a density of 3.5×10⁵ per well. The NP cells were then treated with TNF-α (10ng/mL) or HGHF for 24 h after attachment and proliferation. After fixation with paraformaldehyde (4%) for 30 min, cell membranes were permeabilized with 0.25% Triton X-100 (Beyotime Biotechnology, China) for 10 min, blocked with 5% BSA for 2 h at room temperature, NP cells then incubated with the primary antibody ANGPTL4 (1:250, Abcam) overnight at 4°C. Cells were washed three times with PBS and then incubated with an Alexa Fluor 594 conjugate secondary antibody (anti-rabbit, 1:500; Cell Signaling Technology) for 1 h. Then, the cells were incubated with DAPI for 20 min. Eventually, fluorescence images were determined with a fluorescence microscope (Olympus, Inc., Tokyo, Japan). Semi-quantitative analysis of integrated optical density (IOD) was performed using Image-Pro Plus (version 6.0; Media Cybernetics, Silver Spring, MD, USA).
Surgical Procedure
Animal experiments were performed in accordance with Shanghai Ninth People’s Hospital (Approval #SH9H-2021-TK326-1). Twenty male S-D rats aged 12 weeks were kept under the appropriate preoperative and postoperative conditions. A needle puncture was used to construct an IVDD rat model.44 Briefly, anesthesia was administered to the rats by intraperitoneal injection of pentobarbital sodium (40 mg/kg of body weight), and 75% ethanol was used to disinfect the tails. A sterile needle of 20G was utilized to penetrate the Co7/8 discs from the dorsal skin into the NP center. The IVDD model was completed by a subsequent rotation of 360° and holding for 30s in position. Eventually, re-sterilization was performed to prevent infection. 5μL saline was injected weekly into the Co7/8 discs for IVDD. Co6/7 discs were not used as controls.
Immunohistochemistry
After rat tails were transected and fixed by paraformaldehyde, coccyxes were exposed by skinning. Intervertebral discs were cut into 5 μm sections and attached to the thickness of a glass sheet by neutral resin to seal them.45 Deparaffinization and rehydration were first performed on the sections, and 3% hydrogen peroxide (H2O2) was used for 30 min to block endogenous peroxidase. The primary antibodies were incubated overnight at 4°C, followed by blocking with 10% goat serum for 2h at room temperature. Next, the secondary antibody conjugated with HRP was incubated the next day for 2h at RT after three washes in PBS. The microscopic data were obtained using a Leica DM4000 B microscope (Leica Microsystems). Semi-quantitative analysis of IOD was performed using Image-Pro Plus (version 6.0; Media Cybernetics, Silver Spring, MD, USA).
Statistical Analysis
R software (Version 4.2.2) and GraphPad Prism 8.3 were used to analyze the data and construct the figures. Continuous variables were analyzed using the Mann–Whitney U-test. All experiments presented in this study were conducted three times to obtain data. Data are presented as the mean (M) ± standard deviation (SD). Significant differences between two groups were analyzed using t-test, whereas among multiple groups, one-way analysis of variance was used. Statistical significance was set at p < 0.05.
Results
Hub Genes Screening and Functional Enrichment Analysis in IVDD and T2DM Datasets
The expression matrices of the two datasets GSE27494 and GSE20966 were normalized, and the distribution trends of the box plots were straight lines (Figure 2A and B). To assess the repeatability of the data within the group, Principal component analysis (PCA) of the two datasets was performed, and the results showed good repeatability (Figure 2C and D).
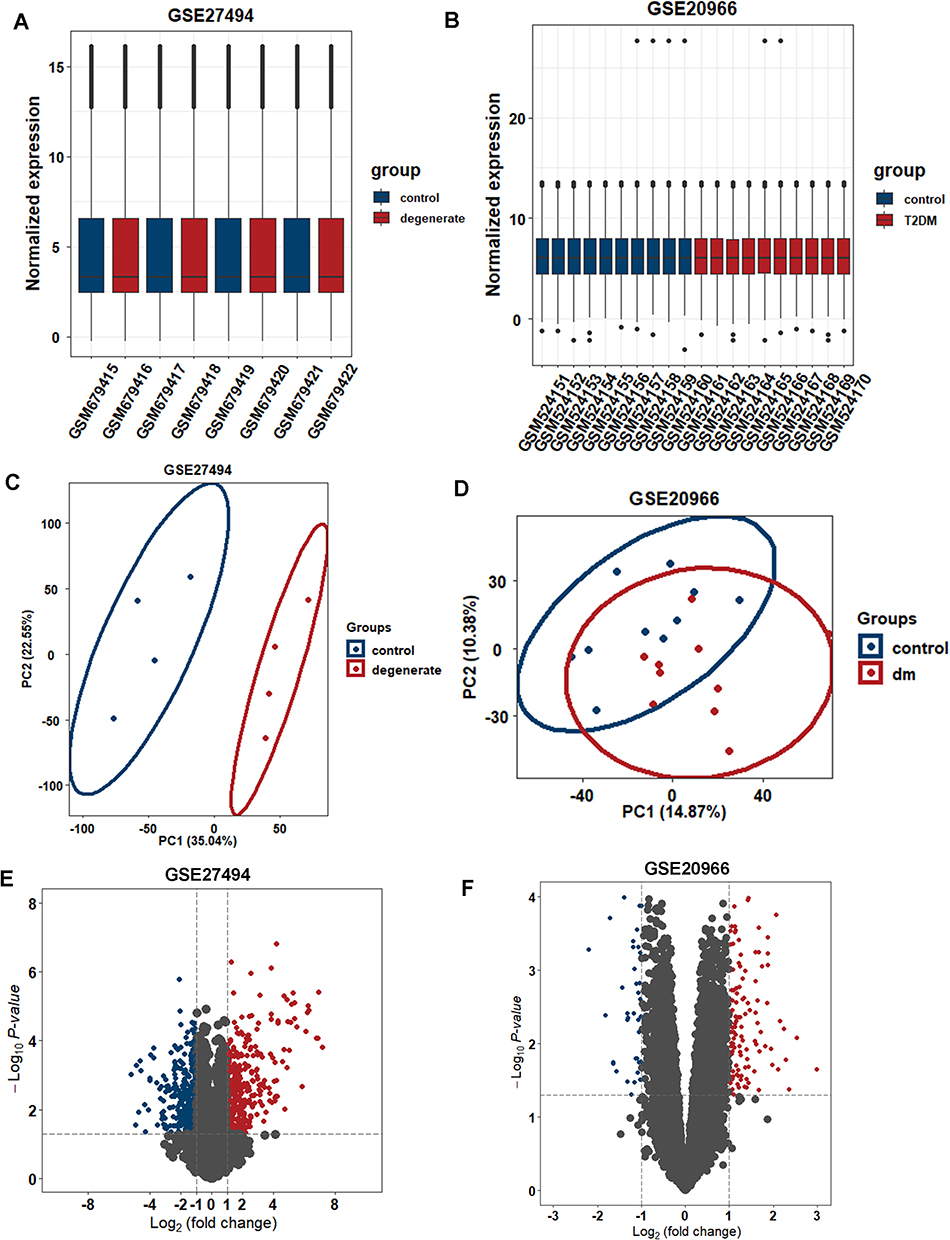 |
Figure 2 Expression levels in GSE27494 and GSE20966 via data wrangling. (A and B) Normalized expression matrices of GSE27494 and GSE20966 demonstrated by boxplot. (C and D) PCA diagrams. (E and F) DEGs of GSE27494 and GSE20966 shown by volcano plot. Abbreviations: PCA, principal component analysis; DEG, differentially expressed genes. |
With a screening threshold of |fold change|≥1 and P-value<0.05, 648 DEGs (343 upregulated and 305 downregulated) were identified in the GSE27494 dataset, and 171 DEGs (123 upregulated and 48 downregulated) were identified in the GSE20966 dataset. Volcano plots of DEGs in the above two datasets are shown in Figure 2E and F. Venn plots were also created (Figure 3A), which showed that 13 genes were differentially expressed between the two datasets (Figure 3B). Based on the common DEGs, five hub genes were identified using the Cytohubba plugin in Cytoscape (Figure 3C). To further assess the regulation of functions based on hub genes, GO was performed, which showed the involvement of immune regulation (negative regulation of immune system processes, negative regulation of leukocyte chemotaxis, negative regulation of mononuclear cell migration, negative regulation of leukocyte migration, and monocyte chemotaxis), SMAD protein signal transduction, and ECM-related structural and functional interactions (collagen-containing extracellular matrix, basement membrane, and glycosaminoglycan binding).
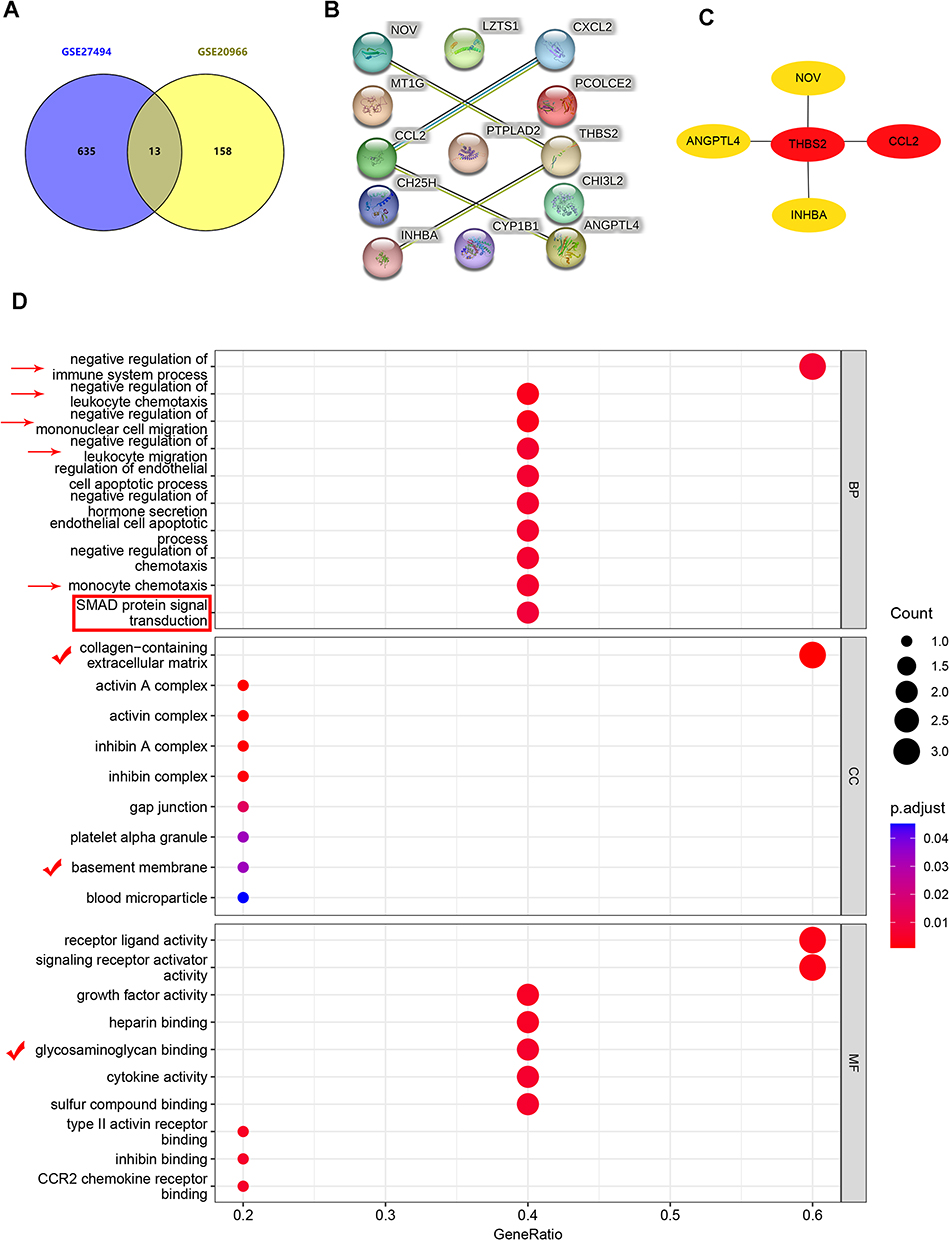 |
Figure 3 Determination of the hub genes and functional enrichment analysis. (A) Common DEGs in GSE27494 and GSE20966 demonstrated using venn plot. (B) PPI network of common DEGs. (C) Top 5 hub genes screened and analyzed by Cytoscape (Threshold as following, |fold change|≥1 and adjusted P-value <0.05). (D) GO enrichment analysis based on 5 hub genes. Arrows represent signaling pathways related to immune filtration; Box represents pathways related to protein signal transduction; Checkmarks represent pathways related to anabolism and catabolism of ECM. Abbreviations: PPI, protein interaction network; DEGs, differentially expressed genes; GO, Gene Ontology; ECM, extracellular matrix. |
Identification of the Relationship Between Hub Genes and ECM, Lipid Metabolism and Mitochondrial Function Respectively
Since the progression of IVDD and T2DM is accompanied by mitochondrial dysfunction, disturbance of lipid disorders, and ECM degradation, the relationship between hub genes and related genes was analyzed. Furthermore, based on GO enrichment analysis (Figure 3D), the relationship between hub genes and ECM was analyzed.
In GSE27494, among 1419 MFRGs and 828 LMRGs, 29 and 38 genes were categorized as DE-MFRG and DE-LMRGs, respectively. 21 DE-MFRGs were upregulated, and eight were downregulated. 24 DE-LMRGs were upregulated and 14 were downregulated. Among the 507 ECMRGs, 40 were categorized as DE ECMRGs. Seventeen up-regulated and 23 down-regulated genes were identified. The results of the Pearson correlation analysis indicated that the majority of DE-MFRG, DE-LMRG, and DE-ECMRG were highly correlated with hub genes (|r| ≥ 0.5, p < 0.05), which indicated the close relationship between hub genes and mitochondria function, lipid metabolism and ECM in GSE27494 (Figure 4A–C, the scale bar including 1, 0.5, 0, −0.5 and −1 represents z score).
 |
Figure 4 The relationship between 5 hub genes and lipid metabolism, mitochondrial function and ECM degradation respectively in dataset GSE27494. (A) Correlation between the hub genes and DE-MFRGs. (B) Correlation between the hub genes and DE-LMRGs. (C) Correlation between the hub genes and DE-ECMRGs. The scale bar including 1, 0.5, 0, −0.5 and −1 represents z score. Abbreviations: ECM, extracellular matrix; DE-MFRGs, differentially expressed- mitochondrial function related genes; DE-LMRGs, differentially expressed-lipid metabolism related genes; DE-ECMRGs, differentially expressed-ECM related genes. |
In GSE20966, 1419 MFRGs, and 828 LMRGs, six and nine genes were categorized as DE-MFRGs and DE-LMRGs, respectively. Five DE-MFRGs were upregulated, and one was downregulated. Seven DE-LMRGs were upregulated, and two were downregulated. Of the 507 ECMRGs, 4 genes were categorized as DE-ECMRGs. 3 upregulated and 1 downregulated. The correlation results indicated that partial DE-MFRG, DE-LMRG, and DE-ECMRG were highly correlated with hub genes (|r| ≥ 0.5, p < 0.05) which indicated the close relationship between hub genes and mitochondria function, lipid metabolism and ECM in GSE20966 (Figure 5A–C, the scale bar including 1.5, 1, 0.5, 0, −0.5, −1 and −1.5 represents z score).
 |
Figure 5 The relationship between 5 hub genes and lipid metabolism, mitochondrial function and ECM degradation respectively in dataset GSE20966. (A) Correlation between the hub genes and DE-MFRGs. (B) Correlation between the hub genes and DE-LMRGs. (C) Correlation between the hub genes and DE-ECMRGs. The scale bar including 1.5, 1, 0.5, 0, −0.5, −1 and −1.5 represents z score. Abbreviations: ECM, extracellular matrix; DE-MFRGs, differentially expressed- mitochondrial function related genes; DE-LMRGs, differentially expressed-lipid metabolism related genes; DE-ECMRGs, differentially expressed-ECM related genes. |
Differences in Immune Characteristics Between Groups
The distribution of immune cells among the groups was assessed. The CIBERSORT results demonstrated that patients with IVDD had significantly higher levels of activated dendritic cells than those in the non-degenerate group (Figure 6A and B), and patients in the T2DM group showed no significant changes in immune filtration patterns compared with the control group (Figure 6C and D).
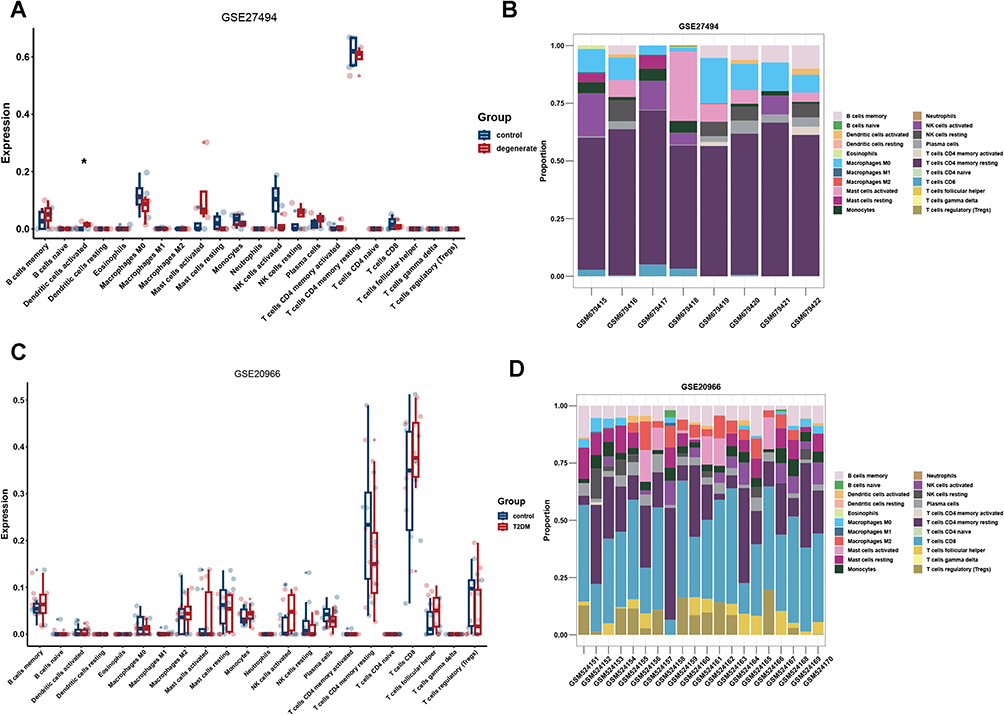 |
Figure 6 The immune filtration pattern in GSE27494 and GSE20966 datasets. (A and B) The immune filtration pattern grouping by disease in GSE27494 using boxplot and stacked bar chart. (C and D) The immune filtration pattern grouping by disease in GSE20966 using boxplot and stacked bar chart. *P < 0.05. |
Furthermore, the immune characteristics between different expression of the hub genes in the datasets were analyzed. In GSE27494, patients with high expression of ANGPTL4 showed significantly higher levels of resting NK cells, patients with higher expression of CCL2 showed significantly lower levels of activated NK cells and higher levels of resting NK cells, patients with higher expression of CCN3 and THBS2 showed significantly lower expression of activated dendritic cells, and patients with higher expression of INHBA showed no significant changes in immune filtration compared to those with lower expression levels (Figure 7A–E). In addition, in GSE20966, patients with higher expression of ANGPTL4 showed higher expression of CD8+ T cells; patients with higher expression of CCL2 showed significantly lower expression of M0 macrophages and resting mast cells, higher expression of M2 macrophages and activated mast cells, and higher expression of INHBA showed significantly lower expression of resting memory CD4+ T cells; and patients with higher expression of CCN3 and THBS2 showed no significant changes in immune filtration patterns (Figure 8A–E).
 |
Figure 7 The immune filtration of 5 hub genes in GSE27494. (A) Immune cell composition based on the expression level of ANGPTL4. (B) Immune cell composition based on the expression level of CCL2. (C) Immune cell composition based on the expression level of CCN3. (D) Immune cell composition based on the expression level of INHBA. (E) Immune cell composition based on the expression level of THBS2. *P < 0.05. |
 |
Figure 8 The immune filtration of 5 hub genes in GSE20966. (A) Immune cell composition based on the expression level of ANGPTL4. (B) Immune cell composition based on the expression level of CCL2. (C) Immune cell composition based on the expression level of CCN3. (D) Immune cell composition based on the expression level of INHBA. (E) Immune cell composition based on the expression level of THBS2. *P < 0.05, **P < 0.01. |
Construction of TF-miRNA Coregulatory Network
The MiRnet and TRRUST tools were used to predict the target miRNAs and TFs of hub genes. A total of 281 target miRNAs of the five hub genes were identified.
We used the miRNet tool to predict the target miRNAs of hub genes. Finally, we obtained 295 target miRNAs and 32 TFs of five hub genes and determined 254 mRNA-miRNA pairs. Notably, SMAD3 was identified as a TF associated with ANGPTL4, which is in accordance with the GO enrichment results (Figure 3D, SMAD protein signal transduction). Based on the prediction results, a co-expression network of mRNAs, miRNAs, and TFs, comprising 282 nodes and 319 edges, was constructed using Cytoscape (Figure 9). There were 18 miRNAs regulating ANGPTL4, 42 miRNAs regulating CCL2, 0 miRNAs regulating CCN3, 131 miRNAs regulating THBS2, and 103 miRNAs regulating INHBA. There were 5 TFs regulating ANGPTL4, 22 TFs regulating CCL2, 1 TF regulating THBS2, and 4 TFs regulating CCN3 (NOV). Partial miRNAs were also coregulated by multiple hub genes. After further searching the PubMed database (https://pubmed.ncbi.nlm.nih.gov/) for literature related to miRNAs with both T2DM and IVDD to screen for those overlapping with the above 295 miRNAs, 23 miRNAs were identified in Table 3.
 |
Table 3 Reported miRNAs Related to Both IVDD and T2DM Among 295 miRNAs |
 |
Figure 9 TF-mRNA-miRNA coregulatory network. The blue square nodes represent TFs. Yellow round nodes represent hub genes. Green oval nodes represent miRNAs. |
Validation of Hub Genes in T2DM and IVDD
To validate the expression levels of hub genes in other datasets of patients with T2DM and IVDD, two microarray datasets (GSE56081 and GSE25724) were selected for analysis. The two datasets were normalized and the distribution trends of the box plots were straight lines (Figure 10A–E). To assess the repeatability of the data within the groups, PCA of GSE56081 and GSE25724 was performed, and the results showed that the repeatability of the data was good (Figure 10B–F). The volcano plots in the above two datasets are shown in Figure 10C and G, with a threshold of P-value<0.05 and |fold change|≥1. The plots show that there was a large difference in the expression levels of the control group compared with those in IVDD. The expression levels of ANGPTL4 and INHBA differed between GSE56081 and GSE25724. However, INHBA expression level of INHBA up-regulated in GSE56081 and down-regulated in GSE25724. In addition, there was no statistically significant difference in CCL2 expression levels, and we did not determine the expression of CCN3 (or NOV) in either dataset, potentially due to limitations of gene probes and sequencing techniques (Figure 10D–H).
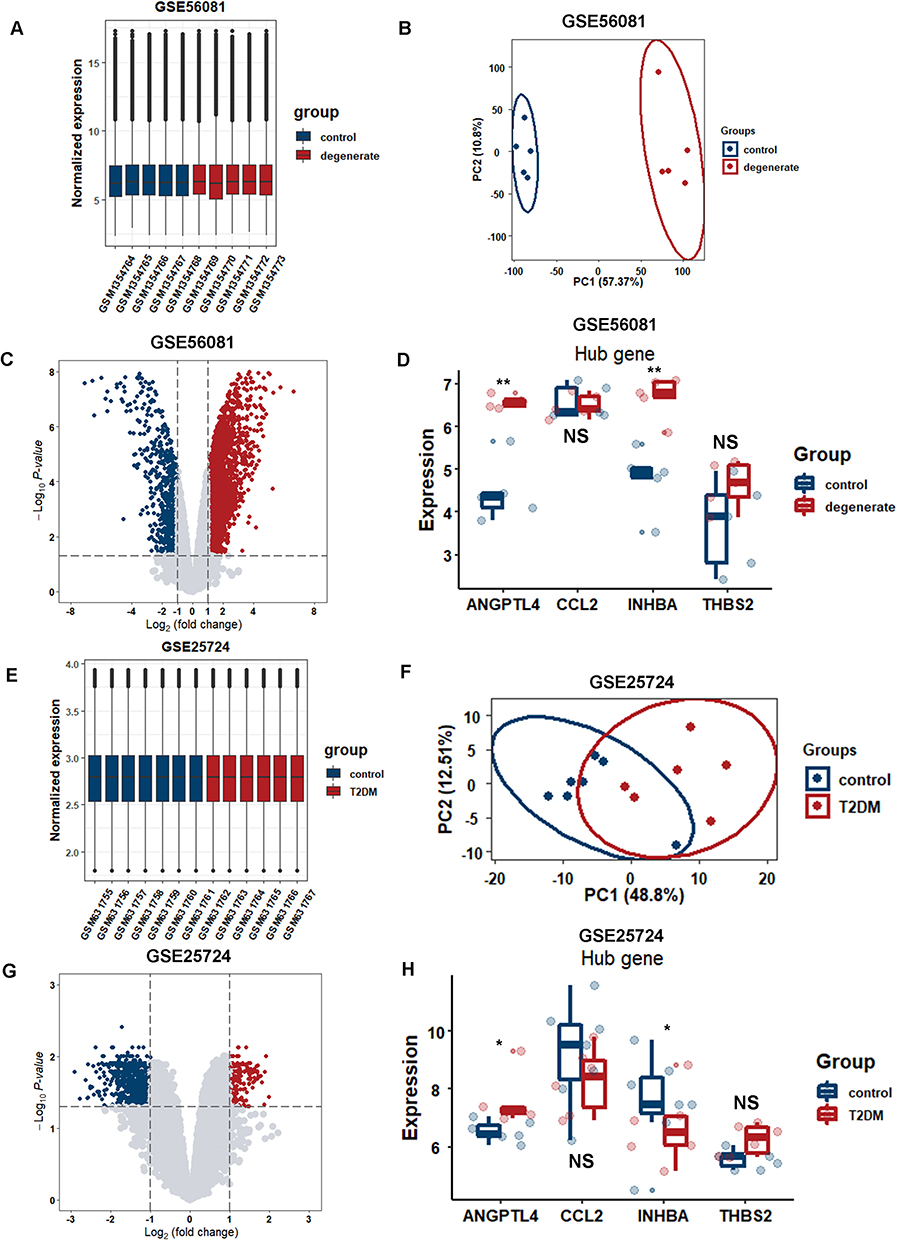 |
Figure 10 Validation of 5 hub genes in datasets GSE56081 and GSE25724. (A) Normalized expression in each sample of GSE56081 and GSE25724 using boxplot. (B) PCA analysis of GSE56081. (C) Volcano plot of DEGs of GSE56081. (D) Validation of the expression level of ANGPTL4 using boxplot in GSE56081. (E) Normalized expression in each sample of GSE25724 using boxplot. (F) PCA analysis of GSE25724. (G) Volcano plot of DEGs of GSE25724. (H) Validation of the expression level of ANGPTL4 using boxplot in GSE25724. *P < 0.05, **P < 0.01. Abbreviations: PCA, principal component analysis; DEG, differentially expressed genes. |
Targeted Drug Prediction
The DSigDB database was used to predict potential target drugs associated with hub genes, which may be useful for the treatment of both IVDD and T2DM. A total of 67 target drugs were identified. The top 10 predicted target drugs according to the combined scores are shown in Table 4. A study has shown that chromium chloride could reduce lipid accumulation and improve insulin sensitivity.46,47 The most notable among these compounds was pepstatin, for which scientific evidence supports its effectiveness as a novel predictive drug for treating both IVDD and T2DM. Among these predictions, pepstatin, for which there is now scientific evidence, supports its effectiveness as a novel therapeutic compound for treating both IVDD and T2DM.48–53
 |
Table 4 Top 10 Predicted Drugs Based on 5 Hub Genes |
The Expression and Function of ANGPTL4 Under the Environment of IVDD and T2DM
To confirm the expression and function of ANGPTL4 in IVDD and T2DM, we mimicked the in vitro disease microenvironment of IVDD and T2DM stimulated by TNF-α and HGHF using RNA sequencing, RT-qPCR, Western blotting, and immunofluorescence. After stimulation with TNF-α or HGHF, there was a significant upregulation of ANGPTL4, based on volcano plot analysis (Figure 11A). KEGG results indicated that the DEGs that participated in cell fate pathways varied significantly, including cell cycle signaling pathway, cellular senescence, apoptosis, and DNA replication pathway, and pathways associated with IVDD and diabetic microenvironments, such as focal adhesion and AGE-RAGE signaling pathway in diabetic complications (Figure 11B). RT-qPCR showed upregulation of ANGPTL4 after stimulation with TNF-α and HGHF (Figure 11C). In addition, the Western blotting and immunofluorescence results were consistent with the results of this study (Figure 11D, E, I and 11J). Knockdown of ANGPTL4 using siRNA showed high efficacy (Figure 11F). Under the stimulation of TNF-α and HGHF, in vitro knockdown of ANGPTL4 showed significant rescuing effects on ECM metabolism, as demonstrated by the decrease in MMP13 and increase in SOX9 (Figure 11G and H). Immunohistochemical staining showed that ANGPTL4 expression in the puncture-induced rat IVDD model was in line with the results of our in vitro experiments (Figure 11K and L).
 |
Figure 11 Experimental validation of ANGPTL4 under T2DM and IVDD. (A) Volcano plot of the expression level of NP cells stimulated by TNF-α via RNA sequencing. (Threshold as following, |fold change| ≥ 0, normalized to control, Q-value <0.001) (B) KEGG enrichment analysis based on the expression level of genes via RNA sequencing. (C–E) Quantification of ANGPTL4 in the RNA and protein level by RT-qPCR and Western blotting stimulated by HGHF and TNF-α. (F) Quantification of the efficacy of siANGPTL4 assessed by RT-qPCR. (G and H) Quantification of ECM degradation-related genes assessed by Western blotting treated by siANGPTL4 under the stimulation of TNF-α and HGHF in vitro. (I and J) Representative images and quantification of ANGPTL4 detected by immunofluorescence stimulated by HGHF and TNF-α. (K and L) Representative images and quantification of ANGPTL4 by immunohistochemistry in puncture-induced rat IVDD model, n=6. All data are presented as mean ± SD. *P < 0.05, **P < 0.01, ***P<0.001 and ****P<0.0001, n = 3. Arrows represent signaling pathways related to ECM degradation and T2DM in IVDD; T2DM, type 2 diabetes mellitus. Abbreviations: IVDD, intervertebral disc degeneration; NP, nucleus pulposus; HGHF, exogenous addition of glucose and palmitic acid; ECM, extracellular matrix. |
Discussion
A close relationship between IVD and DM was reported by Hirsh et al in 1984.54 As research on T2DM and IVDD continues, numerous studies have demonstrated a mutual correlation between T2DM and IVDD. A meta-analysis in 2016 reported that diabetes (OR 1.19, 95% CI 1.06–1.32) served as a significant risk factor in recurrent lumbar disc herniation in a systematic review including 17 studies.55 In 1998, Robinson et al confirmed that human diabetic IVD tissues showed a reduction in matrix sulfated GAG content and glycosylation rate.56 Researches based on Experiments have revealed that some genes such as CBP, PGC1α, Runx2, ChREBP, and P300 participate in the progression of IVDD and T2DM. However, this only partially explains the genetic involvement and lacks thorough analysis.57,58 Furthermore, diabetes-related products, such as amyloid protein, leptin, and glucagon-like peptide-1 (GLP-1, a safe polypeptide hormone for treating T2DM), are also related to IVDD. However, the exact molecular mechanisms underlying crosstalk between IVDD and T2DM remain unclear. Our study is the first to explore the commonly shared gene characteristics of IVDD and T2DM to optimize the strategies of detection, diagnosis, and treatment.
A deeper investigation of the roles of T2DM has made it possible to better understand the potentially interactive pathogenesis of T2DM and IVDD. In addition to obesity and secondary mechanical overloading, which are characterized as classic types of T2DM, inflammation, hyperglycemia, and advanced glycation end products (AGEs) induced by T2DM could accelerate the progression of IVDD. The IVD consists of the central NP, CEP, and surrounding AF in a relatively hypoxic, acidic, hyperosmotic, and avascular microenvironment. During the progression of degeneration, changes in the microenvironment can significantly influence IVD cell state. For instance, it is possible for NPCs in the physiological state to be transformed into catabolic activities in certain environments, such as stimulation by AGEs.24 Previous studies have demonstrated that the dysregulation of the IVD microenvironment could have direct disadvantages.
Multiple pathways participate in coordinating the various steps in T2DM progression and IVD. The PI3K/AKT pathway is reported to induce insulin impairment, and its dysregulation accelerates T2DM.59 Activation of the PI3K/AKT pathway can alleviate intervertebral disc degeneration.60,61 TXNIP signaling is another newly discovered target that is a novel bridge between IVDD and DM.62–64 We propose that the common pathogenesis of IVDD and DM may be due to similar responses of genes and regulators to changes in the microenvironment.
To determine the hub genes, we examined two cohorts by differential gene expression analysis and identified 13 common genes between T2DM and IVDD. Interestingly, we found that the five hub genes might play a major role in the progression of IVDD and T2DM. Among the five hub genes, ANGPTL4 was finally chosen as the hub gene after validation at both the bioinformatics and experimental levels. ANGPTL4 encodes a glycosylated secreted protein containing a C-terminal fibrinogen domain that functions as a serum hormone to regulate glucose homeostasis, lipid metabolism, and insulin sensitivity. Other angiopoietin-like proteins (ANGPTLs), such as ANGPTL3, ANGPTL4, and ANGPTL8, play important roles in regulating the activity of lipoprotein lipase (LPL), a key enzyme involved in the hydrolysis of plasma lipoproteins.65–68 Kersten et al provided an overview of ANGPTL4 and suggested a link between ANGPTL4 and lipid metabolism.69 Furthermore, it has been found to be involved in many types of musculoskeletal diseases, such as rheumatoid arthritis, osteoarthritis, and osteoporosis, especially in the progression of IVDD.70–74 Another study confirmed that genetic inactivation of ANGPTL4 in ANGPTL4-deficient mice improved insulin sensitivity and glucose homeostasis, thereby reducing the risk of T2DM.75 Moreover, it was also reported that ANGPTL4 overexpression could alter the function of mitochondrial activities and modulate methionine metabolic cycles in liver tissues.76 Similar to previous reports, our results also showed an interaction between ANGPTL4 and mitochondrial activity, lipid metabolism, and ECM degradation based on GO results and heatmap correlation analysis.69,71
The bioinformatic analysis results were further confirmed by experiments. According to a previous study, palmitic acid (PA) is the most abundant saturated free fatty acid.77 High glucose and free fatty acid levels are the main hallmarks of the diabetic microenvironment. In the following experiments, we aimed to mimic the diabetic microenvironment using exogenous supplementation with glucose and PA. NP cells were subjected to the treatment with or without TNF-α (10 ng/mL; R&D Systems, Minneapolis, MN, USA) for 24 h at 37°C and 5% CO2, after which the cells were isolated using TRIzol and subjected to RNA sequencing. The sequencing results demonstrated that ANGPTL4 expression was significantly upregulated in IVDD. Focal adhesion (ECM-related changes) and the AGE-RAGE signaling pathway in diabetic complications, based on KEGG functional enrichment, also confirmed their involvement. In addition, using RT-PCR, Western blotting, and immunofluorescence, our results further confirmed the upregulation of ANGPTL4 in degenerate or diabetic microenvironments by mimicking the conditions of degeneration and diabetes using TNF-α (10ng/mL) and HGHF (25.5 mmol·L−1 glucose + 300 μmol·L−1 palmitic acid, PA) respectively.42 These results show that ANGPTL4 could serve as a common mediator in the IVDD and T2DM pathways.
Cibersort was introduced in 2015 as a powerful tool better than others for characterizing the cell composition in tissues from expression profiles.37 In this study, the pattern of immune cell distribution in the control, degenerate, and T2DM samples did not show multiple differences. We observed the involvement of dendritic cell activation in IVDD progression. Dendritic cells are multifunctional cells characterized by their ability to present antigens, thereby initiating inflammation-related dyshomeostasis.78 Previous studies also reported that the proportion of dendritic cells was significantly upregulated in degenerate or herniated IVD tissues than in normal tissues, possibly due to the involvement of inflammation and adaptive immune.79–81 Further analysis based on different expression levels of ANGPTL4 showed downregulation of NK cell activation and upregulation of resting NK cells in the low expression ANGPTL4 group. This phenomenon has also been validated by immune-related studies associated with IVDD, demonstrating a close relationship between ANGPTL4 and immune filtration in the progression of IVDD.79,82,83 In the development of T2DM, there was no significant change in the immune filtration pattern in our results, which may be due to the sample size or metabolic mechanisms of T2DM rather than the immune disorders of T1DM.84 Further analysis by grouping ANGPTL4 by expression levels demonstrated that CD8+ T cells were significantly upregulated in T2DM patients. However, the distribution of CD8+ T cells varies among different tissues in T2DM based on previous reports. Okano et al reported that CD8+ T cells did not change significantly in T2DM patients.85,86 The analysis of peripheral blood samples from patients with T2DM showed a significant decrease in CD8+ cells.87–90 Stentz et al reported the activation of CD8+ lymphocytes in muscle tissues of T2DM patients.91 Our results showed that upregulation of CD8+ cells grouped by ANGPTL4 in diabetic islets might be due to the migration of CD8+ T cells and involvement of islet inflammation.92 Overall, these results demonstrated that ANGPTL4 plays an important role in the distribution of immune cells.
Further searches of the PubMed database for studies related to miRNAs and T2DM/IVDD identified 35 miRNAs. Among these, miR-495-3p, for example, plays a pathogenic role in diabetic nephropathy and targeted NUP160.93 For IVDD, miR-495-3p attenuates apoptosis and inflammation by targeting IL5RA.94 There was significant downregulation of miR-335-3p and secondary abnormal cell subtypes in both T2DM and IVDD, which might shed light on the therapeutics for diabetes and degeneration by targeting mir-335-3p.93,95 Although many studies related to T2DM or IVDD miRNAs have been performed, there is a gap in research related to the crosstalk between them, which requires more meaningful studies.
In step therapy for IVDD, drug treatment in the early stage is of great significance for relieving LBP and avoiding the risk of surgery. Considering the potentially huge socioeconomic burden caused by surgery, medical administration combined with health education could greatly improve the symptoms of patients to a certain extent and greatly reduce the risk of surgery, thus returning to normal life. For T2DM, drug therapy such as metformin has been greatly promoted as a classic method. In our study, we predicted several target drugs for T2DM and IVDD based on hub genes, among which pepstatin has been proven to have therapeutic effects in the improvement of insulin resistance and inhibition of IVD apoptosis.48,53 Pepstatin is a highly efficient cell-permeable aspartyl protease inhibitor.96 In addition, pepstatin could improve the biosynthesis of collagen and restore the binding capacity of plasma proteins in treating various complications of T2DM, such as wounded skin and deterioration of plasma composition and function.50,52,97 Taken together, these studies indicate that pepstatin has huge potential for the treatment of T2DM and IVDD. Based on the results of our study and previous reports, we introduced a novel application of pepstatin.
Our study had some limitations. First, the limitation of clinical information documented in GEO and the possible contamination that induces bias in the final outcomes could not be neglected. Second, further studies, especially in humans, and more functional studies are needed for validation. Finally, clinical trials with a large sample size are needed to verify whether ANGPTL4 is a good indicator of T2DM and IVDD.
Conclusion
In conclusion, our research proposed common gene signatures to demonstrate the potential underlying mechanisms of IVDD and T2DM and identified ANGPTL4 as an immune-associated biomarker and a possible therapeutic target for both IVDD and T2DM.
Data Sharing Statement
The original contributions of this study are as follows. Further inquiries can be directed to the corresponding authors.
Ethic Statement
Animal Ethics approval was obtained from the Institutional Animal Ethics Review Board of Shanghai Ninth People’s Hospital (Approval #SH9H-2021-TK326-1).
Consent for Publication
All authors gave the approval of the publication of the final manuscript.
Acknowledgments
We are grateful to Xiankun Cao and Tangjun Zhou for their help.
Funding
This study was supported by the Postdoctoral Scientific Research Foundation of Shanghai Ninth People’s Hospital and the National Natural Science Foundation of China (grant numbers 82130073, 81572768, and 81972136).
Disclosure
No conflict of interest exists declared by authors.
References
1. Diseases GBD, Injuries C. Global burden of 369 diseases and injuries in 204 countries and territories, 1990–2019: a systematic analysis for the global burden of disease study 2019. Lancet. 2020;396(10258):1204–1222.
2. Hartvigsen J, Hancock MJ, Kongsted A, et al. What low back pain is and why we need to pay attention. Lancet. 2018;391(10137):2356–2367. doi:10.1016/S0140-6736(18)30480-X
3. Livshits G, Popham M, Malkin I, et al. Lumbar disc degeneration and genetic factors are the main risk factors for low back pain in women: the UK Twin Spine Study. Ann Rheum Dis. 2011;70(10):1740–1745. doi:10.1136/ard.2010.137836
4. Binch ALA, Fitzgerald JC, Growney EA, et al. Cell-based strategies for IVD repair: clinical progress and translational obstacles. Nat Rev Rheumatol. 2021;17(3):158–175. doi:10.1038/s41584-020-00568-w
5. Zhang S, Hu B, Liu W, et al. The role of structure and function changes of sensory nervous system in intervertebral disc-related low back pain. Osteoarthritis Cartilage. 2021;29(1):17–27. doi:10.1016/j.joca.2020.09.002
6. Zhang W, Li G, Luo R, et al. Cytosolic escape of mitochondrial DNA triggers cGAS-STING-NLRP3 axis-dependent nucleus pulposus cell pyroptosis. Exp Mol Med. 2022;54(2):129–142. doi:10.1038/s12276-022-00729-9
7. Zhou Y, Chen X, Tian Q, et al. Deletion of ApoE leads to intervertebral disc degeneration via aberrant activation of adipokines. Spine. 2022;47(12):899–907. doi:10.1097/BRS.0000000000004311
8. Baba H, Maezawa Y, Furusawa N, et al. Herniated cervical intervertebral discs: histological and immunohistochemical characteristics. Eur J Histochem. 1997;41(4):261–270.
9. Wang L, He T, Liu J, et al. Revealing the immune infiltration landscape and identifying diagnostic biomarkers for lumbar disc herniation. Front Immunol. 2021;12:666355. doi:10.3389/fimmu.2021.666355
10. Cannata F, Vadalà G, Ambrosio L, et al. Intervertebral disc degeneration: a focus on obesity and type 2 diabetes. Diabetes Metab Res Rev. 2020;36(1):e3224. doi:10.1002/dmrr.3224
11. Agius R, Galea R, Fava S. Bone mineral density and intervertebral disc height in type 2 diabetes. J Diabetes Complications. 2016;30(4):644–650. doi:10.1016/j.jdiacomp.2016.01.021
12. Jiang Z, Lu W, Zeng Q, et al. High glucose-induced excessive reactive oxygen species promote apoptosis through mitochondrial damage in rat cartilage endplate cells. J Orthop Res. 2018;36(9):2476–2483. doi:10.1002/jor.24016
13. Grunhagen T, Shirazi-Adl A, Fairbank JCT, et al. Intervertebral disk nutrition: a review of factors influencing concentrations of nutrients and metabolites. Orthop Clin North Am. 2011;42(4):465–477. doi:10.1016/j.ocl.2011.07.010
14. Thrailkill KM, Lumpkin CK, Bunn RC, et al. Is insulin an anabolic agent in bone? Dissecting the diabetic bone for clues. Am J Physiol Endocrinol Metab. 2005;289(5):E735–45. doi:10.1152/ajpendo.00159.2005
15. Francisco V, Pino J, González-Gay MÁ, et al. A new immunometabolic perspective of intervertebral disc degeneration. Nat Rev Rheumatol. 2022;18(1):47–60. doi:10.1038/s41584-021-00713-z
16. Huang YC, Urban JP, Luk KD. Intervertebral disc regeneration: do nutrients lead the way? Nat Rev Rheumatol. 2014;10(9):561–566. doi:10.1038/nrrheum.2014.91
17. Hou G, Zhao H, Teng H, et al. N-cadherin attenuates high glucose-induced nucleus pulposus cell senescence through regulation of the ROS/NF-kappaB Pathway. Cell Physiol Biochem. 2018;47(1):257–265. doi:10.1159/000489804
18. Kong JG, Park J-B, Lee D, et al. Effect of high glucose on stress-induced senescence of nucleus pulposus cells of adult rats. Asian Spine J. 2015;9(2):155–161. doi:10.4184/asj.2015.9.2.155
19. Cummings BP, Strader AD, Stanhope KL, et al. Ileal interposition surgery improves glucose and lipid metabolism and delays diabetes onset in the UCD-T2DM rat. Gastroenterology. 2010;138(7):2437–46, 2446 e1. doi:10.1053/j.gastro.2010.03.005
20. Fields AJ, Berg‐Johansen B, Metz LN, et al. Alterations in intervertebral disc composition, matrix homeostasis and biomechanical behavior in the UCD-T2DM rat model of type 2 diabetes. J Orthop Res. 2015;33(5):738–746. doi:10.1002/jor.22807
21. Tsai TT, Ho NY-J, Lin Y-T, et al. Advanced glycation end products in degenerative nucleus pulposus with diabetes. J Orthop Res. 2014;32(2):238–244. doi:10.1002/jor.22508
22. Illien-Junger S, Torre OM, Kindschuh WF, et al. AGEs induce ectopic endochondral ossification in intervertebral discs. Eur Cell Mater. 2016;32:257–270. doi:10.22203/eCM.v032a17
23. Illien-Junger S, Lu Y, Qureshi SA, et al. Chronic ingestion of advanced glycation end products induces degenerative spinal changes and hypertrophy in aging pre-diabetic mice. PLoS One. 2015;10(2):e0116625. doi:10.1371/journal.pone.0116625
24. Song Y, Wang Y, Zhang Y, et al. Advanced glycation end products regulate anabolic and catabolic activities via NLRP3-inflammasome activation in human nucleus pulposus cells. J Cell Mol Med. 2017;21(7):1373–1387. doi:10.1111/jcmm.13067
25. Teraguchi M, Yoshimura N, Hashizume H, et al. Progression, incidence, and risk factors for intervertebral disc degeneration in a longitudinal population-based cohort: the Wakayama spine study. Osteoarthritis Cartilage. 2017;25(7):1122–1131. doi:10.1016/j.joca.2017.01.001
26. Fabiane SM, Ward KJ, Iatridis JC, et al. Does type 2 diabetes mellitus promote intervertebral disc degeneration? Eur Spine J. 2016;25(9):2716–2720. doi:10.1007/s00586-016-4612-3
27. Yan S, Sun M, Gao L, et al. Identification of key LncRNAs and pathways in prediabetes and type 2 diabetes mellitus for hypertriglyceridemia patients based on weighted gene co-expression network analysis. Front Endocrinol. 2021;12:800123. doi:10.3389/fendo.2021.800123
28. Wang S, Tian J, Wang J, et al. Identification of the biomarkers and pathological process of heterotopic ossification: weighted gene Co-Expression network analysis. Front Endocrinol. 2020;11:581768. doi:10.3389/fendo.2020.581768
29. Hu Y, Zeng N, Ge Y, et al. Identification of the shared gene signatures and biological mechanism in type 2 diabetes and pancreatic cancer. Front Endocrinol. 2022;13:847760. doi:10.3389/fendo.2022.847760
30. Ritchie ME, Phipson B, Wu D, et al. limma powers differential expression analyses for RNA-sequencing and microarray studies. Nucleic Acids Res. 2015;43(7):e47. doi:10.1093/nar/gkv007
31. Davis S, Meltzer PS. GEOquery: a bridge between the Gene Expression Omnibus (GEO) and BioConductor. Bioinformatics. 2007;23(14):1846–1847. doi:10.1093/bioinformatics/btm254
32. Bardou P, Mariette J, Escudié F, et al. jvenn: an interactive Venn diagram viewer. BMC Bioinf. 2014;15(1):293. doi:10.1186/1471-2105-15-293
33. von Mering C. STRING: a database of predicted functional associations between proteins. Nucleic Acids Res. 2003;31(1):258–261. doi:10.1093/nar/gkg034
34. Shannon P, Markiel A, Ozier O, et al. Cytoscape: a software environment for integrated models of biomolecular interaction networks. Genome Res. 2003;13(11):2498–2504. doi:10.1101/gr.1239303
35. Chin CH, Chen S-H, Wu H-H, et al. cytoHubba: identifying hub objects and sub-networks from complex interactome. BMC Syst Biol. 2014;8(Suppl 4):S11. doi:10.1186/1752-0509-8-S4-S11
36. Yu G, Wang L-G, Han Y, et al. clusterProfiler: an R package for comparing biological themes among gene clusters. OMICS. 2012;16(5):284–287. doi:10.1089/omi.2011.0118
37. Newman AM, Liu CL, Green MR, et al. Robust enumeration of cell subsets from tissue expression profiles. Nat Methods. 2015;12(5):453–457. doi:10.1038/nmeth.3337
38. Jayadev R, Morais MRPT, Ellingford JM, et al. A basement membrane discovery pipeline uncovers network complexity, regulators, and human disease associations. Sci Adv. 2022;8(20):eabn2265. doi:10.1126/sciadv.abn2265
39. Han H, Cho J-W, Lee S, et al. TRRUST v2: an expanded reference database of human and mouse transcriptional regulatory interactions. Nucleic Acids Res. 2018;46(D1):D380–D386. doi:10.1093/nar/gkx1013
40. Chang L, Zhou G, Soufan O, et al. miRNet 2.0: network-based visual analytics for miRNA functional analysis and systems biology. Nucleic Acids Res. 2020;48(W1):W244–W251. doi:10.1093/nar/gkaa467
41. Yoo M, Shin J, Kim J, et al. DSigDB: drug signatures database for gene set analysis. Bioinformatics. 2015;31(18):3069–3071. doi:10.1093/bioinformatics/btv313
42. Yang Y, Lin Y, Wang M, et al. Targeting ferroptosis suppresses osteocyte glucolipotoxicity and alleviates diabetic osteoporosis. Bone Res. 2022;10(1):26. doi:10.1038/s41413-022-00198-w
43. Zhou L, Huang Y, Xie H, et al. Buyang Huanwu Tang improves denervation-dependent muscle atrophy by increasing ANGPTL4, and increases NF-kappaB and MURF1 levels. Mol Med Rep. 2018;17(3):3674–3680. doi:10.3892/mmr.2017.8306
44. Han B, Zhu K, Li F-C, et al. A simple disc degeneration model induced by percutaneous needle puncture in the rat tail. Spine. 2008;33(18):1925–1934. doi:10.1097/BRS.0b013e31817c64a9
45. Zhou T, Yang X, Chen Z, et al. Prussian blue nanoparticles stabilize SOD1 from ubiquitination-proteasome degradation to rescue intervertebral disc degeneration. Adv Sci. 2022;9(10):e2105466. doi:10.1002/advs.202105466
46. Jain SK, Kannan K. Chromium chloride inhibits oxidative stress and TNF-alpha secretion caused by exposure to high glucose in cultured U937 monocytes. Biochem Biophys Res Commun. 2001;289(3):687–691. doi:10.1006/bbrc.2001.6026
47. Price Evans DA, Tariq M, Dafterdar R, et al. Chromium chloride administration causes a substantial reduction of coronary lipid deposits, aortic lipid deposits, and serum cholesterol concentration in rabbits. Biol Trace Elem Res. 2009;130(3):262–272. doi:10.1007/s12011-009-8333-x
48. Shi L, Jiang L, Zhang X, et al. Pyrroloquinoline quinone protected autophagy-dependent apoptosis induced by mono(2-ethylhexyl) phthalate in INS-1 cells. Hum Exp Toxicol. 2020;39(2):194–211. doi:10.1177/0960327119882983
49. Kobayashi S, Zhao F, Kobayashi T, et al. Hyperglycemia-induced cardiomyocyte death is mediated by lysosomal membrane injury and aberrant expression of cathepsin D. Biochem Biophys Res Commun. 2020;523(1):239–245. doi:10.1016/j.bbrc.2019.12.051
50. Palka J, Bankowski E, Wolanska M. Changes in IGF-binding proteins in rats with experimental diabetes. Ann Biol Clin. 1993;51(7–8):701–706.
51. Fukuda N. Leukocyte angiotensin II levels inpatients with essential hypertension:relation to insulin resistance. Am J Hypertens. 2003;16(2):129–134. doi:10.1016/S0895-7061(02)03145-X
52. Roche M, Pattabiraman TN. Further studies on proteinases and alpha 2-macroglobulin activity in diabetic plasma. Indian J Biochem Biophys. 1992;29(2):189–191.
53. Cai X, Liu Y, Hu Y, et al. ROS-mediated lysosomal membrane permeabilization is involved in bupivacaine-induced death of rabbit intervertebral disc cells. Redox Biol. 2018;18:65–76. doi:10.1016/j.redox.2018.06.010
54. Hirsh LF. Diabetic polyradiculopathy simulating lumbar disc disease. Report of four cases. J Neurosurg. 1984;60(1):183–186. doi:10.3171/jns.1984.60.1.0183
55. Huang W, Han Z, Liu J, et al. Risk factors for recurrent lumbar disc herniation: a systematic review and meta-analysis. Medicine. 2016;95(2):e2378. doi:10.1097/MD.0000000000002378
56. Robinson D, Mirovsky Y, Halperin N, et al. Changes in proteoglycans of intervertebral disc in diabetic patients. A possible cause of increased back pain. Spine. 1998;23(8):849–55; discussion 856. doi:10.1097/00007632-199804150-00001
57. Tseng C, Han Y, Lv Z, et al. Glucose-stimulated PGC-1alpha couples with CBP and Runx2 to mediate intervertebral disc degeneration through transactivation of ADAMTS4/5 in diet-induced obesity mice. Bone. 2022;167:116617. doi:10.1016/j.bone.2022.116617
58. Feng Y, Wang H, Chen Z, et al. High glucose mediates the ChREBP/p300 transcriptional complex to activate proapoptotic genes Puma and BAX and contributes to intervertebral disc degeneration. Bone. 2021;153:116164. doi:10.1016/j.bone.2021.116164
59. Ramasubbu K, Devi Rajeswari V. Impairment of insulin signaling pathway PI3K/Akt/mTOR and insulin resistance induced AGEs on diabetes mellitus and neurodegenerative diseases: a perspective review. Mol Cell Biochem. 2022;478(6):1307–1324. doi:10.1007/s11010-022-04587-x
60. Wang Z, Zhao Y, Liu Y, et al. Circ0007042 alleviates intervertebral disc degeneration by adsorbing miR-369 to upregulate BMP2 and activate the PI3K/AKt pathway. Arthritis Res Ther. 2022;24(1):214. doi:10.1186/s13075-022-02895-7
61. Ouyang ZH, Wang W-J, Yan Y-G, et al. The PI3K/Akt pathway: a critical player in intervertebral disc degeneration. Oncotarget. 2017;8(34):57870–57881. doi:10.18632/oncotarget.18628
62. Ling C. Epigenetic regulation of insulin action and secretion - role in the pathogenesis of type 2 diabetes. J Intern Med. 2020;288(2):158–167. doi:10.1111/joim.13049
63. Szpigel A, Hainault I, Carlier A, et al. Lipid environment induces ER stress, TXNIP expression and inflammation in immune cells of individuals with type 2 diabetes. Diabetologia. 2018;61(2):399–412. doi:10.1007/s00125-017-4462-5
64. Zhou Y, Chen Z, Yang X, et al. Morin attenuates pyroptosis of nucleus pulposus cells and ameliorates intervertebral disc degeneration via inhibition of the TXNIP/NLRP3/Caspase-1/IL-1beta signaling pathway. Biochem Biophys Res Commun. 2021;559:106–112. doi:10.1016/j.bbrc.2021.04.090
65. Zhang R. The ANGPTL3-4-8 model, a molecular mechanism for triglyceride trafficking. Open Biol. 2016;6(4):150272. doi:10.1098/rsob.150272
66. Dijk W, Kersten S. Regulation of lipoprotein lipase by Angptl4. Trends Endocrinol Metab. 2014;25(3):146–155. doi:10.1016/j.tem.2013.12.005
67. Quagliarini F, Wang Y, Kozlitina J, et al. Atypical angiopoietin-like protein that regulates ANGPTL3. Proc Natl Acad Sci U S A. 2012;109(48):19751–19756. doi:10.1073/pnas.1217552109
68. Abu-Farha M, Cherian P, Qaddoumi MG, et al. Increased plasma and adipose tissue levels of ANGPTL8/Betatrophin and ANGPTL4 in people with hypertension. Lipids Health Dis. 2018;17(1):35. doi:10.1186/s12944-018-0681-0
69. Kersten S. Role and mechanism of the action of angiopoietin-like protein ANGPTL4 in plasma lipid metabolism. J Lipid Res. 2021;62:100150. doi:10.1016/j.jlr.2021.100150
70. Swales C, Athanasou NA, Knowles HJ, Malaval L. Angiopoietin-like 4 is over-expressed in rheumatoid arthritis patients: association with pathological bone resorption. PLoS One. 2014;9(10):e109524. doi:10.1371/journal.pone.0109524
71. Jia C, Li X, Pan J, et al. Silencing of angiopoietin-like protein 4 (Angptl4) decreases inflammation, extracellular matrix degradation, and apoptosis in osteoarthritis via the sirtuin 1/NF-kappaB pathway. Oxid Med Cell Longev. 2022;2022:1135827. doi:10.1155/2022/1135827
72. Murata M, Yudo K, Nakamura H, et al. Hypoxia upregulates the expression of angiopoietin-like-4 in human articular chondrocytes: role of angiopoietin-like-4 in the expression of matrix metalloproteinases and cartilage degradation. J Orthop Res. 2009;27(1):50–57. doi:10.1002/jor.20703
73. Knowles HJ, Cleton-Jansen A-M, Korsching E, et al. Hypoxia-inducible factor regulates osteoclast-mediated bone resorption: role of angiopoietin-like 4. FASEB J. 2010;24(12):4648–4659. doi:10.1096/fj.10-162230
74. Liu FJ, Xie L-Y, Li H-Z, et al. Expression of ANGPTL4 in nucleus pulposus tissues is associated with intervertebral disc degeneration. Dis Markers. 2021;2021:3532716. doi:10.1155/2021/3532716
75. Gusarova V, O’Dushlaine C, Teslovich TM, et al. Genetic inactivation of ANGPTL4 improves glucose homeostasis and is associated with reduced risk of diabetes. Nat Commun. 2018;9(1):2252. doi:10.1038/s41467-018-04611-z
76. Wang Y, Lam KSL, Lam JBB, et al. Overexpression of angiopoietin-like protein 4 alters mitochondria activities and modulates methionine metabolic cycle in the liver tissues of db/db diabetic mice. Mol Endocrinol. 2007;21(4):972–986. doi:10.1210/me.2006-0249
77. Al Saedi A, Myers DE, Stupka N, et al. 1,25(OH)(2)D(3) ameliorates palmitate-induced lipotoxicity in human primary osteoblasts leading to improved viability and function. Bone. 2020;141:115672. doi:10.1016/j.bone.2020.115672
78. Worbs T, Hammerschmidt SI, Forster R. Dendritic cell migration in health and disease. Nat Rev Immunol. 2017;17(1):30–48. doi:10.1038/nri.2016.116
79. Li W, Zhang S, Zhao Y, et al. Revealing the Key MSCs Niches and Pathogenic Genes in Influencing CEP Homeostasis: a Conjoint Analysis of Single-Cell and WGCNA. Front Immunol. 2022;13:933721. doi:10.3389/fimmu.2022.933721
80. Lan T, Hu Z, Guo W, et al. Development of a novel inflammatory-associated gene signature and immune infiltration patterns in intervertebral disc degeneration. Oxid Med Cell Longev. 2022;2022:2481071. doi:10.1155/2022/2481071
81. Geiss A, Sobottke R, Delank KS, et al. Plasmacytoid dendritic cells and memory T cells infiltrate true sequestrations stronger than subligamentous sequestrations: evidence from flow cytometric analysis of disc infiltrates. Eur Spine J. 2016;25(5):1417–1427. doi:10.1007/s00586-015-4325-z
82. Murai K, Sakai D, Nakamura Y, et al. Primary immune system responders to nucleus pulposus cells: evidence for immune response in disc herniation. Eur Cell Mater. 2010;19:13–21. doi:10.22203/eCM.v019a02
83. Cardenas-Egusquiza AL, Berntsen D. Sleeping poorly is robustly associated with a tendency to engage in spontaneous waking thought. Conscious Cogn. 2022;105:103401. doi:10.1016/j.concog.2022.103401
84. Eizirik DL, Pasquali L, Cnop M. Pancreatic beta-cells in type 1 and type 2 diabetes mellitus: different pathways to failure. Nat Rev Endocrinol. 2020;16(7):349–362. doi:10.1038/s41574-020-0355-7
85. Nam HW, Cho YJ, Lim JA, et al. Functional status of immune cells in patients with long-lasting type 2 diabetes mellitus. Clin Exp Immunol. 2018;194(1):125–136. doi:10.1111/cei.13187
86. Okano K, Araki M, Yamamoto M, et al. Exploration of hematological and immunological changes associated with the severity of type 2 diabetes mellitus in Japan. Nurs Health Sci. 2008;10(1):65–69. doi:10.1111/j.1442-2018.2007.00376.x
87. Miya A, Nakamura A, Miyoshi H, et al. Impact of glucose loading on variations in CD4(+) and CD8(+) T cells in Japanese participants with or without type 2 diabetes. Front Endocrinol. 2018;9:81. doi:10.3389/fendo.2018.00081
88. Han M, Ma K, Wang X, et al. Immunological characteristics in type 2 diabetes mellitus among COVID-19 Patients. Front Endocrinol. 2021;12:596518. doi:10.3389/fendo.2021.596518
89. van der Pouw Kraan TC, Chen WJ, Bunck MCM, et al. Metabolic changes in type 2 diabetes are reflected in peripheral blood cells, revealing aberrant cytotoxicity, a viral signature, and hypoxia inducible factor activity. BMC Med Genomics. 2015;8(1):20. doi:10.1186/s12920-015-0096-y
90. Medellin-Garibay SE, Cortez-Espinosa N, Milán-Segovia RC, et al. Clinical pharmacokinetics of rifampin in patients with tuberculosis and type 2 diabetes mellitus: association with biochemical and immunological parameters. Antimicrob Agents Chemother. 2015;59(12):7707–7714. doi:10.1128/AAC.01067-15
91. Stentz FB, Kitabchi AE. Transcriptome and proteome expressions involved in insulin resistance in muscle and activated T-lymphocytes of patients with type 2 diabetes. Genomics Proteomics Bioinf. 2007;5(3–4):216–235. doi:10.1016/S1672-0229(08)60009-1
92. Ying W, Fu W, Lee YS, et al. The role of macrophages in obesity-associated islet inflammation and beta-cell abnormalities. Nat Rev Endocrinol. 2020;16(2):81–90. doi:10.1038/s41574-019-0286-3
93. Xie J, Chen Z, Yao G, et al. NUP160 knockdown inhibits the progression of diabetic nephropathy in vitro and in vivo. Regen Ther. 2022;21:87–95. doi:10.1016/j.reth.2022.05.011
94. Lin X, Lin Q. MiRNA-495-3p attenuates TNF-alpha Induced Apoptosis and Inflammation in human nucleus pulposus cells by targeting IL5RA. Inflammation. 2020;43(5):1797–1805. doi:10.1007/s10753-020-01254-5
95. Yu L, Hao Y, Xu C, et al. LINC00969 promotes the degeneration of intervertebral disk by sponging miR-335-3p and regulating NLRP3 inflammasome activation. IUBMB Life. 2019;71(5):611–618. doi:10.1002/iub.1989
96. Burster T, Reich M, Zaidi N, et al. Cathepsin E regulates the presentation of tetanus toxin C-fragment in PMA activated primary human B cells. Biochem Biophys Res Commun. 2008;377(4):1299–1303. doi:10.1016/j.bbrc.2008.10.162
97. Palka J, Sobolewski K, Bankowski E. Cathepsin D inhibitor from potato reverses inhibition of collagen biosynthesis in wounded skin of rats with experimental diabetes. Acta Biochim Pol. 1991;38(1):115–118.
 © 2023 The Author(s). This work is published and licensed by Dove Medical Press Limited. The
full terms of this license are available at https://www.dovepress.com/terms
and incorporate the Creative Commons Attribution
- Non Commercial (unported, 3.0) License.
By accessing the work you hereby accept the Terms. Non-commercial uses of the work are permitted
without any further permission from Dove Medical Press Limited, provided the work is properly
attributed. For permission for commercial use of this work, please see paragraphs 4.2 and 5 of our Terms.
© 2023 The Author(s). This work is published and licensed by Dove Medical Press Limited. The
full terms of this license are available at https://www.dovepress.com/terms
and incorporate the Creative Commons Attribution
- Non Commercial (unported, 3.0) License.
By accessing the work you hereby accept the Terms. Non-commercial uses of the work are permitted
without any further permission from Dove Medical Press Limited, provided the work is properly
attributed. For permission for commercial use of this work, please see paragraphs 4.2 and 5 of our Terms.
Recommended articles
Combination of TyG Index and GRACE Risk Score as Long-Term Prognostic Marker in Patients with ACS Complicated with T2DM Undergoing PCI
Qin Z, Xu S, Yuan R, Wang Z, Lu Y, Xu Y, Lv Y, Yu F, Bai J, Zhang H, Zhang L, Zhang J, Tang J
Diabetes, Metabolic Syndrome and Obesity 2022, 15:3015-3025
Published Date: 28 September 2022
Increased Expression of miR-155 in Peripheral Blood and Wound Margin Tissue of Type 2 Diabetes Mellitus Patients Associated with Diabetic Foot Ulcer
Xu M, Li Y, Tang Y, Zhao X, Xie D, Chen M
Diabetes, Metabolic Syndrome and Obesity 2022, 15:3415-3428
Published Date: 3 November 2022
Role of Increased miR-222-3p Expression in Peripheral Blood and Wound Marginal Tissues of Type 2 Diabetes Mellitus Patients with Diabetic Foot Ulcer
Jie R, Qian J, Tang Y, Li Y, Xu M, Zhao X, Chen M
Diabetes, Metabolic Syndrome and Obesity 2023, 16:2419-2432
Published Date: 15 August 2023
Sex Difference in the Association Between Serum Versican and Albuminuria in Patients with Type 2 Diabetes Mellitus
Li S, Li N, Li L, Zhan J
Diabetes, Metabolic Syndrome and Obesity 2023, 16:3631-3639
Published Date: 11 November 2023
Serum Podoplanin Levels as a Potential Biomarker for Diabetic Nephropathy Progression: A Cross-Sectional Study
Huan F, Jiang X
Diabetes, Metabolic Syndrome and Obesity 2024, 17:4701-4710
Published Date: 6 December 2024