Back to Journals » Cancer Management and Research » Volume 10
Analysis of potential genes associated with primary cilia in bladder cancer
Authors Du E, Lu C, Sheng F, Li C, Li H, Ding N, Chen Y, Zhang T, Yang K, Xu Y
Received 26 May 2018
Accepted for publication 21 June 2018
Published 29 August 2018 Volume 2018:10 Pages 3047—3056
DOI https://doi.org/10.2147/CMAR.S175419
Checked for plagiarism Yes
Review by Single anonymous peer review
Peer reviewer comments 2
Editor who approved publication: Professor Harikrishna Nakshatri
E Du,1,* Chao Lu,1,* Fei Sheng,1 Changying Li,1 Hong Li,2 Na Ding,1 Yue Chen,1 Ting Zhang,1 Kuo Yang,1 Yong Xu1
1Central Laboratory, Tianjin Institute of Urology, The Second Hospital of Tianjin Medical University, Tianjin 300211, People’s Republic of China; 2The Institute of Molecular Cardiology, Medical school, University of Louisville, Louisville, KY, USA
*These authors contributed equally to this work
Background: Dysfunction of primary cilia (PC), which could influence cell cycle and modulate cilia-related signaling transduction, has been reported in several cancers. However, there is no evidence of their function in bladder cancer (BLCA). This study was performed to investigate the presence of PC in BLCA and to explore the potential molecular mechanisms underlying the PC in BLCA.
Patients and methods: The presence of PC was assessed in BLCA and adjacent non-cancerous tissues. The gene expression dataset GSE52519 was employed to obtain differentially expressed genes (DEGs) associated with PC. The mRNA expression of the DEGs were confirmed by Gene Expression Profiling Interactive Analysis. The DEGs properties and pathways were analyzed by Gene ontology and Kyoto Encyclopedia of Genes and Genomes pathway enrichment analysis. Genomatix software was used to predict putative transcription factor binding sites (TFBS) in the promoter region of DEGs, and the transcription factors were achieved according to the shared TFBS, which were supported by the ChIP-Sequence data.
Results: PC were found to be reduced in BLCA tissue samples in this study. Seven DEGs were observed to be associated with PC, and gene ontology and Kyoto Encyclopedia of Genes and Genomes pathway enrichment analysis indicated that these DEGs exhibited the properties and functions of PC, and that the Hedgehog signaling pathway probably participated in the pathogenesis and progression of BLCA. The mRNA expression of the seven DEGs in 404 BLCA and 28 normal tissue samples were analyzed, and five DEGs including CENPF, STIL, AURKA, STK39 and OSR1 were identified. Five TFBS including CREB, E2FF, EBOX, ETSF and HOXF in the promoter region of five DEGs were calculated and the transcription factors were obtained according to the shared TFBS.
Conclusion: PC were found to be reduced in BLCA, and the potential molecular mechanisms of PC in BLCA helped to provide novel diagnosis and therapeutic targets for BLCA.
Keywords: bladder cancer, primary cilia, differentially expressed genes, microarray analysis, transcription factors
Introduction
Bladder cancer (BLCA), one of the most common malignancies worldwide, responsible for nearly 150,000 deaths each year, represents an important public health problem.1 BLCA is classified into two subtypes based on whether the cancer cells infiltrate into the muscle layer of the bladder or not. Non-muscle invasive bladder cancer (NMIBC) is less aggressive with an easy prognosis, but with 50% high recurrence rate, while muscle invasive bladder cancer (MIBC) is frequent metastasis resulting in a poor 5-year survival rate.2
Primary cilia (PC) are immotile, evolutionarily conserved organelles extending from the surface of nearly every mammalian cell. Defects in the structures or function of PC could result in a variety of disorders which are called ciliopathies.3 Recent studies have shown that dysfunction of PC has strong correlations with cancers by influencing the cell cycle or modulating cilia-related signaling transduction.4–9 However, PC are still poorly characterized organelles in cancers and there is no evidence of their function in BLCA. The presence of PC in BLCA was assessed and a reduced presence was found in this study.
A wide range of complementary studies suggested that changes in ciliary genes or proteins were associated with cancers.10,11 Gene expression studies provided a rich dataset that cilium-associated components were important for cilium formation and function.12 To understand the underlying role PC in BLCA, the differentially expressed genes (DEGs) in BLCA were investigated and the associated pathways, functional landscapes and the transcription factors (TFs) were analyzed. This study illuminated the potential mechanisms of PC in BLCA and helped to provide novel diagnosis and therapeutic targets for BLCA.
Patients and methods
Patients and tumor specimens
Sixteen NMIBC, eleven MIBC and ten adjacent non-cancerous tissue samples were obtained from patients who underwent radical cystectomy at the Second Hospital of Tianjin Medical University from January 2015 to January 2017. No patient had received prior chemotherapy or radiotherapy. Adjacent non-cancerous tissues were taken >2 cm from the tumor in this study. Written informed consent was obtained from all patients. Approval for this study was obtained from the ethics committee of the Tianjin Medical University.
Immunofluorescence analysis
Serial tissue sections were cut from each patient sample. The first serial section was stained with H&E to identify the tissue types of interest on the adjacent serial section by a pathologist. Following fixation with 4% paraformaldehyde for 20 minutes, permeabilization with 0.05% Triton-X and blocking with 5% bovine serum albumin solution for 1 hour at room temperature, the sections were incubated with ciliary marker antibodies against acetylated tubulin (1:800, Sigma-Aldrich) in blocking buffer overnight. After secondary antibody (1:200, Southern Biotech) for 2 hours, the nuclei were stained with 4′,6-diamino-2-phenylindole (Solarbio). PC were counted in randomly selected ×800 microscopic fields. A minimum of 100 nuclei were identified per microscopic field and three microscopic fields were counted in each tissue sample.
Study design and data preprocessing
The gene expression profile GSE52519, including 12 samples, was employed from Gene Expression Omnibus (https://www.ncbi.nlm.nih.gov/geo). Two sample data (GSM1268193 and GSM1268195) with poor heterogeneity were deleted to eliminate the interference of the tumor universality characteristics after normalization and principal component analysis plots. Clustering, correlation heatmaps and volcano plot were constructed from seven BLCA and three healthy bladder samples using R language package at the OmicsBean cancer platform (http://www.omicsbean-cancer.com/). The false discovery rate <0.05 and |log2fold change| ≥1 were applied as the cutoff criteria (Figure 2E).
Gene ontology (GO) and Kyoto Encyclopedia of Genes and Genomes (KEGG) pathway analysis
The functional analysis was performed using OmicsBean cancer data analysis platform. The linked databases were Quick GO (https://www.ebi.ac.uk/QuickGO/), KEGG pathway (http://www.kegg.jp/kegg/patyway.html) and String database (https://string-db.org/cgi/input.pl). GO analysis was conducted in DEGs involving biological process, cellular component and molecular function. KEGG pathway analysis was performed to harvest pathway clusters. P<0.05 was set as the cutoff criterion.
DEGs mRNA expression analysis
The mRNA expression of the DEGs were analyzed in 404 BLCA and 28 normal tissue samples with the assistance of Gene Expression Profiling Interactive Analysis (GEPIA; http://gepia.cancerpku.cn), which is a web-based tool to deliver customizable functionalities based on The Cancer Genome Atlas and the Genotype-Tissue Expression data.
Transcription regulation prediction
To gain a better understanding of the molecular mechanisms of DEGs in BLCA, Genomatix software was used to predict putative transcription factor binding sites (TFBS) in the promoter region of DEGs in BLCA. The intersections of TFBS among the DEGs were calculated using Venn diagram, and TFs of the DEGs were achieved according to the shared TFBS, which were supported by the ChIP-Sequence data.
Statistical analysis
t-Test was performed for analyzing the presence of PC in tissue samples, the gene expression profile of GSE52519 and the mRNA expression of DEGs in BLCA from The Cancer Genome Atlas and the Genotype-Tissue Expression data. P-value <0.05 or <0.01 represented statistical significance.
Results
PC were reduced in BLCA
An increasing number of papers report on a decrease, loss or distortion of the primary cilium in a variety of cancer types.7,9,13 However, systematic analysis of PC in BLCA has remained largely unknown. To confirm the presence of PC in BLCA, 16 NMIBC, 11 MIBC and 10 adjacent non-cancerous tissue samples were stained with ciliary markers, acetylated tubulin.
Four layers were present in the normal bladder wall: mucosal layer, submucosal layer, muscular layer and serous layer. PC were identified in the mucosal layer in seven out of ten adjacent non-cancerous tissue samples and in 8%–15% of the mucosal cells in ciliated tissues. Also, they were identified in 5 out of 16 NMIBC tissue samples and in 3%–7% cancerous cells in ciliated tissue samples, but one tissue sample ciliated 20%. PC were also identified in three out of eleven MIBC tissue samples and in 2%–6% cancerous cells in ciliated tissue samples, but one tissue sample ciliated 17%. There was a statistical difference in the presence of PC between cancerous and adjacent non-cancerous tissues (P<0.05; Figure 1A, B). The results showed that PC were reduced in BLCA.
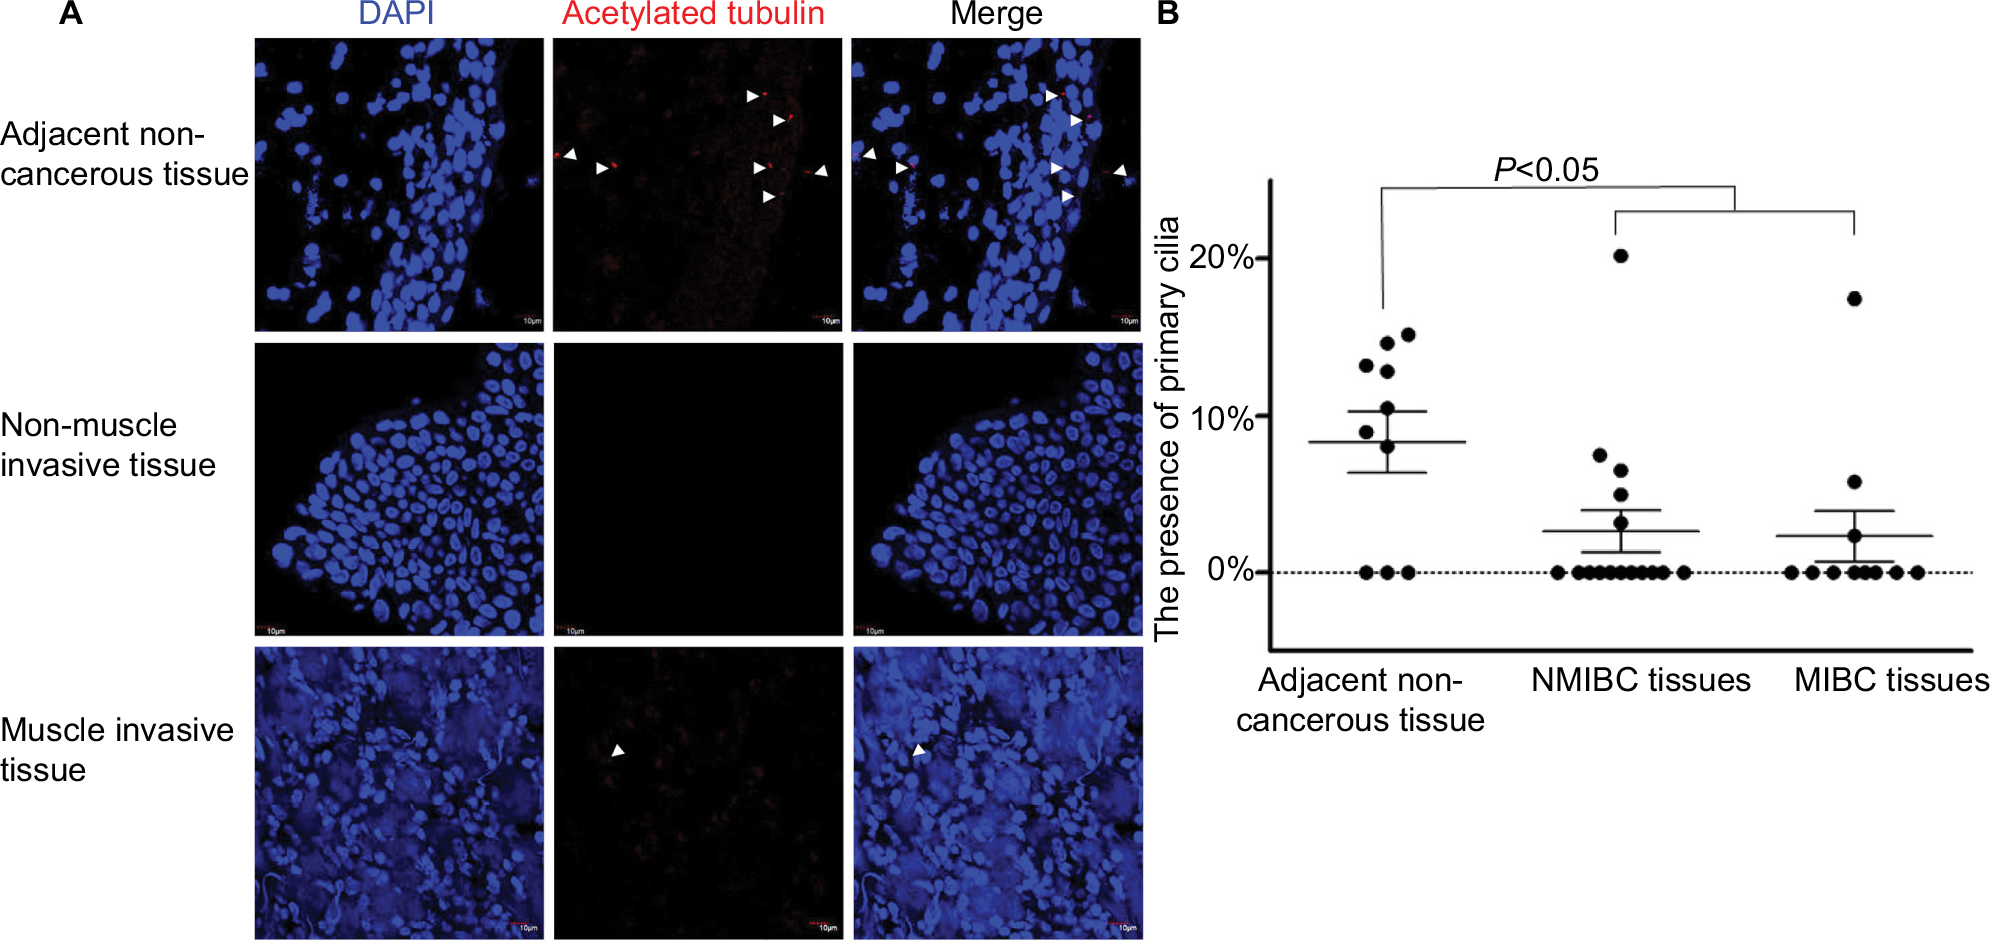 | Figure 1 PC were reduced in BLCA. Notes: (A) Confocal immunofluorescence for the ciliary markers acetylated tubulin in red and DAPI in blue in adjacent non-cancerous, NMIBC and MIBC tissues. Cilia were easily observed in the mucosae of adjacent non-cancerous tissues. (B) The presence of PC in the adjacent non-cancerous, NMIBC and MIBC tissue samples. There was a statistical difference in the presence of PC between cancerous and adjacent non-cancerous tissue samples (P<0.05). Arrows indicate PC. Scale bar, 10 µm. Abbreviations: BLCA, bladder cancer; DAPI, 4′,6-diamidino-2-phenylindole; MIBC, muscle invasive bladder cancer; NMIBC, non-muscle invasive bladder cancer; PC, primary cilia. |
DEGs in BLCA
A gene expression dataset GSE52519 was employed consisting of nine BLCA and three healthy bladder tissue samples. The obscuring variations in the raw expression data were normalized following preprocessing (Figure 2A). Principal component analysis separated the bladder tissues using expression data, with each tissue clearly clustering into normal and BLCA groups (Figure 2B). Two BLCA sample data (GSM1268193 and GSM1268195) with poor heterogeneity were deleted to eliminate the interference of the tumor universality characteristics. Hierarchical cluster analysis separated the samples according to BLCA tissues (Figure 2C). Heatmap and volcano plot were constructed to show the DEGs which might play essential roles in BLCA (Figure 2D, E).
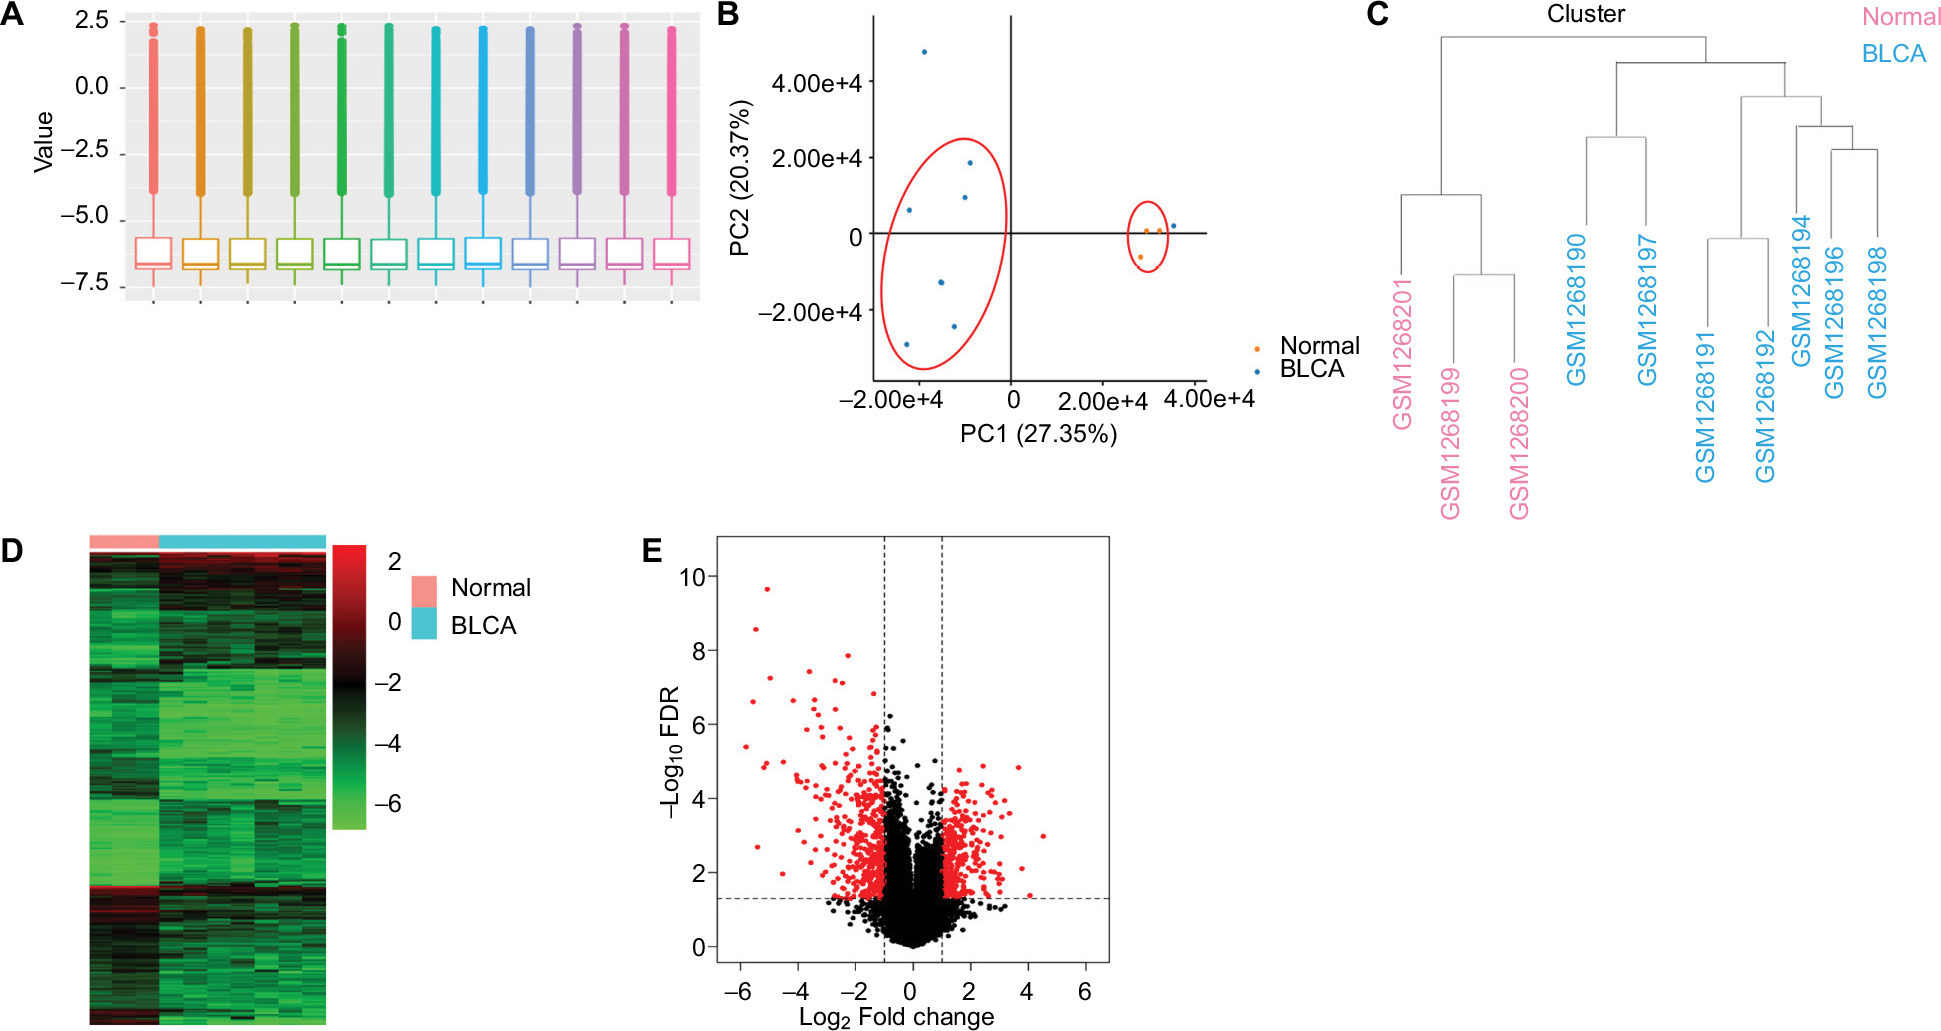 | Figure 2 Analysis of DEGs in BLCA. Notes: (A) The raw expression data were normalized using R language. (B) PCA separated the bladder tissues using expression data, with each tissue clearly clustering into normal and BLCA groups. (C) Clustering of samples after normalization. Hierarchical clustering heatmap (D) and volcano plot (E) are shown of the DEGs in BLCA. Abbreviations: BLCA, bladder cancer; DEGs, differentially expressed genes; FDR, false discovery rate; PCA, principal component analysis. |
DEGs associated with PC in BLCA
A total of 789 DEGs including 336 upregulated genes and 453 downregulated genes were observed in BLCA with the criterion of false discovery rate <0.05 (Figure 3A). Reiter and Leroux3 listed 428 genes that have been associated with ciliary structures and/or functions that could potentially result in known or novel ciliopathies. In our study, Venn diagrams were used to calculate the intersection of two groups of genomes (Figure 3B), and seven DEGs associated with PC including TUBB3, AURKA, CENPF, STIL, STK39, RAB23 and OSR1 were found based on the criteria of fold change >2.5 and P<0.01 (Figure 3C).
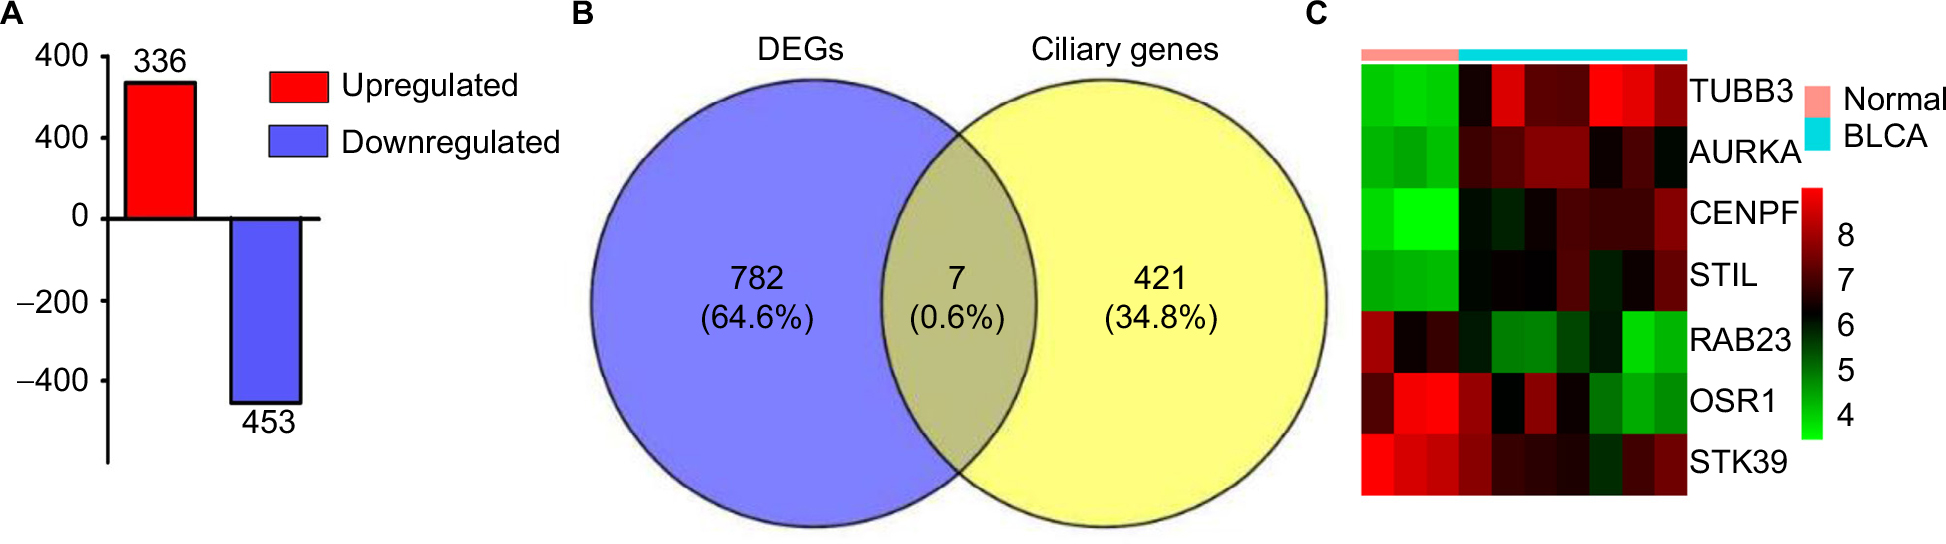 | Figure 3 DEGs associated with PC in BLCA. Notes: (A) Three hundred and thirty-six upregulated genes and 453 downregulated genes were identified in BLCA. The intersection of the DEGs and ciliary genes calculated by Venn diagrams (B) and seven DEGs shown by heatmap (C). Abbreviations: BLCA, bladder cancer; DEGs, differentially expressed genes; PC, primary cilia. |
Delineation of GO and KEGG pathway analysis
PC, the sensory organelles, function in transducing extracellular signals such as Hedgehog, Wnt and PDGF. Seven DEGs were analyzed to explore the role of PC in BLCA. GO analysis revealed top ten positive and negative biological processes (Figure 4A), cell components (Figure 4B) and molecular functions (Figure 4C). In analysis of biological processes, DEGs favored cell component organization and regulation of transport. Cell component analysis showed most DEGs belonged to microtubule cytoskeleton, microtubule organizing center and centrosome. Molecular function classification showed that most DEGs were involved in kinase binding and protein kinase activity. KEGG analysis revealed four active pathways. The top pathway enriched by KEGG was Hedgehog signaling pathway, which was responsible for many aspects of vertebrate embryonic development and was disrupted in a spectrum of human tumors.14 In addition, the transport and catabolism, cell growth and death, and signal transduction cellular community might contribute significantly to the pathogenesis and progression of BLCA (Figure 4D). The results from GO and KEGG analysis indicated that these DEGs exhibited the properties and functions of PC, and the signaling pathways related to PC probably participated in the pathogenesis and progression of BLCA.
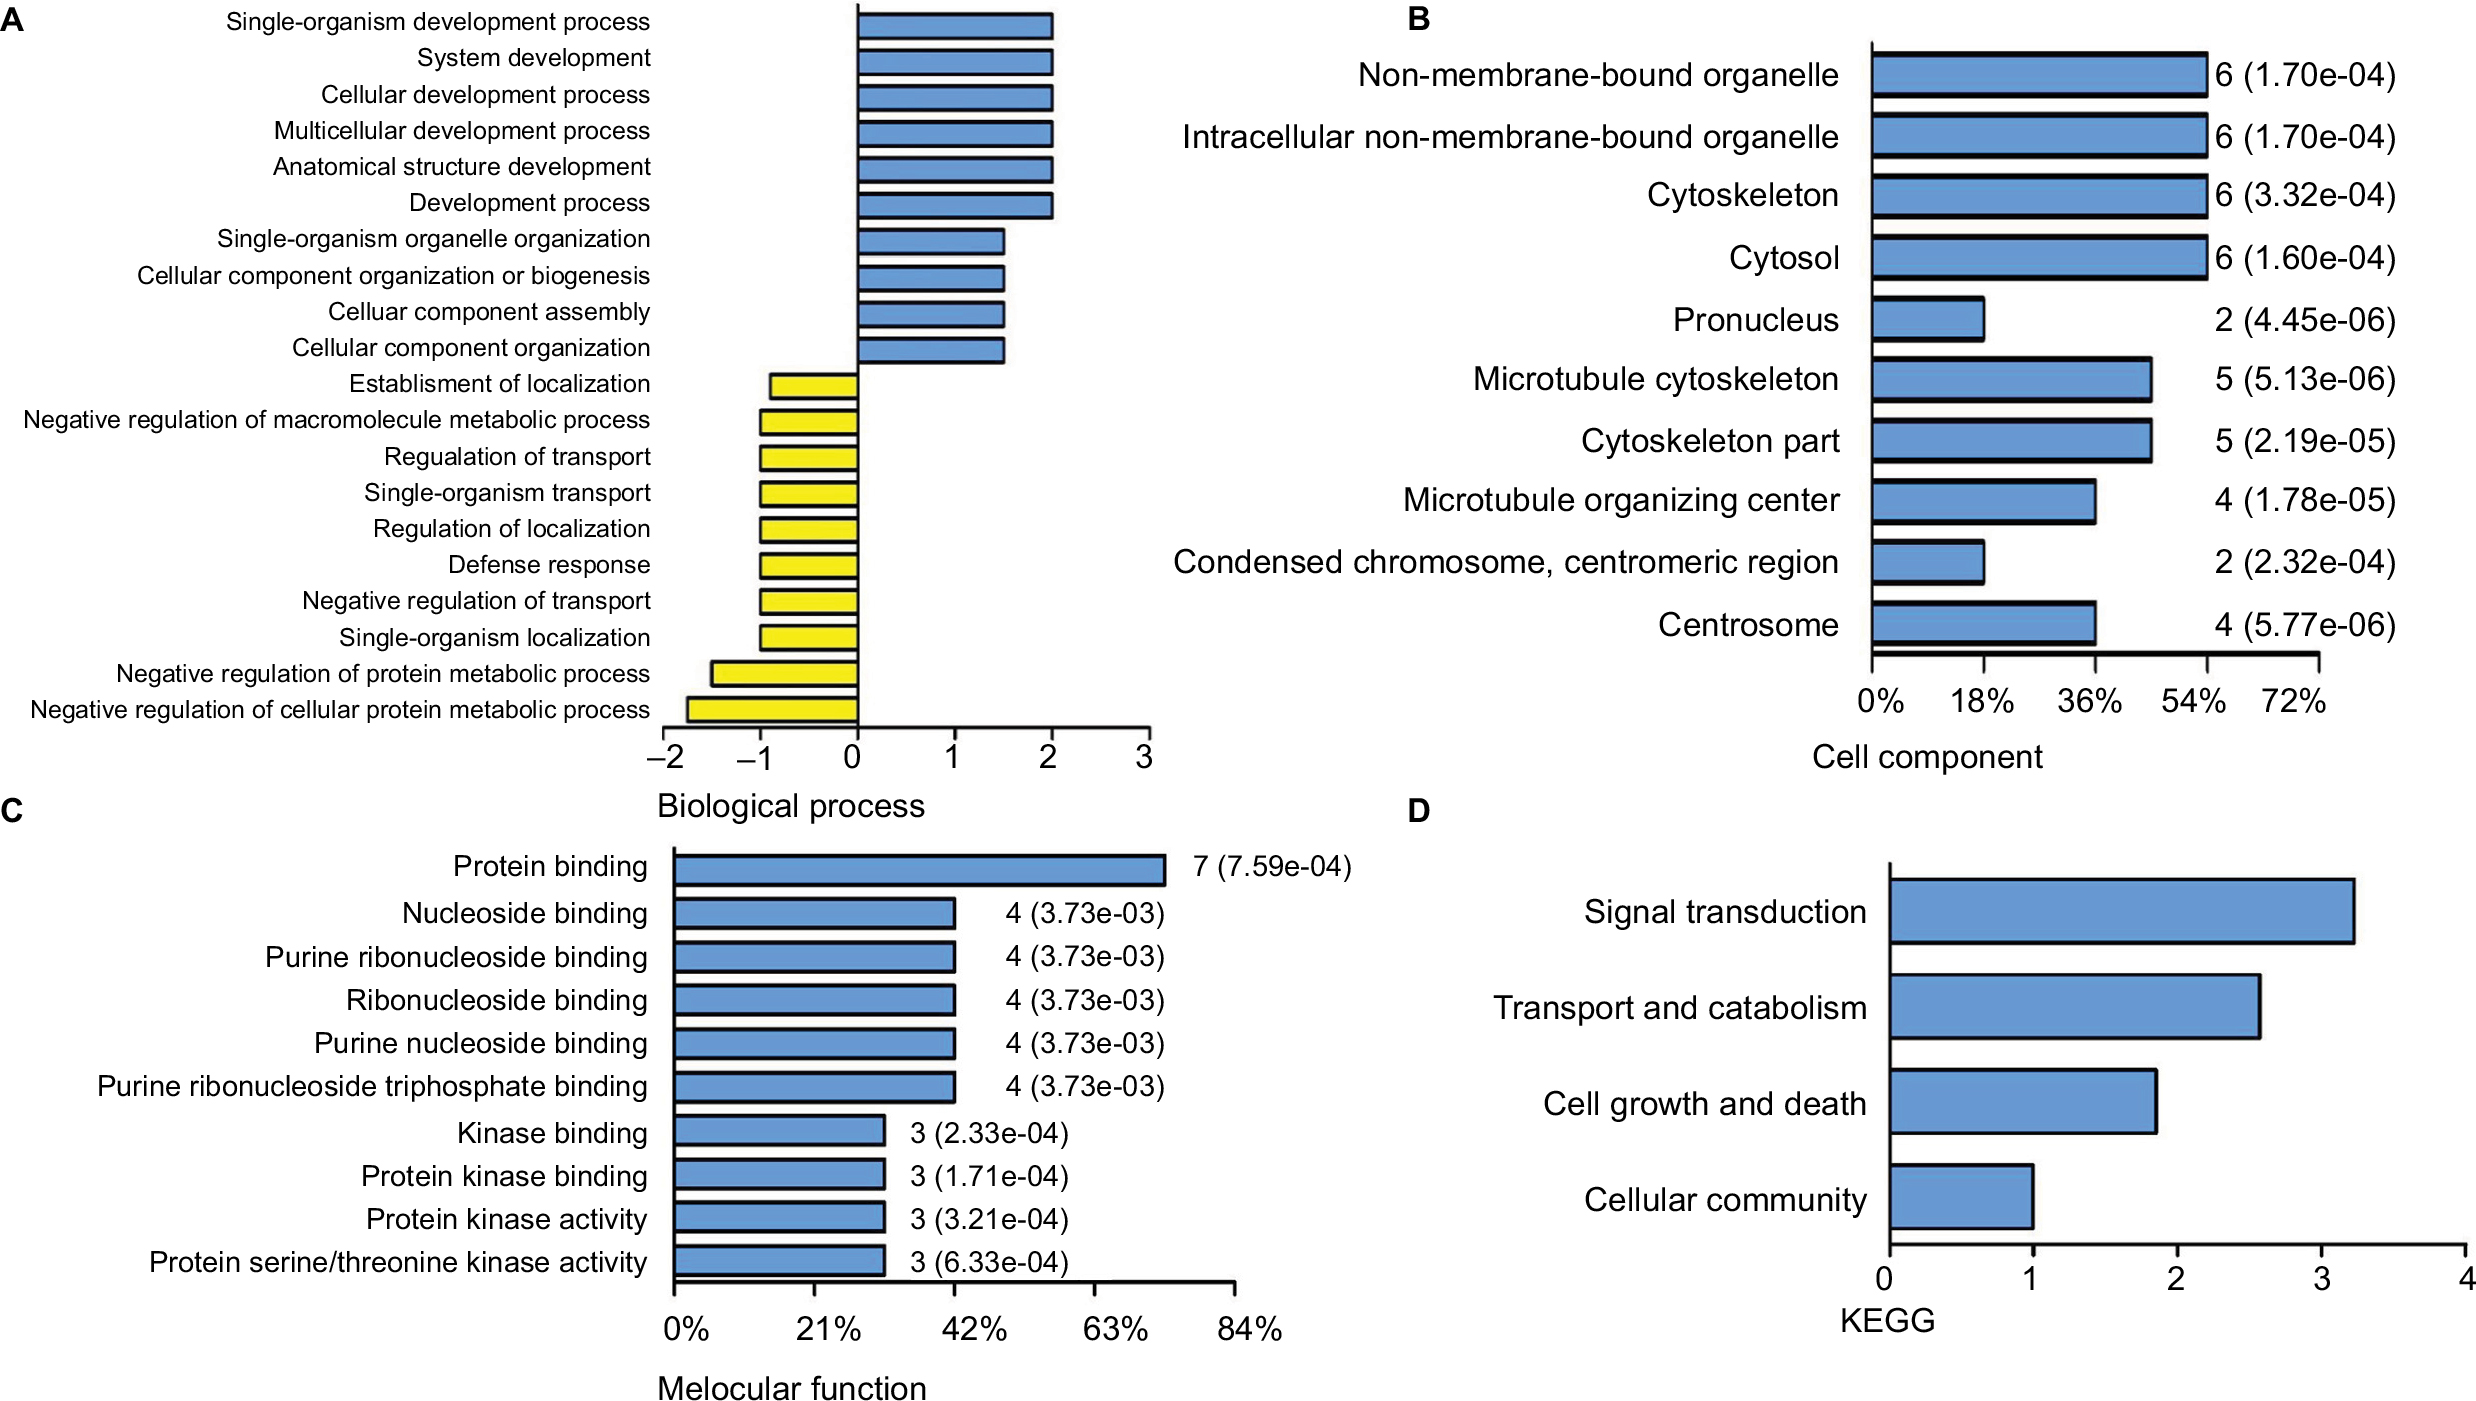 | Figure 4 Delineation of GO and KEGG pathway analysis. Notes: GO analysis of the DEGs covering domains of biological processes (A), cellular components (B) and molecular functions (C). KEGG pathway enrichment analysis of DEGs (D). Abbreviations: DEGs, differentially expressed genes; GO, gene ontology; KEGG, Kyoto Encyclopedia of Genes and Genomes. |
The mRNA expression of DEGs in BLCA
The mRNA expression of DEGs were assessed in 404 BLCA and 28 normal tissue samples (Figure 5A–G). The data showed that the mRNA expression of AURKA, CENPF and STIL were increased, while that of OSR1 was reduced in BLCA tissues compared with those in the normal tissues. STK39 mRNA expression did not have significant difference, but showed significant trend according to GEPIA analysis. The lower mRNA expression of STK39 in primary prostate tumors was correlated with a higher incidence of metastases after radical prostatectomy, so it is worth further exploring the role of STK39 in BLCA.
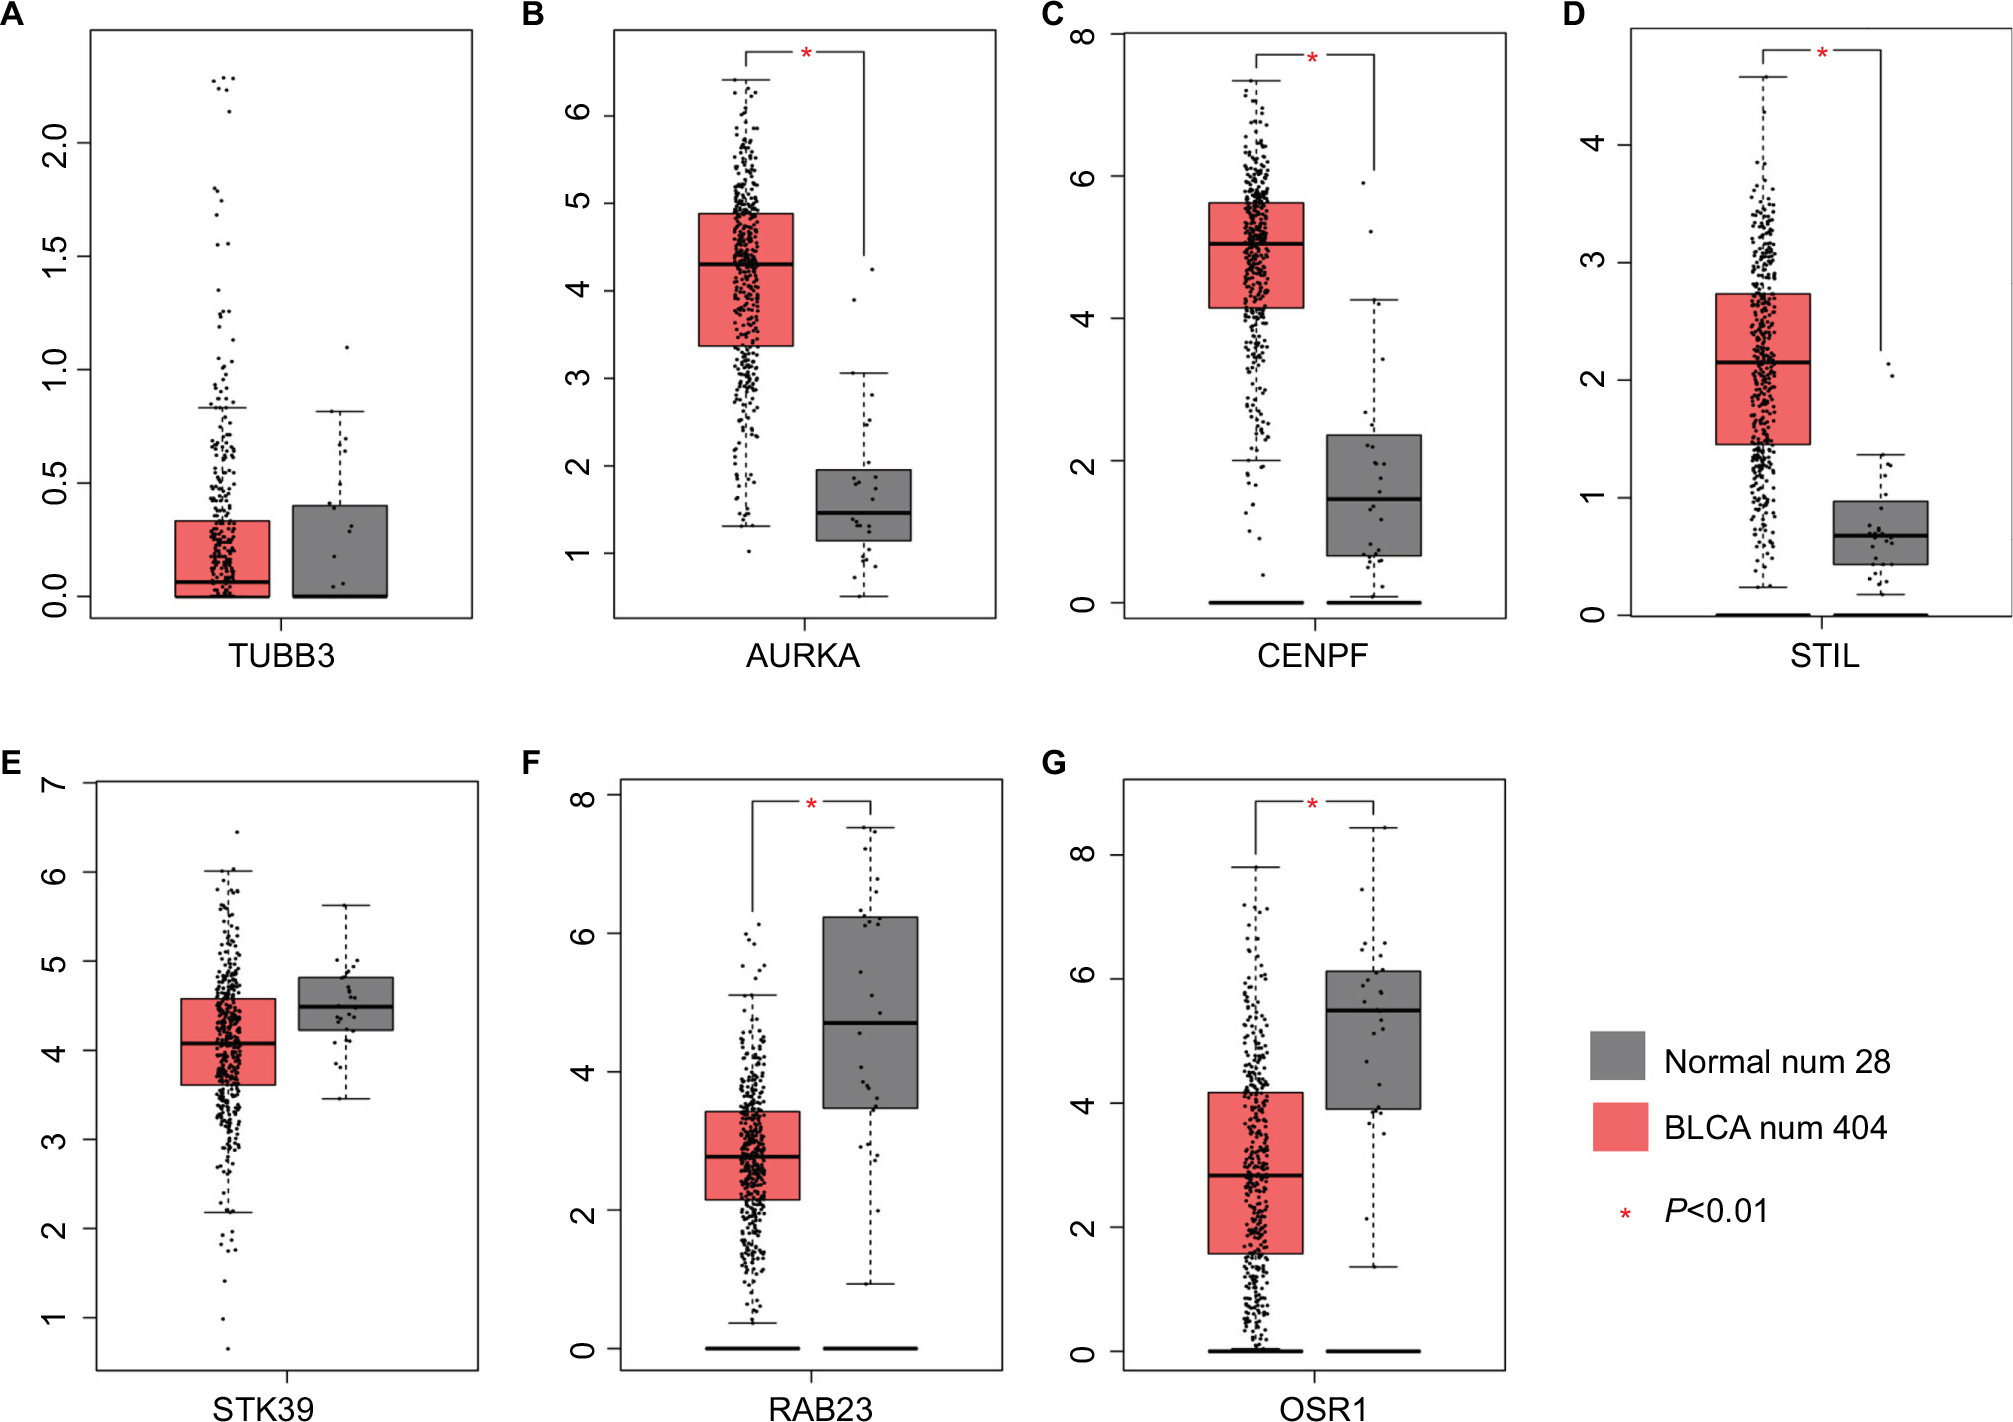 | Figure 5 mRNA expression of DEGs in BLCA. Note: The mRNA expression of DEGs in 404 BLCA and 28 normal tissue samples (A–G). Abbreviations: DEGs, differentially expressed genes; BLCA, bladder cancer. |
TUBB3 expression did not have significant difference according to GEPIA analysis. Evidences suggested that Rab23 overexpression played a role in invasion and metastasis in several human cancers which include BLCA,15 which was inconsistent with the GEPIA analysis. Combining literatures and our analysis, AURKA, CENPF, STIL, STK39 and OSR1 were confirmed for the next transcriptional regulation prediction.
Transcriptional regulation prediction of DEGs in BLCA
To gain a better understanding of the molecular mechanisms, putative TFBS were predicted in the promoter region of the DEGs by Genomatix software. One hundred and eighty-nine kinds of TFBS including 1,534 TFBS were achieved in AURKA promoter region and 65 kinds of TFBS were supported by the ChIP-Sequence data. Seventy-eight kinds of TFBS in the CENPF promoter region, 72 kinds of TFBS in the STIL promoter region, 149 kinds of TFBS in the STK39 promoter region and 72 kinds of TFBS in the OSR1 promoter region were achieved (Figure 6A).
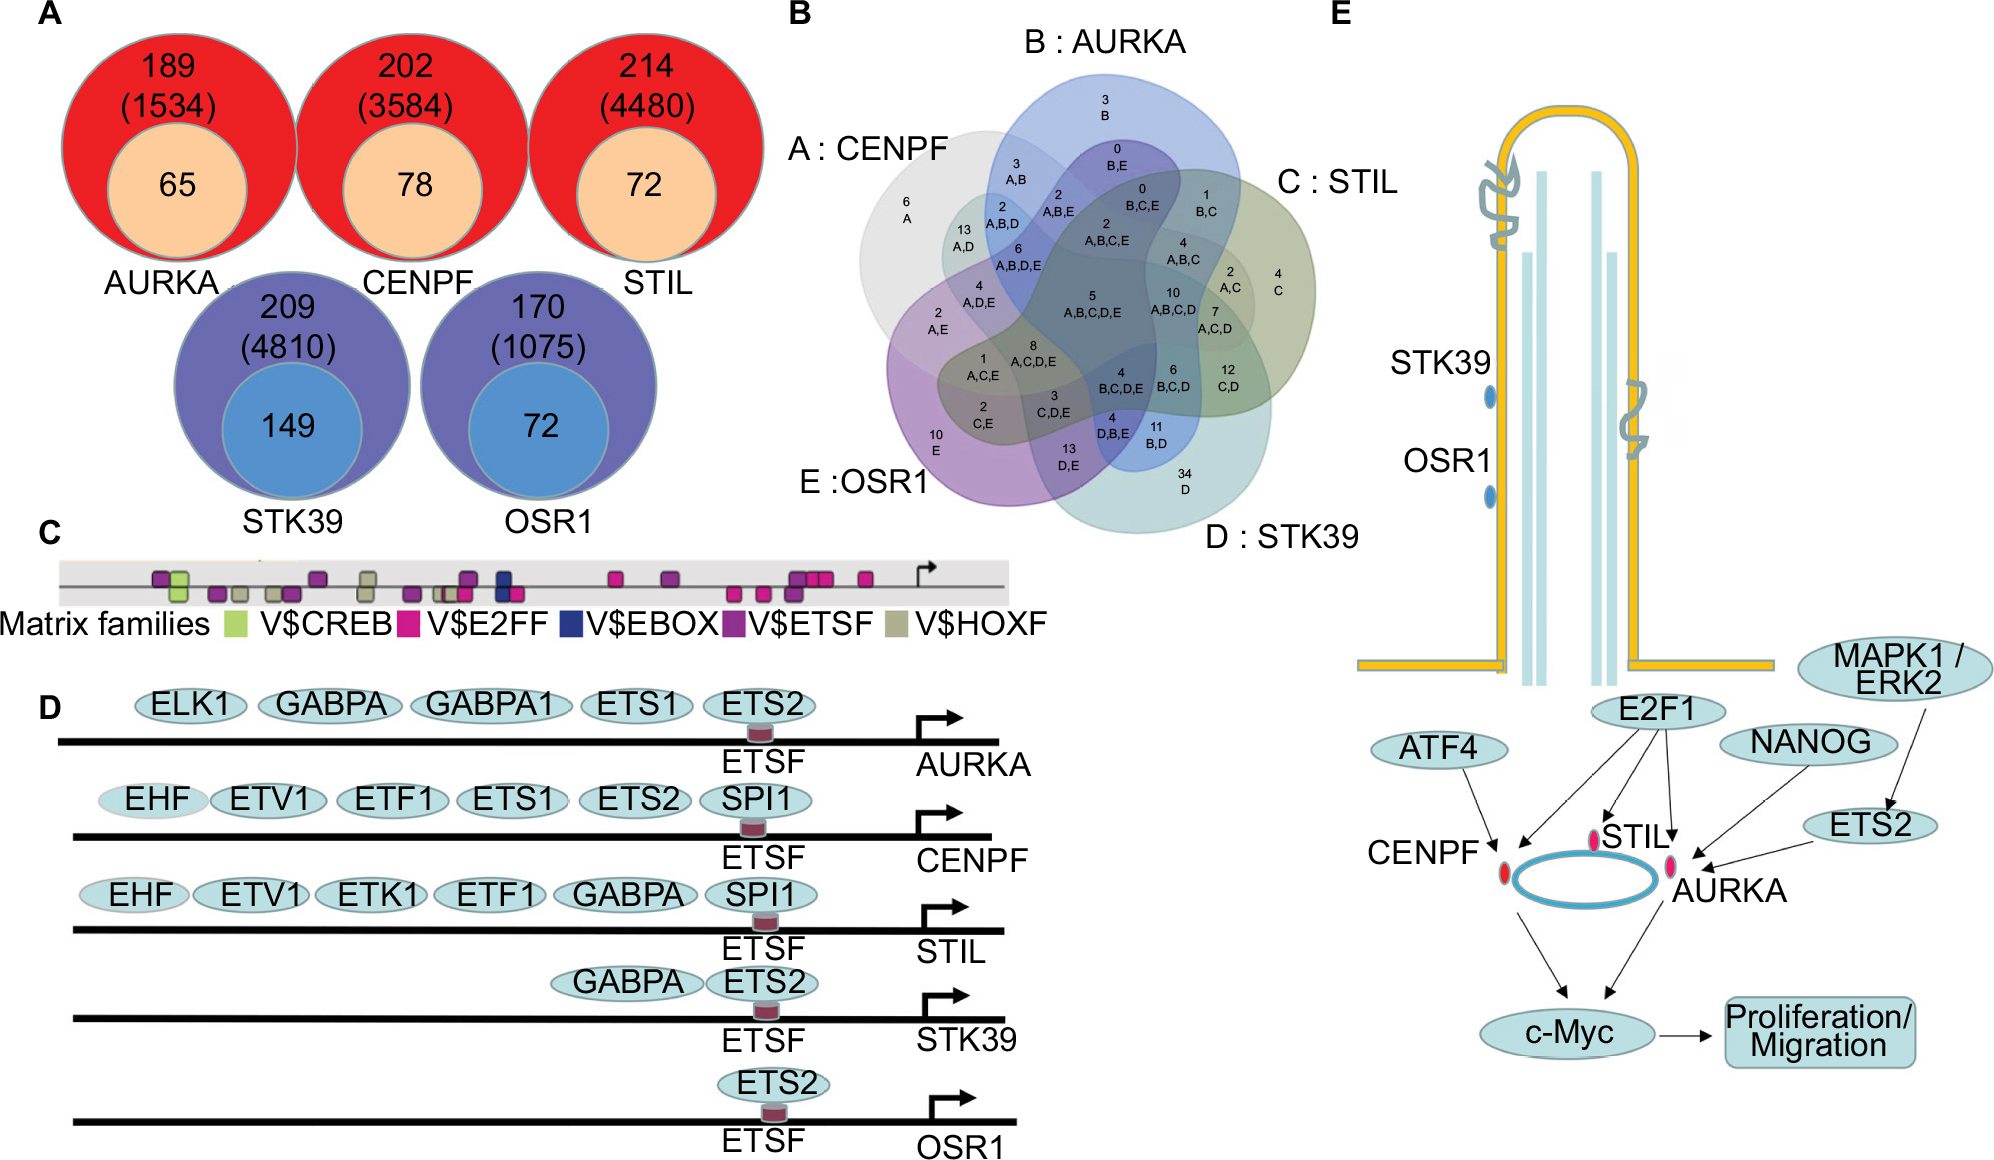 | Figure 6 Transcriptional regulation predictions of DEGs in BLCA. Notes: (A) Putative TFBS of DEGs predicted by Genomatix software. (B, C) Five shared TFBS were CREB, E2FF, EBOX, ETSF and HOXF. (D) Different TFs bind to ETSF in the promoter region of AURKA, CENPF, STIL, STK39 and OSR1. (E) A model illustrating the potential mechanism of DEGs in BLCA. Abbreviations: BLCA, bladder cancer; DEGs, differentially expressed genes; TFBS, transcription factor binding sites; TFs, transcription factors. |
Five TFBS including CREB, E2FF, EBOX, ETSF and HOXF, which could co-regulate the five DEGs associated with PC, were calculated by Venn diagram (Figure 6B, C). Then, the TFs of the DEGs were discovered according to the shared TFBS which were supported by the ChIP-Sequence data. For example, TFs including ELK1, GABPA, GABPB1, ETS1 and ETS2 bound to ETSF in the promoter region of AURKA (Figure 6D). The other TFBS of the DEGs are shown in Supplementary materiala. These findings predicted candidate TFs of the DEGs and helped to understand the mechanisms of the DEGs in BLCA.
Discussion
BLCA has diverse functional and biological characteristics that undergo a variety of clinical courses and possess diverse therapeutic responses with luminal-papillary (35%), luminal-infiltrated (19%), luminal (6%), basal-squamous (35%) and neuronal (5%) types.16,17 Luminal type is relatively refractory to conventional chemotherapies, and basal-squamous type is relatively responsive. It is urgent to study potential molecular mechanisms and provide novel diagnosis and therapeutic targets for BLCA. Recent studies have shown that PC are diminished or lost in multiple cancers; however, the expression of PC in BLCA have not been reported. The PC are microtubule-based and immotile organelles functioning as a cellular antenna underlying cellular processes such as proliferation, apoptosis, migration, differentiation and cell polarity,18 which are associated with tumor progression. Our study showed that PC were reduced in BLCA, though no significant difference was found between two major subtypes, which were probably impacted by limited sample size. This result was consistent with the other tumor researches, which suggested the critical function of PC in tumor progression and prompted us to investigate the potential mechanism of PC in BLCA.
Exome sequencing from Harlander et al revealed that mouse and human clear cell renal cell carcinomas exhibited recurrent mutations in genes associated with the primary cilium, which strongly suggested the correlation between abnormality of ciliary genes and tumor.6 Seven DEGs including TUBB3, AURKA, CENPF, STIL, STK39, RAB23 and OSR1 were identified in this study. The function of the seven DEGs was overviewed by GO and KEGG analysis. GO analysis indicated that DEGs exhibited properties and function of PC, which was implicated in previous study that FD1 depletion at centriolar satellites promoted cilia formation in breast cancer MCF7 cells that normally did not form cilia.19 KEGG analysis revealed the top pathway was Hedgehog signaling pathway. The results were also reported in Xu et al’s study that inhibition of the Hedgehog signaling pathway suppresses cell proliferation by regulating the Gli2/miR-124/AURKA axis in human glioma cells.20 These results were consistent with the fact that dysfunction of PC participated in cancer pathogenesis and progression by regulating cell cycle and cell proliferation.
Many researchers found that these seven DEGs were involved in the process of cell cycle, participating in the tumorigenesis and tumor proliferation. AURKA, a protein-associated PC, is a member of a family of serine/threonine kinases that plays a well-established role in promoting cell cycle and assembly of the mitotic spindle.21,22 High expression of AURKA is implicated for poor prognosis of many types of cancer including BLCA.23–26 In clear cell renal cell carcinomas, reduced AURKA levels can induce a significant increase in PC formation.27 CENPF and STIL, both belonging to centriole proteins, are essential for the formation of centrosomes and PC. Centrosomes participate in mitotic spindle formation, and thereby ensure faithful chromosome segregation during cell division. Failures in centriole duplication result in abnormal centriole numbers, which have been linked to genomic instability and tumorigenesis.28,29 CENPF has been shown to be upregulated and to play an important role in prostate cancer,30,31 Wilms tumors32 and mantle cell lymphoma.33 The lower expression of CENPF was associated with better overall survival of BLCA patients.34 STIL was expressed only in proliferating cells and its expression in cancer cells was associated with metastasis and worse prognosis.35,36 STK39 and OSR1, which are enriched in the cilia, together with their own activating kinases WNK1 and WNK4 are involved in anion-based signal amplification.37 The high expression of STK39 had inverse effects on cell behaviors in non-small-cell-type lung cancer.38 Zhu et al reported that the WNK1/OSR1/NKCC1 signaling pathway plays an important role in glioma migration.39 A follow-up containing 54 hematuria samples from urothelial cell carcinoma patients suggested that OSR1 was an independent predictor for the presence of urothelial cell carcinoma. These researches indicate that ciliary protein abnormality facilitates carcinogenesis by regulating the dysfunction of PC.
To gain a better understanding of the molecular mechanisms, TFs of the DEGs were predicted according to the shared TFBS which were supported by the ChIP-Sequence data. The TFs confirmed by researchers are shown in Figure 6E. NANOG–AURKA–aPKCζ pathway was an important event in liver tumorigenesis.40 Myc was directly bound to AURKA, and inhibition of this protein–protein interaction resulted in subsequent Myc degradation and cell death in hepatocellular carcinomas.41 In pancreatic cancer, AURKA was a direct target of the MAPK pathway and its overexpression was induced by hyperactivation of the pathway, at least via ETS2.42 AURKA, STIL and CENPF could be regulated by E2F1.43–45 The centrosomal protein CENPF was bound, but instead repressed the activity of ATF4 in dual-luciferase assays.46 No literature supports that STK39 and OSR1 are regulated by the TFs predicted by Genomatix software. Combining other results from our analysis, we assumed that the TFs might play important roles in regulating the DEGs in BLCA.
Conclusion
Overall, PC, which were correlated with cancers by influencing cell cycle or modulating cilia-related signaling transduction, were shown to be reduced in BLCA. The confirmation of DEGs and the prediction of their candidate TFs helped to understand the potential mechanisms of PC in BLCA and provided novel diagnosis and therapeutic targets for BLCA. Also, future studies need to be performed to confirm the mechanisms of PC in BLCA.
Acknowledgments
This study was supported by the National Natural Science Foundation grants of China (No. 81400686), the Research Program of Application Foundation and Advanced Technology of Tianjin (No. 16JCYBJC26500 and 15JCQNJC08200) and the Science and Technology Foundation of Tianjin Public Health Bureau of China (No. 2013KZ113). We express our sincere thanks to Dr Wang Aixiang, PhD, for pathological diagnosis of the tissues.
Disclosure
The authors report no conflicts of interest in this work.
References
Ferlay J, Soerjomataram I, Dikshit R, et al. Cancer incidence and mortality worldwide: sources, methods and major patterns in GLOBOCAN 2012. Int J Cancer. 2015;136(5):E359–E386. | ||
Clark PE, Agarwal N, Biagioli MC, et al. Bladder cancer. J Natl Compr Canc Netw. 2013;11(4):446–475. | ||
Reiter JF, Leroux MR. Genes and molecular pathways underpinning ciliopathies. Nat Rev Mol Cell Biol. 2017;18(9):533–547. | ||
Conduit SE, Ramaswamy V, Remke M, et al. A compartmentalized phosphoinositide signaling axis at cilia is regulated by INPP5E to maintain cilia and promote Sonic Hedgehog medulloblastoma. Oncogene. 2017;36(43):5969–5984. | ||
Egeberg DL, Lethan M, Manguso R, et al. Primary cilia and aberrant cell signaling in epithelial ovarian cancer. Cilia. 2012;1(1):15. | ||
Harlander S, Schönenberger D, Toussaint NC, et al. Combined mutation in Vhl, Trp53 and Rb1 causes clear cell renal cell carcinoma in mice. Nat Med. 2017;23(7):869–877. | ||
Hassounah NB, Nagle R, Saboda K, Roe DJ, Dalkin BL, Mcdermott KM. Primary cilia are lost in preinvasive and invasive prostate cancer. PLoS One. 2013;8(7):e68521. | ||
Hassounah NB, Nunez M, Fordyce C, et al. Inhibition of ciliogenesis promotes Hedgehog signaling, tumorigenesis, and metastasis in breast cancer. Mol Cancer Res. 2017;15(10):1421–1430. | ||
Seeley ES, Carrière C, Goetze T, Longnecker DS, Korc M. Pancreatic cancer and precursor pancreatic intraepithelial neoplasia lesions are devoid of primary cilia. Cancer Res. 2009;69(2):422–430. | ||
Légaré S, Chabot C, Basik M, Spen BM. SPEN, a new player in primary cilia formation and cell migration in breast cancer. Breast Cancer Res. 2017;19(1):104. | ||
Loskutov YV, Griffin CL, Marinak KM, et al. LPA signaling is regulated through the primary cilium: a novel target in glioblastoma. Oncogene. 2018;37(11):1457–1471. | ||
Jensen VL, Carter S, Sanders AA, et al. Whole-organism developmental expression profiling identifies RAB-28 as a novel ciliary GTPase associated with the BBSome and intraflagellar transport. PLoS Genet. 2016;12(12):e1006469. | ||
Yuan K, Frolova N, Xie Y, et al. Primary cilia are decreased in breast cancer: analysis of a collection of human breast cancer cell lines and tissues. J Histochem Cytochem. 2010;58(10):857–870. | ||
Rodrigues AR, Yakushiji-Kaminatsui N, Atsuta Y, et al. Integration of Shh and Fgf signaling in controlling Hox gene expression in cultured limb cells. Proc Natl Acad Sci U S A. 2017;114(12):3139–3144. | ||
Choi JW, Kim Y, Lee JH, Kim YS. Expression of β-tubulin isotypes in urothelial carcinoma of the bladder. World J Urol. 2014;32(2):347–352. | ||
Inamura K. Bladder cancer: new insights into its molecular pathology. Cancers. 2018;10(4):100. | ||
Robertson AG, Kim J, Al-Ahmadie H, et al. Comprehensive molecular characterization of muscle-invasive bladder cancer. Cell. 2017;171(3):540–556.e25. | ||
Basten SG, Giles RH. Functional aspects of primary cilia in signaling, cell cycle and tumorigenesis. Cilia. 2013;2(1):6. | ||
Tang Z, Lin MG, Stowe TR, et al. Autophagy promotes primary ciliogenesis by removing OFD1 from centriolar satellites. Nature. 2013;502(7470):254–257. | ||
Xu L, Liu H, Yan Z, Sun Z, Luo S, Lu Q. Inhibition of the Hedgehog signaling pathway suppresses cell proliferation by regulating the Gli2/miR-124/AURKA axis in human glioma cells. Int J Oncol. 2017;50(5):1868–1878. | ||
Karthigeyan D, Prasad SB, Shandilya J, Agrawal S, Kundu TK. Biology of Aurora A kinase: implications in cancer manifestation and therapy. Med Res Rev. 2011;31(5):757–793. | ||
Nikonova AS, Astsaturov I, Serebriiskii IG, Dunbrack RL, Jr, Golemis EA. Auoroa A kinase (AURKA) in normal and pathological cell division. Cell Mol Life Sci. 2013;70(4):661–687. | ||
Katsha A, Belkhiri A, Goff L, El-Rifai W. Aurora kinase A in gastrointestinal cancers: time to target. Mol Cancer. 2015;14:106. | ||
Mehra R, Serebriiskii IG, Burtness B, Astsaturov I, Golemis EA. Aurora kinases in head and neck cancer. Lancet Oncol. 2013;14(10):e425–e435. | ||
Mobley A, Zhang S, Bondaruk J, et al. Aurora kinase A is a biomarker for bladder cancer detection and contributes to its aggressive behavior. Sci Rep. 2017;7:40714. | ||
Schöffski P, Jones SF, Dumez H, et al. Phase I, open-label, multicentre, dose-escalation, pharmacokinetic and pharmacodynamic trial of the oral aurora kinase inhibitor PF-03814735 in advanced solid tumours. Eur J Cancer. 2011;47(15):2256–2264. | ||
Dere R, Perkins AL, Bawa-Khalfe T, Jonasch D, Walker CL. β-catenin links von Hippel–Lindau to aurora kinase A and loss of primary cilia in renal cell carcinoma. J Am Soc Nephrol. 2015;26(3):553–564. | ||
Bauer M, Cubizolles F, Schmidt A, Nigg EA. Quantitative analysis of human centrosome architecture by targeted proteomics and fluorescence imaging. EMBO J. 2016;35(19):2152–2166. | ||
Nigg EA, Čajánek L, Arquint C. The centrosome duplication cycle in health and disease. FEBS Lett. 2014;588(15):2366–2372. | ||
Aytes A, Mitrofanova A, Lefebvre C, et al. Cross-species regulatory network analysis identifies a synergistic interaction between FOXM1 and CENPF that drives prostate cancer malignancy. Cancer Cell. 2014;25(5):638–651. | ||
Lin SC, Kao CY, Lee HJ, et al. Dysregulation of miRNAs-COUP-TFII-FOXM1-CENPF axis contributes to the metastasis of prostate cancer. Nat Commun. 2016;7:11418. | ||
Zirn B, Hartmann O, Samans B, et al. Expression profiling of Wilms tumors reveals new candidate genes for different clinical parameters. Int J Cancer. 2006;118(8):1954–1962. | ||
Sánchez-Tilló E, Fanlo L, Siles L, et al. The EMT activator ZEB1 promotes tumor growth and determines differential response to chemotherapy in mantle cell lymphoma. Cell Death Differ. 2014;21(2):247–257. | ||
Li S, Liu X, Liu T, et al. Identification of biomarkers correlated with the TNM staging and overall survival of patients with bladder cancer. Front Physiol. 2017;8:947. | ||
Erez A, Castiel A, Trakhtenbrot L, et al. The SIL gene is essential for mitotic entry and survival of cancer cells. Cancer Res. 2007;67(9):4022–4027. | ||
Rabinowicz N, Mangala LS, Brown KR, et al. Targeting the centriolar replication factor STIL synergizes with DNA damaging agents for treatment of ovarian cancer. Oncotarget. 2017;8(16):27380–27392. | ||
Gagnon KB, Delpire E. Molecular physiology of SPAK and OSR1: two Ste20-related protein kinases regulating ion transport. Physiol Rev. 2012;92(4):1577–1617. | ||
Li Z, Zhu W, Xiong L, Yu X, Chen X, Lin Q. Role of high expression levels of STK39 in the growth, migration and invasion of non-small cell type lung cancer cells. Oncotarget. 2016;7(38):61366–61377. | ||
Zhu W, Begum G, Pointer K, et al. WNK1-OSR1 kinase-mediated phospho-activation of Na+–K+–2Cl− cotransporter facilitates glioma migration. Mol Cancer. 2014;13:31. | ||
Siddique HR, Feldman DE, Chen CL, Punj V, Tokumitsu H, Machida K. NUMB phosphorylation destabilizes p53 and promotes self-renewal of tumor-initiating cells by a NANOG-dependent mechanism in liver cancer. Hepatology. 2015;62(5):1466–1479. | ||
Dauch D, Rudalska R, Cossa G, et al. A MYC-aurora kinase A protein complex represents an actionable drug target in p53-altered liver cancer. Nat Med. 2016;22(7):744–753. | ||
Furukawa T, Kanai N, Shiwaku HO, Soga N, Uehara A, Horii A. AURKA is one of the downstream targets of MAPK1/ERK2 in pancreatic cancer. Oncogene. 2006;25(35):4831–4839. | ||
Erez A, Chaussepied M, Castiel A, et al. The mitotic checkpoint gene, SIL is regulated by E2F1. Int J Cancer. 2008;123(7):1721–1725. | ||
Kao YT, Wu CH, Wu SY, Lan SH, Liu HS, Tseng YS. Arsenic treatment increase Aurora-A overexpression through E2F1 activation in bladder cells. BMC Cancer. 2017;17(1):277. | ||
Reinhold WC, Erliandri I, Liu H, Zoppoli G, Pommier Y, Larionov V. Identification of a predominant co-regulation among kinetochore genes, prospective regulatory elements, and association with genomic instability. PLoS One. 2011;6(10):e25991. | ||
Sayer JA, Otto EA, O’Toole JF, et al. The centrosomal protein nephrocystin-6 is mutated in Joubert syndrome and activates transcription factor ATF4. Nat Genet. 2006;38(6):674–681. |
 © 2018 The Author(s). This work is published and licensed by Dove Medical Press Limited. The
full terms of this license are available at https://www.dovepress.com/terms
and incorporate the Creative Commons Attribution
- Non Commercial (unported, 3.0) License.
By accessing the work you hereby accept the Terms. Non-commercial uses of the work are permitted
without any further permission from Dove Medical Press Limited, provided the work is properly
attributed. For permission for commercial use of this work, please see paragraphs 4.2 and 5 of our Terms.
© 2018 The Author(s). This work is published and licensed by Dove Medical Press Limited. The
full terms of this license are available at https://www.dovepress.com/terms
and incorporate the Creative Commons Attribution
- Non Commercial (unported, 3.0) License.
By accessing the work you hereby accept the Terms. Non-commercial uses of the work are permitted
without any further permission from Dove Medical Press Limited, provided the work is properly
attributed. For permission for commercial use of this work, please see paragraphs 4.2 and 5 of our Terms.