")
Back to Journals » Diabetes, Metabolic Syndrome and Obesity » Volume 16
Analysis of Methylome, Transcriptome, and Lipid Metabolites to Understand the Molecular Abnormalities in Polycystic Ovary Syndrome
Authors Zhang F , Ding Y, Zhang B, He M, Wang Z, Lu C, Kang Y
Received 22 May 2023
Accepted for publication 30 August 2023
Published 11 September 2023 Volume 2023:16 Pages 2745—2763
DOI https://doi.org/10.2147/DMSO.S421947
Checked for plagiarism Yes
Review by Single anonymous peer review
Peer reviewer comments 2
Editor who approved publication: Prof. Dr. Juei-Tang Cheng
Fei Zhang,1 Yicen Ding,1 Bohan Zhang,1 Mengju He,1 Zhijiang Wang,2 Chunbo Lu,3 Yani Kang1
1School of Biomedical Engineering, Bio-ID Center, Shanghai Jiao Tong University, Shanghai, People’s Republic of China; 2Department of Pharmaceutical Engineering, Zhejiang Pharmaceutical University, Ningbo, People’s Republic of China; 3Department of Obstetrics and Gynecology, Qiuai Central Health Center, Ningbo, People’s Republic of China
Correspondence: Chunbo Lu, Department of Obstetrics and Gynecology, Qiuai Central Health Center, Ningbo, 315100, People’s Republic of China, Tel +86-13567881644, Email [email protected] Yani Kang, School of Biomedical Engineering, Bio-ID Center, Shanghai Jiao Tong University, Shanghai, 200240, People’s Republic of China, Tel +86-13661848623, Email [email protected]
Purpose: This study aimed to identify differentially methylated genes (DMGs) and differentially expressed genes (DEGs) to investigate new biomarkers for the diagnosis and treatment of polycystic ovary syndrome (PCOS).
Methods: To explore the potential biomarkers of PCOS diagnosis and treatment, we performed methyl-binding domain sequencing (MBD-seq) and RNA sequencing (RNA-seq) on ovarian granulosa cells (GCs) from PCOS patients and healthy controls. MBD-seq was also performed on the ovarian tissue of constructed prenatally androgenized (PNA) mice. Differential methylation and expression analysis were implemented to identify DMGs and DEGs, respectively. The identified gene was further verified by real-time quantitative PCR (RT-qPCR) and methylation-specific PCR (MSP) in clinical samples. Furthermore, ultra-performance liquid chromatography-mass spectrometry (UPLC-MS) was carried out on PCOS patients and healthy controls to identify differential lipid metabolites.
Results: Compared to the control group, 13,526 DMGs related to the promoter region and 2429 DEGs were found. The function analysis of DMGs and DEGs showed that they were mainly enriched in glycerophospholipid, ovarian steroidogenesis, and other lipid metabolic pathways. Moreover, 5753 genes in DMGs related to the promoter region were screened in the constructed PNA mice. Integrating the DMGs data from PCOS patients and PNA mice, we identified the following 8 genes: CDC42EP4, ERMN, EZR, PIK3R1, ARHGEF18, NECTIN2, TSC2, and TACSTD2. RT-qPCR and MSP verification results showed that the methylation and expression of TACSTD2 were consistent with sequencing data. Additionally, 15 differential lipid metabolites were shown in the serum of PCOS patients. The differential lipids were involved in glycerophospholipid and glycerolipid metabolism.
Conclusion: Using integration of methylome and lipid metabolites profiling we identified 8 potential epigenetic markers and 15 potential lipid metabolite markers for PCOS. Our results suggest that aberrant DNA methylation and lipid metabolite disorders may provide novel insights into the diagnosis and etiology of PCOS.
Keywords: polycystic ovary syndrome, DNA methylation, transcriptome, lipid metabolites, granulosa cell
Introduction
Polycystic ovary syndrome (PCOS) is one of the most common heterogeneous diseases of endocrine and metabolic origin, and it can seriously affect multiple aspects of the overall health of women.1 The prevalence of PCOS in women of reproductive age ranges from 5% to 18% according to the 2018 International Evidence-based Guideline.2 Patients with PCOS usually have several accompanying differential features such as hyperandrogenemia, insulin resistance, hypertension, overweight, type 2 diabetes, and infertility that have impacts across the patients’ lifespan.3–5 Studies have shown that 70% women diagnosed with PCOS become infertile within the next few years.6 However, despite the severity of the condition, the pathogenesis of PCOS remains elusive.7
Granulosa cells (GCs) are a crucial component of the ovary, as they surround the oocyte and play a role in maintaining the homeostasis of the intracellular and extracellular environment.8 The gap junctions formed between GCs and oocytes allow the exchange of small molecule metabolites, which is vital for oocyte maturation.9 Insulin resistance in PCOS patients is closely associated with increased apoptosis of GCs.10 Dysfunction of GCs is likely to induce abnormal development of follicles, leading to the occurrence and development of polycystic ovaries. In addition, higher-than-normal levels of androgen in PCOS patients are associated with ovulation disorders, irregular menstruation, infertility, and hirsutism,11,12 suggesting that androgen hyperactivity is also an important risk factor for PCOS.
Epigenetics is characterized by transmissible and reversible changes in gene function or activity while the DNA sequence remains unchanged.13 DNA methylation is involved in many diseases such as cancer, imprinting disorders, and repeat-instability disease and is one of the most widely studied and best-understood epigenetic phenomena.14 Researchers have observed that few genes such as PRDM1, PPARG, KCTD21, and LHCGR alter DNA methylation in the whole ovarian tissue, adipose tissue, peripheral blood, as well as GCs of PCOS patients.15 An abundance of differentially methylated CpG sites that were identified as being strongly associated with immunity, and inflammation was found in the ovaries and blood of patients with PCOS.16,17 Recent studies have shown aberrant hypermethylation sites of gluteofemoral adipose-derived stem cell DNA in PCOS patients with abnormal lipids metabolism.18 Aberrant DNA methylation may promote or inhibit the dysregulation of pathways related to hormone synthesis, protein metabolism, and lipid metabolism.
In this study, we performed methyl-binding domain sequencing (MBD-seq) and RNA sequencing (RNA-seq) on GCs of PCOS patients and controls, respectively, to identify differentially methylated genes (DMGs) and differentially expressed genes (DEGs) to investigate new biomarkers for the diagnosis and treatment of PCOS. Subsequently, MBD-seq was also performed in prenatally androgenized (PNA) mice (PCOS mice model) and controls to integrate with human GCs MBD-seq sequencing data. The identified gene was verified by methylation-specific PCR (MSP) and real-time quantitative PCR (RT-qPCR). Finally, the serum of PCOS patients and control groups was analyzed by UPLC-MS to identify potential lipid metabolite markers. Our results revealed abnormal DNA methylation and lipid metabolism imbalance in PCOS patients, which provide valuable perspectives for the diagnosis and therapeutic targets of PCOS.
Materials and Methods
Participants
Women with PCOS (n=21) and healthy controls (n=21) were enrolled at Yuncheng Center Hospital in Shanxi Province, China. The participants were non-related and of Chinese Han ethnicity and aged between 20 and 35 years. All participants provided written informed consent. The study was approved by the Ethics Committee on Human Research of Yuncheng Center Hospital (Approval ID: KYLL2019073). All patients diagnosed with PCOS met at least two of the Rotterdam EHSRE/ASRM (2003) criteria.19 The control group comprised women with male-partner infertility or fallopian tube obstruction infertility. These women underwent in vitro fertilization treatment and had no insulin resistance, polycystic ovary morphology, or history of other chronic diseases, and they all had normal ovulation rhythm and androgen levels.
Clinical and Biochemical Measurements
Demographic and clinical data including height, weight, number of follicles, and preoperative serum hormone levels were collected from all patients, 2–5 days after menstruation. Ten-hour fasting blood samples were collected and centrifuged to separate the serum that was stored at −80°C until further use. The levels of follicle-stimulating hormone (FSH), thyroid-stimulating hormone (TSH), testosterone (T), prolactin (PRL), and luteinizing hormone (LH) were determined by the Beckman UniCel DxI800 fully automatic chemiluminescence analyzer (Beckman Coulter, CA, USA). The clinical parameters of all participants are shown in Table 1 and Supplementary Table S1.
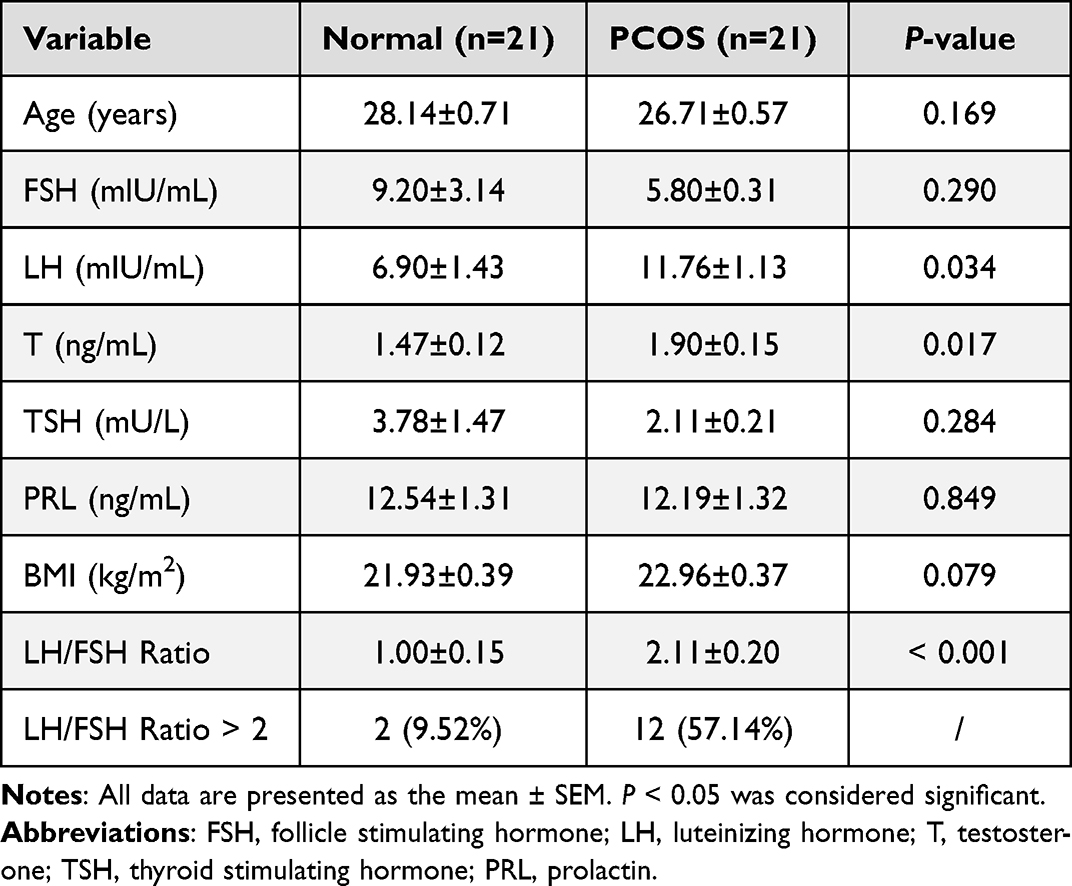 |
Table 1 Clinical Parameters of the Polycystic Ovarian Syndrome (PCOS) Patients Compared with the Control Groups |
Collection of GCs
All participants were subcutaneously injected with gonadotropin‐releasing hormone at the mid-luteal phase (7 days after ovulation) for about 15 days. Follicle size was monitored by ultrasound and serum estradiol. Participants were injected with 6000 IU of human chorionic gonadotropin when two or more follicles reached 15 mm in diameter. After 36 h, ultrasound-guided transvaginal oocyte aspiration was performed to obtain the GCs, then centrifuged and washed twice with Dulbecco’s improved Eagle’s medium. The separated GCs were rapidly preserved at −80°C.
Construction of PNA Mouse Model with PCOS
The animal experiments performed in this study were approved by the Experimental Animal Welfare & Ethics Committee of the School of Biomedical Engineering, Shanghai Jiao Tong University (No. 2019005), and conform to the animal care and use guidelines of Shanghai Jiao Tong University Experimental Animal Center. The Institute of Cancer Research mice were purchased from Shanghai Jiesijie Experimental Animal Co. Ltd., and housed in Shanghai Jiao Tong University Experimental Animal Center. The conditions of food, temperature (23±2°C), humidity (50%-60%), lighting (15–20 lux), and ventilation (0.15m/s) were suitable for survival. Females mated with male mice and the copulatory plug was checked daily. Discovery of the copulatory plug was considered day 1 of gestation. At 16–18 days of gestation, pregnant dams were subcutaneously injected with 70 μL sesame oil containing 350 μg dihydrotestosterone (DHT) (20649, MCE, China) or only 70 μL sesame oil vehicle. The offspring of the DHT-induced group were considered PNA mice, while the offspring of the control group were the control mice. The 8-week-old mice were anesthetized and then euthanized, and the ovary and serum materials were collected.
Assessment of Model Construction and Selection of Mice
PNA mice (n=8) and control mice (n=8) were randomly selected to verify the construction of the PCOS mouse model. We evaluated estrus time, secondary follicle number, and serum testosterone level at 8 weeks of age. The level of serum testosterone and the number of secondary follicles in the PNA group were significantly higher than in the control group, and the estrus time of the PNA mice was also significantly longer than that in the control group. The mice characteristics for model evaluation are shown in Table 2 and Supplementary Table S2.
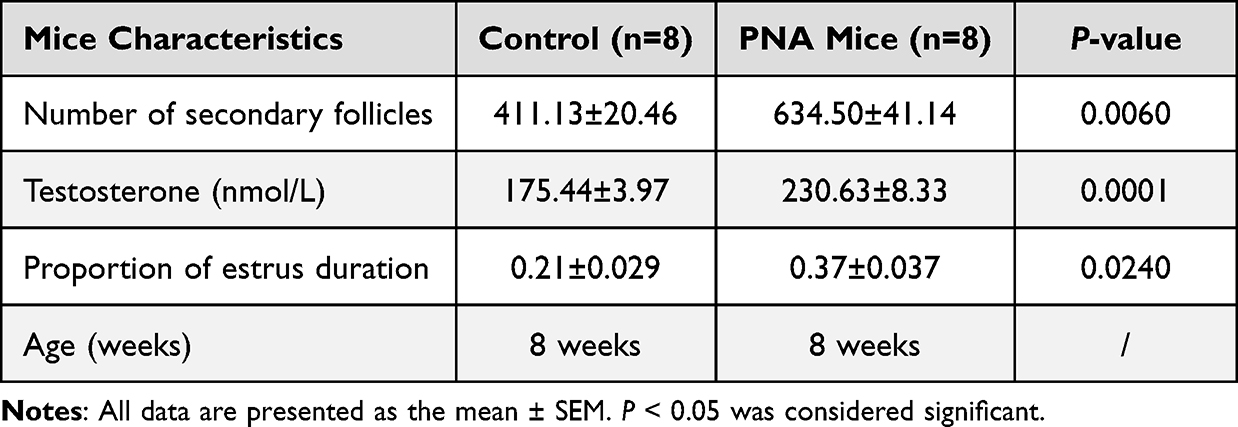 |
Table 2 The Characteristics of Prenatal Androgenized (PNA) Mice Compared with the Control Group |
Mouse Ovarian Tissue Processing and Histological Examination
After the mice were euthanized, the ovaries were dissected, and one portion was quickly stored at −80°C, while the other was fixed with 4% paraformaldehyde at 4°C overnight. The fixed ovaries were subsequently stored in 70% ethanol for histological examination. The fixed ovarian tissue was dehydrated with alcohol and cleared with xylene, then immersed in molten paraffin for embedding. Briefly, 5-µm-thick paraffin sections were mounted on 3-aminopropyltrisulfide silane-coated glass slides, which were then stained with hematoxylin-eosin (HE) to observe the growth of follicles; the number of follicles was counted.
Nucleic Acid Isolation
Total RNA from GCs samples was isolated using TRIzol (Invitrogen, Waltham, MA, USA), per the manufacturer’s instructions. RNA concentration and purity were determined via Nanodrop 2000 (Thermo Scientific, Waltham, MA, USA). Samples with acceptable absorbance ratios A260/A280 (1.9–2.2) and A260/A230 (2.0–2.4) were considered for further analysis. Next, 1% formaldehyde denaturing gel electrophoresis was employed to access the quality of RNA, and the gel was stained with 10,000×4S Red Plus Nucleic Acid Staining (Sango Biology, Shanghai, China).
Genomic DNA from mouse tissue samples and GCs samples were extracted using the QIAamp DNA Mini Kit (Qiagen, Hilden, Germany) according to the protocol described by the manufacturer. After extraction, the concentration and quality of DNA were quantitatively measured with the Nanodrop 2000 spectrophotometer.
MBD Sequencing and Bioinformatic Analysis
The sequencing data of MBD-seq was derived from our previous studies (https://www.ncbi.nlm.nih.gov/geo/; Accession Number: GSE138573 & GSE156961).20,21 We performed MBD-seq to ascertain the differentially methylated regions (DMRs) in GCs and mouse ovaries to compare the methylation profiled regions. Briefly, 1 μg genomic DNA per sample was sheared using M220 Focused-ultrasonicator (Covaris, Woburn, MA, USA), and the sheared DNA with methylated regions was affinity-enriched using the MethylMinerTM Kit (Invitrogen, Waltham, MA, USA), per the manufacturer’s protocols. The affinity-enriched fractions were used to construct an index library with the NEBNext Ultra DNA Library Prep Kit for Illumina (NEB, San Diego, CA, USA), and Agilent 2100 Bioanalyzer (Agilent, USA) was used to assess the quality of the libraries.
For the MBD-seq data of GCs, TrimGalore (version 0.6.7) was used to trim the original data, followed by using fastqc (version 0.11.8) to control the sequencing quality. Then, the clean reads obtained were mapped to the reference genome (Human hg38) using bowtie2 (version 2.3.5.1) with samtools (Release 1.5) to filter the data. DNA methylation datasets from PCOS and controls were analyzed and compared using the MEDIPS package (version 1.48.0). The methylated regions that reached the Adj.P<0.05 and |log2 (fold change [FC])|≥1 were considered DMRs. For the MBD-seq data of mice, the data processing steps were similar, except that the filtered reads were mapped to the reference genome Mouse mm10. The quality control results of MBD-seq data are shown in Figures S1 and S2. Detailed MBD-seq data regarding the study were shown in Supplementary Table S3.
Transcriptome Sequencing and Data Analysis
The transcriptome sequencing was downloaded from our previous study (https://www.ncbi.nlm.nih.gov/geo/; Accession Number: GSE138518).20 The protocol includes the construction and evaluation of RNA-seq libraries.
The RNA sequencing data was preprocessed and compared with UCSC Human Genome Browser hg38 assembly with HISAT2 (version 2.2.0). Subsequently, based on Ensembl gene-level annotations, Stringtie (version 2.2.0) was employed to ascertain the read counts of genes. The unnormalized counts were combined into a count matrix with R (version 4.2.1) and served as input to DESeq2 (version 1.36.0) and edgeR (version 3.38.4). The DEGs were identified by the intersections of the result of DESeq2 and edgeR analysis, and the expression changes with the value of |log2 (FC)| ≥ 1. P<0.05 was considered to indicate statistical significance. The quality control results of RNA-seq data are shown in Figure S3. Detailed RNA-seq data regarding the study are presented in Supplementary Table S3.
Real-Time Quantitative PCR (RT-qPCR)
The TACSTD2 expression level was quantified by RT-qPCR. Total RNA (500 ng) was reverse-transcribed by PrimeScript RT Master Mix (RR037, TAKARA, Japan) to generate the complementary DNA (cDNA) for qPCR. The Luna® Universal qPCR Mix (M3003S, New England Biolabs, USA) was used to carry out the qPCR in QuantStudio 3 (Applied Biosystems) following the manufacturer’s instructions, with glyceraldehyde-3-phosphate dehydrogenase (GAPDH) level as the loading control. The primers used to amplify TACSTD2 are shown in Supplementary Table S4.
Methylation-Specific PCR (MSP)
Genomic DNA of GCs was extracted for bisulfite conversion using EZ DNA Methylation‐Gold™ Kit (D5006, Zymo Research, USA). Unmethylated cytosines in the genome are converted to uracil and thymines after PCR amplification, while methylated cytosines are unchanged. Then, PCR was performed with primers specifically designed for methylation and methylated DNA, respectively. The primers are shown in Supplementary Table S4.
Lipid Metabolites Analysis
First, the collected serum samples were thawed on ice from −80°C, and a 50 μL serum was transferred to a 1.5 mL centrifuge tube. Then, 200 μL pre-cooled methanol, 400 μL chloroform, and 170 μL double-distillation water were added and blended thoroughly for 1 min. Next, the mixture was incubated at 4°C and centrifuged at 13,000 g for 10 min. The lower chloroform layer was collected. To the upper layer, 400 μL solvent mixture (CHCl3:MeOH:H2O=85:14:1 [vol:vol:vol]) was added, and after 10 min holding at 4°C, the solution was centrifuged at 13,000 g for 10 min, and the lower chloroform layer collected twice was combined and dried in a vacuum concentrator at a low temperature. Next, the dried samples were redissolved in 100 μL (methylene chloride:isopropyl alcohol:methanol=2:1:1 ([vol:vol:vol]), followed by vortex oscillation for 1 min and centrifugation at 13,000 g for 10 min. Finally, 50 μL of the supernatant was taken for UPLC-MS analysis.
The UPLC-MS analysis mass spectrometry data were compared with the human metabolomics database (Human Metabolome Database). The processed serum data matrix was imported into the SIMCA-P software for principal component analysis (PCA) for quality control of samples and orthogonal partial least squares discriminant analysis (OPLS-DA) modeling analysis to identify differences between groups. The lipid metabolites with variable importance in projection (VIP) score of more than 1, with the value of |log2 (FC)|≥1 and P<0.05 were identified as differential metabolites. The differential metabolites were visualized via the volcano map and were clustered via the hierarchical clustering heatmap.
Statistical Analysis
Statistical analyses were performed using GraphPad Prism version 8.01 software (GraphPad Software, San Diego, CA, USA) and Statistical Package for Social Sciences (SPSS) version 24.0 software (IBM Corporation, Armonk, NY, USA). The differences between groups were determined by two-sided Student’s t-test, and P-value<0.05 was identified as statistically significant.
Results
Clinical Characteristics of the PCOS Patients and Control Groups
The clinical characteristics of 21 PCOS patients and 21 healthy women are shown in Table 1. The data showed that the level of testosterone (T) and luteinizing hormone (LH) was significantly increased in the PCOS group. The level of follicle-producing hormone (FSH) was decreased slightly, but there was no significant difference. Notably, the LH/FSH ratio of the control groups was 1.00, whereas this ratio was significantly elevated in the PCOS patients (2.11), which is consistent with the clinical features of PCOS.22,23 There was no significant difference in other characteristics. Subsequently, GCs and the sera of PCOS patients and normal women were collected for further experiments. The complete workflow of this study is presented in Figure 1.
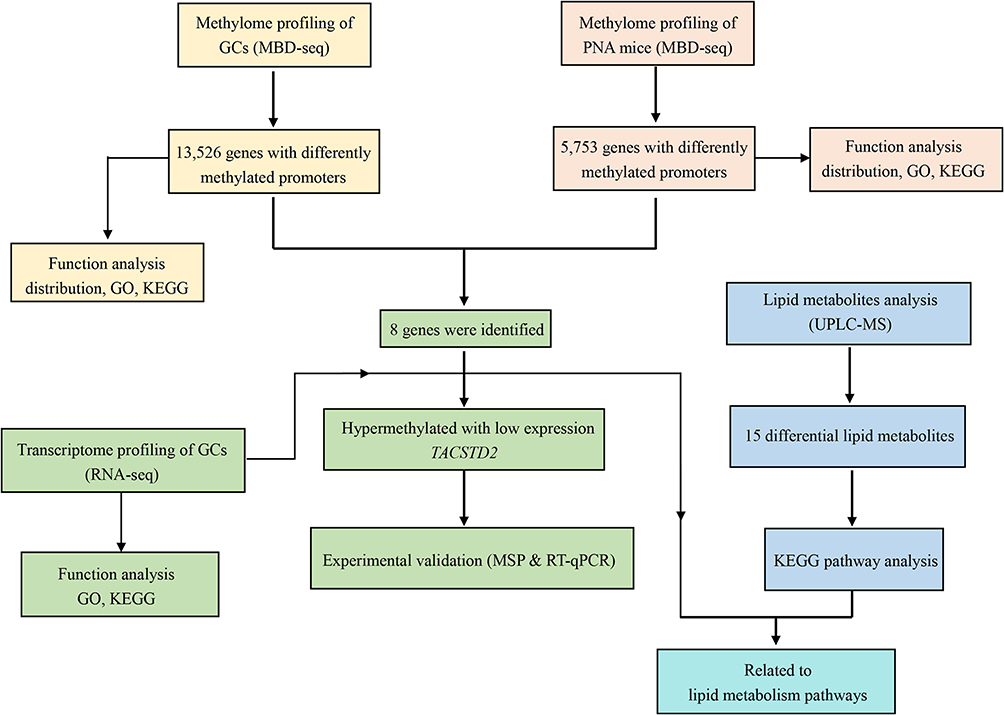 |
Figure 1 The complete workflow of the study. |
Identification of PCOS Patients’ DMRs and Functional Analysis
To confirm the DMRs, genomic DNA of GCs was extracted from PCOS patients (n=3) and control groups (n=2) for standard MBD-seq. After processing and quality control of MBD-seq raw sequencing data of GCs, the methylation regions on the whole genome were analyzed using the MEDIPS package (version 1.48.0). Finally, 1,001,256 DMRs (Adj.P<0.05, |log2 (FC)|>1) were obtained in PCOS patients, among which 599,396 (59.86%) were hypermethylated and 401,860 (40.14%) were hypomethylated (Supplementary Table S5). The DMRs have added gene annotations to ascertain the distribution in the genome (Figure 2). There was no significant difference in the overall distribution of the hypermethylated and hypomethylated regions, for the most portion in the distal intergenic region, followed by the intron region. However, the proportion of hypomethylated promoter regions (23.88%) was about 1.92-times that of the hypermethylated promoter regions (12.45%), which may have crucial implications for some genes in PCOS. Next, we accessed the distribution of hypermethylated regions’ (red) and hypomethylated regions’ (blue) DMRs in the whole genome (Figure 3A). The results showed that the hypermethylated regions of most chromosomes are higher than hypomethylated regions, with only a few chromosomes exhibiting the opposite result. In addition, we also analyzed the distribution of DMRs located in the CpG and genomic regions (Figure 3B). It is worth mentioning that the CpG in the DMRs of CpG islands, CpG shores, and CpG shelves reportedly have more hypomethylated than hypermethylated regions.
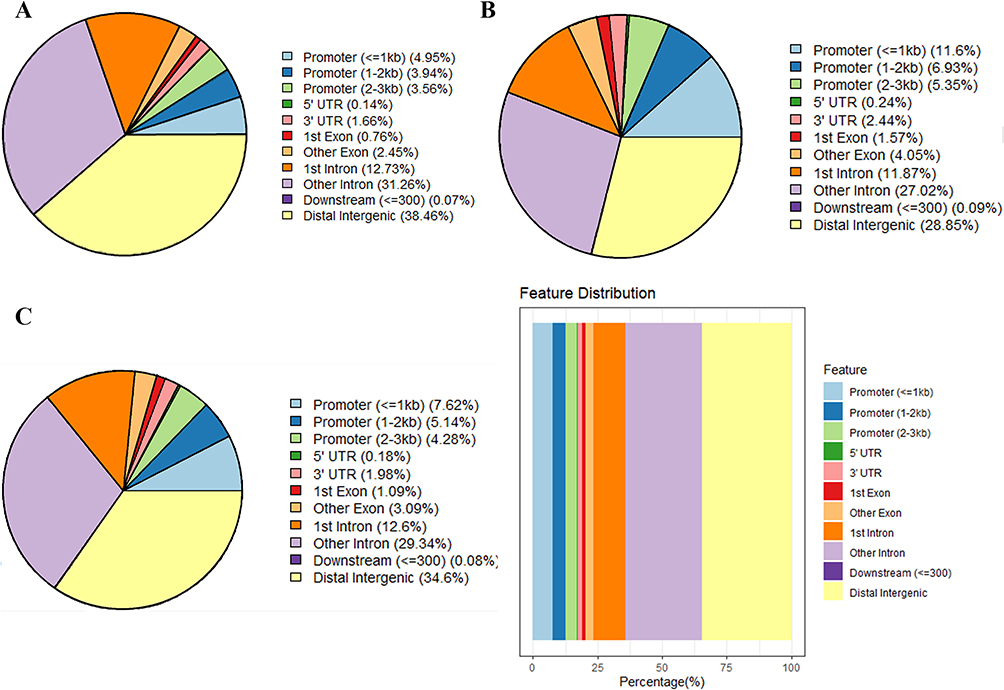 |
Figure 2 Gene annotation of the differentially methylated regions (DMRs) in GCs of PCOS patients vs control groups. (A) The distribution of hypermethylated DMRs; (B) The distribution of hypomethylated DMRs; (C) The distribution of overall DMRs. Abbreviations: GC, granulosa cell; PCOS, polycystic ovary syndrome. |
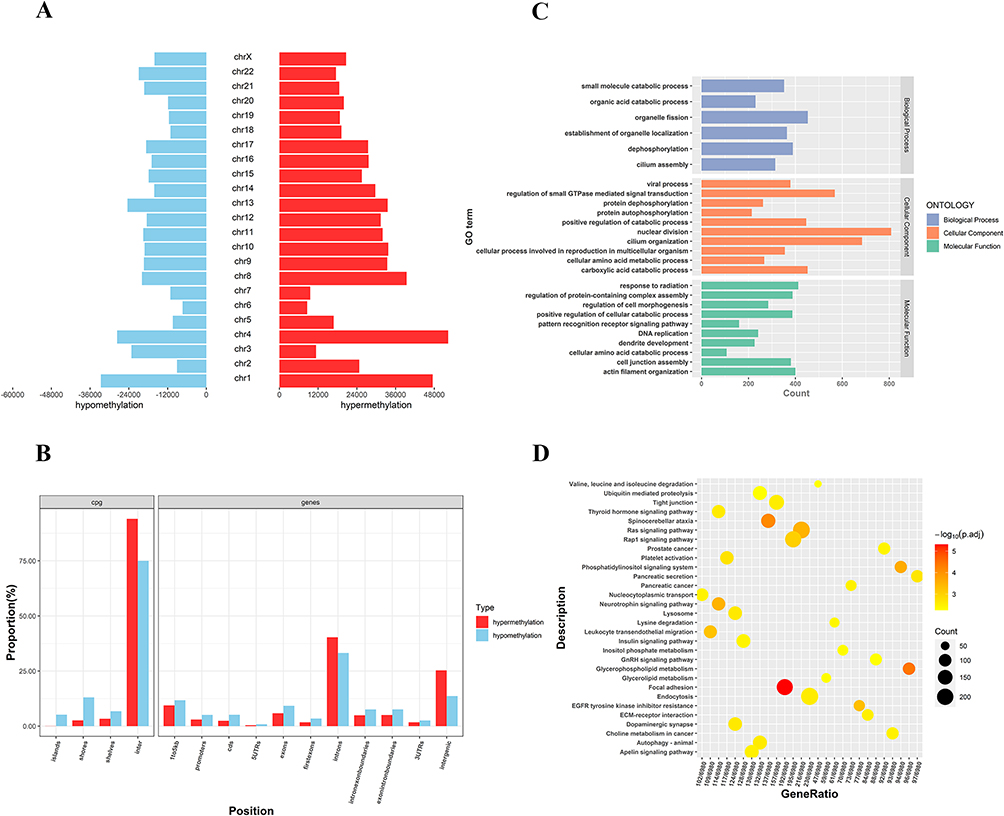 |
Figure 3 Distribution and bioinformatic analysis of differentially methylated regions (DMRs) on the genome of PCOS vs control groups (A) The distribution of hypermethylated regions (red) and hypomethylated regions (blue) DMRs in the whole genome; (B) The distribution of DMRs located in CpG and genomic regions; (C) GO analysis of genes with DMRs promoters (D) KEGG analysis of genes with DMRs promoters. Abbreviations: GO, Gene Ontology; KEGG, Kyoto Encyclopedia of Genes and Genomes. |
DNA methylation that leads to disease or metabolic disorders usually occurs at multiple CpG sites on CpG islands, many of which are found in the promoters of protein-coding genes.24,25 Thus, we focused on DMRs in the promoter that may influence the transcription of some key mRNAs in PCOS. A total of 13,526 genes with DMRs in the promoter regions were identified, of which 9367 genes were hypermethylated and 4159 genes were hypomethylated (Supplementary Table S6). Then, we used the Gene Ontology (GO) and Kyoto Encyclopedia of Genes and Genomes (KEGG) databases to perform ontology analysis on the selected DMGs. DMGs in the promoter region of GCs of PCOS patients were mainly enriched in the GO terms associated with catabolic processes and organelle, including small molecule catabolic process, organic acid catabolic process, establishment of organelle localization, and organelle fission (Figure 3C). Furthermore, the KEGG terms mainly included insulin signaling pathway, glycerophospholipid metabolism, and phosphatidylinositol signaling system (Figure 3D).
Ovary Morphology, and Serological Characterization of PNA Mice
The estrus duration, serum testosterone concentration, and number of secondary follicles were statistically monitored in the normal control groups and PNA mice as shown (Figure 4A). The duration of estrus (P<0.05) and the number of secondary follicles (P<0.01) were significantly higher in PNA mice than in normal control mice. Furthermore, we also observed that the serum testosterone level (P<0.001) of PNA mice was significantly increased, which is consistent with sex hormone dysregulation in PCOS patients. To explore the tissue morphology of the mouse ovary, we performed HE staining on the ovaries of the control groups and PNA mice (Figure 4B and C). The HE staining results showed that the ovaries of the control group showed more corpus luteum, indicating that the ovaries had recently undergone smooth ovulation. However, the ovaries of DHT-induced PNA mice showed a distinctive polycystic pattern with fewer corpus luteum, indicating no recent ovulation. Additionally, follicles with an atretic cyst-like appearance were observed in the ovaries of PNA mice, but not in control mice.
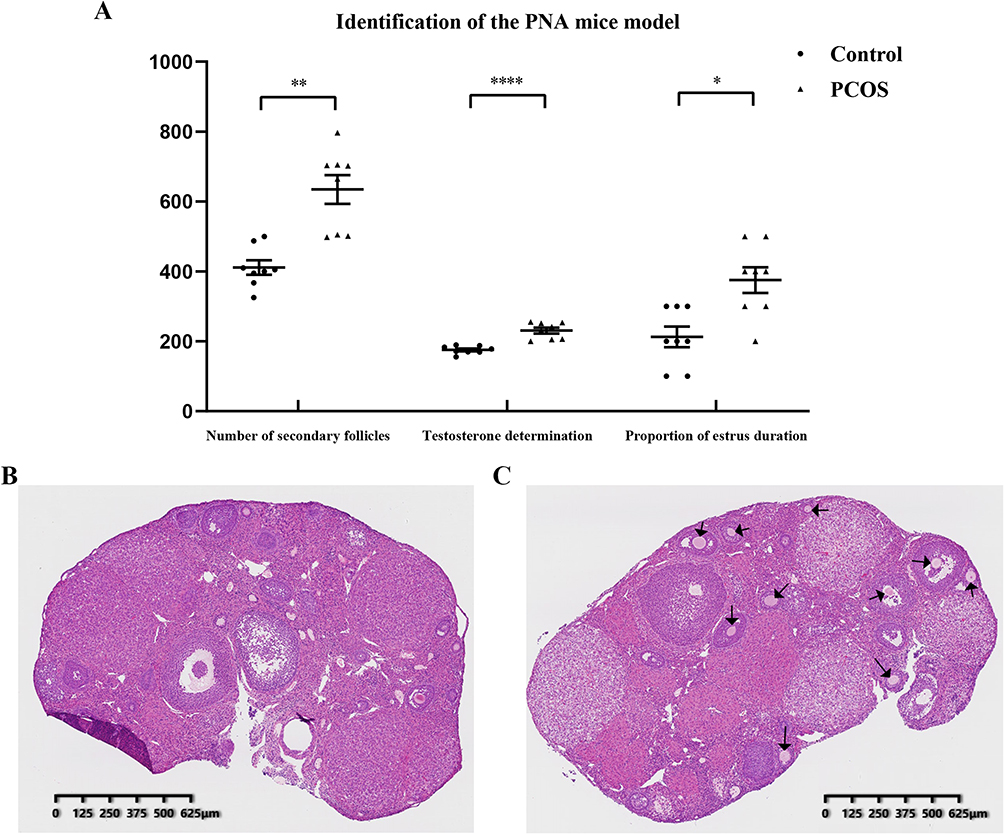 |
Figure 4 Serological and morphological identification of prenatal androgenized (PNA) mice. (A) The proportion of estrus duration, serum testosterone concentration, and number of secondary follicles in PNA mice and control groups (*P<0.05, **P<0.01, ****P<0.0001; multiply the proportion of estrus duration data by 100 to ensure the vertical height); (B) Control group mouse ovary HE staining section; (C) PNA mouse ovary HE staining section; the black arrows indicate the primordial follicles. Abbreviation: HE, hematoxylin-eosin. |
Identification of PNA Mice DMRs and Functional Analysis
To ascertain the DMRs of mice, we also extracted genomic DNA from the ovarian tissues of 3 PNA mice and 2 control group subjects by MBD-seq. The MBD-seq data were processed similarly as the previous PCOS data. A total of 68,930 DMRs (Adj.P<0.05, |log2 (FC)|>1) were obtained from PNA mice, of which 63,774 (88.07%) were hypermethylated and 8638 (11.93%) were hypomethylated (Supplementary Table S7). Similar to human GCs MBD-seq, the distal intergenic region, as well as the intron region, also accounted for the most DMGs. However, the proportion of hypomethylated promoter regions (8.02%) was only about 0.50-times that of hypermethylated promoter regions (16.11%) (Figure 5). We also evaluated the distribution of DMRs on each mouse chromosome (Figure 6A). Each hypermethylated DMRs ratio on chromosomes was greater than that of the hypomethylated DMRs ratio. Interestingly, the distribution of DMRs in CpG regions was much more different than that in human GCs (Figure 6B), indicating the complexity and heterogeneity of PCOS.
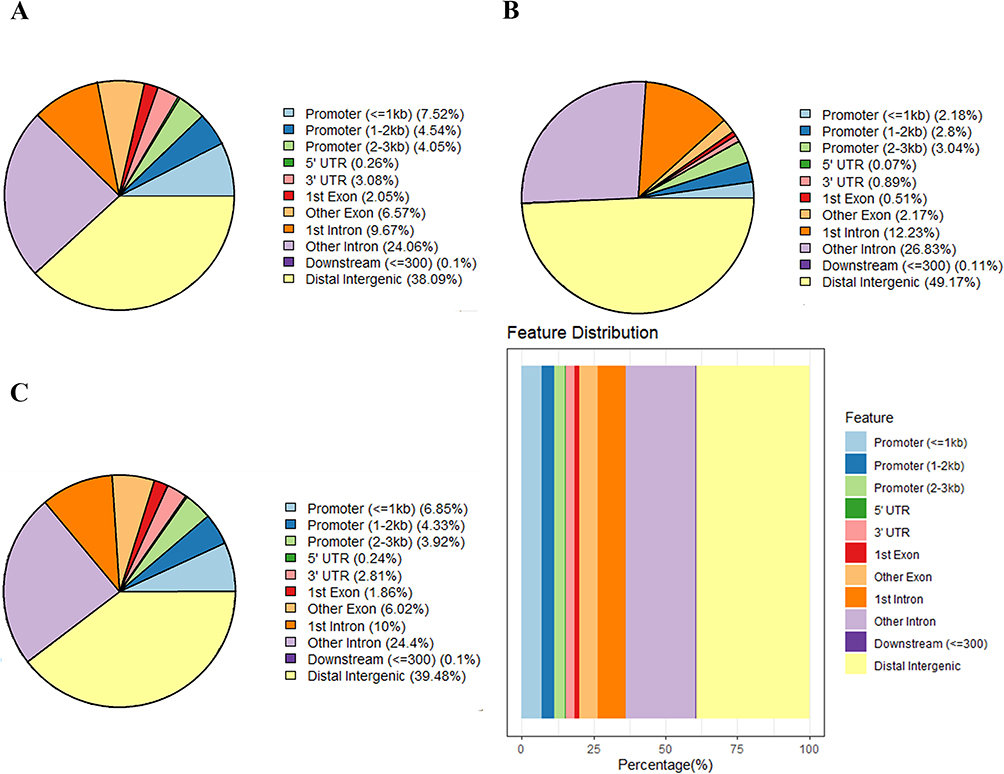 |
Figure 5 Gene annotation of the differentially methylated regions (DMRs) in PNA mice vs control mice. (A) The distribution of hypermethylated DMRs; (B) The distribution of hypomethylated DMRs; (C) The distribution of overall DMRs. Abbreviation: PNA, prenatal androgenized. |
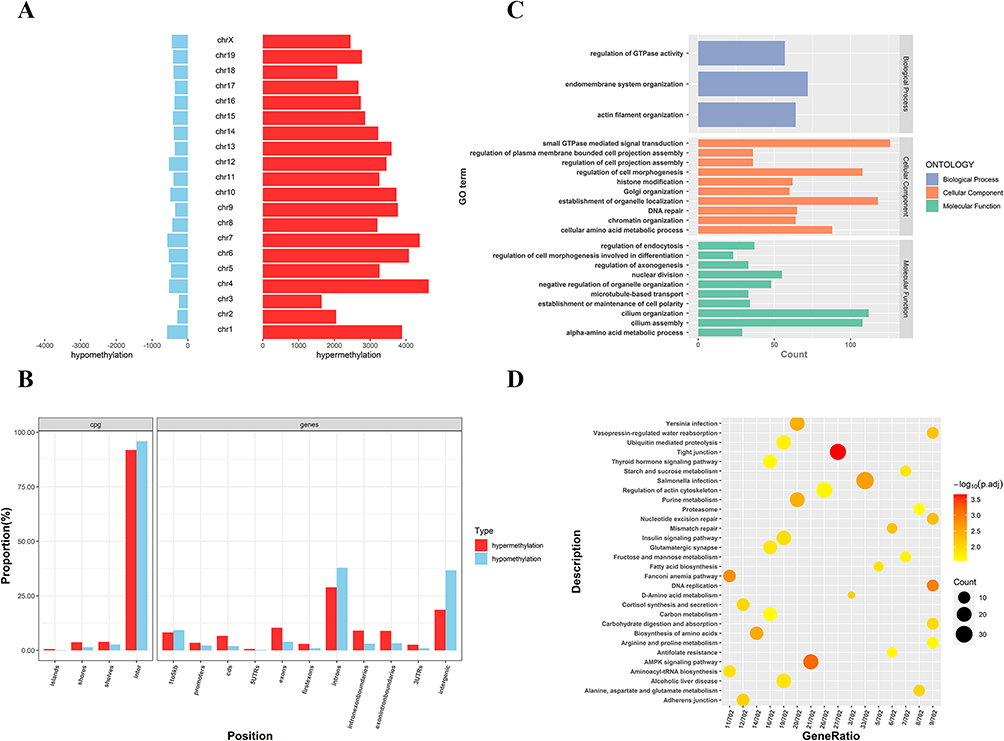 |
Figure 6 Distribution and bioinformatic analysis of differentially methylated regions (DMRs) on the genome of PCOS vs control groups. (A) The distribution of hypermethylated regions (red) and hypomethylated regions (blue) DMRs in the whole genome; (B) The distribution of DMRs located in the CpG and genomic regions; (C) GO analysis of genes with DMRs promoters; (D) KEGG analysis of genes with DMRs promoters. Abbreviations: GO, Gene Ontology; KEGG, Kyoto Encyclopedia of Genes and Genomes. |
We also investigated the mouse DMRs located in the gene promoter region. A total of 5753 genes in the promoter region were found, including 5464 hypermethylated genes and 289 hypomethylated genes (Supplementary Table S8). The GO and KEGG databases were also used for the ontology analysis of DMGs selected from mice. The GO terms of DMGs in the promoter region of PCOS mice were mainly enriched in the endomembrane system organization, small GTPase-mediated signal transduction, establishment of organelle localization and cilium organization, and other biological processes (Figure 6C). The KEGG pathway of DMGs in the promoter region of PCOS mice was mainly enriched in tight junctions, AMPK signaling pathway, DNA replication, and fatty acids biosynthesis (Figure 6D). These data indicated that PCOS is an endocrine disease modulated by hormones and closely related to inflammation.
Identification of DEGs and Functional Analysis
We implemented RNA-seq of GCs from PCOS patients (n=3) and controls (n=2) to identify significant DEGs and performed functional enrichment analysis. The hierarchical clustering analysis revealed significant differences in expression patterns between PCOS patients and controls (Figure 7A). By setting the threshold parameters (|log2 (FC)|>1, P<0.05), 2429 DEGs were identified in total via DESeq2 and edgeR (Figure 7B), of which 872 were significantly upregulated and 1557 were significantly downregulated (Supplementary Table S9). To evaluate the biological significance of DEGs, we performed GO ontology and KEGG pathway analysis. The GO ontology enrichment occurred in several biological and molecular processes, involved in the nuclear division, chromosome segregation, regulation of cell-cell adhesion, and positive regulation of T-cell proliferation (Figure 7C). Moreover, the KEGG terms were mainly enriched in some immune system and inflammation-related pathways, including signaling pathways regulating cytokine-cytokine receptor interaction, phagosome signaling pathway, and inflammatory bowel disease signaling pathway (Figure 7D).
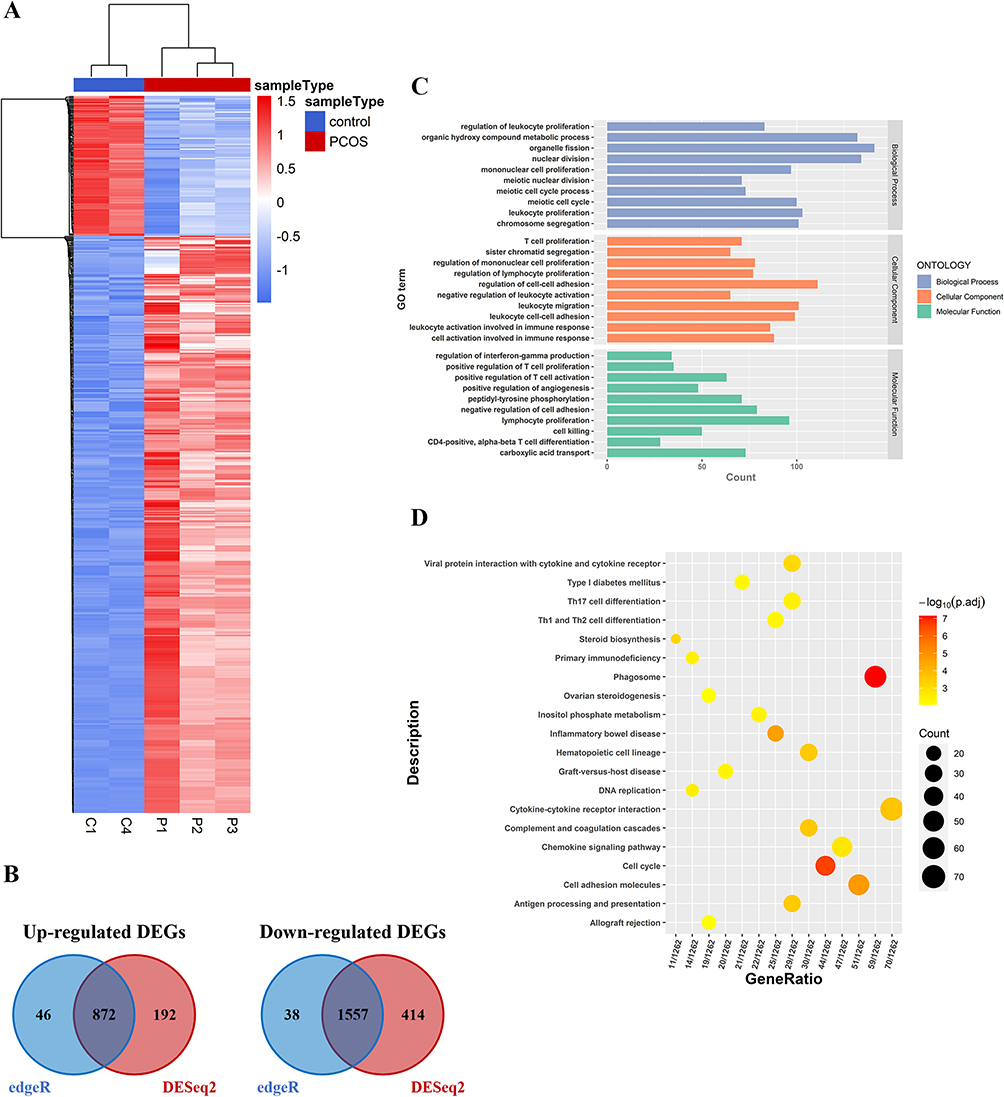 |
Figure 7 Identification of differentially expressed genes (DEGs) in GCs of PCOS patients vs control groups. (A) The hierarchical cluster heatmaps of DEGs; (B) The Venn diagrams of up-regulated and down-regulated DEGs, respectively; (C) GO function analysis of DEGs; (D) KEGG function analysis of DEGs. |
Identification of Hypermethylated Promoter Regions and DEG Downregulation
Integrating the data of differential methylation of promoter regions in ovarian tissue of the PCOS mice and GCs of the PCOS patients, we identified the following 8 genes: CDC42EP4, ERMN, EZR, PIK3R1, ARHGEF18, NECTIN2, TSC2, and TACSTD2 (Table 3). These genes may serve as epigenetic markers for the diagnosis of PCOS. Interestingly, several genes are reportedly involved in the pathogenesis of PCOS such as PIK3R1 and TSC2.26,27 Analyzing 2429 DEGs with these genes, we found that the expression of TACSTD2 was negatively correlated with the methylation level of the promoter. This result was consistent with the commonly assumed hypermethylation and downregulation of a gene promoter.
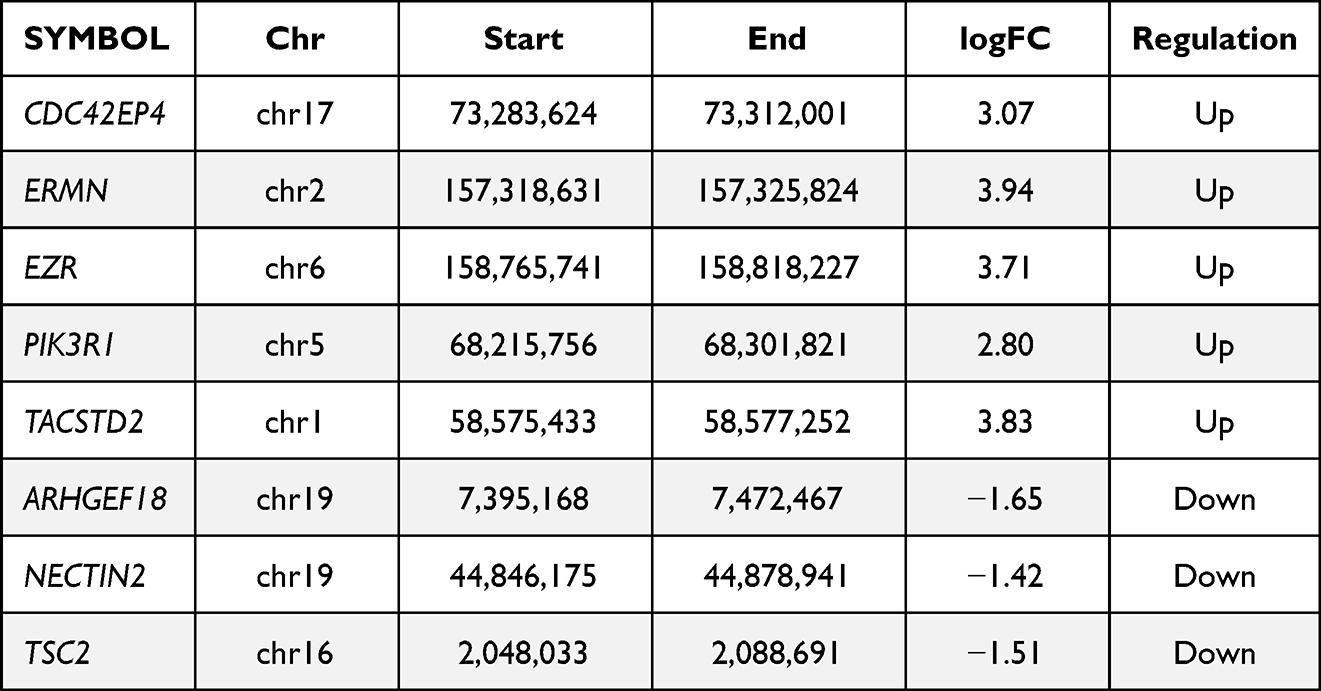 |
Table 3 The Genes Were Identified by the Intersection of PNA Mice and PCOS Patients |
Next, we used RT-qPCR and MSP to validate the TACSTD2 promoter methylation and gene expression levels using GCs from PCOS patients (n=5) and controls (n=5). The results of MSP are shown in Figure 8A. The promoter region of TACSTD2 was significantly hypermethylated in PCOS patients. Meanwhile, the representative results of RT-qPCR are shown in Figure 8B. The expression of TACSTD2 was significantly decreased in PCOS samples.
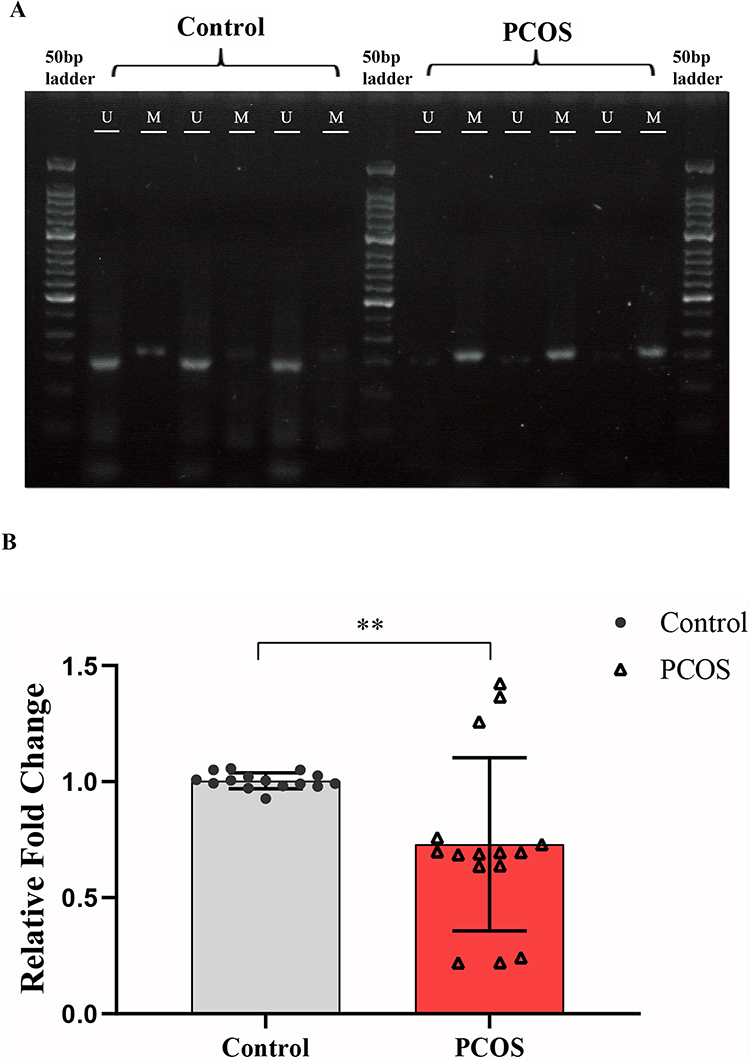 |
Figure 8 Validation of the promoter methylation and gene expression levels of TACSTD2. (A) MSP 2% agarose gel electrophoresis results; (B) RT-qPCR of TACSTD2 in PCOS patients GCs vs control groups GCs (**P<0.01). Abbreviations: MSP, methylation specific PCR; RT-qPCR, real-time quantitative PCR; M, methylated primer; U, unmethylated primer. |
Serum Lipid Metabolites Profiling of PCOS
To compare lipidomics signatures in patients with PCOS, the UPLC-MS method was used on serum samples (n=12). The variable matrix and classification matrix were respectively generated in positive and negative ion modes to construct the OPLS-DA model so that the samples of the PCOS group and the control group could be separated (Supplementary Figure S4). Then, the VIP value of each lipid metabolite in the model was measured, which could be used to determine the ability to influence sample classification and identify differential lipids in PCOS patients’ sera. Based on VIP value>1 in the OPLS-DA model and candidate differential lipids (P<0.05, |log2 (FC)|>1), 15 differential lipid metabolites were identified (Table 4).28 Notably, some lipid metabolites such as lysophosphatidylcholines (LPC) and triacylglyceride (TG) have been reported as closely relevant to the pathogenesis of PCOS.29,30 The screening results were visualized by the volcano map (Supplementary Figure S5), which can help to observe the lipid metabolites with significant differences. According to the VIP value in the OPLS-DA model, hierarchical clustering analysis was performed on differential lipids (Figure 9A). There were significant differences in the distribution patterns of differential lipids between the PCOS group and the control group, indicating that the lipid distribution of PCOS patients was similar. To investigate the biological functions of differential lipids in the human body and their impact on the occurrence and development of PCOS diseases, we used MetaboAnalyst 4.0 software to perform KEGG pathway analysis on the differential metabolites (Figure 9B), among which the glycerophospholipid pathway had the greatest impact (impact=0.11182, P=0.001). The results revealed that lipid metabolism was imbalanced in the sera of PCOS patients.
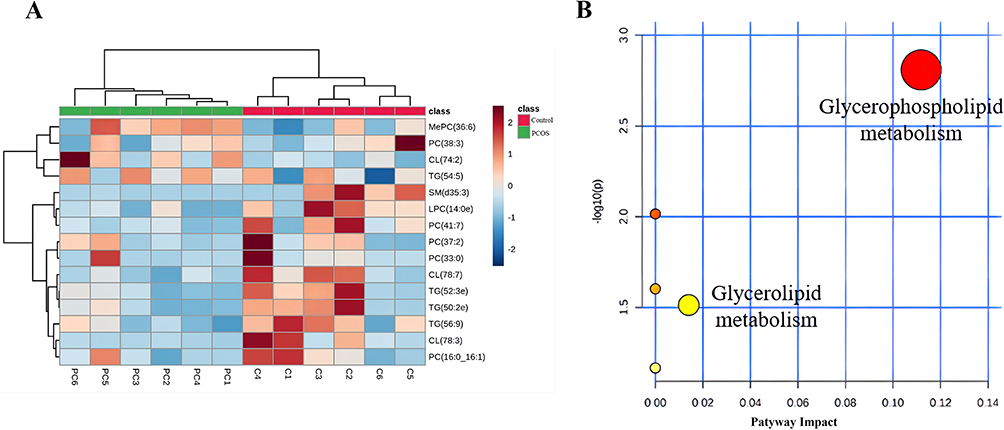 |
Figure 9 Analysis of serum differential lipids and metabolic pathways in PCOS patients vs control groups. (A) The heatmap of the hierarchical cluster of serum differential lipids; (B) Scatter plots of serum differential lipid KEGG metabolic pathway. |
Discussion
DNA methylation, one of the most dominant epigenetic phenomena, often affects physiological processes such as proliferation, differentiation, and apoptosis of cells. As a common and highly heterogeneous reproductive endocrine disease, PCOS is considered influenced by various factors such as environment and inheritable genetics.31 Previous studies have shown significant differences in plasma lipidomics in PCOS patients.32 In addition, alteration of DNA methylation has been noticed in subcutaneous adipose tissues, ovarian tissues, GCs, plasma, and other samples from PCOS patients.33–35 However, studies integrating methylome, transcriptome, and lipid metabolites in PCOS are rare.
In the present study, we screened 1,001,256 DMRs by MBD-seq from PCOS patients (Adj.P<0.05, |log2 (FC)| > 1). The CpG in the DMRs of CpG islands, CpG shores, and CpG shelves had more hypomethylated than hypermethylated regions. However, except for introns and intergenic regions, which have a higher hypermethylated proportion, the promoter, coding sequence, exons, and other regions all have a higher hypomethylated proportion (Figure 3B). A total of 13,526 DMGs related to the promoter region were identified, which enriched physiological processes including the cell cycle, glycerophospholipid metabolism, and phosphatidylinositol signaling system (Figure 3D). Additionally, the constructed PNA mouse model was also sequenced by MBD-seq, and 68,930 DMRs were obtained. The distribution of DMRs in CpG regions was much more different from that in human GCs (Figure 6B). The ratio of hypermethylated genes in the CpG island, CpG shores, and CpG shelves was higher than that in the hypomethylated genes. In terms of DMRs gene distribution, except for introns and intergenic regions, the proportion of the hypermethylated region was higher than that of the hypomethylated region (Figure 6B). In addition, 5753 DMGs in the promoter region were related to biological functions such as insulin signaling pathways and fatty acid synthesis (Figure 6D). The lipid metabolic pathways are common features of DMGs in GCs and PNA mice, suggesting that DNA methylation is associated with lipid metabolism in PCOS.
Next, we investigated DNA methylation signatures in PCOS patients and PNA mice and identified 8 potential epigenetics markers—CDC42EP4, ERMN, EZR, PIK3R1, ARHGEF18, NECTIN2, TSC2, and TACSTD2 (Table 3). In particular, we noticed several key genes such as PIK3R1, NECTIN2, and TSC2. The PIK3R1 gene encodes the 85-kD phosphoinositide-3-kinase regulatory region, which was identified as a potential pathogenic variant in PCOS and accompanied by severe insulin resistance, lipodystrophy, and obesity.36–38 NECTIN2 is a nectin cell adhesion molecule 2 associated with lipid-protein, was reported to be a novel marker in carotid atherosclerosis progression;39 young patients with PCOS are likely to feature signs of atherosclerosis.40 TSC2, which encodes for the growth protein tuberin, is activated by AMP-activated protein kinase to promote catabolic activities, and its physiological effect is consistent with insulin resistance in PCOS.41 This suggests that lipodystrophy, obesity, atherosclerosis, and insulin resistance observed in some of the PCOS patients might be induced by these genes.
Comparing the RNA profiles of GCs in PCOS patients and normal ovaries, 872 upregulated and 1557 downregulated RNAs were identified (Figure 7B). The enriched pathways are involved in steroid biosynthesis, ovarian steroidogenesis, and Type I diabetes mellitus, which also correlated with lipid metabolism in PCOS (Figure 7D). By integrating DNA methylation sequencing and transcriptome sequencing data, we found that the expression of TACSTD2 was negatively correlated with the methylation of the promoter region (Figure 8A and B), which was consistent with the results of a previous study.42 TACSTD2, an intronless cancer-associated antigen protein-encoding gene, was differentially expressed and identified as an independent marker in ovarian cancer.43 Previous studies have reported that women with PCOS are at increased risk of ovarian cancer,44 indicating that TACSTD2 is likely a potential biomarker of PCOS. Perhaps, such a unique gene has the potential to be diagnosed for PCOS, allowing highly sensitive and early detection. However, only few studies are currently focusing on TACSTD2 in PCOS, an attractive possibility that needs further investigation.
Considering that the signaling pathways and biological processes of DMGs and DEGs enrichment in the study are related to lipid metabolism, such as glycerophospholipid metabolism, fatty acid synthesis, and steroid biosynthesis, it is reasonable to postulate that there might be some connection between aberrant DNA methylation and disordered lipid metabolism in PCOS. Thus, combined with the UPLC-MS method of serum metabolic lipids in PCOS patients and normal groups, we found that CL (74:2), PC (16:0/16:1), TG (54:5), and MePC were significantly increased in PCOS, while CL (78:3), LPC (14:0e), SM (d35:3), and TG (52:3e) were significantly decreased (Table 4). Most PCOS patients have abnormal lipid metabolism and are accompanied by hyperandrogenism, chronic anovulation, insulin resistance (IR), and obesity.45 CL, containing four fatty acid chains, is unique among phospholipids and plays an important role in energy metabolism. It also only exists in the inner mitochondrial membrane of eukaryotes.46,47 Moreover, PC, LPC, and SM play important physiological functions in the human body, and the distribution patterns are associated with the developmental status of PCOS.48 Furthermore, PC is one of the most stable and abundant (40%–50%) phospholipids in mammalian cell membranes and subcellular organelles, which plays a key intermediate role in glycerophospholipid biosynthesis.49,50 Studies have shown that LPC (16:0), LPC (18:0), and LPC (18:1) can induce mitochondrial reactive oxygen species in aortic endothelial cells. Moreover, oxidative stress and endothelial cell activation are closely related to the occurrence of PCOS and IR.51,52 In the process of steroid hormone synthesis, SM plays a role in regulating transcription, acting as a messenger, and performing nuclear and extracellular signal regulation.53 In addition, TG has also been found to be a determinant of hyperandrogenemia in PCOS,29 and hyperandrogenism is considered the defining feature of PCOS,54 suggesting that TG is closely associated with the development of PCOS. These differential lipids are consistent with women with PCOS prone to metabolic diseases.
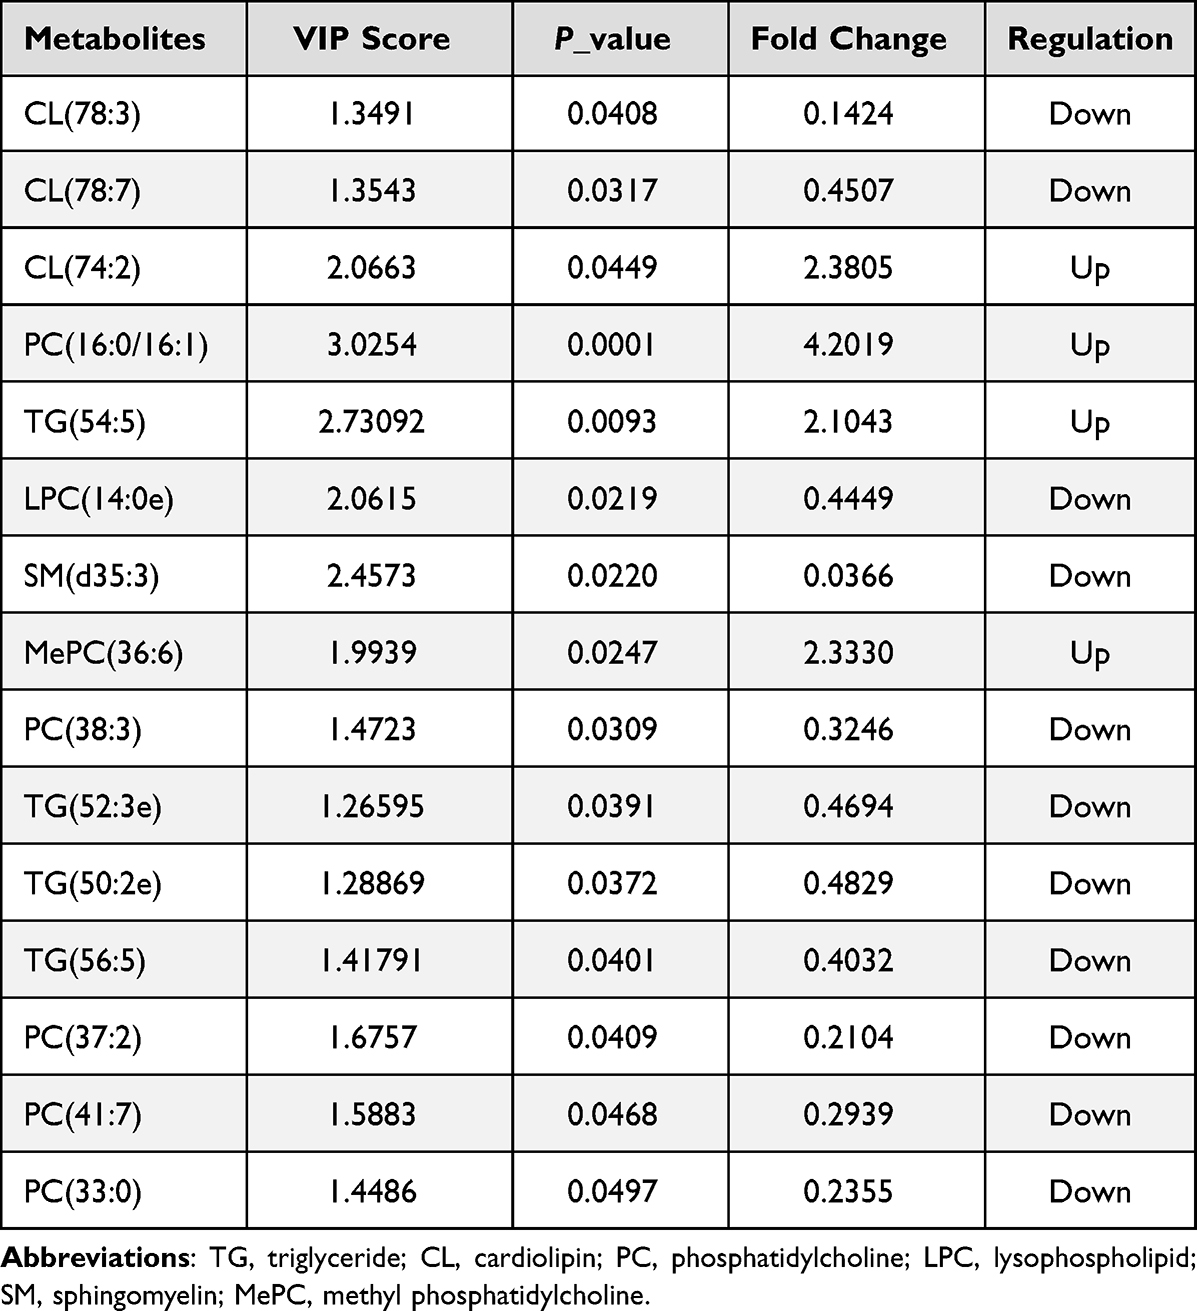 |
Table 4 Serum Differential Lipids in PCOS Patients Compared with Control Groups |
The abnormal activation or inhibition of lipid metabolism pathways in women of reproductive age is closely associated with the occurrence of PCOS.55–57 Interestingly, in our study, the serum differential metabolites were mainly enriched in the glycerophospholipid metabolism and glycerolipid metabolism pathways (Figure 9B). Furthermore, we noticed that glycerophospholipid, glycerolipid (Figure 3D), fatty acids biosynthesis, insulin signaling pathway (Figure 6D), and other lipid-related signaling pathways were also enriched in DMGs of GCs and PNA mice. In addition, several identified key genes of PIK3R1, NECTIN2, and TSC2 were also closely related to the pathogenesis of PCOS. Moreover, the DEGs of GCs are also enriched in lipid metabolism pathways such as ovarian steroidogenesis and steroid biosynthesis metabolic process (Figure 7C and D). These results indicated that the interaction between aberrant DNA methylation and abnormal lipid metabolites might contribute to the development of PCOS.
Despite many advances in the exploration of reproductive, metabolic, and psychological features, PCOS remains a poorly understood disease in terms of unified standards of diagnosis and therapy.58 It is worth noting that there have been several prior multi-omics studies on PCOS that indeed provided important insights into understanding its diagnosis and treatment, but they were either on gut microbiome and serum metabolome, or methylome and competing endogenous axes profiles.59,60 There are rare multi-omics studies on methylome, transcriptome, and serum lipid metabolites. In our study, combining the methylome and transcriptome data, the 8 DMGs identified are likely to contribute directly or indirectly to the progression of the disease, especially TACSTD2. While function enrichment analysis showed that multi-omics were enriched in lipid metabolism pathways, the 15 lipid metabolites may provide strategies for various therapies for PCOS. Perhaps, PCOS could be accurately diagnosed and targeted for treatment from the abnormal molecules identified in our study. This study also has some limitations. The sample size of the integration analysis is inadequate, and there is no include more comprehensive clinical data on PCOS patients. More sample size and comprehensive clinical data will be beneficial for the analysis of the results.
Conclusion
By integrating methylome and lipid metabolites profiling, we identified 8 potential epigenetic markers and 15 potential lipid metabolite markers for PCOS diagnosis and therapeutic targets. The function analysis indicated that these potential biomarkers were closely related to lipid metabolism. Combined with the transcriptome analysis, we showed that the expression of TACSTD2 was negatively correlated with the methylation of the promoter region. These findings may offer novel insights for an improved understanding of the etiology and diagnosis of PCOS.
Data Sharing Statement
All raw serum metabolomics data in this study have been deposited at Mendeley Data (https://data.mendeley.com/datasets/hj3h2vvhyr/2).
Ethics Approval and Informed Consent
All participants provided written informed consent, and the study was approved by the Ethics Committee on Human Research of Yuncheng Center Hospital (Approval ID: KYLL2019073). The animal experiments performed in the study were approved by the Experimental Animal Welfare & Ethics Committee of the School of Biomedical Engineering, Shanghai Jiao Tong University (No. 2019005), and conform to the animal care and use guidelines of Shanghai Jiao Tong University Experimental Animal Center. The study protocol was conducted in accordance with the Declaration of Helsinki.
Acknowledgments
We are grateful to patients and their families for their support of our research. We thank the Yuncheng Central Hospital for the collection of granulosa cells and serum. Thanks to Ting Li affiliated with Yuncheng Central Hospital for help with the statistical data of clinical samples.
Author Contributions
All authors made a significant contribution to the work reported, whether that is in the conception, study design, execution, acquisition of data, analysis and interpretation, or in all these areas; took part in drafting, revising, or critically reviewing the article; gave final approval of the version to be published; have agreed on the journal to which the article has been submitted; and agree to be accountable for all aspects of the work.
Funding
This work was supported by the Natural Science Foundation of Shanghai (19ZR1476100), National Infrastructures for Translational Medicine (Shanghai) (TMSK-2020-109), Interdisciplinary Program of Medical Engineering Cross Fund (YG2019QNB23, YG2019QNA49, and YG2019QNA52).
Disclosure
The authors report no conflicts of interest in this work.
References
1. Azziz R, Woods KS, Reyna R, Key TJ, Knochenhauer ES, Yildiz BO. The prevalence and features of the polycystic ovary syndrome in an unselected population. J Clin Endocrinol Metab. 2004;89(6):2745–2749. doi:10.1210/jc.2003-032046
2. Joham AE, Norman RJ, Stener-Victorin E, et al. Polycystic ovary syndrome. Lancet Diabetes Endocrinol. 2022;10(9):668–680. doi:10.1016/s2213-8587(22)00163-2
3. Lizneva D, Suturina L, Walker W, Brakta S, Gavrilova-Jordan L, Azziz R. Criteria, prevalence, and phenotypes of polycystic ovary syndrome. Fertil Steril. 2016;106(1):6–15. doi:10.1016/j.fertnstert.2016.05.003
4. Wang J, Wu D, Guo H, Li M. Hyperandrogenemia and insulin resistance: the chief culprit of polycystic ovary syndrome. Life Sci. 2019;236:116940. doi:10.1016/j.lfs.2019.116940
5. Paoli A, Mancin L, Giacona MC, Bianco A, Caprio M. Effects of a ketogenic diet in overweight women with polycystic ovary syndrome. J Transl Med. 2020;18(1):104. doi:10.1186/s12967-020-02277-0
6. Melo AS, Ferriani RA, Navarro PA. Treatment of infertility in women with polycystic ovary syndrome: approach to clinical practice. Clinics. 2015;70(11):765–769. doi:10.6061/clinics/2015(11)09
7. Chaudhary H, Patel J, Jain NK, Joshi R. The role of polymorphism in various potential genes on polycystic ovary syndrome susceptibility and pathogenesis. J Ovarian Res. 2021;14(1):125. doi:10.1186/s13048-021-00879-w
8. Tu J, Cheung AH, Chan CL, Chan WY. The Role of microRNAs in Ovarian Granulosa Cells in Health and Disease. Front Endocrinol. 2019;10:174. doi:10.3389/fendo.2019.00174
9. Huang Z, Wells D. The human oocyte and cumulus cells relationship: new insights from the cumulus cell transcriptome. Mol Hum Reprod. 2010;16(10):715–725. doi:10.1093/molehr/gaq031
10. Tan M, Cheng Y, Zhong X, et al. LNK promotes granulosa cell apoptosis in PCOS via negatively regulating insulin-stimulated AKT-FOXO3 pathway. Aging. 2021;13(3):4617–4633. doi:10.18632/aging.202421
11. Kanbour SA, Dobs AS. Hyperandrogenism in Women with Polycystic Ovarian Syndrome: pathophysiology and Controversies. Clin Res Therapeutics. 2022;3(1):22–30. doi:10.1089/andro.2021.0020
12. Rodriguez paris V, Bertoldo MJ. The Mechanism of Androgen Actions in PCOS Etiology. Med Sci. 2019;7(9):56.
13. Moore LD, Le T, Fan G. DNA methylation and its basic function. Neuropsychopharmacology. 2013;38(1):23–38. doi:10.1038/npp.2012.112
14. Robertson KD. DNA methylation and human disease. Nat Rev Genet. 2005;6(8):597–610. doi:10.1038/nrg1655
15. Vázquez-Martínez ER, Gómez-Viais YI, García-Gómez E, et al. DNA methylation in the pathogenesis of polycystic ovary syndrome. Reproduction. 2019;158(1):R27–r40. doi:10.1530/rep-18-0449
16. Wang XX, Wei JZ, Jiao J. Genome-wide DNA methylation and gene expression patterns provide insight into polycystic ovary syndrome development. Oncotarget. 2014;5(16):6603–6610. doi:10.18632/oncotarget.2224
17. Li S, Zhu D, Duan H, et al. Differential DNA methylation patterns of polycystic ovarian syndrome in whole blood of Chinese women. Oncotarget. 2017;8(13):20656–20666. doi:10.18632/oncotarget.9327
18. Divoux A, Erdos E, Whytock K, Osborne TF, Smith SR. Transcriptional and DNA Methylation Signatures of Subcutaneous Adipose Tissue and Adipose-Derived Stem Cells in PCOS Women. Cells. 2022;11(5):46.
19. Rotterdam. Revised 2003 consensus on diagnostic criteria and long-term health risks related to polycystic ovary syndrome (PCOS). Hum Reprod. 2004;19(1):41–47. doi:10.1093/humrep/deh098
20. Mao Z, Li T, Zhao H, Wang X, Kang Y, Kang Y. Methylome and transcriptome profiling revealed epigenetic silencing of LPCAT1 and PCYT1A associated with lipidome alterations in polycystic ovary syndrome. J Cell Physiol. 2021;236(9):6362–6375. doi:10.1002/jcp.30309
21. Qin Y, Li T, Zhao H, Mao Z, Ding C, Kang Y. Integrated Transcriptomic and Epigenetic Study of PCOS: impact of Map3k1 and Map1lc3a Promoter Methylation on Autophagy. Front Genet. 2021;12:620241. doi:10.3389/fgene.2021.620241
22. Saadia Z. Follicle Stimulating Hormone (LH: FSH) Ratio in Polycystic Ovary Syndrome (PCOS) - Obese vs. Non- Obese Women. Med Arch. 2020;74(4):289–293. doi:10.5455/medarh.2020.74.289-293
23. Mitrašinović-Brulić M, Buljan M, Suljević D. Association of LH/FSH ratio with menstrual cycle regularity and clinical features of patients with polycystic ovary syndrome. Middle East Fertility Society Journal. 2021;26(1):1–9.
24. Shen Y, Chow J, Wang Z, Fan G. Abnormal CpG island methylation occurs during in vitro differentiation of human embryonic stem cells. Hum Mol Genet. 2006;15(17):2623–2635. doi:10.1093/hmg/ddl188
25. Long MD, Smiraglia DJ, Campbell MJ. The Genomic Impact of DNA CpG Methylation on Gene Expression; Relationships in Prostate Cancer. Biomolecules. 2017;7(1):68.
26. Lauretta R, Lanzolla G, Vici P, Mariani L, Moretti C, Appetecchia M. Insulin-Sensitizers, Polycystic Ovary Syndrome and Gynaecological Cancer Risk. Int J Endocrinol. 2016;2016:1–17. doi:10.1155/2016/8671762
27. Sun L, Zhang Q, Li Q, et al. A novel PIK3R1 mutation of SHORT syndrome in a Chinese female with diffuse thyroid disease: a case report and review of literature. BMC Med Genet. 2020;21(1):215. doi:10.1186/s12881-020-01146-3
28. Dong F, Deng D, Chen H, et al. Serum metabolomics study of polycystic ovary syndrome based on UPLC-QTOF-MS coupled with a pattern recognition approach. Anal Bioanal Chem. 2015;407(16):4683–4695. doi:10.1007/s00216-015-8670-x
29. Hestiantoro A, Karimah PD, Shadrina A, Wiweko B, Muharam R, Astuti BPK. Triglycerides, independent of Ferriman Gallwey Score, is a main determinant of free testosterone index in PCOS. F1000Res. 2019;8:94. doi:10.12688/f1000research.16815.1
30. Yu Z, Qin E, Cheng S, et al. Gut microbiome in PCOS associates to serum metabolomics: a cross-sectional study. Sci Rep. 2022;12(1):22184. doi:10.1038/s41598-022-25041-4
31. Li S, Zhu D, Duan H, Tan Q. The epigenomics of polycystic ovarian syndrome: from pathogenesis to clinical manifestations. Gynecological Endocrinol. 2016;32(12):942–946. doi:10.1080/09513590.2016.1203409
32. Haoula Z, Ravipati S, Stekel DJ, et al. Lipidomic analysis of plasma samples from women with polycystic ovary syndrome. Metabolomics. 2015;11(3):657–666. doi:10.1007/s11306-014-0726-y
33. Liu L, He D, Wang Y, Sheng M. Integrated analysis of DNA methylation and transcriptome profiling of polycystic ovary syndrome. Mol Med Rep. 2020;21(5):2138–2150. doi:10.3892/mmr.2020.11005
34. Pan JX, Tan YJ, Wang FF, et al. Aberrant expression and DNA methylation of lipid metabolism genes in PCOS: a new insight into its pathogenesis. Clin Epigenetics. 2018;10:6. doi:10.1186/s13148-018-0442-y
35. Liu YN, Qin Y, Wu B, et al. DNA methylation in polycystic ovary syndrome: emerging evidence and challenges. Reprod Toxicol. 2022;111:11–19. doi:10.1016/j.reprotox.2022.04.010
36. Crespo RP, Rocha TP, Montenegro LR, et al. High-throughput Sequencing to Identify Monogenic Etiologies in a Preselected Polycystic Ovary Syndrome Cohort. J Endocr Soc. 2022;6(9):bvac106. doi:10.1210/jendso/bvac106
37. Yin X, Liu J, Feng R, Xu M, Liu J. Novel PIK3R1 mutation of SHORT syndrome: a case report with a 6-month follow up. J Diabetes Investig. 2021;12(10):1919–1922. doi:10.1111/jdi.13549
38. Kwok A, Zvetkova I, Virtue S, et al. C-Terminal Truncation of Pik3r1 in Mice Models Human Lipodystrophic Insulin Resistance Uncoupled from Dyslipidemia. Cold Spring Harbor Laboratory; 2017.
39. Li S, Gao Y, Ma K, et al. Lipid-related protein NECTIN2 is an important marker in the progression of carotid atherosclerosis: an intersection of clinical and basic studies. J Transl Int Med. 2021;9(4):294–306. doi:10.2478/jtim-2021-0044
40. Jabbour R, Ott J, Eppel W, Frigo P. Carotid intima-media thickness in polycystic ovary syndrome and its association with hormone and lipid profiles. PLoS One. 2020;15(4):e0232299. doi:10.1371/journal.pone.0232299
41. Lauretta R, Lanzolla G, Vici P, Mariani L, Moretti C, Appetecchia M. Insulin-Sensitizers, Polycystic Ovary Syndrome and Gynaecological Cancer Risk. Int J Endocrinol. 2016;2016:8671762. doi:10.1155/2016/8671762
42. Katzendorn O, Peters I, Dubrowinskaja N, et al. DNA methylation of tumor associated calcium signal transducer 2 (TACSTD2) loci shows association with clinically aggressive renal cell cancers. BMC Cancer. 2021;21(1):444. doi:10.1186/s12885-021-08172-1
43. Bignotti E, Todeschini P, Calza S, et al. Trop-2 overexpression as an independent marker for poor overall survival in ovarian carcinoma patients. Eur J Cancer. 2010;46(5):944–953. doi:10.1016/j.ejca.2009.12.019
44. Carmina E, Lobo RA. Polycystic ovary syndrome (PCOS): arguably the most common endocrinopathy is associated with significant morbidity in women. J Clin Endocrinol Metab. 1999;84(6):1897–1899. doi:10.1210/jcem.84.6.5803
45. Zhu JL, Chen Z, Feng WJ, Long SL, Mo ZC. Sex hormone-binding globulin and polycystic ovary syndrome. Clin Chim Acta. 2019;499:142–148. doi:10.1016/j.cca.2019.09.010
46. Houtkooper RH, Vaz FM. Cardiolipin, the heart of mitochondrial metabolism. Cell Mol Life Sci. 2008;65(16):2493–2506. doi:10.1007/s00018-008-8030-5
47. Zhang L, Bell RJ, Kiebish MA, et al. A mathematical model for the determination of steady-state cardiolipin remodeling mechanisms using lipidomic data. PLoS One. 2011;6(6):e21170. doi:10.1371/journal.pone.0021170
48. Zhang L, Hu Y, An Y, Wang Q, Liu J, Wang G. The Changes of Lipidomic Profiles Reveal Therapeutic Effects of Exenatide in Patients With Type 2 Diabetes. Front Endocrinol (Lausanne). 2022;13:677202. doi:10.3389/fendo.2022.677202
49. Tang WH, Wang Z, Levison BS, et al. Intestinal microbial metabolism of phosphatidylcholine and cardiovascular risk. N Engl J Med. 2013;368(17):1575–1584. doi:10.1056/NEJMoa1109400
50. Wang B, Tontonoz P. Phospholipid Remodeling in Physiology and Disease. Annu Rev Physiol. 2019;81:165–188. doi:10.1146/annurev-physiol-020518-114444
51. Tanaka N, Matsubara T, Krausz KW, Patterson AD, Gonzalez FJ. Disruption of phospholipid and bile acid homeostasis in mice with nonalcoholic steatohepatitis. Hepatology. 2012;56(1):118–129. doi:10.1002/hep.25630
52. Yao Q, Zou X, Liu S, Wu H, Shen Q, Kang J. Oxidative Stress as a Contributor to Insulin Resistance in the Skeletal Muscles of Mice with Polycystic Ovary Syndrome. Int J Mol Sci. 2022;23:19.
53. Lucki NC, Sewer MB. The interplay between bioactive sphingolipids and steroid hormones. Steroids. 2010;75(6):390–399. doi:10.1016/j.steroids.2010.01.020
54. Baptiste CG, Battista MC, Trottier A, Baillargeon JP. Insulin and hyperandrogenism in women with polycystic ovary syndrome. J Steroid Biochem Mol Biol. 2010;122(1–3):42–52. doi:10.1016/j.jsbmb.2009.12.010
55. Chen X, Lu T, Wang X, et al. Metabolic alterations associated with polycystic ovary syndrome: a UPLC Q-Exactive based metabolomic study. Clin Chim Acta. 2020;502:280–286. doi:10.1016/j.cca.2019.11.016
56. Ban Y, Ran H, Chen Y, Ma L. Lipidomics analysis of human follicular fluid form normal-weight patients with polycystic ovary syndrome: a pilot study. J Ovarian Res. 2021;14(1):135. doi:10.1186/s13048-021-00885-y
57. Liu Q, Xie YJ, Qu LH, Zhang MX, Mo ZC. Dyslipidemia involvement in the development of polycystic ovary syndrome. Taiwan J Obstet Gynecol. 2019;58(4):447–453. doi:10.1016/j.tjog.2019.05.003
58. Dokras A, Saini S, Gibson-Helm M, Schulkin J, Cooney L, Teede H. Gaps in knowledge among physicians regarding diagnostic criteria and management of polycystic ovary syndrome. Fertil Steril. 2017;107(6):1380–1386.e1. doi:10.1016/j.fertnstert.2017.04.011
59. Yang Z, Fu H, Su H, et al. Multi-omics analyses reveal the specific changes in gut metagenome and serum metabolome of patients with polycystic ovary syndrome. Front Microbiol. 2022;13:1017147. doi:10.3389/fmicb.2022.1017147
60. Zhao R, Jiang Y, Zhao S, Zhao H. Multiomics Analysis Reveals Molecular Abnormalities in Granulosa Cells of Women With Polycystic Ovary Syndrome. Front Genet. 2021;12:648701. doi:10.3389/fgene.2021.648701
 © 2023 The Author(s). This work is published and licensed by Dove Medical Press Limited. The full terms of this license are available at https://www.dovepress.com/terms.php and incorporate the Creative Commons Attribution - Non Commercial (unported, v3.0) License.
By accessing the work you hereby accept the Terms. Non-commercial uses of the work are permitted without any further permission from Dove Medical Press Limited, provided the work is properly attributed. For permission for commercial use of this work, please see paragraphs 4.2 and 5 of our Terms.
© 2023 The Author(s). This work is published and licensed by Dove Medical Press Limited. The full terms of this license are available at https://www.dovepress.com/terms.php and incorporate the Creative Commons Attribution - Non Commercial (unported, v3.0) License.
By accessing the work you hereby accept the Terms. Non-commercial uses of the work are permitted without any further permission from Dove Medical Press Limited, provided the work is properly attributed. For permission for commercial use of this work, please see paragraphs 4.2 and 5 of our Terms.