")
Back to Journals » Diabetes, Metabolic Syndrome and Obesity » Volume 14
Analysis of Endocrine and Metabolic Indexes in Non-Obese Patients with Polycystic Ovary Syndrome and Its Compare with Obese Patients
Authors Shi W , Zhao Q, Zhao X, Xing C, He B
Received 19 July 2021
Accepted for publication 16 September 2021
Published 15 October 2021 Volume 2021:14 Pages 4275—4281
DOI https://doi.org/10.2147/DMSO.S329108
Checked for plagiarism Yes
Review by Single anonymous peer review
Peer reviewer comments 2
Editor who approved publication: Professor Ming-Hui Zou
Wenjing Shi, Qi Zhao, Xue Zhao, Chuan Xing, Bing He
Department of Endocrinology, Shengjing Hospital of China Medical University, Shenyang, People’s Republic of China
Correspondence: Bing He Email [email protected]
Purpose: To compare the endocrine and metabolic indexes of obese and normal body mass index (BMI) polycystic ovary syndrome (PCOS) patients, and explore factors affecting the pathogenesis and progression of PCOS.
Methods: This study included obese (n=79) and normal BMI (n=40) PCOS patients, and obese (n=30) and normal BMI (n=30) non-PCOS controls. Blood glucose, insulin (INS), blood lipids, sex hormones, and other metabolic and endocrine indicators were measured, and the correlations between the indicators were analyzed.
Results: HOMA-IR, 0min INS, 60min INS, 120min INS, 180min INS, FAI, TG, TC, LDL-C and sd-LDL in obese PCOS group were higher, while SHBG, LH, LH/FSH and HDL-C were lower than those in normal weight PCOS group (P < 0.05). 120min PBG, HOMA-IR, FAI, T, LH, LH/FSH, AMH, TC and LDL-C in obese PCOS group were higher than those in obese control group (P < 0.05). 0min PBG, 60min PBG, 120min PBG, 180min PBG, 0min INS, 60min INS, 120min INS, 180min INS, HOMA-IR, LH, LH/FSH and T in normal weight PCOS group were higher than those in normal weight control group (P < 0.05). In both normal weight group and obesity group, HOMA-IR entered the regression equation with FAI as dependent variable, and the absolute value of HOMA-IR standardized partial regression coefficient was higher than that of hs-CRP and AMH. In PCOS patients, FAI in the obese and non-obese PCOS groups was positively correlated with HOMA-IR.
Conclusion: Endocrine metabolic disorders in women with PCOS were more obvious than that in women with non-PCOS with matched BMI. The abnormality of glucose and lipid metabolism in obese PCOS patients is more serious than that in PCOS patients with normal BMI. Both obese and normal BMI PCOS patients were affected by hyperinsulinemia, and IR may play a key role in the pathogenesis and development of PCOS.
Keywords: polycystic ovary syndrome, insulin resistance, obesity, hyperandrogenemia, endocrine metabolism
Introduction
Polycystic ovary syndrome (PCOS), also known as Stein-Leventhal syndrome, was first proposed by Stein and Leventhal in 1935. It is the most common reproductive endocrine and metabolic disease in women of childbearing age, with a prevalence of 4–21%.1 The main clinical manifestations are long-term anovulation or oligoovulation, hyperandrogenemia, and polycystic changes to the ovaries. However, the etiology and pathogenesis of PCOS are unclear. Patel et al believe that PCOS is an autoimmune disease involving multiple genes, multiple factors, and lifestyle.2 More than half of PCOS patients are complicated with obesity, mainly abdominal, while non-obese PCOS patients account for only 30–50% of all patients.3 Women with PCOS have an increased risk of developing metabolic syndrome over the course of their lives. 43% of PCOS women were reported to have metabolic syndrome.4 Metabolic syndrome increases risk of obesity, dyslipidemia, insulin resistance [IR], type II diabetes mellitus, and cardiovascular disease.5 Many studies have confirmed that IR, glucose and lipid abnormalities, and other endocrine and metabolic disorders are common in obese PCOS patients.6 There are few studies on the metabolism of non-obese PCOS patients; however, existing clinical data have confirmed that non-obese PCOS patients also have abnormal glucose and lipid metabolism.7 By analyzing the differences in endocrine and metabolic indexes between obese and normal body mass index (BMI) PCOS patients, and a matched BMI control group, this study aimed to explore the related factors affecting the pathogenesis and progression of PCOS, and provide a basis for clinical treatment of PCOS patients.
Materials and Methods
Patients
Patients were selected from the outpatient clinic of the Shengjing Hospital of the China Medical University from April 2018 to October 2019. They were divided into the following four groups based on their PCOS and BMI statuses: obese PCOS patients (OP group, n=79), normal BMI PCOS patients (NP group, n=40), obese non-PCOS patients (ON group, n=30), and normal BMI non-PCOS patients (NN group, n= 30). The study was approved by the Ethics Committee of Shengjing Hospital of China Medical University, and informed consent was obtained from each patient.
Inclusion Criteria
All patients were at least 18 years of age. The obese group included patients with a BMI ≥28 kg/m2. The normal BMI group consisted of patients with BMIs between 18.5–23.9 kg/m2. PCOS diagnosis conformed to the Rotterdam PCOS diagnostic criteria in accordance with any two of the three following criteria: (1) oligoovulation or anovulation; (2) clinical and/or biochemical manifestations of hyperandrogen; and (3) polycystic ovary revealed by ultrasound.
Exclusion Criteria
Exclusion criteria included: (1) 17-hydroxyprogesterone >2 ng/mL; (2) clinically diagnosed type 2 diabetes mellitus; (3) ovulation disorders caused by other diseases; (4) complications including severe malnutrition or liver, kidney, and other primary diseases; (5) drug use that affected INS sensitivity in the past 3 months, regulated menstruation, or was for anti-anxiety; (6) smoking or alcoholism.
Research Methods
The participants’ medical history and family history of diabetes were collected, height and weight were measured, and BMI was calculated. Waist circumference, waist-to-hip ratio (WHR), and visceral fat area were measured by an InBody770 body fat meter (Biospace, Korea). All participants fasted for 12 h, then drank 300 mL water containing 75 g glucose within 5 min. Five milliliters of venous blood was then drawn at 30, 60, 120, and 180 min for the INS release test, and INS was measured by radioimmunoassay. Blood glucose was measured by the glucose oxidase method. The insulin resistance index (HOMA-IR, a common indicator used in the clinical evaluation of IR) was calculated from fasting INS (FINS) and fasting blood glucose (FBG) to evaluate the degree of IR with the following equation:

Blood lipids (cholesterol [TC], triglyceride [TG], high-density lipoprotein cholesterol [HDL-C], low-density lipoprotein cholesterol [LDL-C], small dense low-density lipoprotein cholesterol [sd-LDL]) were measured by the enzymatic method, and testosterone (T), sex hormone binding globulin (SHBG), luteinizing hormone (LH), follicle stimulating hormone (FSH), and anti-Mullerian hormone (AMH) were measured by chemiluminescence. The free androgen index (FAI) was used to determine the active androgen level using the equation:

Statistical Methods
Statistical package for social sciences 21.0 (SPSS Inc., Chicago, IL, USA) was used for statistical analyses. The measurement data were expressed by mean ± standard deviation. Correlation analyses were performed using Spearman correlation, normality tests were performed using the Kolmogorov–Smirnov test, multiple stepwise regression analysis was used in the regression analysis, bilateral tests were used in all statistical tests, and P <0.05 was regarded as statistically significant.
Results
Comparison of Body Composition and Anthropometric Indexes Between Groups
BMI, waist circumference, WHR, and visceral fat area in the obese PCOS group were higher than those in the normal BMI PCOS group. The differences were statistically significant (P <0.05) and are shown in Table 1.
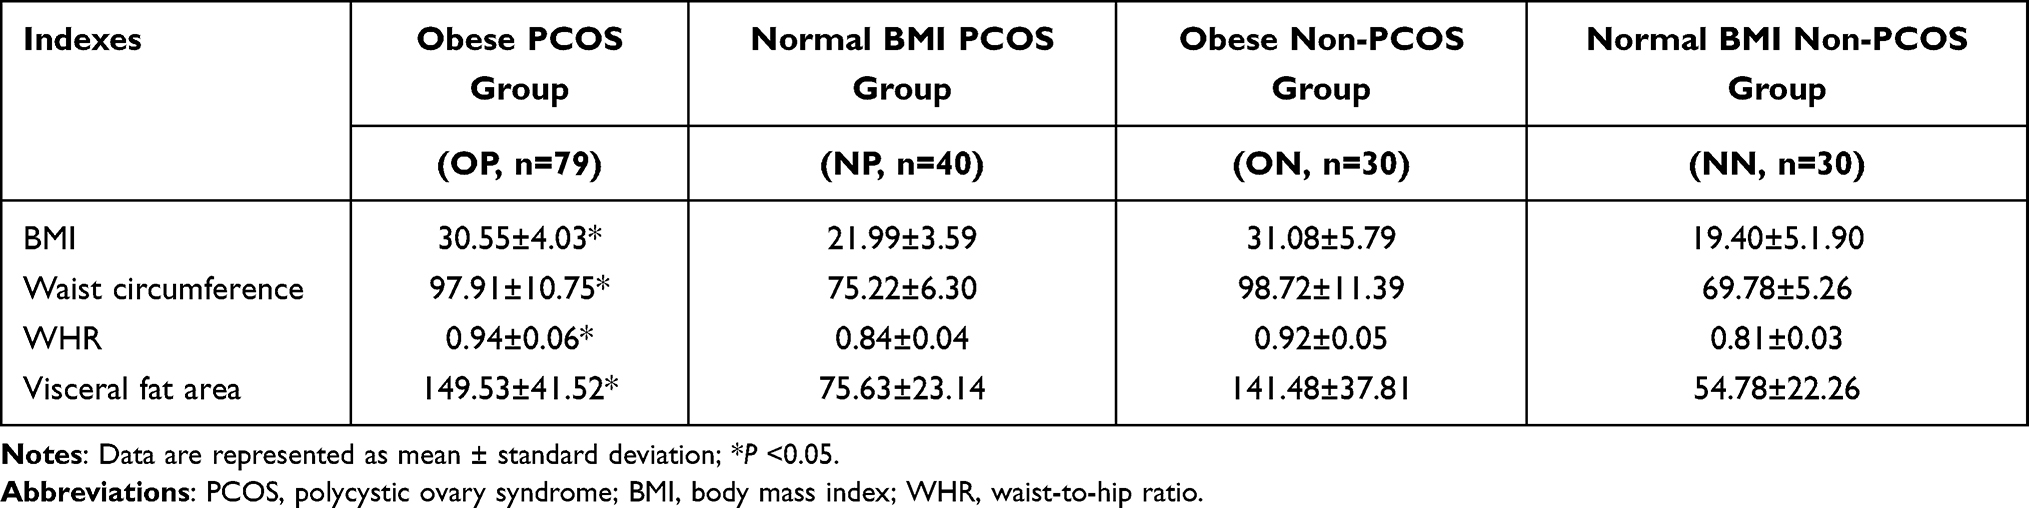 |
Table 1 Comparison of Anthropometric Indexes and Body Composition Between Groups |
Comparison of the Differences of Endocrine and Metabolic Indexes Between Groups
HOMA-IR, 0 min INS, 60 min INS, 120 min INS, 180 min INS, and FAI in the obese PCOS group were higher than those in the normal BMI PCOS group, while SHBG, LH, and LH/FSH were lower in the normal BMI PCOS group. 120 min postprandial blood glucose (PBG), HOMA-IR, FAI, T, LH, LH/FSH, and AMH in the obese PCOS group were higher than those in the obese control group. 0 min PBG, 60 min PBG, 120 min PBG, 180 min PBG, 0 min INS, 60 min INS, 120 min INS, 180 min INS, HOMA-IR, LH, LH/FSH, and T in the normal BMI PCOS group were higher than those in the normal BMI control group. The differences were statistically significant (P <0.05) and are shown in Tables 2 and 3.
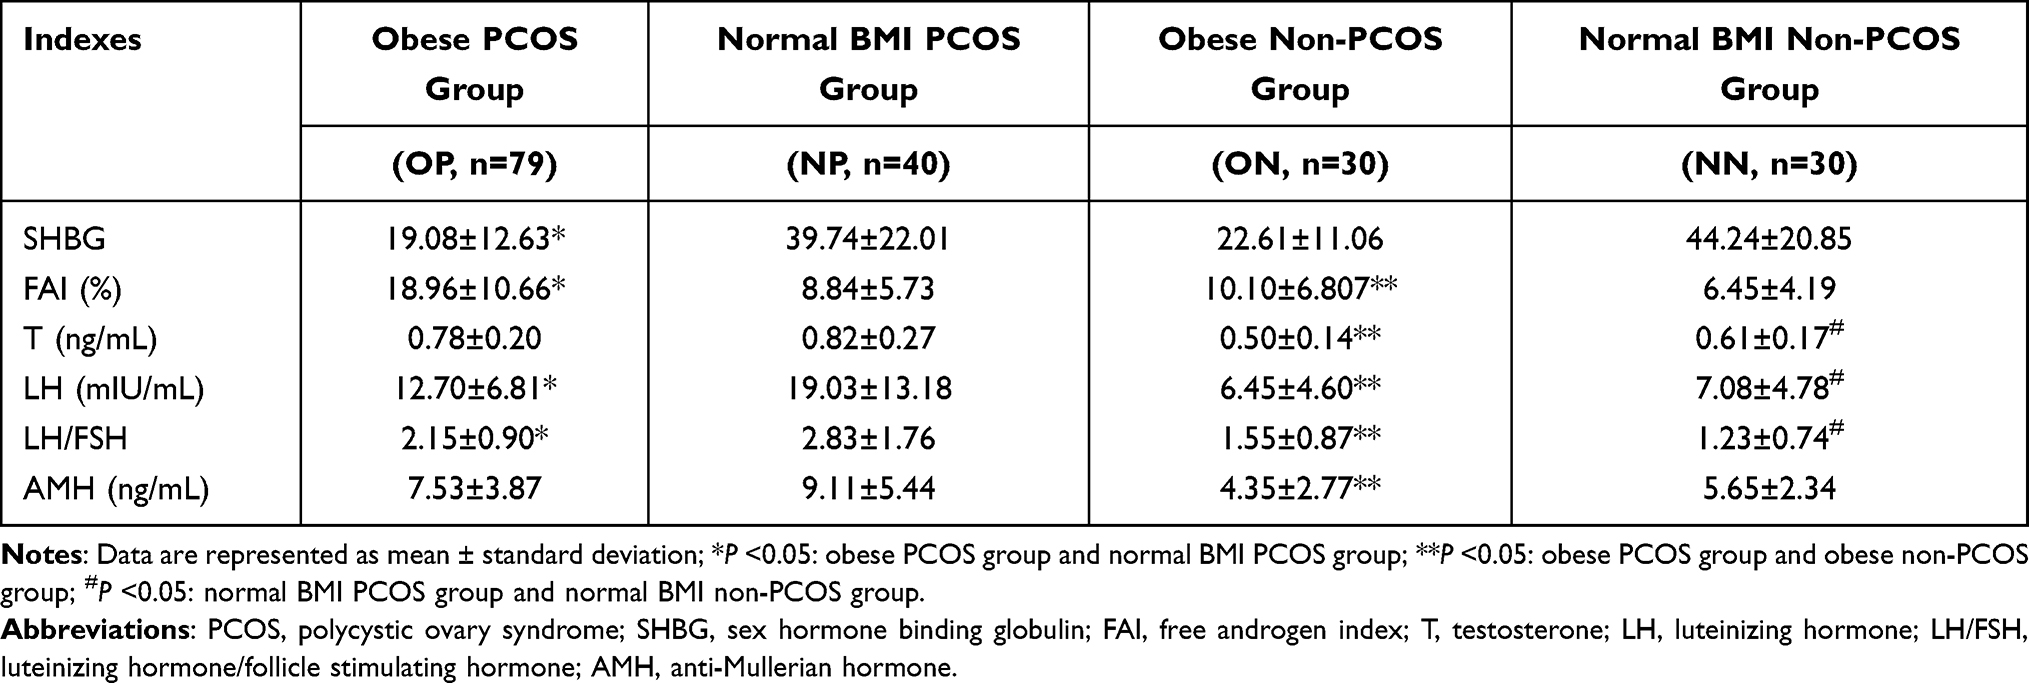 |
Table 2 Comparison of Sex Hormone Between Groups |
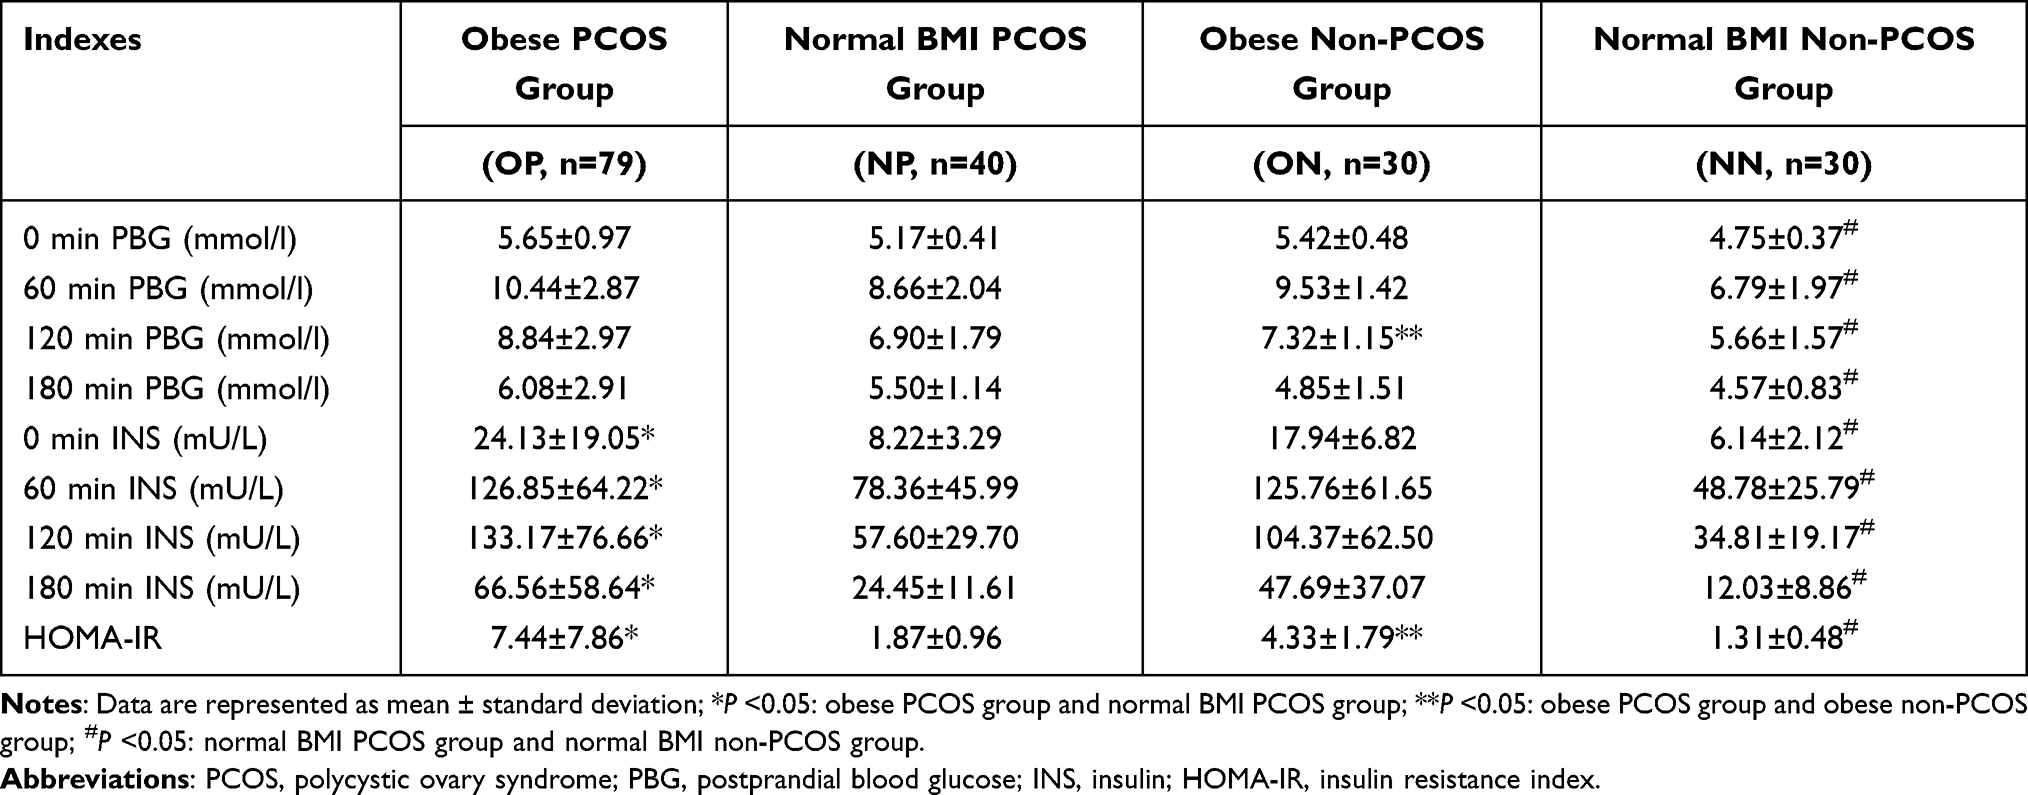 |
Table 3 Comparison of the Differences of Glucose Metabolic Indexes Between Groups |
Comparison of the Differences of Biochemical Indexes Between Groups
TG, TC, LDL-C, and sd-LDL in the obese PCOS group were higher than those in the normal BMI PCOS group, while HDL-C was lower than that in the normal BMI PCOS group. TC and LDL-C in the obese PCOS group were higher than those in the obese control group. The differences were statistically significant (P <0.05); however, there was no significant difference in blood lipid levels between the normal BMI groups (P >0.05). The data are shown in Table 4.
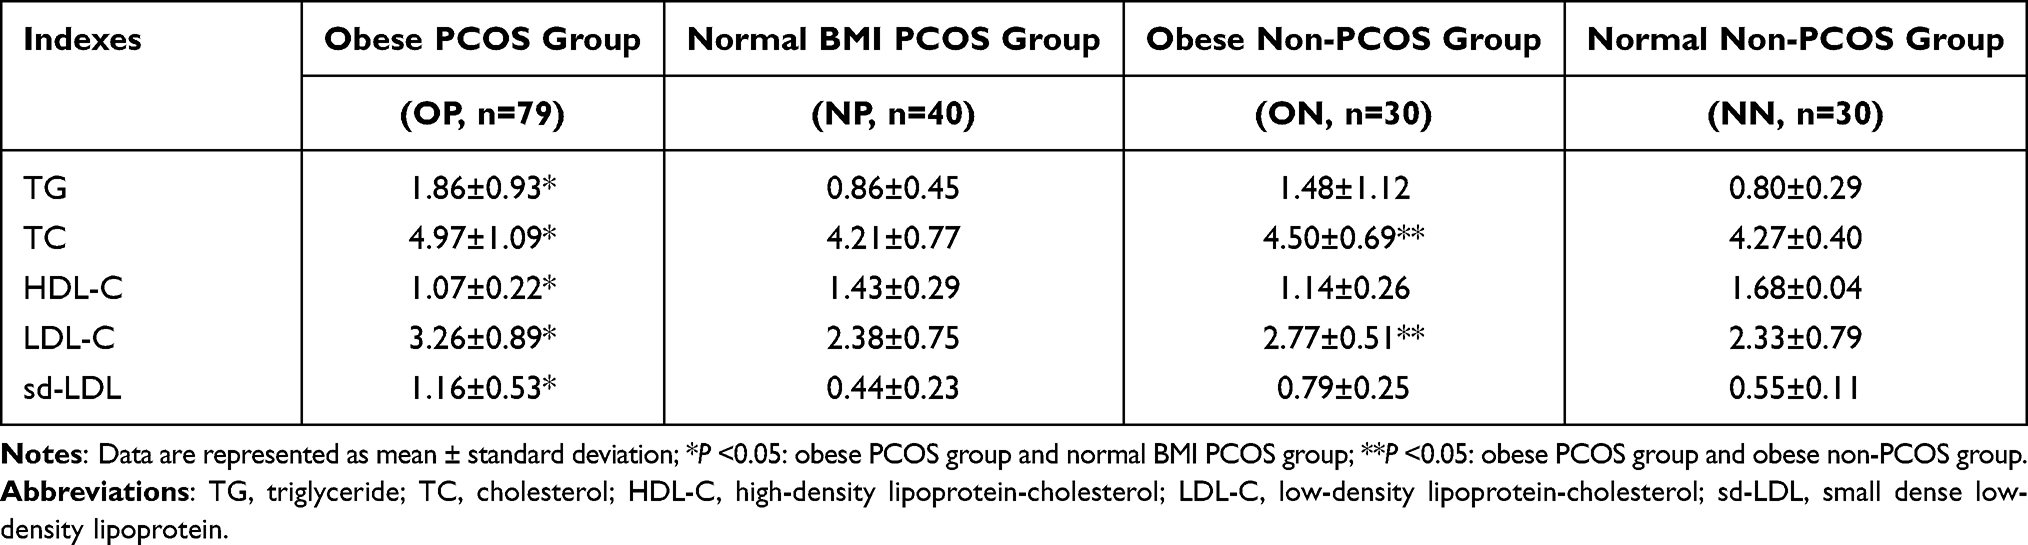 |
Table 4 Comparison of the Differences of Lipid Metabolic Indexes Between Groups |
Multiple Stepwise Regression Analysis Between the Normal BMI Group and the Obese Group
Multiple stepwise regression analysis was performed in the normal BMI group and the obese group with FAI as the dependent variable and hs-CRP, AMH, HOMA-IR, and LH/FSH as the independent variables. In the two normal BMI groups, AMH and HOMA-IR entered the regression equation (−0.745 × AMH + 4.777 × HOMA-IR = Y), and the discriminant coefficient R2 = 0.693. The absolute value of the HOMA-IR standardized partial regression coefficient (0.819) was greater than that of the AMH standardized partial regression coefficient (0.342). Hs-CRP, AMH, and HOMA-IR in the two obese groups entered the regression equation (−0.205–0.351 × hs-CRP + 0.353 × HOMA-IR = Y), and the discriminant coefficient R2 = 0.299. The absolute value of the HOMA-IR standardized partial regression coefficient (0.429) was greater than that of the hs-CRP standardized partial regression coefficient (−0.368).
Correlation Analysis Between FAI, T, HOMA-IR, LH, and LH/FSH
There was a positive correlation between FAI and HOMA-IR in the obese PCOS group and the normal BMI PCOS group, as shown in Tables 5 and 6.
 |
Table 5 Correlation Analysis of FAI and T and HOMA-IR, LH, and LH/FSH in the Obese PCOS Group |
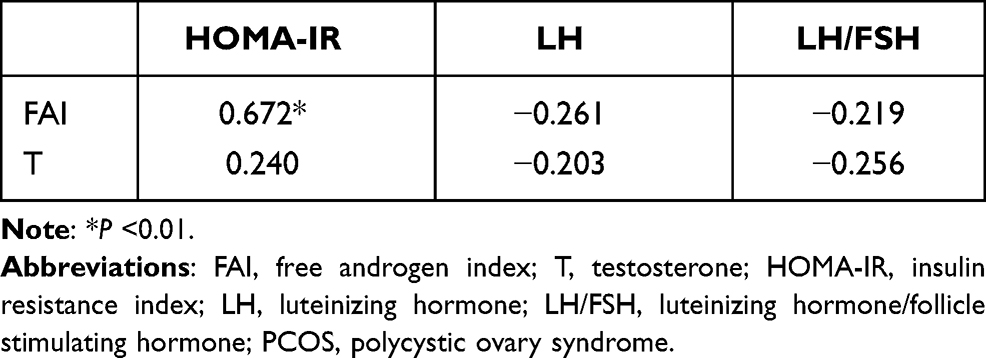 |
Table 6 Correlation Analysis of FAI and T and HOMA-IR, LH, and LH/FSH in the Normal BMI PCOS Group |
Correlation Analysis of Metabolic Indexes and BMI, Waist Circumference, and Visceral Fat Area in the Obese and Normal BMI PCOS Groups
BMI and waist circumference were positively correlated with TC, TG, sd-LDL, LDL-C, 0 min INS, 60 min INS, 120 min INS, and 180 min INS and negatively correlated with HDL-C. Visceral fat area was positively correlated with 120min INS and negatively correlated with HDL-C. The aforementioned correlations were all statistically significant (P <0.05) and are shown in Table 7.
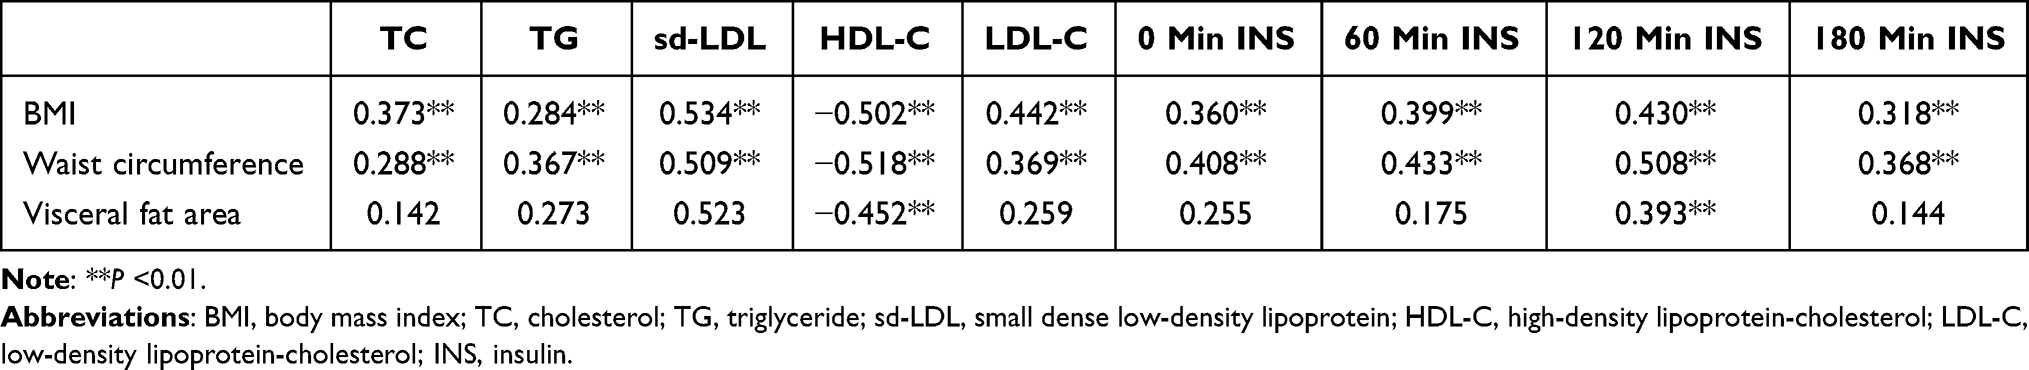 |
Table 7 Correlation Analysis Between Differential Metabolic Indexes and BMI, Waist Circumference, and Visceral Fat Area |
Correlation Analysis Between HOMA-IR and BMI, Waist Circumference, Visceral Fat Area, FAI, and SHBG in the Obese and Normal BMI PCOS Groups
HOMA-IR was positively correlated with BMI, waist circumference, visceral fat area, and FAI, and negatively correlated with SHBG, as shown in Table 8.
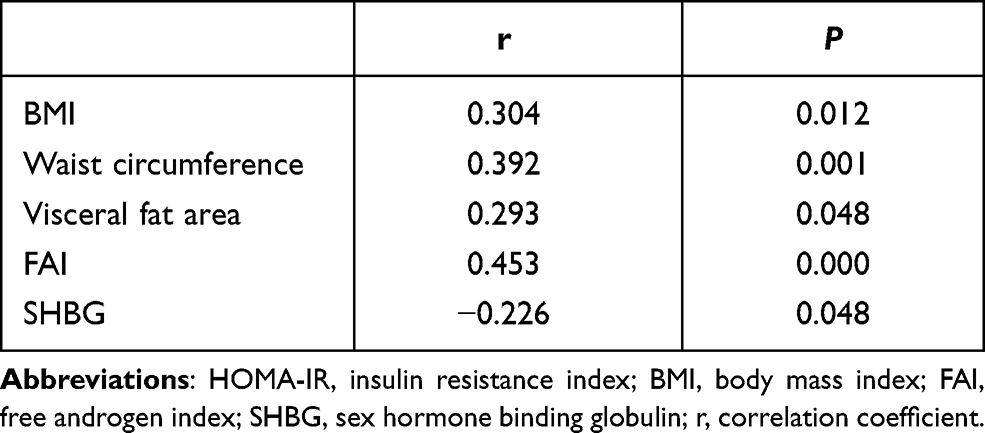 |
Table 8 Correlation Analysis Between HOMA-IR and BMI, Waist Circumference, Visceral Fat Area, FAI, and SHBG |
Discussion
We compared the differences of endocrine and metabolic indexes between obese and normal BMI PCOS patients and matched BMI controls. There were significant metabolic differences between the obese and normal BMI PCOS patients. Therefore, we further analyzed the correlation between differential metabolic indexes and the three obesity indexes, BMI, waist circumference, and visceral fat area in PCOS patients. We found that the correlation coefficients between waist circumference and differential metabolic indexes were the largest, followed by BMI and visceral fat area. BMI is commonly used to evaluate obesity; however, it is often affected by hydration status and body muscle rate. Therefore, we suggest that waist circumference may be a more suitable indicator when evaluating visceral fat accumulation and metabolic abnormalities in PCOS patients.
Obesity is a risk factor for abnormal lipid metabolism. The abnormal blood lipid profile of obese patients is characterized by the increase of TG, TC, and LDL-C, and the decrease of HDL-C.8 Our data showed that, compared to obese non-PCOS patients, obese PCOS patients had more serious lipid metabolism abnormalities, including higher levels of TG, TC, LDL-C, and sd-LDL, and lower levels of HDL-C, similar to the result reported by Pekka.9 High serum LDL-C levels in patients with PCOS may also be related to hyperinsulinemia and hyperandrogenism. The activity of lipoprotein lipase decreases when IR exists and reduces the clearance of LDL-C by the liver. In addition, testosterone can antagonize the ability of estrogen to stimulate the expression of LDL-C receptors in the liver, resulting in a decrease in liver LDL-C receptors and an increase in plasma LDL-C levels.10 Moreover, testosterone affects the catecholamine signal in adipocytes and increases the release of circulating non-esterified fatty acids that can synthesize TG in the liver; therefore, hyperandrogenism can also lead to an increase of TG in PCOS patients.11 Obesity also appears to alter the characteristics and severity of metabolic dysfunction in PCOS women, which may explain the metabolic heterogeneity in women with PCOS with metabolic syndrome. Lean women with PCOS more often exhibit symptoms consistent with hyperinsulinemia-driven pathophysiology compared to obese women without insulin resistance, who exhibit predominantly metabolic profile compatible with insulin resistance and are most likely associated with visceral obesity.12
IR is the basis of glucose and lipid metabolism disorders in PCOS patients. In our study, the HOMA-IR of obese PCOS patients was significantly higher than that of normal BMI PCOS patients. In addition, compared with obese non-PCOS patients, obese PCOS patients had more serious IR, characterized by a significant increase in FINS, a delayed peak in INS secretion, and a further compensatory increase. At the same time, we found that the HOMA-IR of normal BMI PCOS patients was significantly higher than that of the normal BMI control group. Therefore, the main cause of IR in PCOS patients may be obesity. However, there may also be non-obesity dependent mechanisms, such as the hyperphosphorylation of serine on insulin receptors, that may lead to IR.13 Studies have confirmed that 85% of PCOS patients have IR, including 95% of obese PCOS patients and 75% of non-obese PCOS patients.14
In the present study, there were significant differences in the levels of FAI and SHBG between the two PCOS groups. Obesity and hyperinsulinemia inhibit the secretion of SHBG in the liver, resulting in an increase in the concentration of free androgens.15 In addition, LH and LH/FSH in PCOS patients are higher than those in non-PCOS patients. Furthermore, hyperandrogenism in PCOS patients inhibits the feedback of estrogen and progesterone on LH pulse release, which contributes to abnormal LH secretion and an increased LH/FSH ratio.16 In this study, levels of LH and LH/FSH in normal BMI PCOS patients were significantly higher than those in obese PCOS patients, and that LH and LH/FSH were negatively correlated with FAI, consistent with results reported by Zhao et al.17 LH levels are affected by obesity, possibly because of the high level of aromatase in obese adipose tissue that promotes the transformation of androgen to estrogen, resulting in a decrease in pituitary responsiveness to GnRH and the inhibition of LH release.18
As one of the diagnostic criteria for PCOS, hyperandrogenemia plays an important role in its development and pathogenesis. Based on the results of the multiple stepwise regression analysis, it can be speculated that chronic inflammation and IR are independent risk factors of hyperandrogen in obese patients, while AMH and IR are independent risk factors of hyperandrogen in patients with normal BMIs. Furthermore, the effect of IR on androgen level may be greater than that of chronic inflammation and AMH. While some researchers believe that androgen induces hyperinsulinemia, the more prevalent theory is that hyperinsulinemia may be the initiating factor of PCOS hyperandrogenism.19
In order to explore the effect of IR and pituitary hormone disorder on the progression of PCOS, we analyzed the correlation between FAI, T, HOMA-IR, LH, and LH/FSH in PCOS patients and found that only HOMA-IR and FAI were significantly positively correlated. Hyperinsulinemia acts directly on the INS receptors on ovarian theca cells, affecting follicular development. IR selectively affects tissue energy metabolism, increases the sensitivity of ovarian theca cells to LH response, and induces cytochrome P450 synergism to increase androgen synthesis and secretion.20 At the same time, the increase of INS inhibits the synthesis of SHBG in the liver, further increasing the level of free androgens, and abnormal androgen levels in the body can also aggravate IR. Under the action of hyperandrogen, muscle utilization of INS-mediated glucose is significantly reduced, thus reducing insulin sensitivity and aggravating IR. Furthermore, androgens can also increase the conversion rate of free fatty acids and indirectly induce IR in muscle tissue.21
Conclusion
Endocrine metabolic disorders in women with PCOS were more obvious than that in women with non-PCOS with matched BMI. The abnormality of glucose and lipid metabolism in obese PCOS patients is more serious than that in PCOS patients with normal BMI, which may be related to obesity, especially abdominal fat accumulation. Both obese and normal BMI PCOS patients were affected by hyperinsulinemia, and IR may play a key role in the pathogenesis and development of PCOS. Therefore, reducing obesity and insulin resistance are important measures for the treatment of PCOS.
Data Sharing Statement
The datasets generated during and/or analysed during the current study are available from the corresponding author on reasonable request.
Ethics Approval
All procedures performed in studies involving human participants were in accordance with the ethical standards of the institutional and/or national research committee and with the 1964 Helsinki declaration and its later amendments or comparable ethical standards.
Author Contributions
All authors made a significant contribution to the work reported, whether that is in the conception, study design, execution, acquisition of data, analysis and interpretation, or in all these areas; took part in drafting, revising or critically reviewing the article; gave final approval of the version to be published; have agreed on the journal to which the article has been submitted; and agree to be accountable for all aspects of the work.
Funding
National Natural Science Foundation of China, Grant Number:81570765.
Disclosure
The authors report no conflicts of interest.
References
1. Delcour C, Robin G, Young J, Dewailly D. PCOS and hyperprolactinemia: what do we know in 2019? Clin Med Insights Reprod Health. 2019;13:1179558119871921. doi:10.1177/1179558119871921
2. Patel S. Polycystic ovary syndrome (PCOS), an inflammatory, systemic, lifestyle endocrinopathy. J Steroid Biochem Mol Biol. 2018;182:
3. González F. Nutrient-induced inflammation in polycystic ovary syndrome: rolein the development of metabolic aberration and ovarian dysfunction. Semin Reprod Med. 2015;33(4):276–286. doi:10.1055/s-0035-1554918
4. Apridonidze T, Essah PA, Iuorno MJ, Nestler JE. Prevalence and characteristics of the metabolic syndrome in women with polycystic ovary syndrome. J Clin Endocrinol Metab. 2005;90(4):1929–1935. doi:10.1210/jc.2004-1045
5. Akbarzadeh M, Naderi T, Dabbaghmanesh MH. The glucose metabolism disorder and dyslipidemia among girls with different phenotype polycystic ovary syndrome. J Res Med Sci. 2019;24:72. doi:10.4103/jrms.JRMS_804_16
6. Dumesic DA, Oberfield SE, Stener-Victorin E, Marshall JC, Laven JS, Legro RS. Scientific statement on the diagnostic criteria, epidemiology, pathophysiology, and molecular genetics of polycystic ovary syndrome. Endocr Rev. 2015;36(5):487–525. doi:10.1210/er.2015-1018
7. Satyaraddi A, Cherian KE, Kapoor N, et al. Body composition, metabolic characteristics, and insulin resistance in obese and nonobese women with polycystic ovary syndrome. J Hum Reprod Sci. 2019;12(2):78–84. doi:10.4103/jhrs.JHRS_2_19
8. Durmus U, Duran C, Ecirli S. Visceral adiposity index levels in overweight and/or obese, and non‑obese patients with polycystic ovary syndrome and its relationship with metabolic and inflammatory parameters. J Endocrinol Invest. 2017;40(5):487–497. doi:10.1007/s40618-016-0582-x
9. Pinola P, Puukka K, Piltonen TT, et al. Normo- and hyperandrogenic women with polycystic ovary syndrome exhibit an adverse metabolic profile through life. Fertil Steril. 2017;107(3):788–795. doi:10.1016/j.fertnstert.2016.12.017
10. Feingold K, Brinton EA, Grunfeld C, et al. The Effect of Endocrine Disorders on Lipids and Lipoproteins. Endotext [Internet]. Bookshelf ID: NBK409608. South Dartmouth (MA): MDText.com, Inc.; 2000.
11. Li SX, Chu QQ, Ma J, et al. Discovery of novel lipid profiles in PCOS: do insulin and androgen oppositely regulate bioactive lipid production? J Clin Endocrinol Metab. 2017;102(3):810–821. doi:10.1210/jc.2016-2692
12. Escobar-Morreale HF, Samino S, Insenser M, et al. Metabolic heterogeneity in polycys-tic ovary syndrome is determined by obesity: plasma metabolomic approach using gcms. Clin Chem. 2012;58(6):999–1009. doi:10.1373/clinchem.2011.176396
13. Palomba S, Santagni S, Falbo A, Sala GBL. Complications and challenges associated with polycystic ovary syndrome: current perspectives. Int J Women Health. 2015;31(7):745–763. doi:10.2147/IJWH.S70314
14. Stepto NK, Cassar S, Joham AE, et al. Women with polycystic ovary syndrome have intrinsic insulin resistance on euglycaemic-hyperinsulaemic clamp. Hum Reprod. 2013;28(3):777–784. doi:10.1093/humrep/des463
15. Fenske B, Kische H, Gross S, et al. Endogenous androgens and sex hormone–binding globulin in women and risk of metabolic syndrome and type 2 diabetes. J Clin Endocrinol Metab. 2015;100:4595–4603. doi:10.1210/jc.2015-2546
16. Tola H, Abbas M, Alhassan EA, Shrif NE, Rida M. Assessment of the role of the anti-mullerian hormone, luteinizing hormone/follicle stimulating hormone ratio in the diagnosis of polycystic ovary syndrome in Sudanese women. Open Access Maced J Med Sci. 2018;6(7):1244–1247. doi:10.3889/oamjms.2018.260
17. Zhao Y, Ruan X, Mueck AO. Clinical and laboratory indicators of polycystic ovary syndrome in Chinese Han nationality with different Rotterdam criteria -based phenotypes. Gynecol Endocrinol. 2016;32(2):151–156. doi:10.3109/09513590.2015.1107895
18. Shea JL, Wong PY, Chen Y. Free testosterone: clinical utility and important analytical aspects of measurement. Adv Clin Chem. 2014;63(47):59–84. doi:10.1016/b978-0-12-800094-6.00002-9
19. Martens JW, Geller DH, Arlt W, et al. Enzymatic activities of P450c17 stably expressed in fibroblasts from patients with the polycystic ovary syndrome. J Clin Endocrinol Metab. 2000;85(11):4338–4346. doi:10.1210/jcem.85.11.6971
20. Bremer AA, Miller WL. The serine phosphorylation hypothesis of polycystic ovary syndrome: a unifying mechanism for hyperandrogenemia and insulin resistance. Fertil Steril. 2008;89(5):1039–1048. doi:10.1016/j.fertnstert.2008.02.091
21. Velija-Ašimi Z. Evaluation of the association of vitamin D deficiency with gonadotropins and sex hormone in obese and non-obese women with polycystic ovary syndrome. Med Glas. 2014;11(1):170–176. PMID: 24496360.
 © 2021 The Author(s). This work is published and licensed by Dove Medical Press Limited. The full terms of this license are available at https://www.dovepress.com/terms.php and incorporate the Creative Commons Attribution - Non Commercial (unported, v3.0) License.
By accessing the work you hereby accept the Terms. Non-commercial uses of the work are permitted without any further permission from Dove Medical Press Limited, provided the work is properly attributed. For permission for commercial use of this work, please see paragraphs 4.2 and 5 of our Terms.
© 2021 The Author(s). This work is published and licensed by Dove Medical Press Limited. The full terms of this license are available at https://www.dovepress.com/terms.php and incorporate the Creative Commons Attribution - Non Commercial (unported, v3.0) License.
By accessing the work you hereby accept the Terms. Non-commercial uses of the work are permitted without any further permission from Dove Medical Press Limited, provided the work is properly attributed. For permission for commercial use of this work, please see paragraphs 4.2 and 5 of our Terms.